Abstract
Malignant transformation typically involves multiple genetic lesions whose combined activity gives rise to cancer1. Our analysis of 1,148 patient-derived B-cell leukemia (B-ALL) samples revealed that individual mutations did not promote leukemogenesis unless they converged on one single oncogenic pathway characteristic for the differentiation stage of transformed B cells. Mutations not aligned with the central oncogenic driver activated divergent pathways and subverted transformation. Oncogenic lesions in B-ALL frequently mimic cytokine receptor signaling at the pro-B cell stage (through activation of STAT5)2–4 or the pre-B cell receptor in more mature cells (through activation of ERK)5–8. STAT5- and ERK-activating lesions were frequently found but only co-occurred in ~3% of cases (P=2.2E-16). Single-cell mutation and phosphoprotein analyses revealed the segregation of oncogenic STAT5- or ERK-activation to competing clones. STAT5 and ERK engaged opposing biochemical and transcriptional programs orchestrated by MYC and BCL6, respectively. Genetic reactivation of the divergent (suppressed) pathway came at the expense of the principal oncogenic driver and reversed transformation. Conversely, deletion of divergent pathway components accelerated leukemogenesis. Thus, persistence of divergent signaling pathways represents a powerful barrier to transformation while convergence on one principal driver defines a central event in leukemia-initiation. Pharmacological reactivation of suppressed divergent circuits strongly synergized with inhibition of the principal oncogenic driver. Hence, reactivation of divergent pathways can be leveraged as a previously unrecognized strategy to deepen treatment responses.
During early B-cell development, cytokine receptors (e.g. IL7R, CRLF2) initiate survival signals by JAK2 and STAT5 phosphorylation2,3. After productive rearrangement of immunoglobulin V region genes and expression of a pre-B cell receptor (pre-BCR), survival and proliferation signals involve the pre-B cell linker BLNK and phosphorylation of ERK kinases9. STAT5- and ERK-mediated survival signals are frequently mimicked by transforming oncogenes in B-cell acute lymphoblastic leukemia (B-ALL). Lesions in cytokine receptor genes (IL7R, CRLF2, EPOR, PDGFRA, PDGFRB) and cytokine receptor-associated JAK (JAK1, JAK2, JAK3) and ABL1 tyrosine kinases (BCR-ABL1) mimic constitutively active cytokine receptors via STAT5 phosphorylation. Activating lesions of RAS-pathway genes (NRAS, KRAS, PTPN11, NF1 and BRAF)6 cause oncogenic ERK signaling, a functional mimic of pre-BCR-signaling5,8. Malignant transformation typically involves cooperation of multiple genetic lesions1, suggesting that adding oncogenic drivers to existing mutations would accelerate tumor progression. However, loss of PTEN (resulting in hyperactivated PI3K signaling) was synthetic lethal in BCR-ABL1 and NRASG12D-driven B-ALL10. Likewise, functionally normal epithelial cells carrying high mutation burdens give rise to overt squamous cell carcinomas11 only after reduction to a small set of oncogenic drivers. Here we studied the interaction of oncogenic drivers in STAT5- and ERK-pathways during normal B-cell development and malignant B-cell transformation.
STAT5- and ERK-activation is segregated
Studying genetic lesions in 1,148 B-ALL cases (Supplementary Tables 1–4), we found STAT5-activating lesions in 360 (31.4%) and ERK-activating lesions in 386 cases (33.6%; Supplementary Table 1). Concurrent activation of STAT5 and ERK occurs less frequently in B-ALL than expected by chance (3%; odds ratio 0.13; P=2.2e-16; Extended Data Figure 1a). Mutual exclusivity of mutations could reflect functional redundancy rather than antagonism. Unsupervised analysis of mutational co-occurrence between all lesion pairs revealed overall significantly stronger exclusivity between inter-pathway lesions compared to intra-pathway lesions (Extended Data Figures 1b–c). Concurrent mutation of multiple drivers is counter-selected regardless of pathway, but the observed STAT5-ERK pathway co-occurrence is significantly less frequent (P=0.014) and supported by significantly lower log odds ratios for inter- vs intra-pathway driver combinations (P=0.001; Extended Data Figure 1d–e). STAT5- and ERK-pathway lesions are common in acute myeloid leukemia (AML). However, mutual exclusivity of inter-pathway pairs was not significantly stronger than that observed between intra-pathway drivers in AML (P=0.63; Extended Data Figures 1f–j; Supplementary Table 2). Hence, while STAT5- and ERK-activating mutations are frequent in B-ALL and AML, driver mutations in the two pathways are strongly segregated in B-ALL but not AML.
Studying biochemical pathway activation, an inverse relationship between STAT5-pY694 and ERK-pT202/Y204 in B-ALL patient-derived xenografts (PDX) was confirmed by Western blotting (Supplementary Table 5; Fig. 1a). Intermittent treatment of Ph+ B-ALL cells with the tyrosine kinase inhibitor ponatinib for suppression of STAT5-signaling resulted in gradual development of ponatinib-resistance over three weeks in 4 of 8 cases. Two of the ponatinib-resistant cases (TXL3 and BLQ5) lost STAT5-activity and acquired de novo ERK phosphorylation (Fig. 1b). Consistent with ponatinib-resistance and a switch from STAT5- to ERK-phosphorylation, TXL3 and BLQ5 cells acquired sensitivity to trametinib (a small molecule inhibitor of MAP2K1/2; Fig. 1c).
Figure 1: Segregation of STAT5- and ERK-activation in human B-ALL.
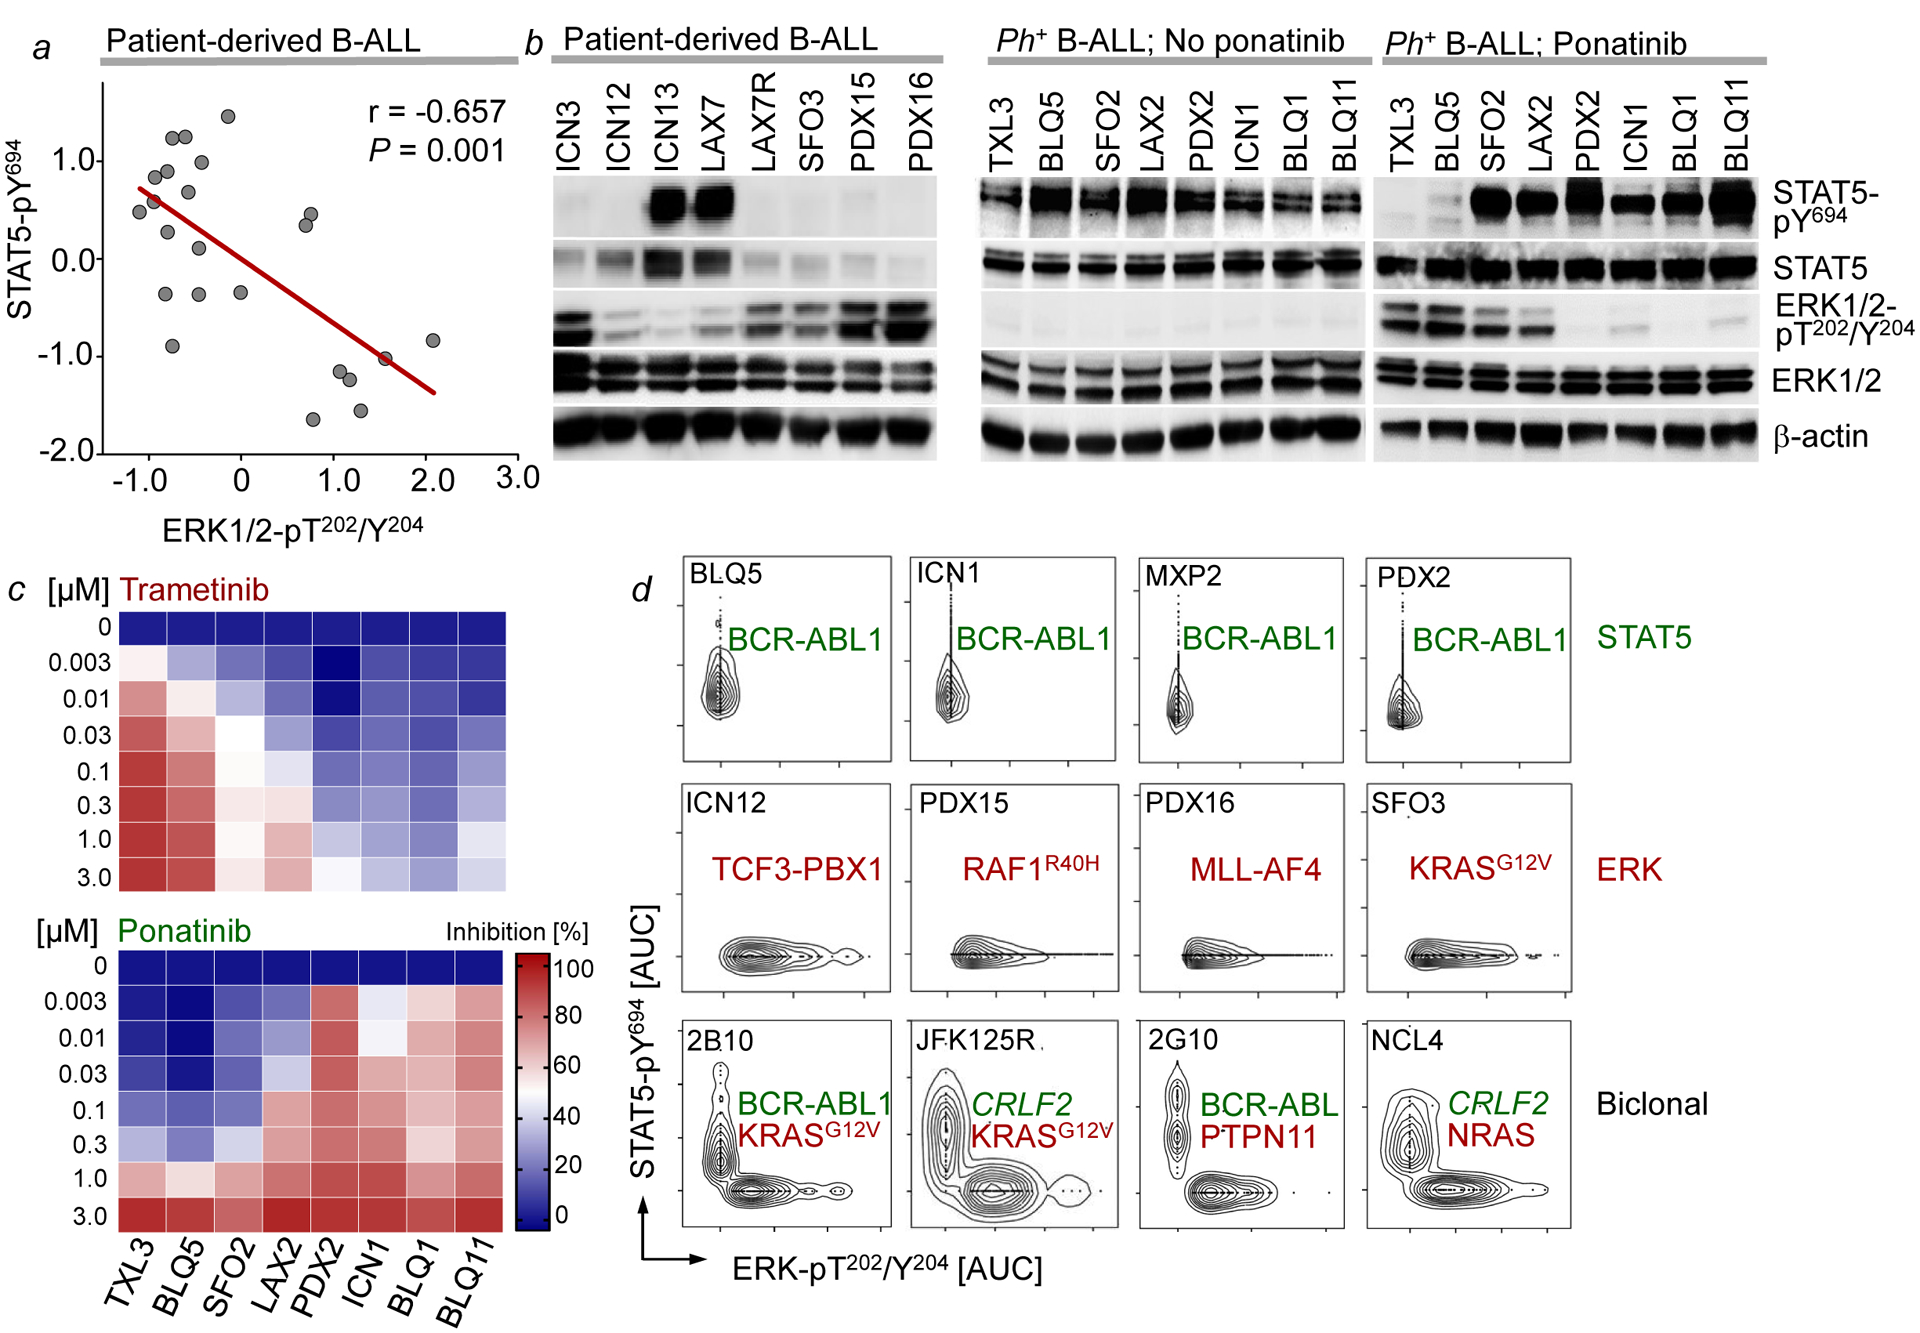
a, Correlation between ERK-pT202/Y204 and STAT5-pY694 levels in B-ALL cells (n=23 independent biological samples; P=0.001, two-tailed t-test; r=−0.657, Pearson r). b, Western blots of patient-derived B-ALL cells (n=8, left), Ph+ B-ALL cells before (n=8, middle) and after ponatinib treatment (n=8, right). c, Single-cell phosphoprotein analysis of patient-derived B-ALL samples (n=3 independent experiments). d, Patient-derived Ph+ B-ALL cells treated with trametinib or ponatinib. Growth inhibition (%) shown (means of 3 independent experiments). For gel source data, see Supplementary Fig. 1.
To test whether STAT5- and ERK-activating mutations in rare cases with dual pathway activation co-occurred in the same cells, we performed single-cell amplicon sequencing (Supplementary Table 4). NSG mice (n=30) bearing 9 Ph+ B-ALL (STAT5-driven) PDX were treated with ponatinib. After initial remission, 24 mice relapsed with additional STAT5- or ERK-activating lesions that reversed ponatinib-sensitivity (Supplementary Table 3). STAT5- and ERK-activating lesions were found concurrently in 3 of the resistant cases (Supplementary Tables 3–4). We selected these 3 PDX (1F10, 2B10, 2G10) for single-cell amplicon sequencing. STAT5- (ABL1) and ERK- (PTPN11, KRAS) activating mutations were amplified individually from single sorted B-ALL cells. However, mutant ABL1 alleles were only co-amplified with wildtype KRAS and PTPN11 and vice versa (Supplementary Table 4), suggesting that these mutations were segregated to distinct clones. We then performed single-cell phosphoprotein analyses for STAT5-pY694 and ERK-pT202/Y204. Consistent with segregation of oncogenic STAT5- and ERK-signaling, STAT5- and ERK-phosphorylation was mutually exclusive in most cases. In four cases, we found biclonal disease with STAT5- and ERK-phosphorylation confined to competing clones (Fig. 1d; Extended Data Figure 2). The small number (~2%) of concurrent phosphorylation events was in line with the low frequency of two cells being loaded and analyzed in the same well.
STAT5 and ERK define B cell development
Activation of STAT5 (downstream of cytokine receptors in pro-B cells) and ERK (downstream of the pre-BCR in pre-B cells) are linked to distinct stages of early B-cell development separated by rearrangement of immunoglobulin heavy (Ig-HC) and light chain (Ig-LC) genes3,12–14. Although aberrant RAG1/RAG2-mediated recombinase activity in B-ALL cells15 can randomly target Ig-LC loci, we observed a significant association between STAT5-driven B-ALL and germline configuration on one, and ERK-driven B-ALL and rearranged Ig-LC loci on the other hand (P=0.002; Supplementary Table 6). These findings suggest a link between STAT5- and ERK-activating lesions in B-ALL cells and cellular origins from distinct B-cell developmental stages. Analyzing B-ALL PDX and B-ALL mouse models by flow cytometry, we corroborated the association between oncogenic STAT5-signaling and pro-B cell, while ERK-driver lesions were associated with a pre-B cell phenotype (Extended Data Figure 3–4).
Developmental rewiring from STAT5 to ERK
Analysis of overall and relapse-free survival of STAT5-driven (n=26) and ERK-driven (n=67) B-ALL patients (COG P9906) showed that high expression levels of IGLV and IGHM predicted favorable outcomes in STAT5-driven B-ALL patients, but poor clinical outcomes ERK-driven B-ALL patients (Extended Data Figure 4b). Developmental rewiring at the pre-BCR checkpoint affects permissiveness to oncogenic STAT5 or ERK signaling. While pro-B cells were permissive to BCR-ABL1 (STAT5), activation of ERK by the pre-BCR mimic LMP2A7 induced cellular senescence and cell death. Conversely, pre-B cells were permissive to transformation by LMP2A (ERK) while BCR-ABL1 induced cell death and senescence (Extended Data Figure 5h–o). BCR-ABL1 is a frequent oncogenic driver in B-ALL but never found in B-cell malignancies past the pre-BCR checkpoint. Likewise, the Epstein-Barr virus (EBV)-encoded oncoprotein LMP2A mimicks pre-BCR signaling7 and functions as an oncogenic driver in mature B-cell malignancies while EBV+ B-ALL is exceedingly rare.
MYC and BCL6 downstream of STAT5 and ERK
Since STAT5- and ERK-lesions were associated with pro-B and pre-B cell phenotypes, respectively, we studied activation of the two pathways at the pro-B to pre-B cell transition. Single cell phosphoprotein analysis in sorted bone marrow pro-B cell and pre-B cell/immature B-cell populations showed that Stat5 activation at pro-B cell stages was terminated at the pre-BCR checkpoint and replaced by Erk activation in more mature B-cell subsets (Fig. 2a). While Stat5-signaling transcriptionally activates Myc and suppresses Bcl613, Erk-activity at the pre-BCR checkpoint induced Myc downregulation with concurrent upregulation of Bcl614. Studying B-cell differentiation in a B-cell-specific Myc-eGFP x Bcl6-mCherry double reporter knockin mouse model showed a similar transition from Myc+ Bcl6− pro-B to Myc− Bcl6+ pre-B stages. Cytokine-dependent pro-B and early pre-B cells (Hardy fractions B-C’) included double-negative and Myc-expressing cells, while BCR-dependent B-cells (Hardy fractions E-F) expressed almost exclusively Bcl6 (Fig. 2b). Late pre-B cells (Fraction D) that already downregulated cytokine receptors but still undergo Ig-LC gene rearrangement mark the intersection between Myc+ Bcl6− to Myc− Bcl6+ stages and express neither Myc nor Bcl6 (Fig. 2b). Functional Ig-HC expression in pro-B cells induced the pro-B to pre-B cell transition, leading to Ig-LC gene rearrangement and surface expression (Fig. 2c). NRASG12D activation recapitulated the pro-B to pre-B cell transition to induce Ig-LC surface expression (Fig. 2c). Induction of pro-B to pre-B-cell transition (Ig-HC expression or activation of oncogenic Erk signaling), resulted in a switch from Myc+ Bcl6− pro-B cell to Myc− Bcl6+ pre-B cell stage (Fig. 2d). Thus, activation of BCL6 at the expense of MYC is a determinant of the pro-B to pre-B cell transition.
Figure 2: STAT5-MYC and ERK-BCL6 signaling are incompatible and define distinct stages of B cell development.
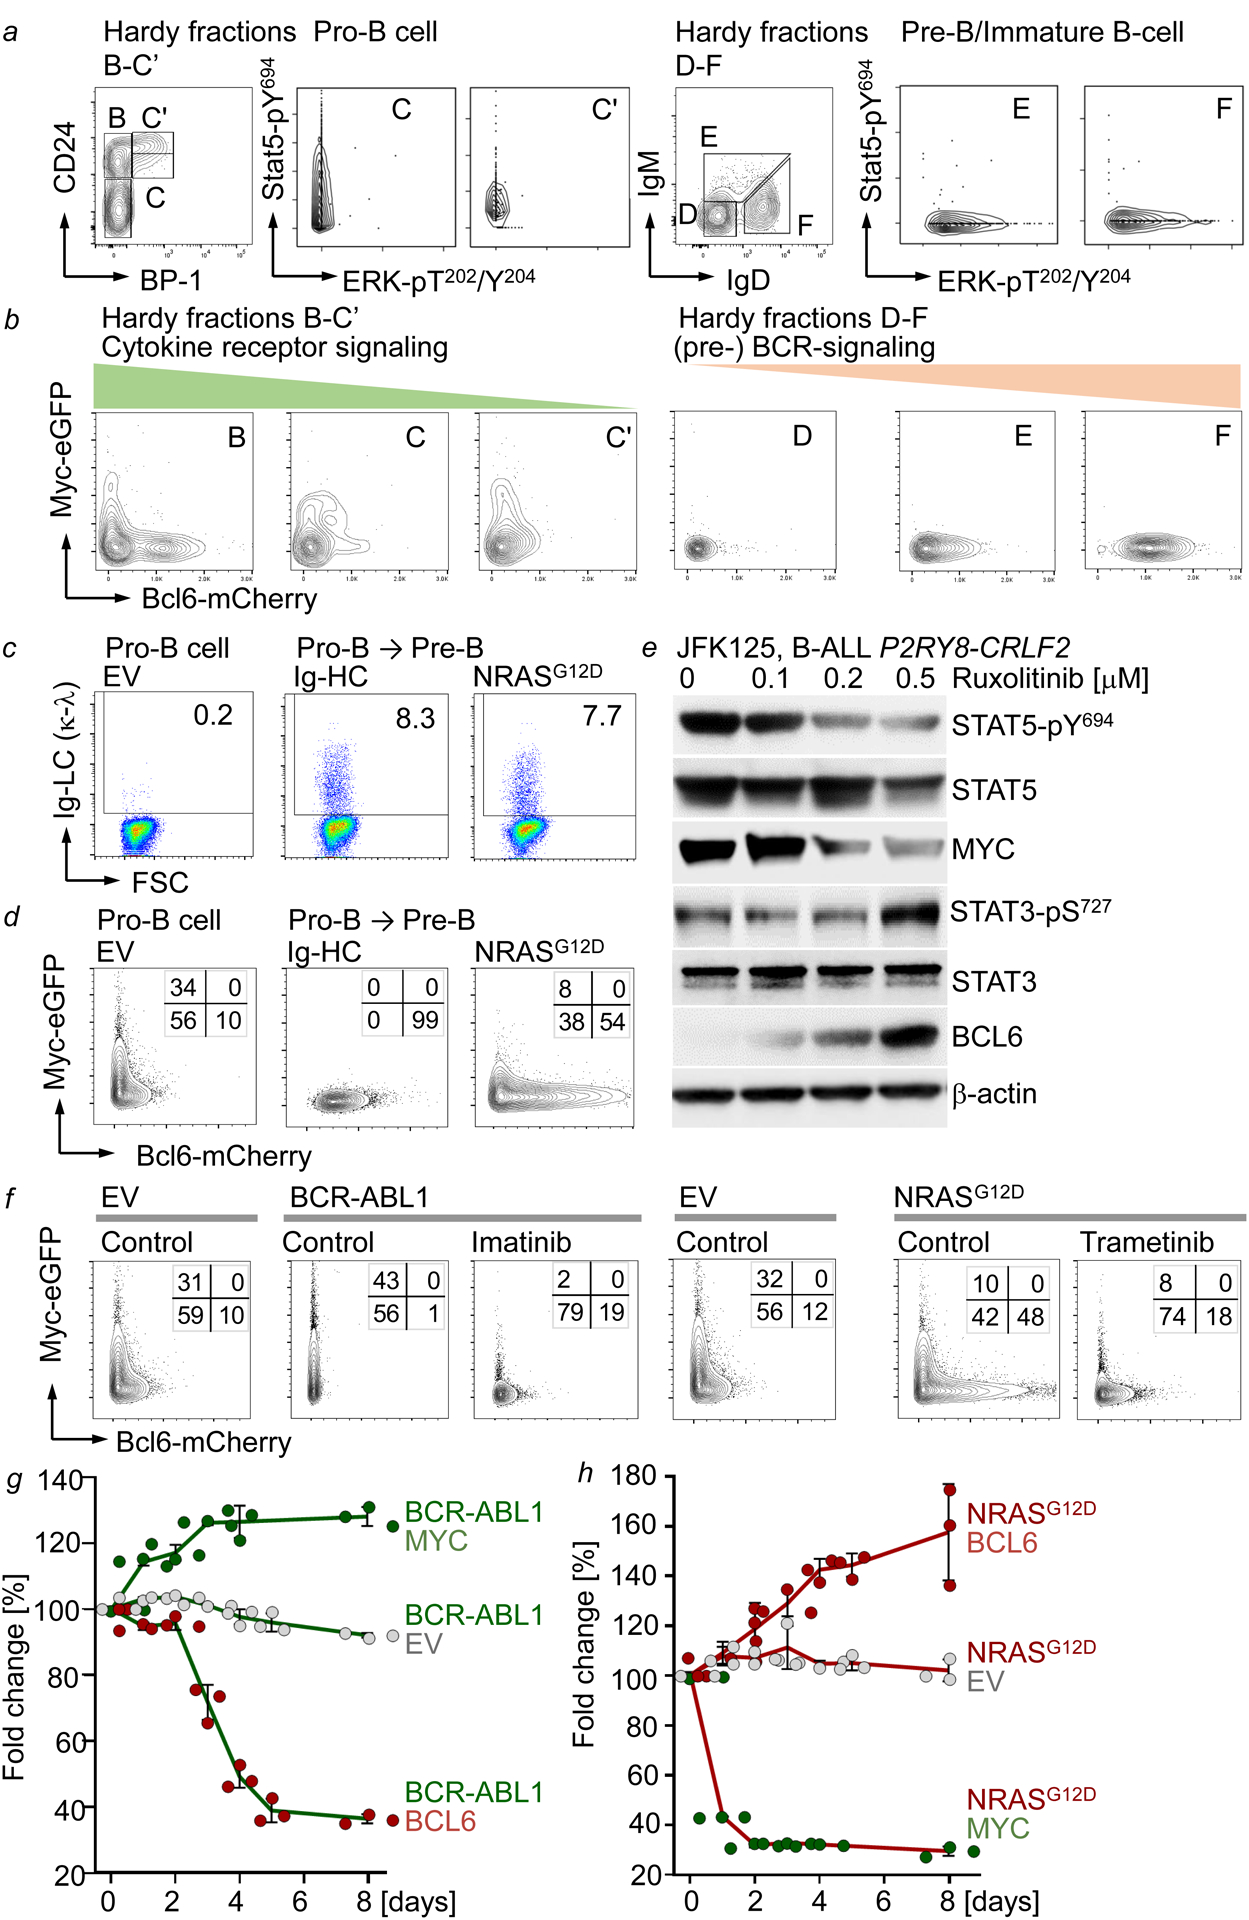
a, Hardy Fractions B-F analysis of MyceGFP/+ Bcl6mCherry/+ bone marrow cells. Single-cell phosphoprotein analyses of the indicated fractions. b, Surface expression of eGFP and mCherry on MyceGFP/+ Bcl6mCherry/+ bone marrow cells in Hardy Fractions B-F. c, Surface expression of Igκλ light chain (LC) on IL7-dependent pro-B cells (left), and upon Dox-inducible expression of μHC (middle) or NRASG12D (right). d, Surface expression of eGFP and mCherry on IL7-dependent MyceGFP/+ Bcl6mCherry/+ B-cell precursors induced to differentiate or transduced with NRASG12D. e, Western blots of Ph-like B-ALL cells treated with ruxolitinib (n=3 independent experiments). f, Surface expression of eGFP and mCherry on MyceGFP/+ Bcl6mCherry/+ B-cell precursors transduced with EV, BCR-ABL1 or NRASG12D, and subsequently treated with vehicle control, imatinib (1 μM) or trametinib (10 nM). g,h, Enrichment or depletion of GFP+ BCR-ABL1 or NRASG12D B-ALL cells transduced with EV, GFP-MYC or GFP-BCL6 (mean, ±s.d; g,h). Data from 3 independent biological replicates (a-d,f). e-h, n=3 independent experiments. For gel source data, see Supplementary Fig. 1.
In a STAT5-driven B-ALL PDX, pharmacological inhibition of STAT5 induced BCL6 at the expense of MYC. Consistent with opposing roles of STAT5 and STAT3 in the regulation of MYC and BCL616, STAT5-dephosphorylation was paralleled by increased STAT3-phosphorylation (Fig. 2e). While oncogenic Stat5-signaling (BCR-ABL1) activated Myc and suppressed Bcl6, Erk-signaling (NRASG12D) activated Bcl6-mCherry but reduced Myc-eGFP activity (Fig. 2f). Trametinib largely reduced Bcl6-reporter activity. Flow cytometry analysis of MyceGFP-Bcl6mCherry dual reporter cells showed an L-shaped pattern (Fig. 2f) comparable to STAT5-ERK single-cell phosphoprotein analyses (Fig. 1d). Stat5-Myc+ and Erk-Bcl6+ cells represent non-overlapping populations, reflecting distinct stages of early B-cell differentiation. MYC increased competitive fitness in STAT-driven B-ALL (BCR-ABL1), whereas BCL6 caused rapid depletion in growth competition assays (Fig. 2g). Conversely, BCL6 increased competitive fitness of ERK-driven B-ALL cells (NRASG12D). However, ERK-driven B-ALL cells were not permissive to MYC and depleted from cell culture (Fig. 2h). Thus, while cytokine receptor signaling in pro-B cells or its oncogenic mimics (e.g. BCR-ABL1) activate STAT5 to promote a MYC-driven transcriptional program, pre-BCR signaling in pre-B cells or its oncogenic mimics (e.g. NRASG12D) activate ERK to engage BCL6-dependent transcription (Extended Data Figure 5f).
Reciprocal suppression of STAT5 and ERK
To determine the mechanistic basis of segregation of STAT5- and ERK-activation, we examined whether inducible activation of one pathway affected biochemical activity of the other. Inducible expression of a constitutively active mutant of Stat5a in IL7-dependent pro-B cells strongly increased Stat5-pY694 and reduced Erk-pT202/Y204 (Fig. 3a). Like ERK, JNK- and p38α- activity was suppressed by STAT5. However, only ERK, but not JNK and p38α, was phosphorylated upon inducible expression of NRASG12D in IL7-dependent pro-B cells. Stat1-phosphorylation was barely detectable, however, upon RAS-activation, Stat3 was strongly phosphorylated on both Y705 and S727, which was suppressed by Stat5aCA (Fig. 3a, Extended Data Figure 5a). Expression of NRASG12D increased phosphorylation of Stat3-S727 but resulted in dephosphorylation of Stat5 (Fig. 3a). To confirm biochemical interference between STAT5- and ERK-signaling, we engineered murine pro-B cells to express (i) the human IL2 receptor β (hIL2Rβ) chain which enables phosphorylation of Stat5a-Y694 and Stat5b-Y699 in response to human IL2-binding and (ii) doxycycline-inducible NRASG12D (Fig. 3b). Activation of Stat5 (hIL2), Erk (Dox) or a combination of both, confirmed biochemical interference between STAT5 and ERK pathways (Fig. 3b). Colony formation and proliferation was increased by activation of either Stat5 or Erk alone but was compromised by dual pathway activation (Fig. 3c–d). These observations indicate that signal input from divergent pathways represents a barrier against malignant transformation. Given the strong negative association between BCR-ABL1 and oncogenic NRAS lesions in B-ALL (Extended Data Figure 1a), we modelled concurrent activation of both oncogenic drivers (Extended Data Figure 6a). As sole oncogenic driver following transduction with neutral empty vector (EV) EV-Orange or EV-GFP, both Stat5 (EV-Orange +BA-GFP) and Erk (EV-GFP +NRAS-Orange) gave rise to large double-positive populations. When instead of EV, a secondary oncogene engaging a diverging pathway was transduced, frequencies of double-positive cells dropped by 22-fold for Stat5 and 15-fold for Erk (Extended Data Figure 6a). Reduction of double-positive cells was mirrored by reduced colony formation comparing single- and dual pathway activation (Extended Data Figure 6b). Pathway interference was confirmed in patient-derived BCR-ABL1- (MXP2) and KRASG12V- (LAX7R) B-ALL cells harboring inducible expression of NRASG12D and BCR-ABL1, respectively. Concurrent activation of a divergent pathway suppressed proliferation, cellular senescence and cell death (Extended Data Figure 6c–e).
Figure 3: Concurrent oncogenic STAT5- and ERK-activation subverts B-cell leukemogenesis.
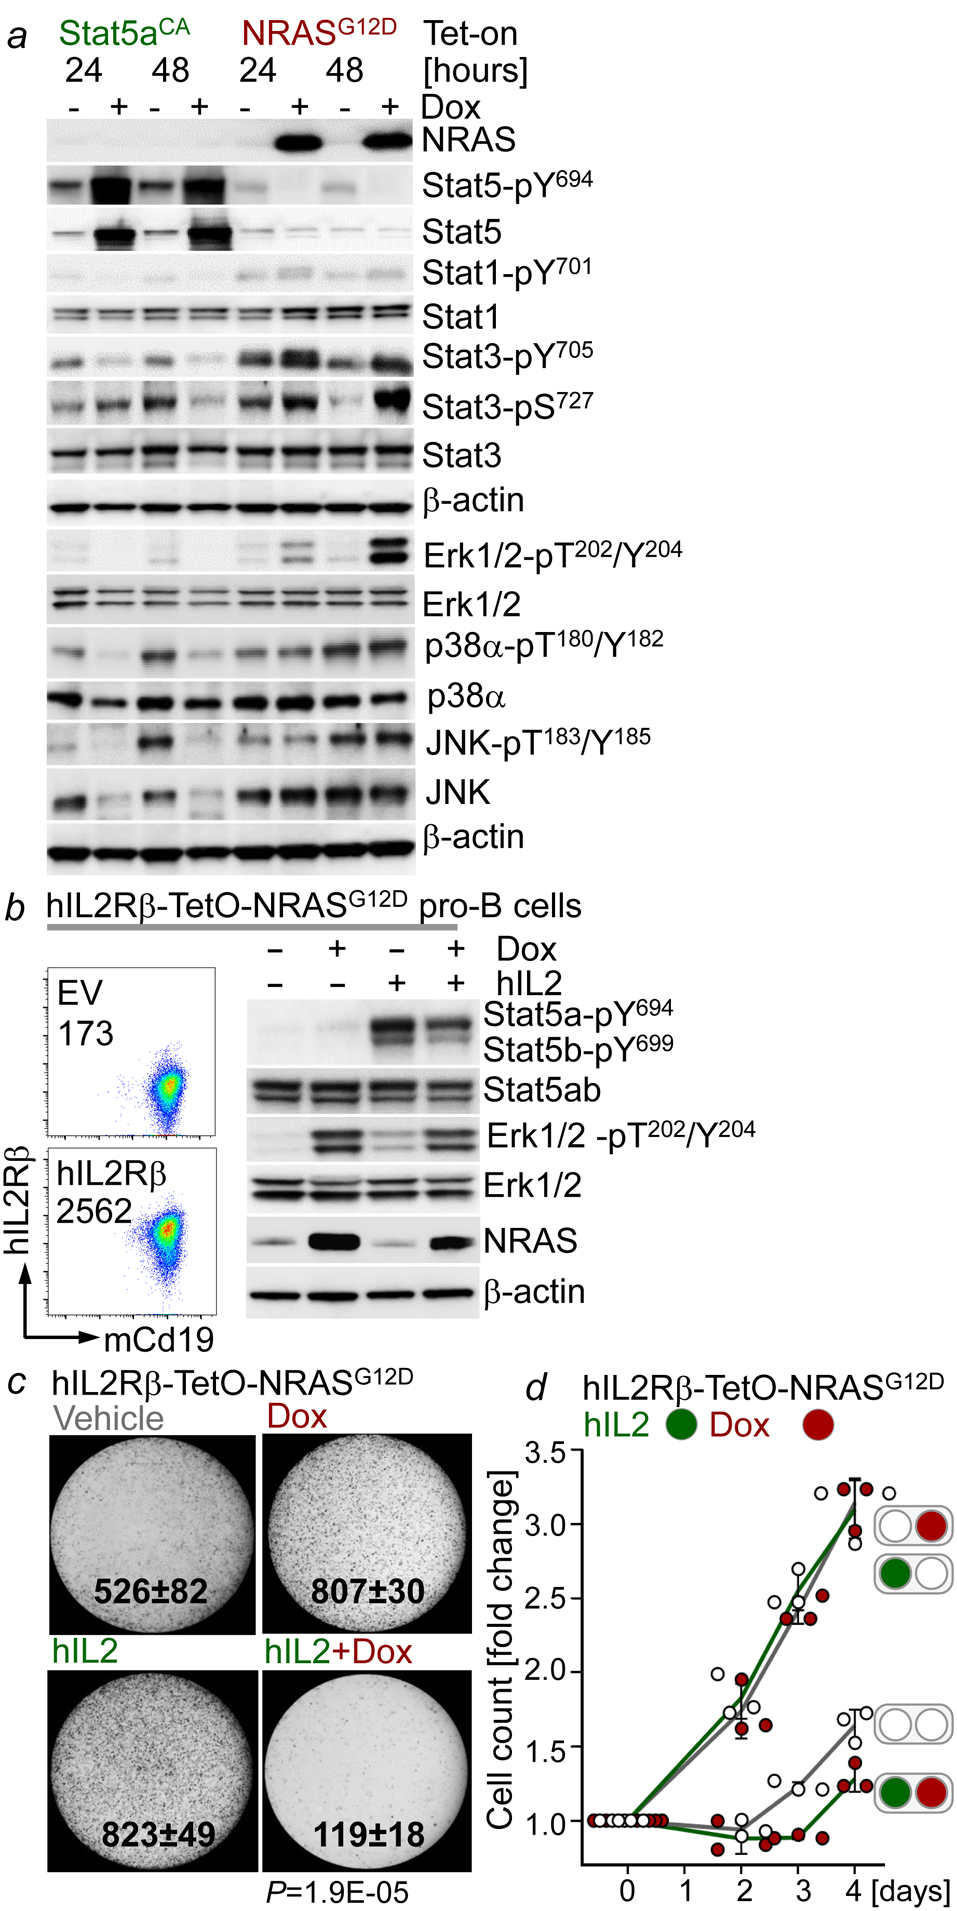
a, Western blotting following Dox-induced expression of Stat5aCA or NRASG12D in IL7-dependent mouse pro-B cells. b, FACS plots and Western blots of hIL2Rβ-TetO-NRASG12D mouse pro-B cells following the indicated treatments (Dox, 24 hr; hIL2, 15 min., 50 ng/μL). c,d, Colony formation (c, P=1.9E-05, two-tailed t-test) and viable cell counts (d, mean, ±s.d.) of hIL2Rβ-TetO-NRASG12D mouse pro-B cells treated with Dox, hIL2 (10 ng/μL), or a combination of both. Data from 3 independent experiments (a-d). For gel source data, see Supplementary Fig. 1.
Inactivation of divergent pathways
We next tested whether background ‘noise’ from pathways diverging from the principal oncogenic driver represents a barrier against transformation. Consistent with biochemical cross-inhibition, inducible deletion of Mapk1 (Erk2) resulted in loss of Stat3- but increased Stat5-phosphorylation in B-ALL cells. Conversely, inducible Stat5-deletion increased phosphorylation of both Erk and Stat3 in B-ALL (Fig. 4a–b). In contrast to deletion of the principal oncogenic driver, acute deletion of secondary divergent pathways (Mapk1 in Stat5-driven and Stat5 in Erk-driven B-ALL) only transiently slowed cell growth (Fig. 4c–d). Compared to B-ALL cells retaining intact divergent pathway components, Cre-mediated deletion strikingly increased colony formation (Fig. 4e–f). To examine effects of deletion of divergent pathway components on leukemia-initiation in vivo, we performed limiting dilution transplant experiments based on 100, 1,000 and 10,000 pro-B cells that carried Stat5- or Erk-driver oncogenes and Mapk1fl/fl (Erk) and Stat5fl/fl alleles for inducible ablation of divergent pathways. Mapk1fl/fl pro-B cells with BCR-ABL1 (Stat5) and Stat5fl/fl pro-B cells with NRASG12D (Erk) were studied either carrying EV, for retention, or tamoxifen-inducible Cre, for deletion of divergent pathway components. Five days after engraftment, NSG recipient mice were injected with tamoxifen for activation of Cre or EV controls. Mapk1 deletion accelerated the onset of overt Stat5-driven B-ALL. Likewise, deletion of Stat5 accelerated leukemia-initiation in Erk-driven B-ALL. At two lower dose levels (1,000 and 100 cells), Stat5 deletion was required for initiation of Erk-driven B-ALL. Injection of 100 or 1,000 Erk-driven B-ALL cells failed to initiate fatal disease in transplant recipients unless Stat5 was deleted (Fig. 4i–j).
Figure 4: Genetic deletion of alternative pathways triggers STAT5- and ERK-driven leukemia-initiation.
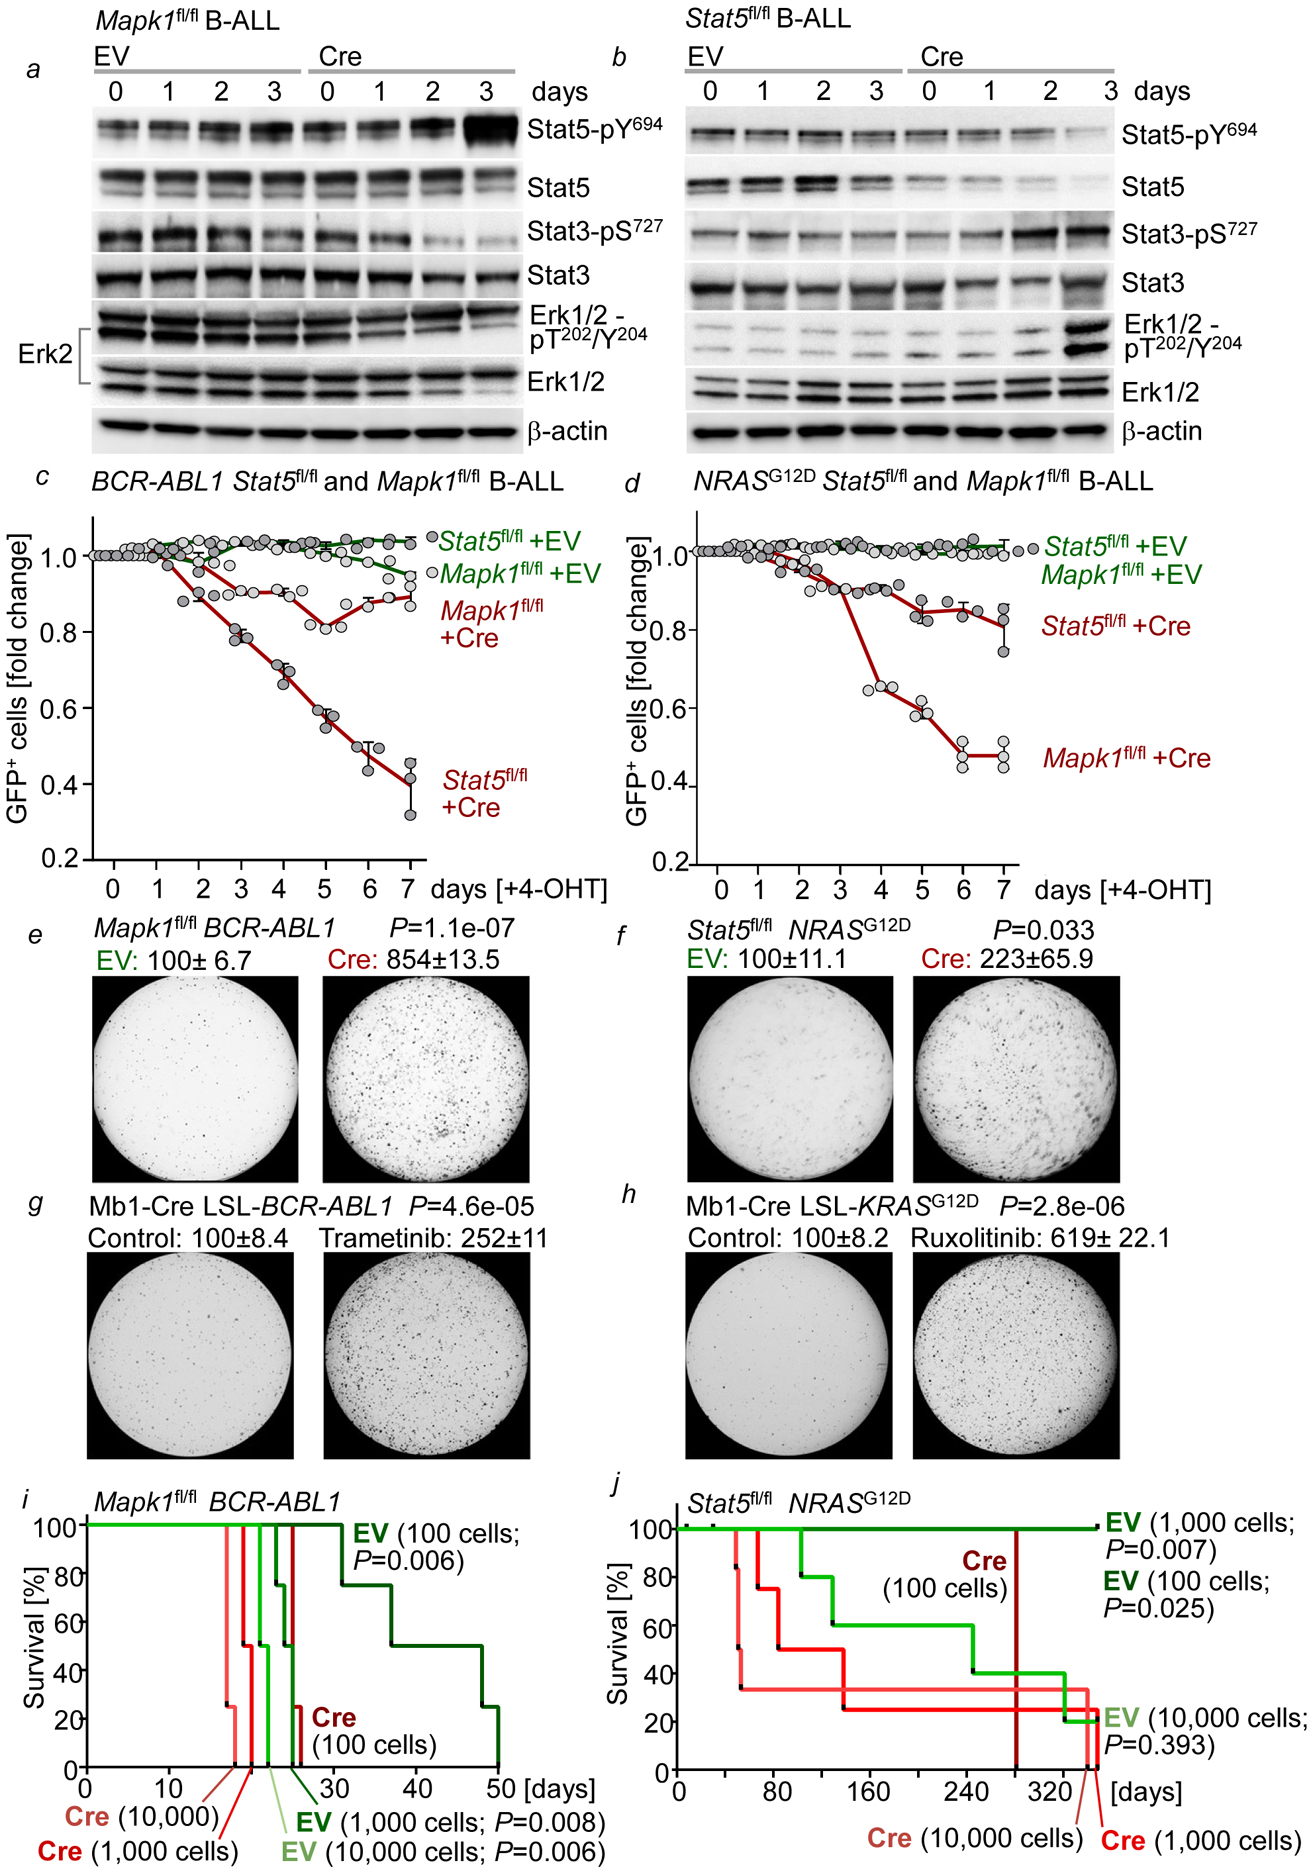
a, Western blots of BCR-ABL1-B-ALL cells upon Cre-mediated ablation of Mapk1 (Erk2). b, Western blots of NRASG12D B-ALL cells upon Cre-mediated deletion of Stat5. c,d, Enrichment or depletion of GFP+ Stat5fl/fl or Mapk1fl/fl BCR-ABL1 (c) or NRASG12D (d) B-ALL cells transduced with ERT2-GFP or Cre-ERT2-GFP. e,f, Colony formation (% control) of Mapk1fl/fl BCR-ABL1 B-ALL cells (e) and Stat5fl/fl NRASG12D-B-ALL cells (f) upon deletion of Mapk1 or Stat5, respectively. g,h, Colony formation (% control) of Mb1-Cre x LSL-BCR-ABL1 (g) and Mb1-Cre x LSL-KRASG12D (h) pro-B cells primed with trametinib (1 nmol/L, 10 days, g) and ruxolitinib (10 nmol/L, 10 days, h). i,j, Kaplan-Meier analyses (Mantel-Cox log-rank test) of recipient mice (n=4 per group) bearing BCR-ABL1- (i) or NRASG12D-driven (i) B-ALL cells with or without deletion of Mapk1 (i; 24 hr) or Stat5 (j; 24 hr). Data, mean ±s.d. (n=3 independent experiments a-h). Assessed by two-tailed t-test (c-h). For gel source data, see Supplementary Fig. 1.
As surrogate for deletion of divergent pathway components Mapk1 and Stat5, we used small molecule inhibitors of MAP2K1 (trametinib) and JAK-STAT5 (ruxolitinib). Strikingly, trametinib triggered leukemic colony formation from murine pro-B cells carrying an inducible BCR-ABL1 knockin allele in vitro. Likewise, initiation of leukemic colony formation from murine pro-B cells carrying an inducible KRASG12D knockin allele (Supplementary Table 6) was precipitated upon treatment with ruxolinitib (Fig. 4g–h). We further tested pharmacological combinations of principal drivers with divergent pathway inhibition. BCI-215 activates ERK-phosphoryation17 as an allosteric inhibitor of DUSP6, the central negative feedback regulator of ERK in B-ALL18. DPH activates STAT5-phosphorylation by relieving ABL1 and related kinases from their autoinhibitory conformation19. Interestingly, trametinib in combination with DPH increased colony formation in BCR-ABL1-driven B-ALL. Likewise, BCI-215 potentiated the effects of ruxolitinib on colony formation of NRASG12D B-ALL (Extended Data Figure 6e–f). Taken together, ablation of divergent input (‘noise’) and convergence on one principal oncogenic driver represents a critical event in leukemogenesis. A recent transposon screen suggested that truncation of the ERK-signaling activator Sos1 precipitates the onset of STAT5-driven B-ALL20. Importantly, prolonged suppression of JAK2-STAT5 signaling by ruxolitinib increased the risk of B-cell transformation and could prime dormant B-cell clones to develop overt ERK-driven B-cell lymphoma21.
PTPN6 contributes to ERK-signaling
Previous work showed that the inhibitory phosphatase PTPN6 (SHP1) negatively regulates STAT522. Here, we hypothesized that PTPN6-mediated negative regulation of STAT5 contributes to oncogenic ERK-signaling. Activation of ERK induced PTPN6 expression and activation (Extended Data Figure 7a). The ERK-downstream transcription factors, ELK1, JUN, JUNB and CREB19 bound to the PTPN6 promoter (Extended Data Figure 7b). Consistent with suppression of divergent pathways, ERK was inactive in patient-derived STAT5-driven B-ALL cells (PDX2). However, BCI-215 not only reactivated ERK, but also induced PTPN6 phosphorylation and dephosphorylation of its substrate STAT5 (Extended Data Figure 7c–d). Supporting the critical function of PTPN6 in Erk-signaling, Ptpn6 deletion increased Stat5-phosphorylation (Extended Data Figure 7e), compromised colony formation and competitive fitness of NRASG12D B-ALL cells (Extended Data Figure 7f–g).
BLNK enforces convergence on ERK-pathway
The pre-B-cell linker Blnk directly interacts with Ptpn6 and mediates its phosphatase activity23, and links Ras proteins to Erk-signaling24. Studying inducible activation of pre-BCR- or oncogenic ERK-signaling (Extended Data Figure 8a–b) in Blnk+/+ and Blnk−/− B-cell precursors revealed that Blnk was essential for activation of Erk downstream of the pre-BCR or oncogenic NRASG12D. In the absence of Blnk, inducible pre-BCR- or NRASG12D-signaling failed to activate Erk and to suppress Stat5-phosphorylation. Likewise, Blnk was required for upregulation of Ptpn6 in response to oncogenic Erk-signaling (Extended Data Figure 8b). Hence, we examined whether Blnk differentially affects oncogenic Stat5- and Erk-signaling. Inducible expression of Stat5aCA in Blnk+/+ B-cell precursors induced rapid cell death. In contrast, Stat5aCA-induction in Blnk−/− B-cell precursors induced malignant transformation, in agreement with previous findings that Stat5bCA cooperates with defects in Blnk to promote B-ALL4. As expected, NRASG12D-induction caused malignant transformation of Blnk+/+ B-cell precursors. However, NRASG12D-induction only transiently accelerated proliferation of Blnk−/− B-cell precursors, followed by cell death (Extended Data Figure 8c–f). Similarly, ablation of Blnk increased colony formation after Stat5aCA-induction, while colony numbers were decreased in Blnk−/− B-cell precursors when Erk was activated downstream of NRASG12D (Extended Data Figure 8g–h).
To validate the role of BLNK in patient-derived B-ALL cells, we studied a matched B-ALL pair from the same patient at the time of diagnosis (LAX7; STAT5-driven, IL7RSI246S) and after relapse (LAX7R; ERK-driven, KRASG12V). Genetic deletion of BLNK provided a strong competitive advantage to LAX7 but induced cell death in LAX7R cells (Extended Data Figure 9a–d). Western blotting revealed that pharmacological inhibition of the principal driver in LAX7 (STAT5) and LAX7R (ERK) resulted in reactivation of divergent suppressed pathways (Extended Data Figure 9e). The divergent changes between LAX7 and LAX7R samples were mirrored by contrasting drug-responses: LAX7 and LAX7R samples were selectively sensitive to ruxolitinib and trametinib, respectively (Extended Data Figure 9f). Taken together, PTPN6 and BLNK function as ERK-induced negative regulators of STAT5, hence enabling pathway convergence on oncogenic ERK-signaling (Extended Data Figure 5f).
Reactivation of suppressed pathways
The current paradigm of targeted therapy in cancer is mainly based on direct suppression of the principal oncogenic driver. As a strategy to prevent drug-resistance and relapse, we explored an alternative approach based on reactivation of suppressed pathways that operate in divergent directions relative to the principal oncogenic driver. We focused on pharmacological reactivation of suppressed ERK- and STAT5-signaling by BCI-215 and DPH. BCI-215 reactivated the repressed ERK-pathway at the expense of STAT5 in STAT5-driven B-ALL (LAX7, JFK125R). Conversely, DPH reactivated the suppressed STAT5-signaling and decreased ERK-phosphorylation in ERK-driven B-ALL (LAX7R; KRASG12V; Extended Data Figure 10). We next tested whether divergent pathway reactivation amplifies the impact of direct inhibition of the principal oncogenic driver. Treatment with BCI-215 or ruxolitinib alone only achieved minor responses, whereas combinations achieved synergistic effects in eliminating B-ALL cells (Extended Data Figure 10). DPH or trametinib alone partially suppressed ERK-phosphorylation in ERK-driven (KRASG12V) B-ALL cells and had minor effects on cell viability. Mirroring complete ERK-suppression, DPH and trametinib combinations had synergistic effects on B-ALL-elimination (CI:0.28; Extended Data Figure 10c). To validate efficacy and feasibility of divergent pathway reactivation in vivo, we injected NSG mice with B-ALL cells from two refractory PDX (LAX7R; JFK125R). Both cases originate from STAT5-driven primary B-ALL that developed drug-resistance and relapsed with an additional ERK-driven clone (KRAS; Extended Data Figure 10d, j). DPH and trametinib combination achieved synergy (P=0.0005 vs. trametinib; P=0.0004 vs. DPH alone) and extended overall survival of mice bearing LAX7R (ERK-driven; KRASG12V; Extended Data Figure 10e). Since the STAT5-driven clone in JFK125R at relapse was still dominant (Extended Data Figure 10j), mice bearing JFK125R were treated with BCI-215 and ruxolitinib combinations, which achieved synergy (P=0.0103 vs. BCI-215; P=0.0005 vs. ruxolitinib) and prolonged overall survival of transplant recipients (Extended Data Figure 10k).
We compared STAT5- and ERK-phosphorylation by single-cell analysis of LAX7R and JFK125R before (Extended Data Figure 10d, j) and after treatment with DPH-Trametinib and BCI-Ruxolitinib combinations in vivo (Extended Data Figure 10g, m). Combination treatment eradicated the dominant clone, whereas the formerly minor clone gave rise to fatal disease driven by one single population (Extended Data Figure 10g, m). Compared to pre-treatment, fatal leukemia post-treatment was resistant to the drug-combination directed at the major clone but highly sensitive to the drug combination directed at the divergent pathway (Extended Data Figure 10f, l). Taken together, these observations suggest that alternating treatment regimens with (i) a drug-combination targeting the major clone followed by (ii) a drug-combination targeting the divergent minor clone may be useful for eradication of high-risk bi-clonal disease.
Discussion
Non-transformed B-cells constantly exchange information with their environment and depend on external cues for proliferation and survival that engage multiple divergent pathways (e.g. cytokine receptors, BCR). Hence, a diverse spectrum of signaling input reflects interactions of normal cells with their environment, while convergence on one central pathway represents a hallmark of transformation. We here provide evidence that inactivation of divergent pathways that are not aligned with the principal oncogenic represents a critical step during transformation. Here, we identified convergence on one principal oncogenic driver and inactivation of diverging pathways as critical event during B cell transformation. Reactivation of divergent and potentially conflicting signaling pathways represents a powerful barrier to transformation. From a treatment-perspective, targeted reactivation of divergent pathways to interfere with the principal oncogenic driver may represent a promising strategy to amplify treatment-responses. Our results show that this approach is orthogonal to direct inhibition of driver oncogenes (e.g. by TKI) and may represent a previously unrecognized strategy to overcome drug-resistance. Activation of other pathways (e.g. WNT, NF-κB, Notch) may either coalesce into one convergent pathway or interfere and disrupt signaling from the principal driver oncogene. To comprehensively identify targets for pharmacological reactivation of divergent (suppressed) pathways, it will be important to elucidate cell type-specific mechanisms of convergence and interference between principal oncogenic drivers and their potential detractors.
METHODS
Patient-derived B-ALL samples
Patient samples (Supplementary Tables S3–S5) were sourced ethically from patients who gave informed consent and were in compliance with the internal review boards of the Beckman Research Institute of City of Hope and the Dana Farber Cancer Institute and Harvard Medical School. We have complied with all relevant ethical regulations. Patient samples were harvested from biopsy of ALL (bone marrow) patients at the time of diagnosis or relapse. All samples (Supplementary Tables S5) were transplanted into sublethally irradiated NOD.Cg-Prkdcscid Il2rgtm1Wjl/SzJ (NSG; The Jackson Laboratory) mice through tail vein injection. Following collection of samples, ALL xenografts were cultured on OP9 stroma cells in Alpha Minimum Essential Medium (MEMα; GIBCO) with GlutaMAX supplemented with 20% FBS, 1mM sodium pyruvate, 100 IU/mL penicillin and 100 μg/mL streptomycin at 37°C in a humidified incubator with 5% CO2. For PDXs listed in Supplementary Tables S3–S4, patient-derived xenograft models were initiated on treatment with ponatinib (Selleckchem S1490) at a dose of 40 mg/kg/day via oral gavage when the level of peripheral blood involvement by human CD45/CD19 double-positive cells exceeded 10%. Treatment continued daily until animals progressed, as defined by a return to peripheral blood involvement >10% after an initial response, or they required humane euthanasia for clinical signs of illness, at which point disease status was assessed by necropsy and post-mortem flow cytometric evaluation of peripheral blood, spleen, and bone marrow tissues. Before experimental usage, all xenografts were tested to be mycoplasma free (MycoAlertPLUS, LONZA).
Murine primary and leukemia cells
Bone marrow and splenic cells were harvested from female mice (Supplementary Table S7) between 6–8 weeks of age without signs of inflammation. Bone marrow cells were obtained by flushing cavities of femur and tibia with PBS. After filtration through a 40 μm cell strainer and depletion of erythrocytes using a lysis buffer (RBC Lysis Buffer, BioLegend), cells were washed with PBS and were either frozen for storage or subjected to further experiments. Bone marrow cells were cultured in Iscove’s Modified Dulbecco’s Medium (IMDM; GIBCO) with GlutaMAX supplemented with 20% FBS, 100 IU/ml penicillin, 100 μg/mL streptomycin and 50 μmol/l β-mercaptoethanol (GIBCO). Bone marrow cells, for IL7-dependent pre-B cell culture, were cultured in full IMDM supplemented with 10 ng/ml recombinant mouse IL-7 (PeproTech). To generate murine B-lineage Ph+ ALL cell, pre-B cells were retrovirally transduced with BCR-ABL1. After transformation with BCR-ABL1, ALL cells were cultured in IL7-withdrawn IMDM. NRASG12D B-ALL cells were maintained with IL-7 supplemented IMDM. To examine the role of MYC in NRASG12D B-ALL cells (Fig. 4h), IMDM was supplemented with CXCL12 (100 ng/mL) and low dose of IL-7 (0.2 ng.mL). All mouse experiments were subject to institutional approval by COHCCC.
Genetic mouse models
C57BL/6, NOD.Cg-Prkdcscid Il2rgtm1Wjl/SzJ, Mb1-Cre, Stat5fl/fl, and Ptpn6fl/fl mice were purchased from The Jackson Laboratory. Mapk1fl/fl and Blnk−/− mice were obtained from Dr. Martin McMahon and Dr. Hassan Jumaa, respectively. MyceGFP/+ mice (Huang, C.Y. et al. 2008) were crossed with Bcl6mCherry/+ mice (Geng, H. et al. 2015) to generate MyceGFP/+; Bcl6mCherry/+ reporter mice. For animals bred in house, littermates of the same sex were randomized to experimental groups. All mouse breeding and experiments were subject to institutional approval by the Beckman Research Institute Animal Care and Use Committee. We have complied with all relevant ethical regulations. All mouse models used in the study are listed in Supplementary Table S7.
Retroviral constructs and transduction
Transfection of retroviral constructs (Supplementary Table S8) was performed using Lipofectamine 2000 (Invitrogen) with Opti-MEM media (Invitrogen). Retroviral supernatant was produced by co-transfecting HEK 293FT cells with the plasmids pHIT60 (gag-pol) and pHIT123 (ecotropic env). Lentiviral supernatant was produced by co-transfecting HEK 293FT cells with the plasmids pCDNL-BH and VSV-G. 293FT cells were cultured in high glucose Dulbecco’s modified Eagle’s medium (DMEM, Invitrogen) with GlutaMAX containing 10% fetal bovine serum, 100 IU/mL penicillin, 100 μg/mL streptomycin, 25 mmol/L HEPES, 1 mmol/L sodium pyruvate and 0.1 mmol/L non-essential amino acids. Regular medium was replaced after 16 h by growth medium containing 10 mmol /L sodium butyrate. After incubation for 8 h, the medium was replaced with regular growth medium. Twenty-four hours later, retroviral supernatant was collected, filtered through a 0.45 μm filter and loaded by centrifugation (2,000 g, 90 min at 32 °C) onto 50 μg/mL RetroNectin- (Takara) coated non-tissue six-well plates. Transduced cells with estrogen receptor fusion proteins were induced with 4-hydroxytamoxifen (4-OHT, Tam; 1 μM). Cells transduced with constructs carrying an antibiotic resistance marker were selected with its respective antibiotic.
Western blotting
Cells were lysed in CelLytic buffer (Sigma-Aldrich) supplemented with 1% protease inhibitor cocktail (Calbiochem Millipore) and 1 mM PMSF. 20 μg of protein mixture per sample were separated on mini precast gels (Biorad) and transferred onto nitrocellulose membranes. The primary antibodies used are listed in Supplementary Table S11. For protein detection, the WesternBreeze Immunodetection System (Invitrogen) was used, and light emission was detected by either film exposure or the ChemiDoc MP Imaging System (Bio-Rad). Western blot analyses (Fig. 1a) were performed to evaluate correlation between phospho-ERK-T202/Y204 and phospho-STAT5-Y694 levels as determined by densitometry (ImageJ) in patient-derived B-ALL cells (n=23).
Single-cell phosphoprotein analyses
For single-cell phosphoprotein analyses of STAT5-phosphorylation (Y694) and ERK-phosphorylation (T202/Y204), 500, 000 cells were resuspended in 2 mL of 1X Suspension Buffer (Small scWest kit for small cells, K500, ProteinSimple) and run on two duplicate scWest chips. On each scWest chip, there is a 2×8 array of 400-well blocks patterned into a pre-cast polyacrylamide gel. For single-cell Western analyses, optimal cell loading is achieved when 2% or fewer wells contain multiple cells. Prior to loading of cells, scWest chips were hydrated in 1x Suspension Buffer for at least 10 minutes at RT. Cells were then loaded onto each chip and allowed to settle for ~7–10 minutes. Following removal of unsettled cells, scWest chips were inserted into Milo (ProteinSimple) for lysis of cells (10 seconds) and size-based protein separation (60 seconds, 240 V) following the manufacturer’s instructions. UV capture immobilized protein bands in the gel on the scWest chip. Chips were then probed with primary antibodies (1:15; Supplementary Table S11) overnight at 4°C, followed by probing with fluorescent secondary antibodies (1:20; Supplementary Table S11) the following day for 1 hr at RT. To verify each detected peak was associated with cell occupancy in each well, chips were probed for Histone H3 (CST# 4499; 1:30), followed by DNA staining using TOTO™-1 Iodide (514/533; ThermoFisher Scientific). Chips were scanned using a microarray scanner to measure fluorescence intensities. Scout Software (ProteinSimple) was used for peak identification and data analysis. Each data point was inspected to verify that the signal was associated with a peak located at the correct peak location (distance from the well center) in each lane in the gel on the chip.
For single-cell Western analyses, optimal cell loading is achieved when 2% or fewer wells contain multiple cells (https://www.proteinsimple.com/milo.html). As an independent validation of cell loading conditions, Ramos lymphoma cells were genetically engineered to express either SYK or ZAP70, mixed in a ratio of 1 to 1 and analyzed by single-cell Western blot. Our analysis revealed <1.5% of wells (4/291) with detectable expression of both SYK and ZAP70, resulting from two cells in the same well. This is consistent with manufacturer’s expectations of cell loading on to scWest chips and cell occupancy (ProteinSimple). The relationship between STAT5-pY694 and ERK-pT202/Y204 was visualized by a bivariate plot with nonparametric density contours using JMP version 9.0 (SAS institute)
CRISPR-mediated gene deletion
For gene deletion in human cells chemically synthesized crRNAs (100 μmol/L) and tracrRNAs (100 μmol/L) were annealed by incubation at 95 °C for 5 min. Recombinantly produced Cas9 (40 μmol/L) were then added to RNA mixture to produce RNA ribonucleoprotein (RNP) complexes. Electroporation was performed by using pulse code EH-115 on a Lonza 4D 96-well electroporation system. Predesigned Alt-R CRISPR-Cas9 guide RNAs and non-targeting control guide RNAs were purchased from IDT (Supplementary Table S9).
Single-cell mutation analysis of patient-derived Ph+ ALL cells
Patient-derived xenograft models (PDXs; Supplemental Table S2) of Ph+ ALL cases were injected via tail vein (1.0×10⁶ cells/mouse) into non-irradiated 6–8-week-old female NSG mice (NOD.Cg-PrkdcscidIl2rgtm1Wjl/SzJl, Jackson Laboratory stock #005557). Upon engraftment (≥10% peripheral blood involvement), mice were randomized to treatment with vehicle control, ABL001 (an allosteric BCR-ABL inhibitor, courtesy of Novartis AG, 30 mg/kg twice daily via oral gavage), ponatinib (Selleckchem #S1490, 40 mg/kg/day via oral gavage), or the combination of both. Subsets of animals were sacrificed at engraftment (prior to treatment initiation) and on day 5 of treatment (for pharmacodynamic assessment), and the remainder were sacrificed when they manifested clinical signs of illness (reflecting progression or toxicity). Leukemia cells were enriched from bone marrow and/or spleen via immunomagnetic depletion of murine cells and underwent targeted sequencing with a custom Archer VariantPlex assay. Across the majority of PDX models (notable exceptions being 1F10, 2B10 and 2G10), a moderate frequency of treatment-emergent mutants in the ERK-pathway was observed. In most cases, these were mutually exclusive with ABL mutations (STAT5-pathway). To analyze whether treatment-emergent ERK- and STAT5-pathway mutations co-occurred in the same cell, single-cell mutation analysis was performed for 1F10, 2B10 and 2G10. Single cell sorting for PDXs was performed on FACSAria II (BD Biosciences). Genomic DNA (gDNA) was amplified from single cells using the REPLI-g Single Cell Kit (Qiagen) following manufacturer’s instructions. Genomic regions of interest were amplified by PCR using Q5 Hot Start High-Fidelity DNA Polymerase (New England BioLabs) with M13 tailed primers, and were analyzed for mutations in ABL1, KRAS, and PTPN11 by Sanger sequencing using M13 primers (MCLAB). The primer sequences are listed in Supplementary Table S9.
Flow cytometry
Approximately 106 cells per sample were resuspended in PBS with DAPI (0.75 μg/mL) as a dead cell marker. For competitive growth assays, percentage of GFP+ or KO1+ cells was monitored by flow cytometry. For cell surface staining, PBS washed cells were blocked with Fc blocker for 10 min on ice and then stained with the indicated antibodies listed in Supplementary Table S11 or isotype control for 25 min on ice. Cells were then washed and resuspended in chilled PBS containing 0.75 μg/mL of DAPI to exclude dead cells. For Annexin V staining, Annexin V binding buffer (BD Bioscience) was used instead of PBS and 7AAD (BD Bioscience) instead of DAPI. PE labeled-Annexin V was purchased from BD Bioscience. Acquisition was performed on LSRFortessa flow cytometer (BD Biosciences). Fluorescence-based cell sorting was performed on FACSAria II (BD Biosciences). FACS data were analyzed with FlowJo software (FlowJo, LLC).
Colony forming assays
The methylcellulose colony-forming assays were performed with 10,000 cells. Cells were resuspended in mouse MethoCult medium (without cytokines for BCR-ABL1-transformed cells; with IL7 for NRASG12D-expressing cells) and cultured on 3-cm diameter dishes, with an extra water supply dish to prevent evaporation. Colonies were imaged and counted after 10–14 days using GelCount (Oxford Optronix).
Bone marrow cells harvested from Mb1-Cre; Bcr+/LSL-BCR/ABL mouse cultured in the presence of IL-7 were primed with vehicle control or trametinib (1 nmol/L) for 10 days prior to colony forming assays. Bone marrow cells harvested from Mb1-Cre; LSL-K-ras-G12D mouse cultured in the presence of IL-7 were primed with vehicle control or ruxolitinib (10 nmol/L) for 10 days prior to colony forming assays. Murine wild-type BCR-ABL1 B-ALL cells were primed with vehicle control, DPH (1 μM), trametinib (1 nM) or DPH in combination with trametinib for 10 days prior to colony forming assays. Murine wild-type NRASG12D B-ALL cells cultured in the presence of IL-7 were primed with vehicle control, BCI-215 (50 M), ruxolitinib (10 nM), or BCI-215 in combination with ruxolitinib for 10 days prior to colony forming assays.
For colony forming assays with hIL2Rβ-TetO-NRASG12D cells, cells were replenished with Dox and hIL2 every other day and were imaged after 10 days.
Cell viability assays and determination of viable cell counts
Forty thousand patient-derived B-ALL cells were seed in a volume of 80 μL in complete growth medium on 96-well plate. Compounds were added at the indicated concentration in a total volume of 100 μL. After culturing for 3 days, Cell Titer Glo (Promega) assay was performed according to the manufacturer’s instructions. Medium without cells was used as blank. Relative viability was calculated using baseline values of untreated cells as a reference. Combination index (CI) was calculated using the CompuSyn software to determine interaction (synergistic, CI < 1; additive, CI=1; or antagonistic, CI > 1) between the two agents. Constant ratio combination design was used. Cell viability upon the genetic loss of function of Blnk was monitored by flow cytometry using DAPI (0.75 μg/mL) as a dead-cell marker. To determine the number of viable cells, the trypan blue exclusion method was applied, using the Countess II FL Automated Cell Counter.
Senescence β-galactosidase staining
Patient-derived B-ALL cells (5 × 10⁵) expressing doxycycline-inducible BCR-ABL1 or NRASG12D (with or without Dox treatment) were seeded onto each Cell-Tak coated well on a 24-well cell imaging plate. Senescence-activated β-galactosidase (SA-βGal) staining was then performed using the Senescence β-Galactosidase Staining Kit (Cell Signaling Technology) following the manufacturer’s instructions.
Pharmacological inhibitors
Imatinib was purchased from LC Laboratories. Stock solutions were prepared in sterile water at 10 mmol/L and stored at −20°C. Small molecule inhibitor of DUSP6 (2-benzylidene-3-(cyclohexylamino)-1-lndanone hydrochloride; BCI) and the ABL1 activator DPH were purchased from Sigma-Aldrich. BCI-215 was a gift from Dr. Andreas Vogt. The MEK inhibitor (trametinib), the JAK inhibitor (ruxolitinib) and ponatinib were purchased from LC Laboratories. Pimozide (STAT5 inhibitor) was purchased from TOCRIS. Stock solutions were prepared in DMSO at 10 mmol/L and stored at −20°C. For in vivo experiments, compounds were dissolved in NMP:PEG300 (1:9). Ph-like ALL cells (Fig 2e) were treated with ruxolitinib for 20 hours and then processed for Western blotting.
Analysis of ChIP-seq data
ChIP-seq tracks for ELK1, CREB1, c-JUN and JUNB antibodies in a normal human B cell sample (the Encyclopedia of DNA Elements, ENCODE GM12878, UCSC genome browser) on the PTPN6 gene promoter region are shown. The ChIP-seq peaks were called by the MACS peak caller by comparing read density in the ChIP experiment relative to the input chromatin control reads, and are shown as bars under each wiggle track.
Mutational exclusivity analysis
The samples for ALL analysis originate from six different sources, including the St. Jude Children’s Research Hospital Pecan Data Portal (https://pecan.stjude.cloud/proteinpaint/heatmap/HM,BALL), published studies (Nikolaev et al., 2014, Herold et al., 2017, Jerchel et al., 2018) as well as samples analyzed in the Müschen and Weinstock laboratories (Supplementary Table S1). All AML whole genome and whole exome variant calls were downloaded from COSMIC (n=916; date of access: 2019-07-27), and filtered to retain only coding, non-synonymous variants (Supplementary Table S2). Annotation for each sample is provided in the Excel files for Supplementary Table S1 and Supplementary Table S2. All statistical analysis and visualization was performed in R (v3.6.1). Variants were summarized at the gene level to obtain a gene alteration matrix and level of co-occurrence/mutual exclusivity tested by Fisher’s exact test and adjusted for multiple testing using the Benjamini-Hochberg method. Co-occurrence networks were generated using the igraph package (v1.2.4.1) with vertex-size weighted by the frequency of the gene alteration and edges weighted by the co-occurrence score – defined here as the negative log10 p-value multiplied by the log odds ratio. Overall shifts in co-occurrence between pathways was tested by two complimentary methods – firstly, difference in logOR was tested by Mann-Whitney U-test and Kruskal-Wallis rank sum test, mutation pairs with frequencies < 5% and Fishers FDR > 0.5 were excluded to prevent extreme logOR at low frequencies biasing result. Secondly, observed/expected values were permuted for 10,000 iterations with shuffled gene-to-pathway assignments to obtain a pathway-independent null distribution for comparison with observed values. Code for mutual exclusivity analyses are available on GitHub at https://github.com/muschenlab/Stat5-vs-Erk under the MIT license, which allows for reuse and distribution.
Analysis of linkage between STAT5 and ERK pathway mutations and IGLK/IGLL rearrangements
To analyze mutations in STAT5 and ERK pathways in human, 95 phase II samples with both copy number and mutation data from the Target phase II data set (“all_phase2_target_2018_pub.tar.gz”, available from cBioportal (Cerami 2012) were analyzed. To test whether these lesions are linked to cellular origins from distinct stages of B-cell development, IGLK or IGLL rearrangement events were assigned based on intersecting the coordinate ranges of segmented copy numbers (log2 mean segmented copy number values below −0.7) and loci coordinates (IGLK 22q11.22, chr22:22375022–23270762 and IGLL 2p11.2, chr2:87353672–92167812). A gene list for mutations leading to STAT5 or ERK activation (7 and 32 genes, respectively) were manually curated. FLT3 mutations were considered as STAT5 activating unless they co-occurred with ERK activating mutations. The STAT5 and ERK mutations were next assigned to occurring in either germline, or IGLK/IGLL rearranged background. Three samples with both ERK and STAT5 activating mutations were removed from the analysis, resulting in total of 45 patients classified based on STAT5 or ERK activating mutations and the rearrangement status. To test whether STAT5 activating mutations are enriched in patients with germline, while ERK activating mutations in rearranged IGKL and/or IGLL loci in a mutually exclusive manner, Fisher’s exact test with alternative hypothesis “less” was computed in R.
In vivo transplantation experiments
The indicated numbers of leukemia cells were injected into sublethally irradiated (200 cGy) NSG mice via the tail vain. 8- to 10-week-old female NSG mice were randomly allocated before injection. Mice were euthanized when they showed signs of leukemia burden including hunched posture, weight loss and inability to move. Bone marrow and/or spleen cells were harvested to test for leukemic infiltration by flow cytometry. Bioimaging of leukemia progression in mice was performed at the indicated time points using an in vivo IVIS 100 bioluminescence/optical imaging system (Xenogen). D-Luciferin (Promega) dissolved in PBS was injected intraperitoneally at a dose of 2.5 mg per mouse 15 min prior to measurement of the luminescence signal. General anaesthesia was induced with 5% isoflurane and continued during the procedure with 2% isoflurane introduced through a nose cone. Kaplan-Meier survival analyses were performed using GraphPad Prism 7 (GraphPad Software Inc.) to compare overall survival (OS). Mantel–Cox log-rank test was used as statistical analysis using GraphPad Prism 7. The minimal number of mice in each group was calculated by using the ‘cpower’ function in R/Hmisc package. The minimal number of mice in each group was calculated by using the ‘cpower’ function in R/Hmisc package. Mice were randomly allocated to groups by investigators who did not participate in any subsequent analysis. The performers of the mouse experiments (injections, drug treatments) were blinded to the randomization process.
Modeling of synergy for in vivo transplantation experiments
To assess additive vs synergistic activity of drug-1+drug-2 in vivo, the Bliss independence model was adapted to survival analysis25. With this approach, treatments are Bliss “independent” if the fraction of cells surviving combination therapy equals the product of fractions that survive the individual treatments (e.g., if drug.1 treatment kills 90% and drug.2 kills 50%, Bliss independence predicts that the combination kills 95%)26. A Weibull distribution {exp[−(t/β)α]}27 was fitted to survival data for each condition (untreated, drug-1, drug-2, drug-1+drug-2), and distributions of survival benefits (treated survival time − untreated survival time) were computed for each treatment. Survival benefits of drug-1 and drug-2 were summed and added to the untreated survival distribution to compose a “sum of benefits” survival distribution. Confidence intervals were based on 10000 such simulations, in which each treatment’s survival distribution was a likelihood-weighted sample of Weibull parameters (α, β) based on the relative likelihood of having made the survival observations O = (t1, t2,…ti) given those parameters: L(O | α, β) = Πi{exp[−(ti/β)α] × tiα−1 × α × β−α}. The P value for synergy between drug-1 and drug-2 was the probability to draw data from the sum of benefits model ensembles with median survival duration equal to or greater than was experimentally observed for drug-1 and drug-2.
Statistics and reproducibility
Statistical analysis was performed using GraphPad Prism 7 (GraphPad Software Inc.) and were shown as mean ± SD as indicated. Unpaired 2-tailed Student’s t test was used to evaluate difference between two groups and P-values were plotted (P< 0.05 was considered statistically significant) unless indicated otherwise. For in vivo transplantation experiments, the minimal number of mice in each group was calculated through use of the ‘cpower’ function in the R/Hmisc package. Kaplan-Meier survival analysis was used to estimate OS with GraphPad Prism 7 and log-rank test was used to compare the difference between two groups. For clinical outcome analyses, overall survival and relapse-free survival for patients with higher and lower than median mRNA levels (top vs. bottom half) of the gene of interest were compared. Log-rank test was used to compare survival differences between patient groups. R package “survival” Version 2.35–8 was used for the survival analysis and Cox proportional hazards regression model in R package for the multivariable analysis (R Development Core Team, 2009). To determine synergism effects of (1) BCI-215 and ruxolitinib, and (2) DPH and trametinib in patient-derived B-ALL cells, combination index (CI) values were calculated using the CompuSyn software to determine interaction (synergistic, CI<1; additive, CI=1; or antagonistic, CI>1). For in vitro experiments, investigators were not blinded to allocation during experiments and outcome assessment. Mice were randomly allocated to groups by investigators who did not participate in any subsequent analysis. The performers of the mouse experiments (injections, drug treatments and monitoring) were blinded to the randomization process. Experiments were repeated to ensure reproducibility of the observations.
Data and software availability
Gel scans are provided in Supplementary Fig. 1. All other data are available from the corresponding author upon reasonable request. The GEO accession number for the gene expression profiles of diagnostic samples from 207 patients (COH P9906) is GSE11877. ChIP-seq data obtained from human B lymphocytes (GM12878) was obtained from the Encyclopedia of DNA Elements (ENCODE). Code for mutual exclusivity analyses are available on GitHub at https://github.com/muschenlab/Stat5-vs-Erk under the MIT license, which allows for reuse and distribution. Further information and requests for reagents may be directed to and will be fulfilled by the Lead Contact, Markus Müschen (mmuschen@coh.org).
Extended Data
Extended Data Figure 1. Segregation of STAT5- and ERK-activating mutations in human ALL and AML.
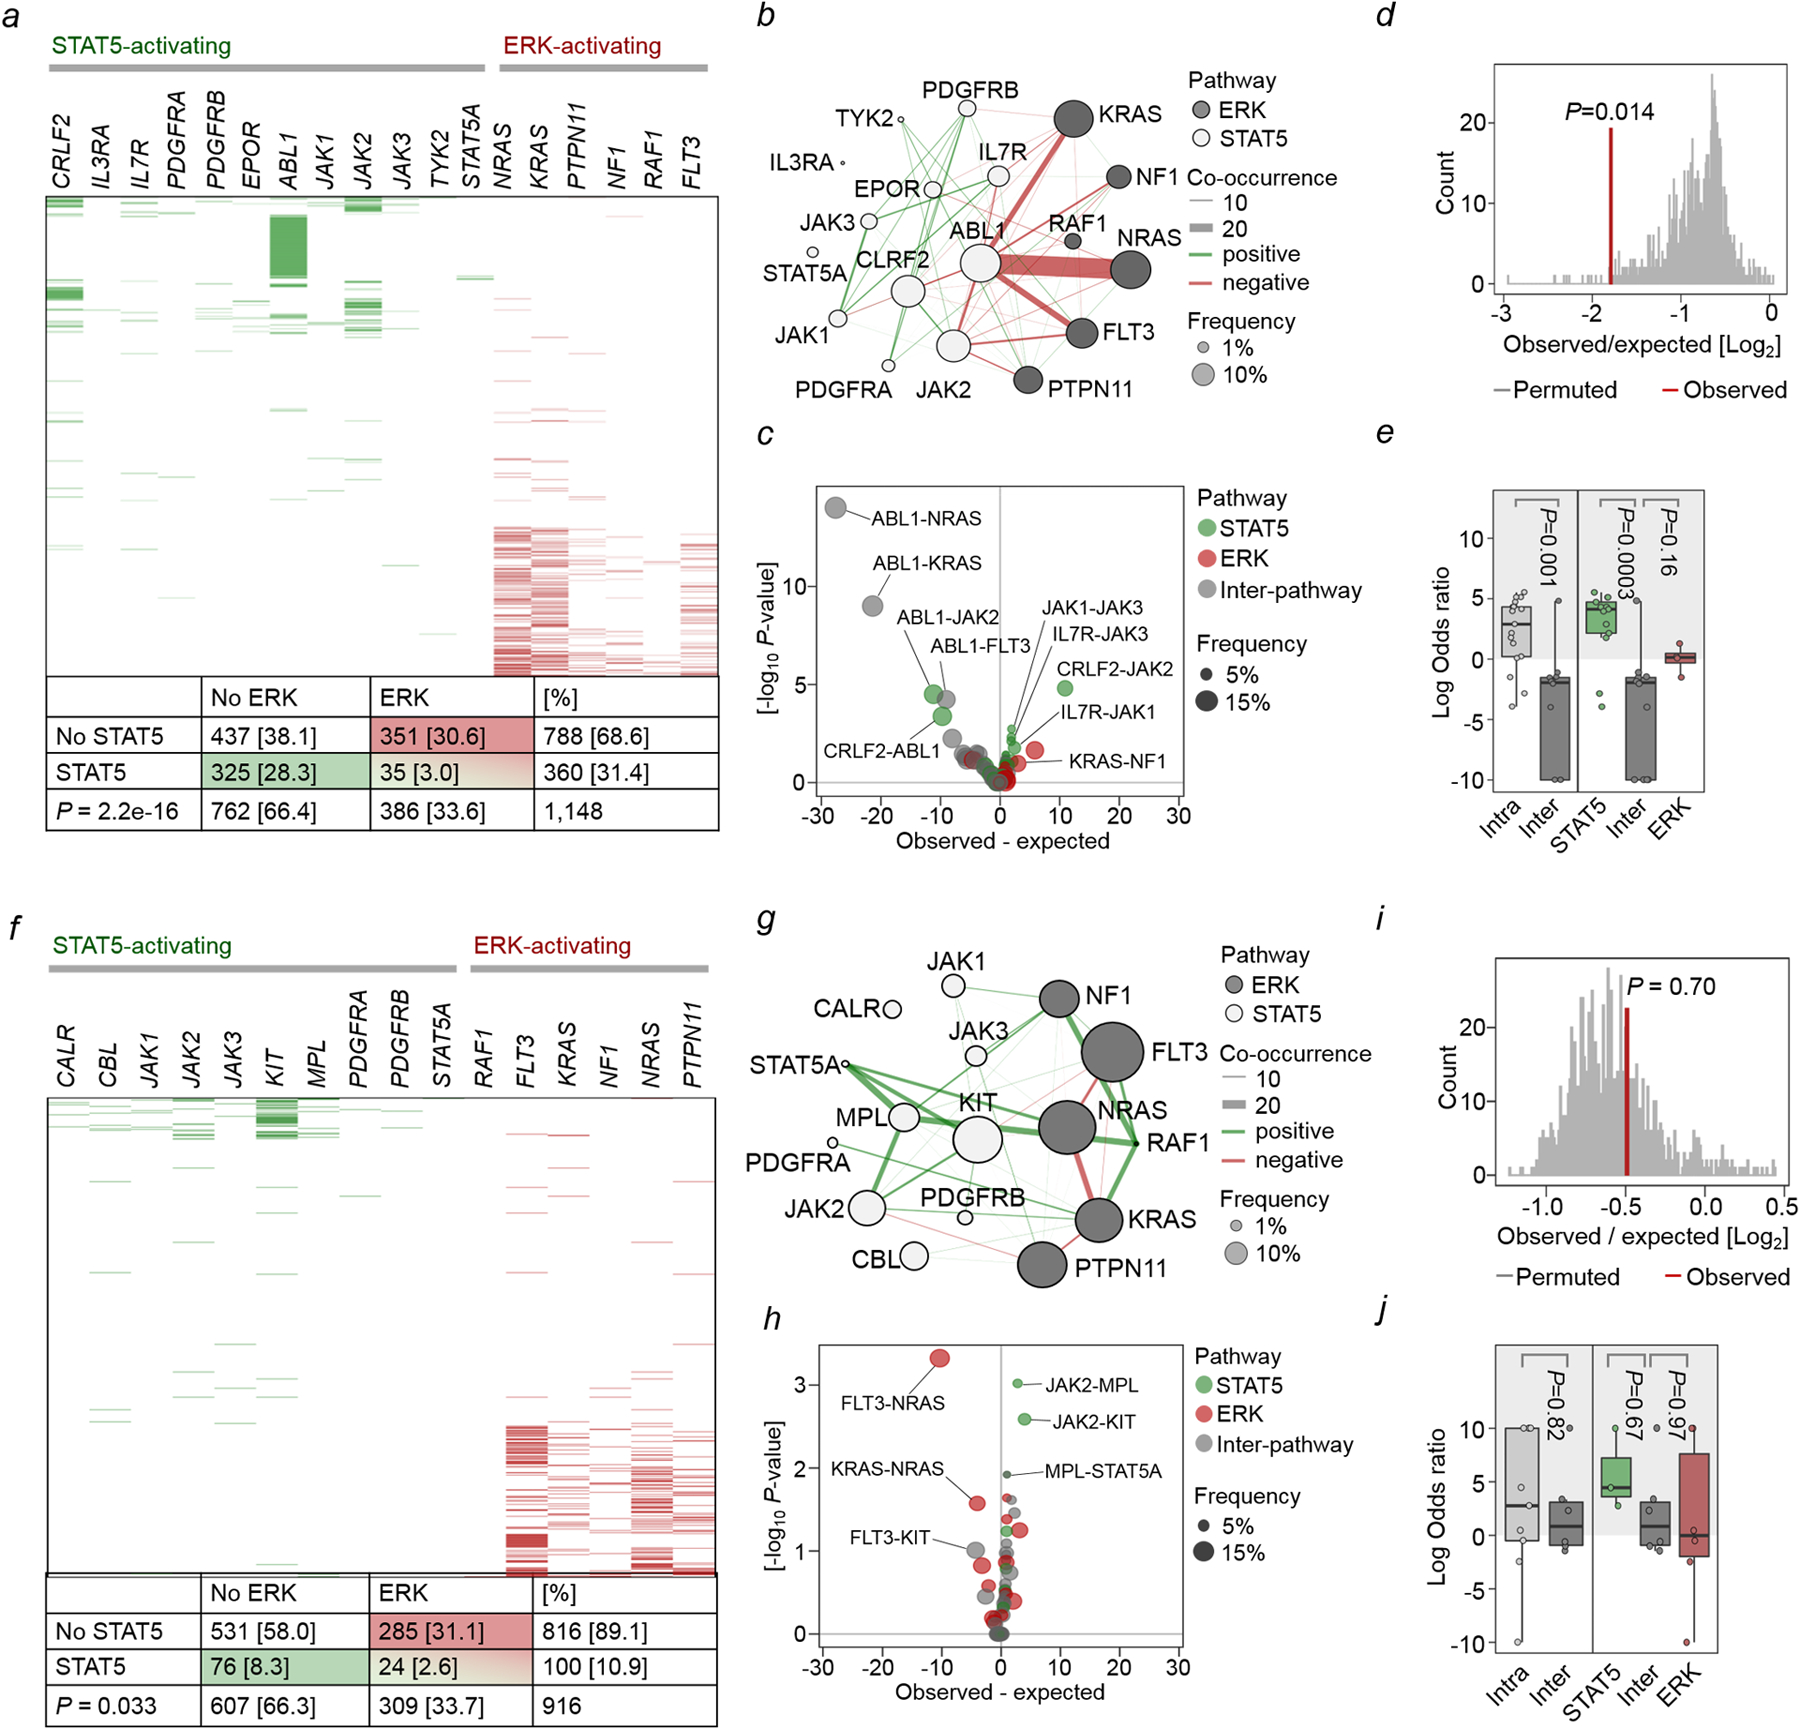
a-e, STAT5- and ERK-pathway mutations were studied in 1,148 patient-derived B-ALL samples (Supplementary Table 1). Null hypothesis is that STAT5- and ERK-pathway mutations occur independently of each other. The expected co-occurrence of mutations in both pathways under the null hypothesis was 121. The observed co-occurrence of the two mutations was 35, significantly lower than the expected (a; OR=0.13; P=2.2e-16, Fisher’s exact test). b, To analyze gene-gene co-occurrence in a more unsupervised manner, Fisher’s test was run for each gene-pair and plotted as a co-occurrence network – pathway assignment for each gene is indicated by node color (white = STAT5, grey = ERK), and mutation frequency by node size. Direction of Fisher’s result is indicated by line color (green = positive/greater than expected, red = negative/less than expected), line width represents strength of association (–log10 p-value * |logOR|). OR: odds ratio. c, Volcano plot of gene-gene co-occurrence results. Each point represents a gene-pair, colored by pathway assignment for the pair (green = both STAT5, red = both ERK, gray = inter-pathway), selected gene pairs are labeled. Overall difference in co-occurrence between pathways was tested by two complementary methods: d, Firstly, Fishers test was run over 10,000 permutations with random shuffling of gene-pathway assignments on each iteration to generate a null distribution for the hypothesis that pathway does not affect co-occurrence, and compared against the observed value from ALL patient data. e, Secondly, overall shifts in the distribution of logORs between pathways for Fisher’s results on individual gene-pairs were tested by Welch’s two-sample t-test (left panel; two-sided, P=0.001), and one-way ANOVA (right panel; P=0.0004) with Tukey HSD post-test (P=0.0003 and P=0.16). Low frequency, non-significant gene-pairs were excluded to avoid extreme odds ratios from biasing results. f-j, The same analyses were carried out on 916 patient-derived AML samples (Supplementary Table 2). Expected co-occurrence of mutations in both pathways under the null hypothesis was 34, observed co-occurrence was 24, significantly lower than the expected (f; OR=0.59, P=0.033, Fisher’s exact test). j, Welch two sample t-test (left panel; two-sided, P=0.82), one-way ANOVA (right panel; P=0.57).
Extended Data Figure 2. Single-cell phosphoprotein analyses of patient-derived B-ALL samples reveal segregation of STAT5- and ERK-phosphorylation to competing clones.
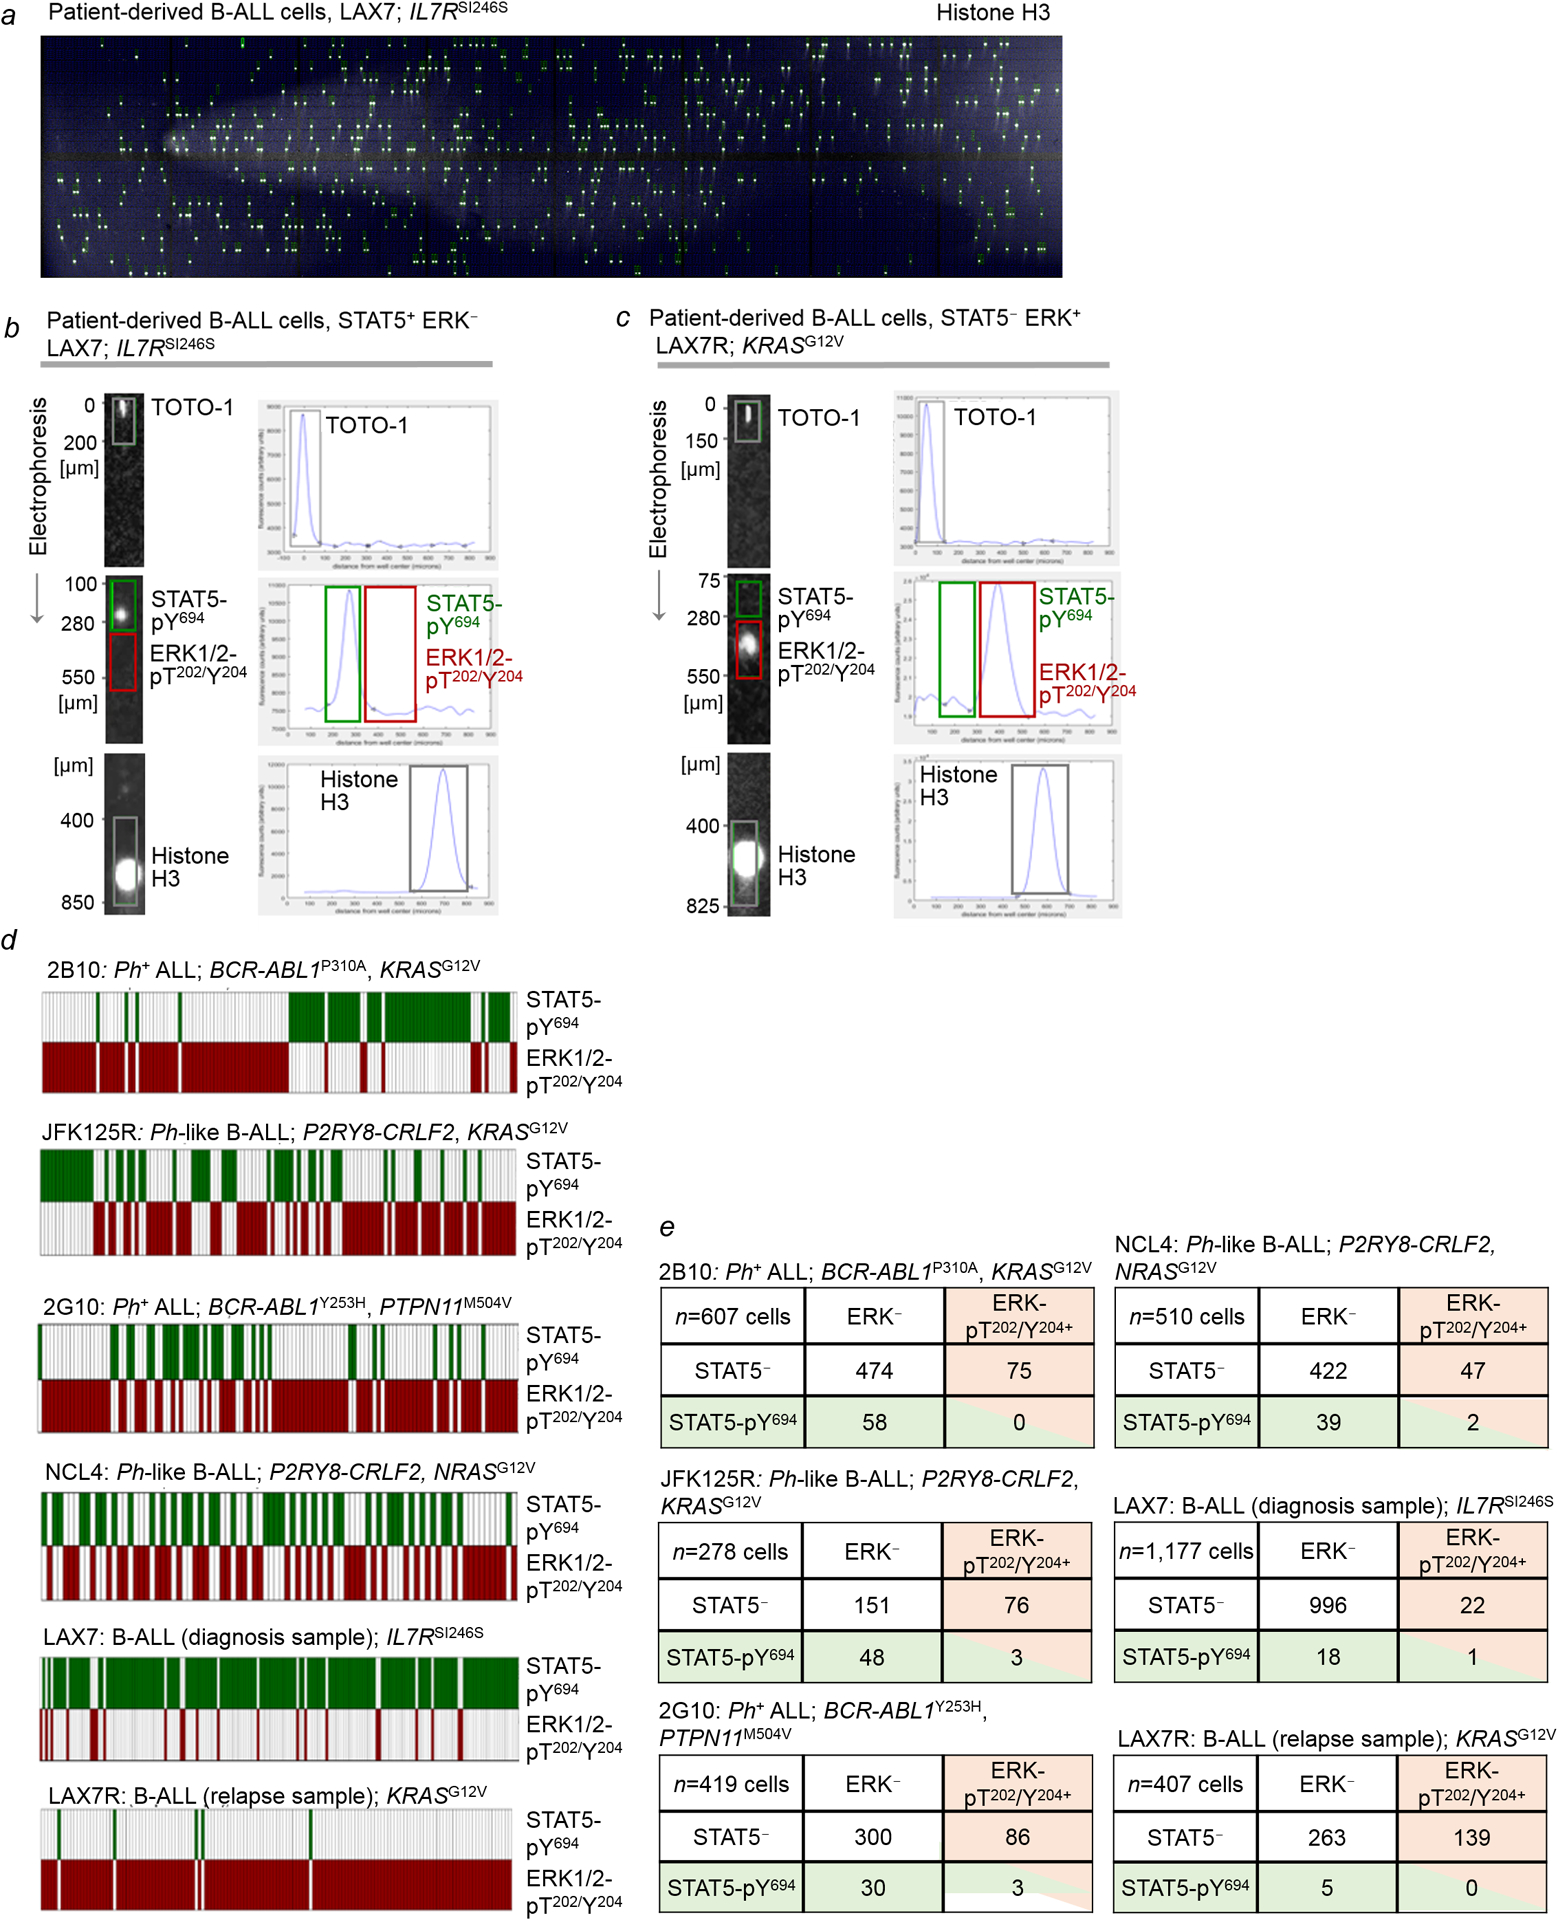
a-e, For single-cell phosphoprotein analyses, scWest chips were used to capture individual cells and perform size-based protein separation. Each chip includes 16 arrays of 400-well blocks (6,400) on a polyacrylamide gel. Single-cell suspensions of patient-derived B-ALL cells were loaded onto the scWest chip and inserted into Milo (ProteinSimple) for cell lysis, size-based protein separation and UV capture to immobilize protein bands. Representative scanned image of the scWest chip probed with Histone H3 antibodies to confirm cell occupancy, followed by fluorescent secondary antibodies (a; n=16 independent biological samples). Chips were probed with STAT5-pY694 and ERK-pT202/Y204 antibodies followed by fluorescent secondary antibodies for simultaneous detection of both phosphoproteins. Shown are representative images of signals observed for STAT5-pY694 and ERK-pT202/Y204. Fluorescence intensity was plotted against distance from well center (peak location, μm). In addition to histone H3, chips were stained for DNA using TOTO-1 dye to verify cell occupancy. Each signal was inspected to confirm it was associated with a peak located at the correct distance from the well center (b,c; n=16 independent biological samples, each in triplicate). Chip was scanned using a microarray scanner, and peak identification was performed using the Scout Software (ProteinSimple). For single-cell Western analyses, optimal cell loading is achieved when 2% or fewer wells contain multiple cells (https://www.proteinsimple.com/milo.html). d,e, Single-cell phosphoprotein analyses for STAT5-pY694 and ERK-pT202/Y204 were performed for patient-derived B-ALL samples (6 independent biological samples, each in triplicate) with STAT5-pY694 and ERK-pT202/Y204 antibodies for simultaneous detection of both STAT5- and ERK-phosphorylation. scWest chips were then probed for histone H3 and TOTO-1 (DNA stain) to verify cell occupancy. Scout Software (ProteinSimple) was used for peak identification and data analysis. Each data point was inspected to confirm the signal detected was associated with a peak located at the correct peak location (distance from the well center). Shown in (d) are heatmaps illustrating cells that express STAT5-pY694 (green) and/or ERK-pT202/Y204 (red). Shown in (e) are tables that summarize the number of cells expressing neither STAT5-pY694 nor ERK-pT202/Y204 and the number of cells expressing either STAT5-pY694 or ERK-pT202/Y204, or in rare cases, both. For single-cell Western analyses, optimal cell loading is achieved when 2% or fewer wells contain multiple cells.
Extended Data Figure 3. Phenotypic differences between B-ALL cells driven by oncogenic STAT5 or ERK reflect developmental rewiring during early B-cell development.
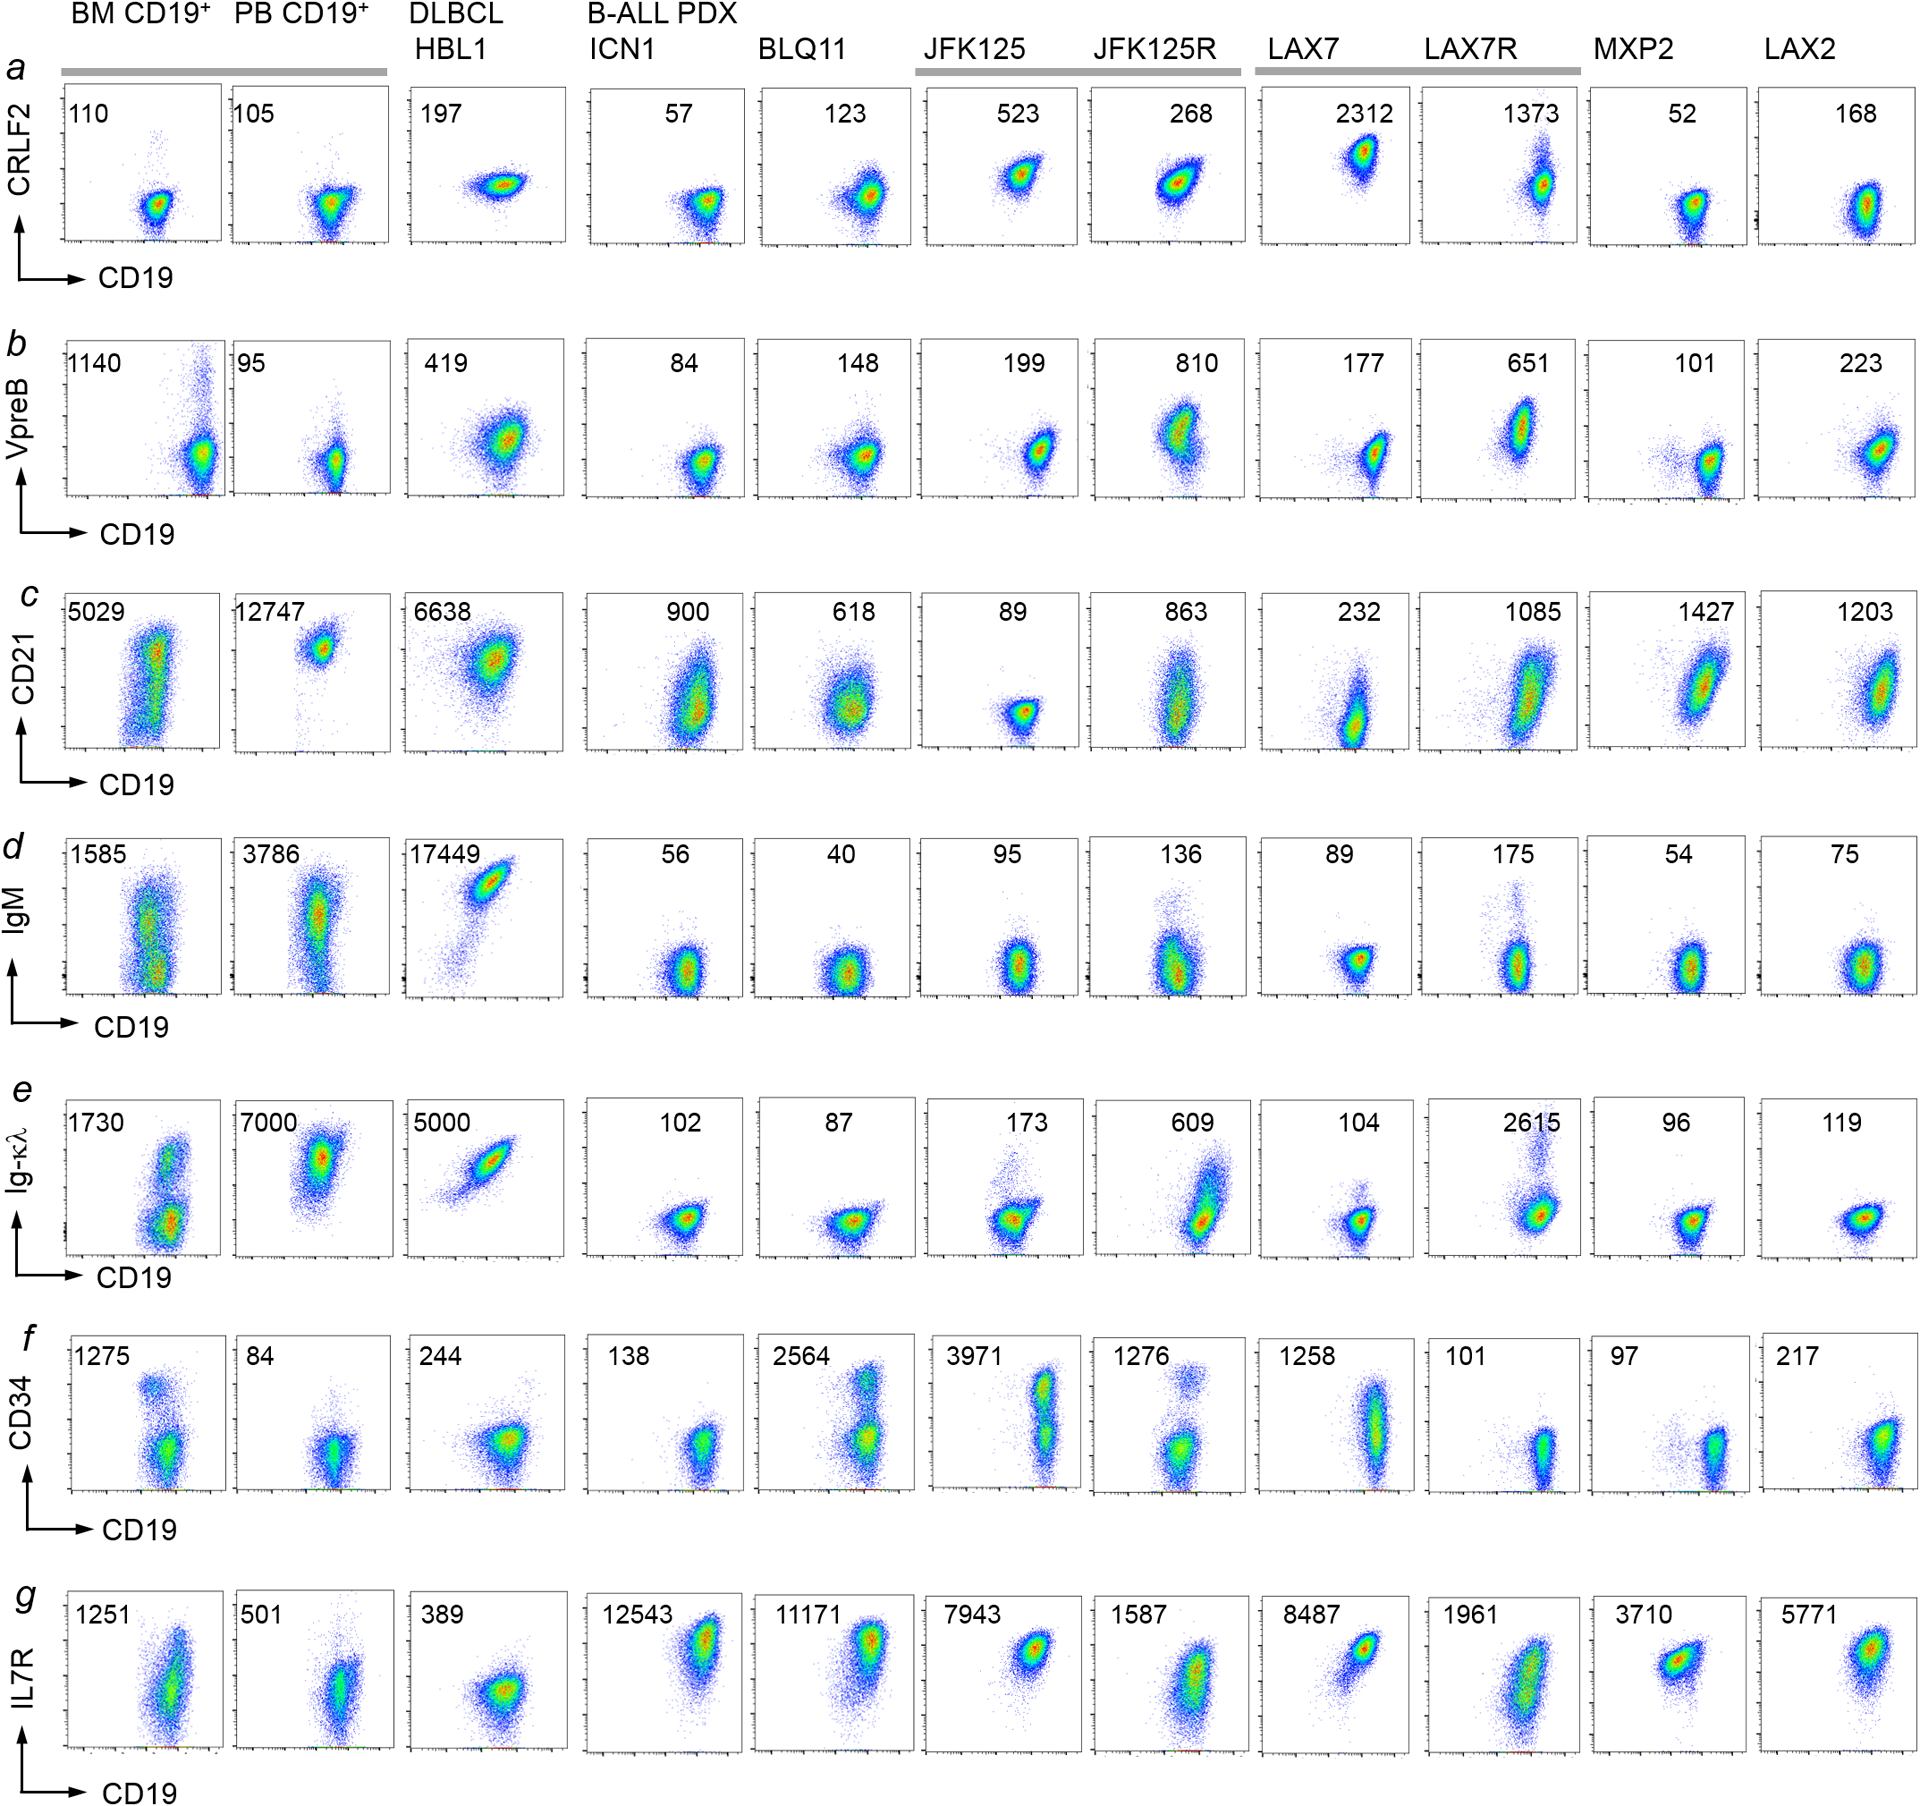
a-g, Eight different B-ALL PDX samples (Supplementary Table 5) were analyzed by flow cytometry for CRLF2 (a), VpreB (b), CD21 (c), IgM (d), Ig-κλ (e), CD34 (f) and IgM (g) surface expression. Normal CD19+ B-cell precursors from a normal bone marrow sample and mature B-cells from a normal peripheral blood sample, as well a mature B-cell lymphoma cell lines were used as reference. Representative FACS plots from 3 independent experiments.
Extended Data Figure 4. Phenotypic differences between B-ALL cells driven by oncogenic STAT5 or ERK reflect developmental rewiring during early B-cell development.
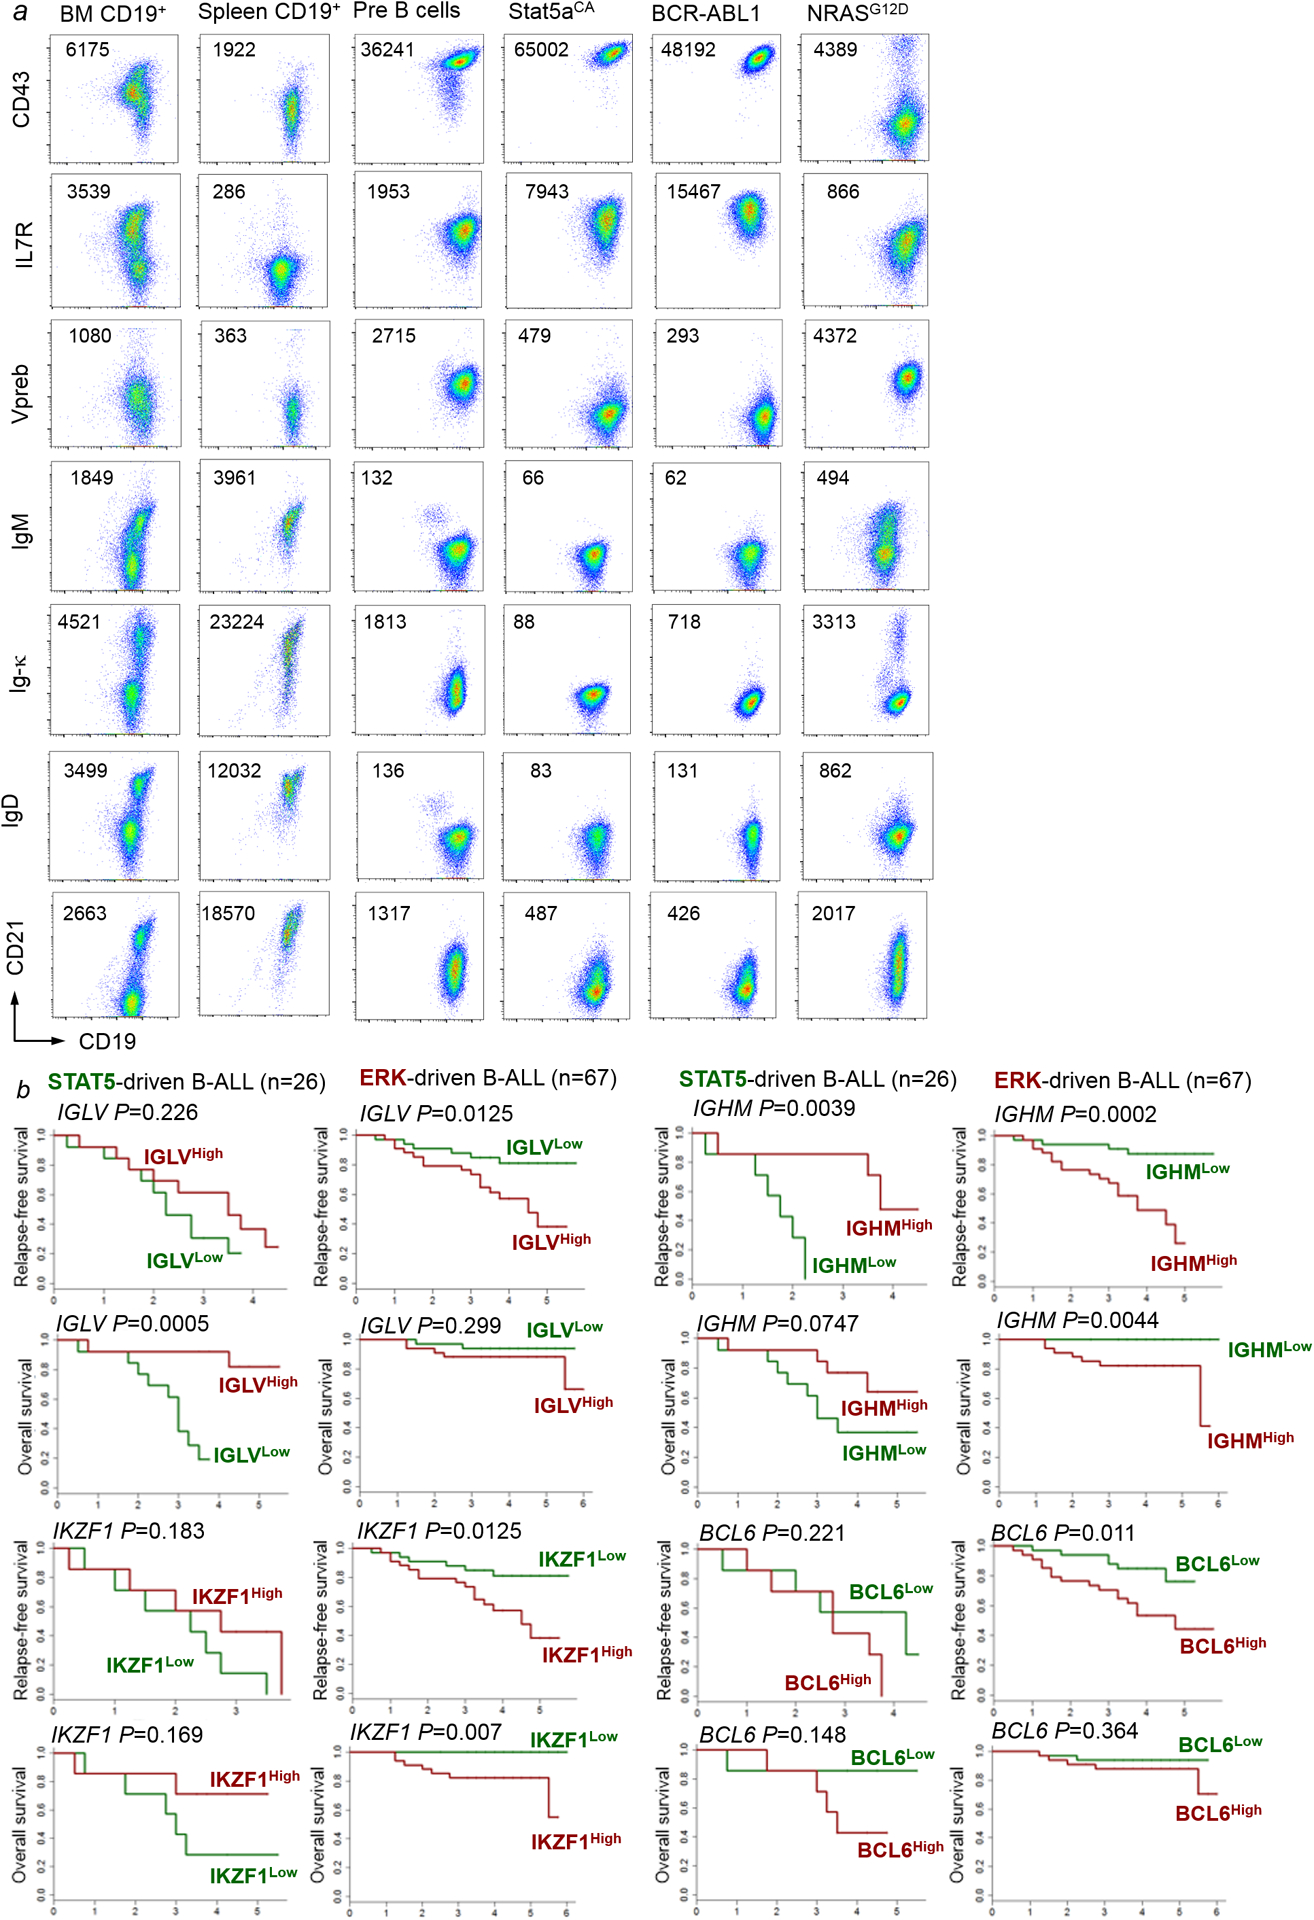
a, Murine B-cell precursors, Stat5-driven B-ALL cells, BCR-ABL1-driven B-ALL cells and NRAS-driven B-ALL cells were analyzed by flow cytometry for CD43, IL7R, VpreB, IgM, Ig-κ, IgD and CD21 surface expression. Normal CD19+ B-cell precursors from bone marrow cells and CD19+ spleen B-cells from wild-type mice were used as reference. Shown are representative FACS plots from 3 independent biological replicates. b, For STAT5-driven B-ALL cases (n=26) and ERK-driven B-ALL cases (n=67), mRNA levels of IGHM, IGLV, BCL6 and IKZF1 were studied from microarray results and associated with clinical outcome (COG P9906) at the time of diagnosis. Patients in each group were segregated into two based on higher vs lower than median mRNA levels for each of the four genes. Overall survival and relapse-free survival for the Kaplan-Meier plots are shown to compare relapse-free or overall survival for the higher- vs lower than median groups for IGHM, IGLV, BCL6 and IKZF1 as potential outcome predictors. Mantel-Cox log-rank test (two-sided) was used to determine statistical significance.
Extended Data Figure 5. Concurrent activation of STAT5 and ERK signaling induces B-cell senescence and cell death.
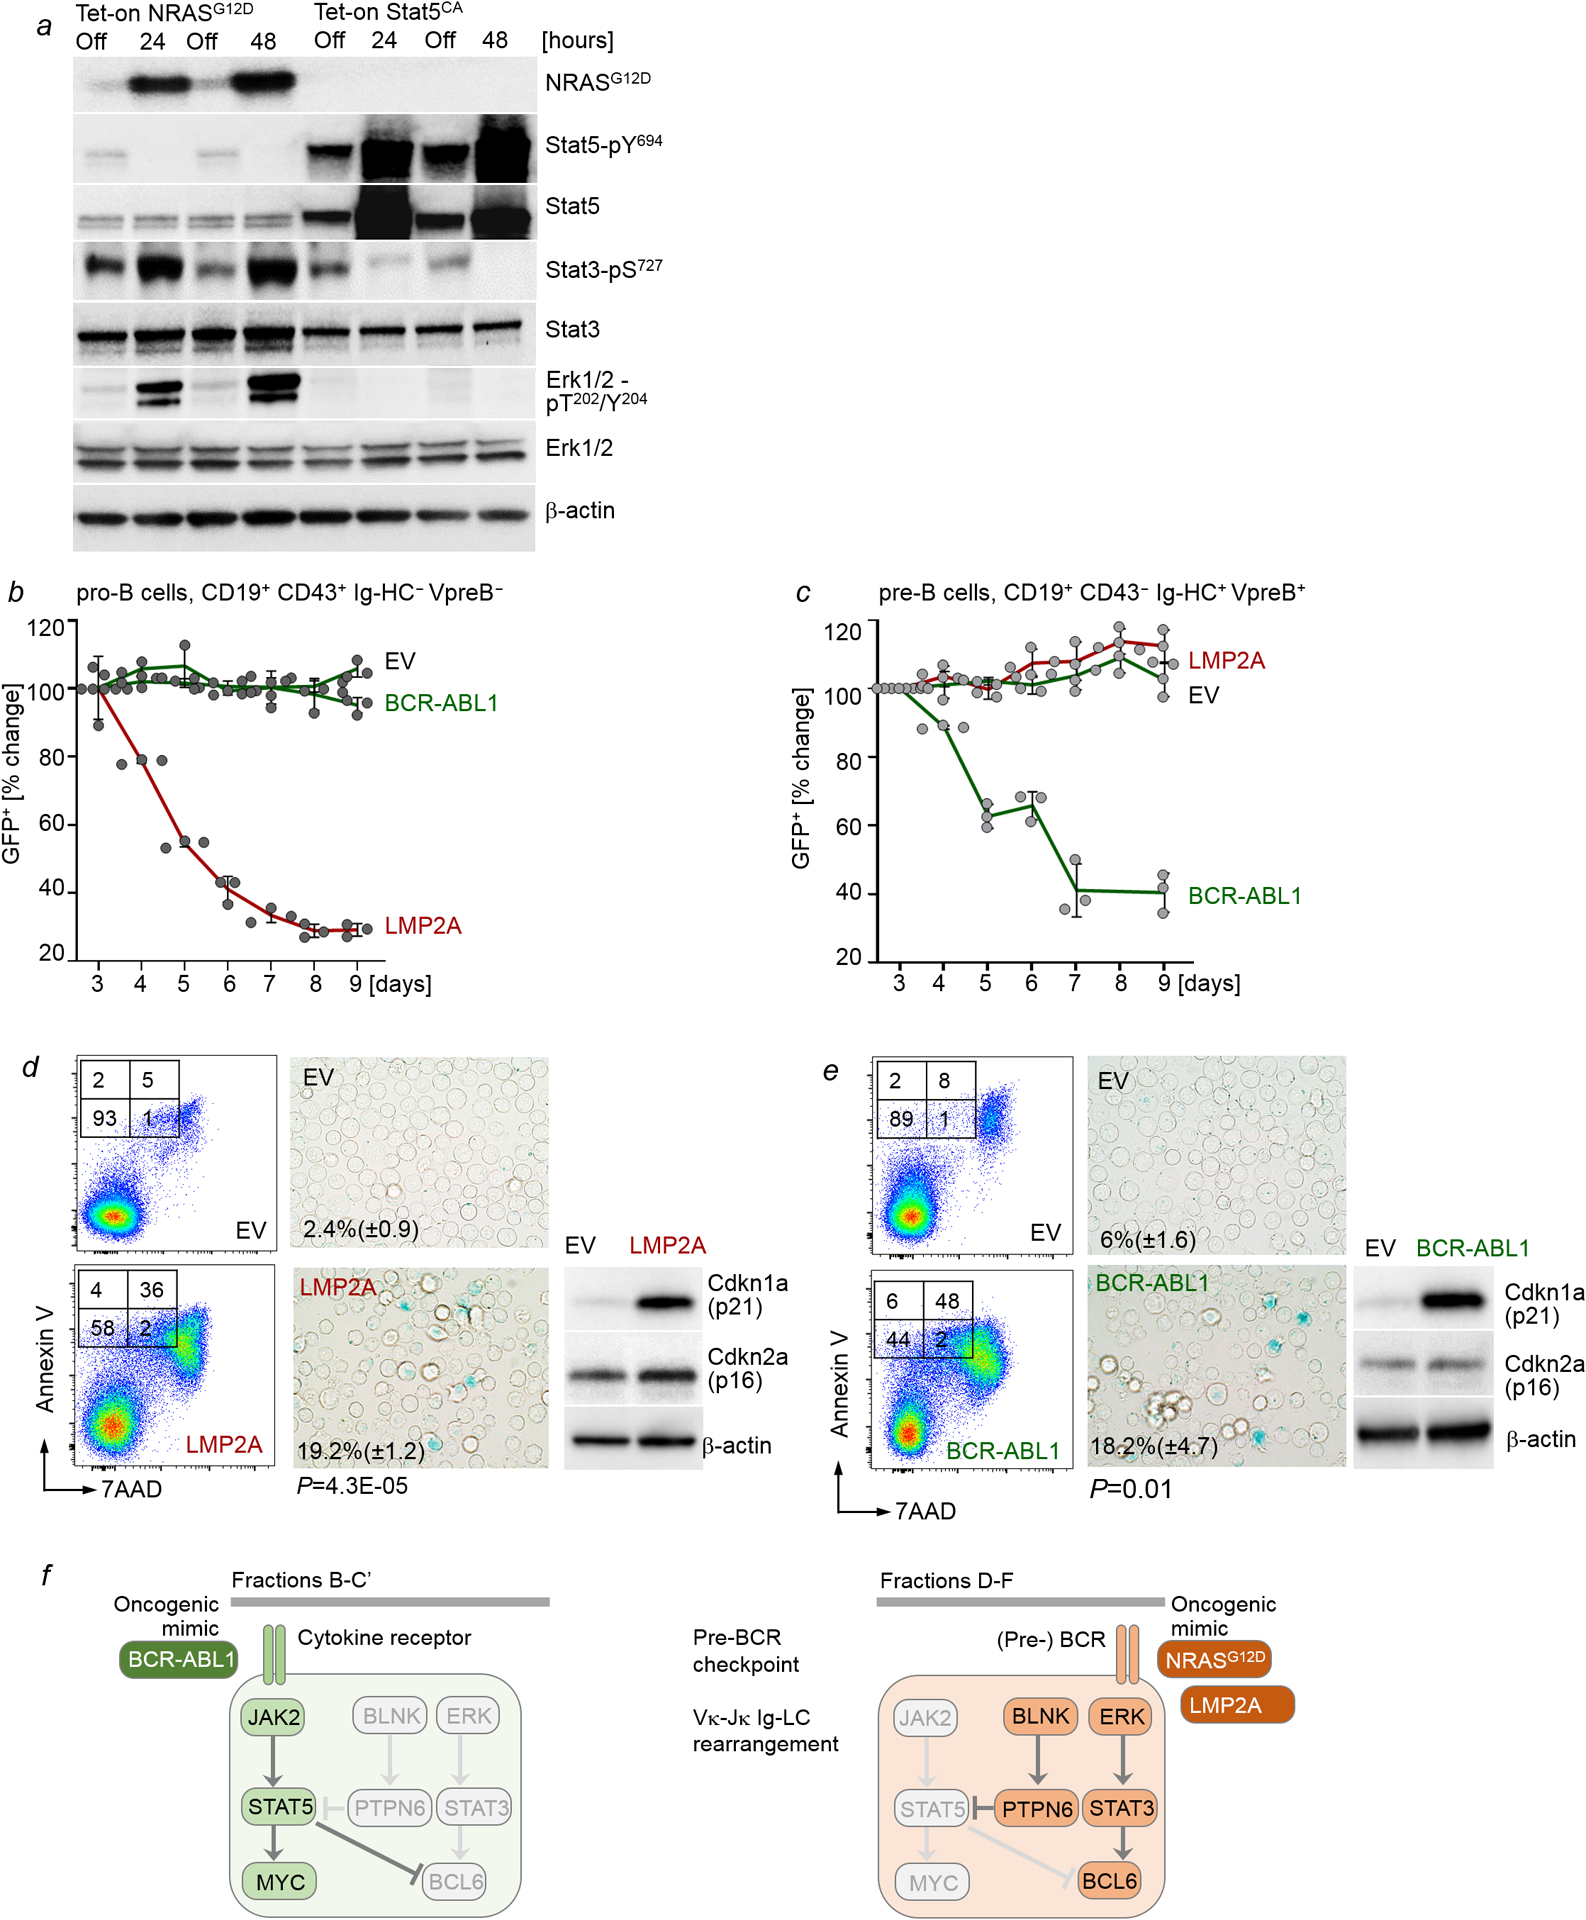
a, Levels of NRASG12D, phospho-Stat5-Y694, Stat5, phospho-Stat3-S727, Stat3, phospho-Erk1/2-T202/Y204 and Erk upon Dox-induced expression of NRASG12D or Stat5aCA (n=3 independent experiments). b,c, IL7-dependent mouse pro-B cells (b) or pre-B cells (d) were transduced with EV control, BCR-ABL1-GFP or LMP2A-GFP. Changes of proportions of GFP+ cells were monitored by flow cytometry (n=3 independent experiments, mean ± s.d.). d,e, Annexin V-7AAD and senescence β-galactosidase staining were performed with pro-B cells (d) and pre-B (e) expressing EV, LMP2A or BCR-ABL1 as indicated. Levels of p16 and p21 were examined. (n=3 independent experiments). Shown are representative FACS plots and images from 3 independent experiments. P-values were determined by two-tailed t-test. Quantification for senescence β-galactosidase staining: mean of % cells positive for staining ± s.d. f, Like in normal B cell development, B-ALL subtypes can be traced to specific differentiation stages with distinct requirements for survival and proliferation signals. For instance, pro-B cells depend on cytokine receptor signaling and activation of STAT5 but not ERK. Conversely, pre-B cells depend on pre-BCR signaling and activation of ERK but not STAT5. STAT5-driven B-ALL cells depend on oncogenic mimics of cytokine receptor signaling and resemble pro-B cells that depend on STAT5-activation downstream of cytokine receptors. Mimicking pre-BCR signaling at the pro-B to pre-B cell-transition, oncogenic RAS-signaling suppresses STAT5-signaling and induces de novo expression of BCL6. For gel source data, see Supplementary Fig. 1.
Extended Data Figure 6. Pharmacological inhibition of divergent pathways facilitates B-leukemogenesis.
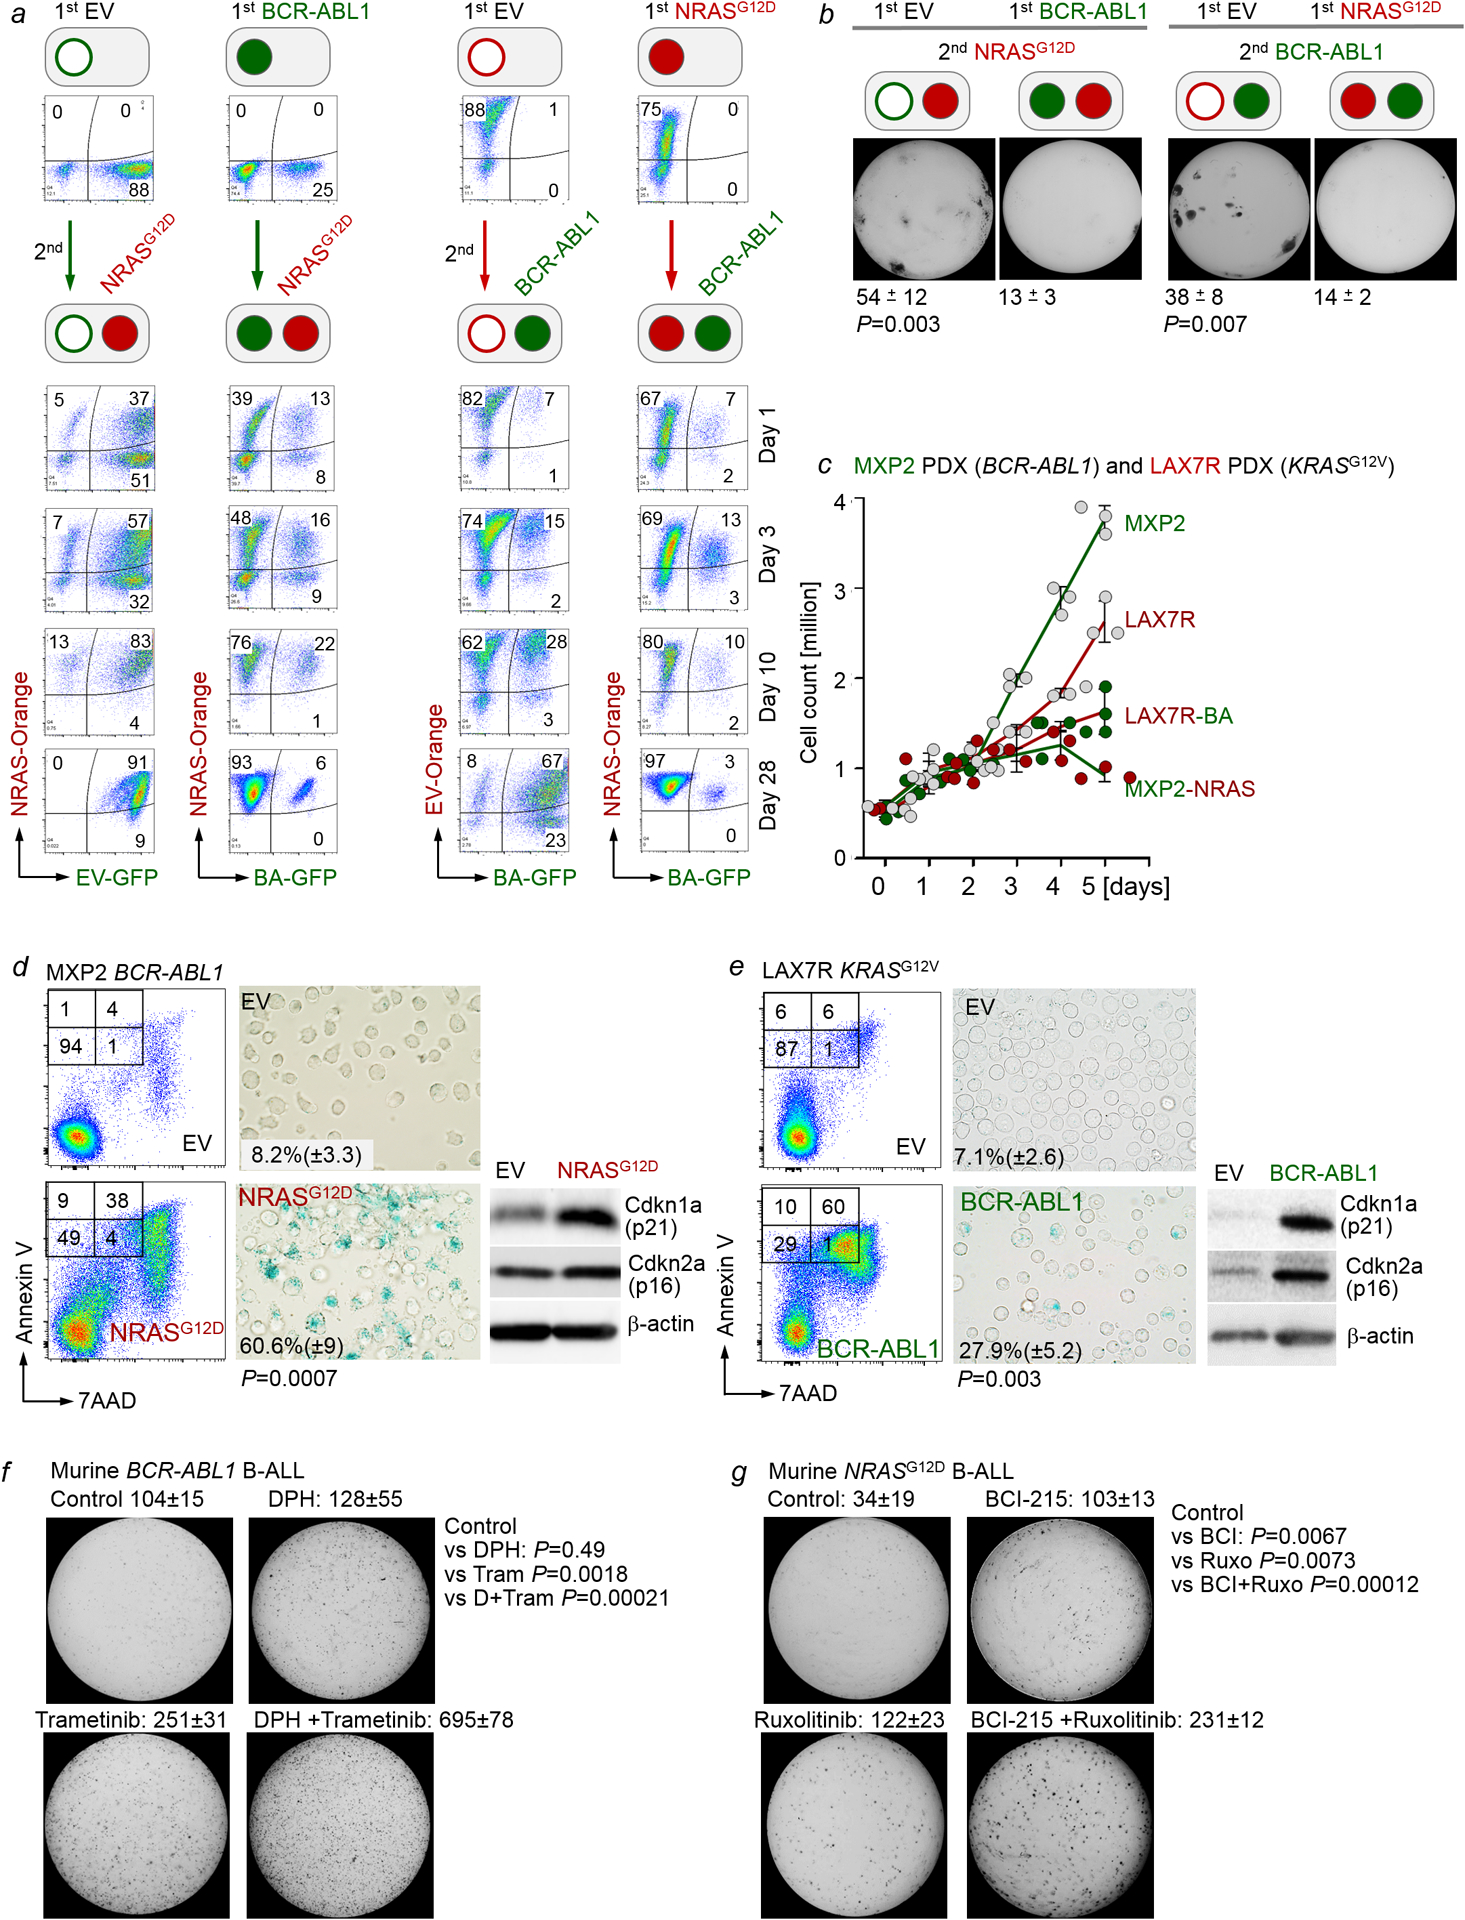
a, IL7-dependent pro-B cells were retrovirally transduced with EV-GFP, BCR-ABL1-GFP (BA-GFP), EV-Orange, or NRASG12D-Orange (NRAS-Orange). One week later, BA-GFP B-ALL cells were transduced with NRAS-Orange for concurrent activation of Erk and NRAS-Orange B-ALL cells were transduced with BA-GFP for concurrent activation of Stat5. The ability of oncogenic Stat5 (GFP+) and Erk (Orange+) signaling to contribute to the dominant clone was monitored by flow cytometry over time. Flow cytometry was performed to monitor the proportions of GFP+, Orange+, and double-positive cells at various time points following transductions. Representative FACS plots from 3 independent biological replicates. b, Cells from (a) were sorted for double-positive (GFP+ and Orange+) populations, and 10, 000 cells were seeded in methylcellulose for colony formation assays (10 days, n=3 independent biological replicates; mean ± s.d.). P=0.003 (left panel) and P=0.007 (right panel; two-tailed t-test). c-e, Patient-derived BCR-ABL1 B-ALL cells (MXP2) expressing Tet-on NRASG12D and patient-derived KRASG12V B-ALL cells (LAX7R) expressing Tet-On BCR-ABL1 were induced with Dox. Viable cell counts (c) were measured upon induction with doxycycline (Dox). Annexin V/7AAD and senescence β-galactosidase (d,e) staining were performed. Levels of p16 and p21 were also assessed (n=3 independent experiments). Shown are representative FACS plots and images from 3 independent experiments. P-values were determined by two-tailed t-test. Quantification for senescence β-galactosidase staining: mean of % cells positive for staining ± s.d. f, Murine wild-type BCR-ABL1 B-ALL cells were primed with vehicle control, DPH (1 μM), trametinib (1 nM) or DPH in combination with trametinib for 10 days prior to colony forming assays (n=3 independent biological replicates, mean ± s.d.) g, Murine wild-type NRASG12D B-ALL cells cultured in the presence of IL7 were primed with vehicle control, BCI-215 (0.5 μM), ruxolitinib (10 nM), or BCI-215 in combination with ruxolitinib for 10 days prior to colony forming assays (n=3 independent biological replicates, mean ± s.d.). P-values were determined by two-tailed t-test (f,g). For gel source data, see Supplementary Fig. 1.
Extended Data Figure 7. Central role of PTPN6 in enabling oncogenic ERK-signaling.
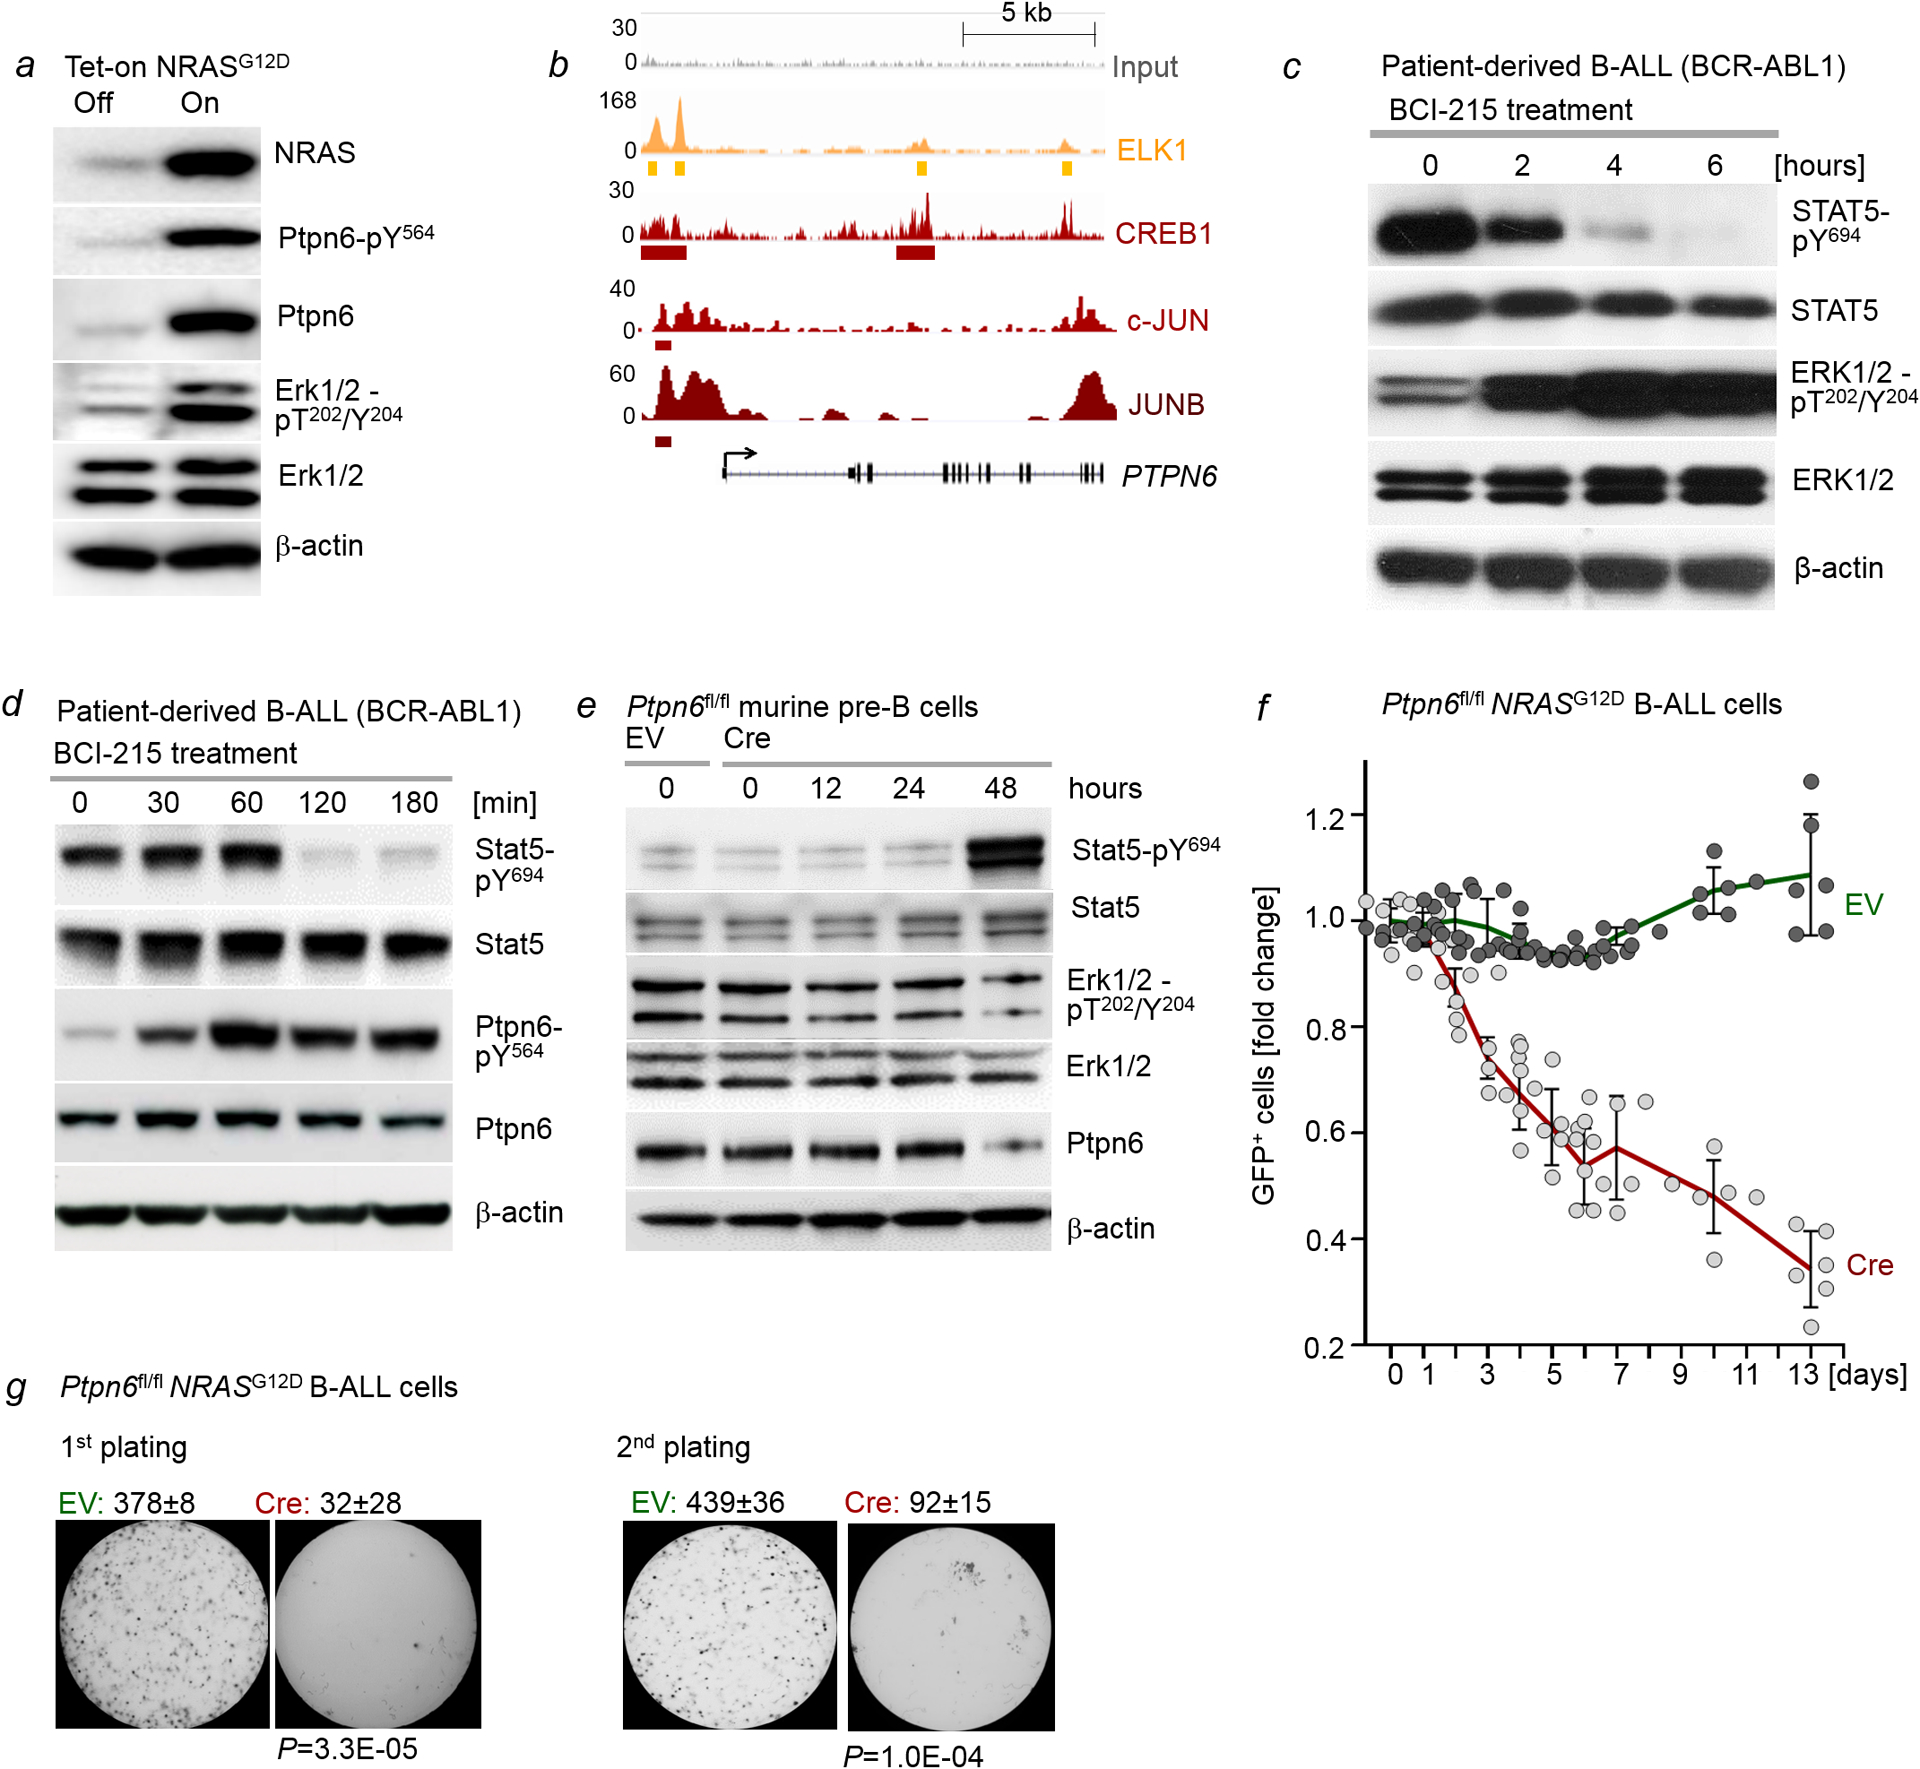
a, Levels of NRAS, Ptpn6-pY564, Ptpn6, Erk1/2-pT202/Y204 and Erk1/2 were assessed by Western blotting following Dox-induced expression of NRASG12D in murine pre-B cells (n=3 independent experiments). b, ChIP-seq analyses in human B lymphocytes (GM12878) obtained from the Encyclopedia of DNA Elements (ENCODE) revealed binding of ERK-dependent transcription factors ELK1, CREB1, c-JUN and JUNB to the PTPN6 locus. c, Patient-derived B-ALL cells (PDX2) were treated with BCI-215 (1 μmol/l). Levels of phospho-STAT5-Y694, STAT5, phospho-ERK1/2-T202/Y204 and ERK1/2 were measured by Western blotting upon treatment with BCI for various time points (n=3 independent experiments). d, Patient-derived B-ALL cells (PDX2) were treated with BCI-215 (1 μmol/l). Levels of phospho-STAT5-Y694, STAT5, phospho-Ptpn6-Y564 and Ptpn6 were measured by Western blotting upon treatment with BCI for various time points (n=3 independent experiments). e, Ptpn6fl/fl B-cell precursors were transduced with 4-OHT-inducible Cre or EV. Levels of Stat5-pY694, Stat5, Erk1/2-pT202/Y204, Erk1/2 and Ptpn6 were measured at various time points following induction (n=3 independent experiments). f, Ptpn6fl/fl B-cell precursors expressing NRASG12D were transduced with GFP-tagged, 4-OHT-inducible Cre or EV. Following induction with 4-OHT, enrichment or depletion of GFP+ cells was monitored by flow cytometry. Shown are average relative changes (mean ± s.d.) of GFP+ cells following induction and representative FACS plots (n=6 independent biological replicates). g, Quantification (n=3 independent experiments, mean ± s.d.) and representative images from serial replating assays of pre-B cells transduced with NRASG12D following Cre-mediated deletion of Ptpn6. 10, 000 cells were seeded in semi-solid methylcellulose and monitored for colony formation for 14 days. P-values were determined by two tailed t-test. For gel source data, see Supplementary Fig. 1.
Extended Data Figure 8. BLNK enables oncogenic ERK signaling at the expense of STAT5-MYC.
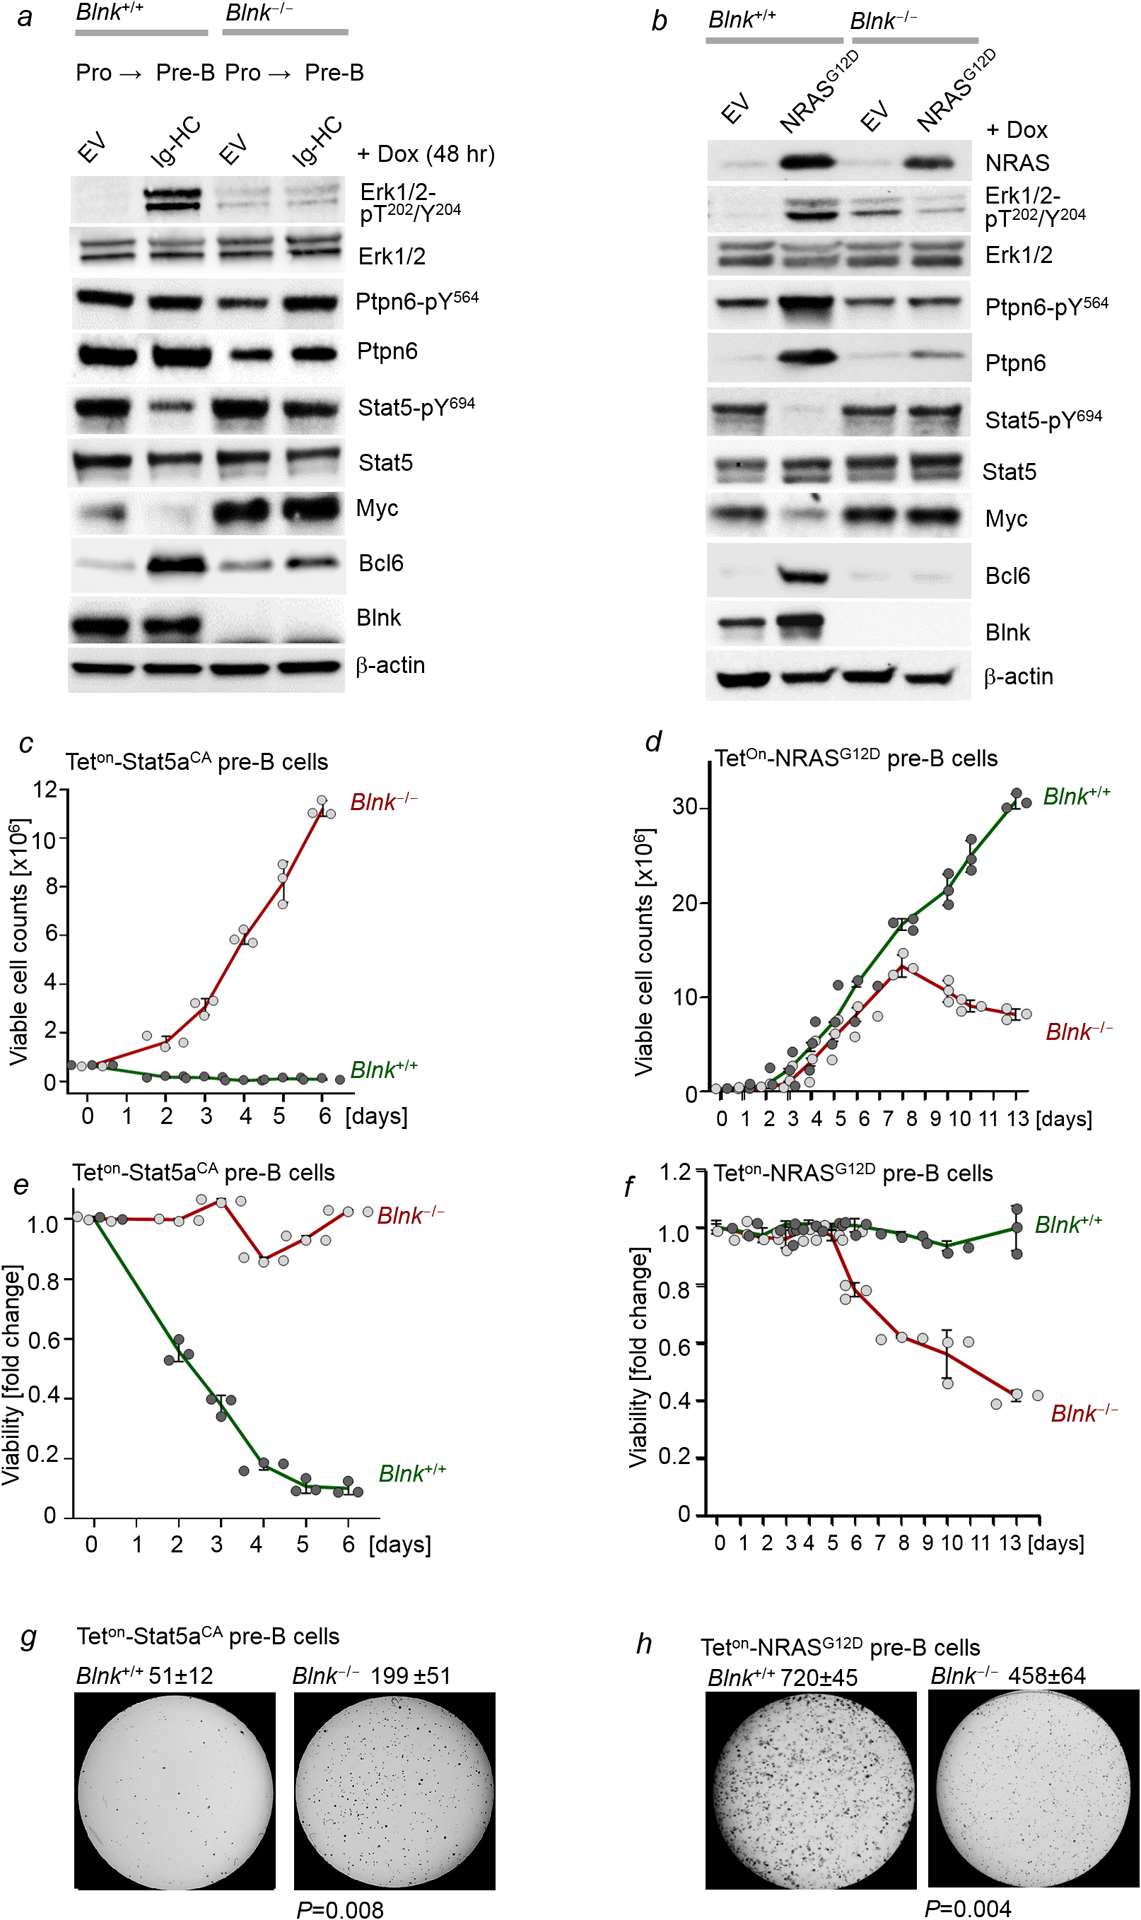
a, Blnk+/+ and Blnk−/− B-cell precursors expressing Dox-inducible Ig-HC were treated with Dox for 48 hr. Levels of phospho-Erk1/2-T202/Y204, Erk1/2, Ptpn6-pY564, Ptpn6, Stat5-pY694, Stat5, Myc, Bcl6 and Blnk were measured by Western blotting (n=3 independent experiments). b, Blnk+/+ and Blnk−/− B-cell precursors expressing Dox-inducible NRASG12D were treated with Dox for 48 hr. Levels of NRAS, phospho-Erk1/2-T202/Y204, Erk1/2, phospho-Ptpn6-Y564, Ptpn6, phospho-Stat5-Y694, Stat5, Myc, Bcl6 and Blnk were measured by Western blotting (n=3 independent experiments). c-f, Viable cell counts (c,d) and viability changes (e,f) were measured upon doxycycline (Dox)-induced expression of Stat5aCA or of NRASG12D in Blnk+/+ and Blnk−/− B-cell precursors at various time points (n=3 independent experiments; mean ± s.d.). g,h, Colony forming ability of Blnk+/+ and Blnk−/− B-cell precursors was assessed upon Dox-induced expression of Stat5aCA (g) or NRASG12D (h). 10,000 cells were plated, shown are mean ± s.d. values of 3 independent experiments and representative images. P-values were determined by two tailed t-test. For gel source data, see Supplementary Fig. 1.
Extended Data Figure 9. Divergent drug-responses in a STAT5- and ERK-driven pair of primary and relapse B-ALL.
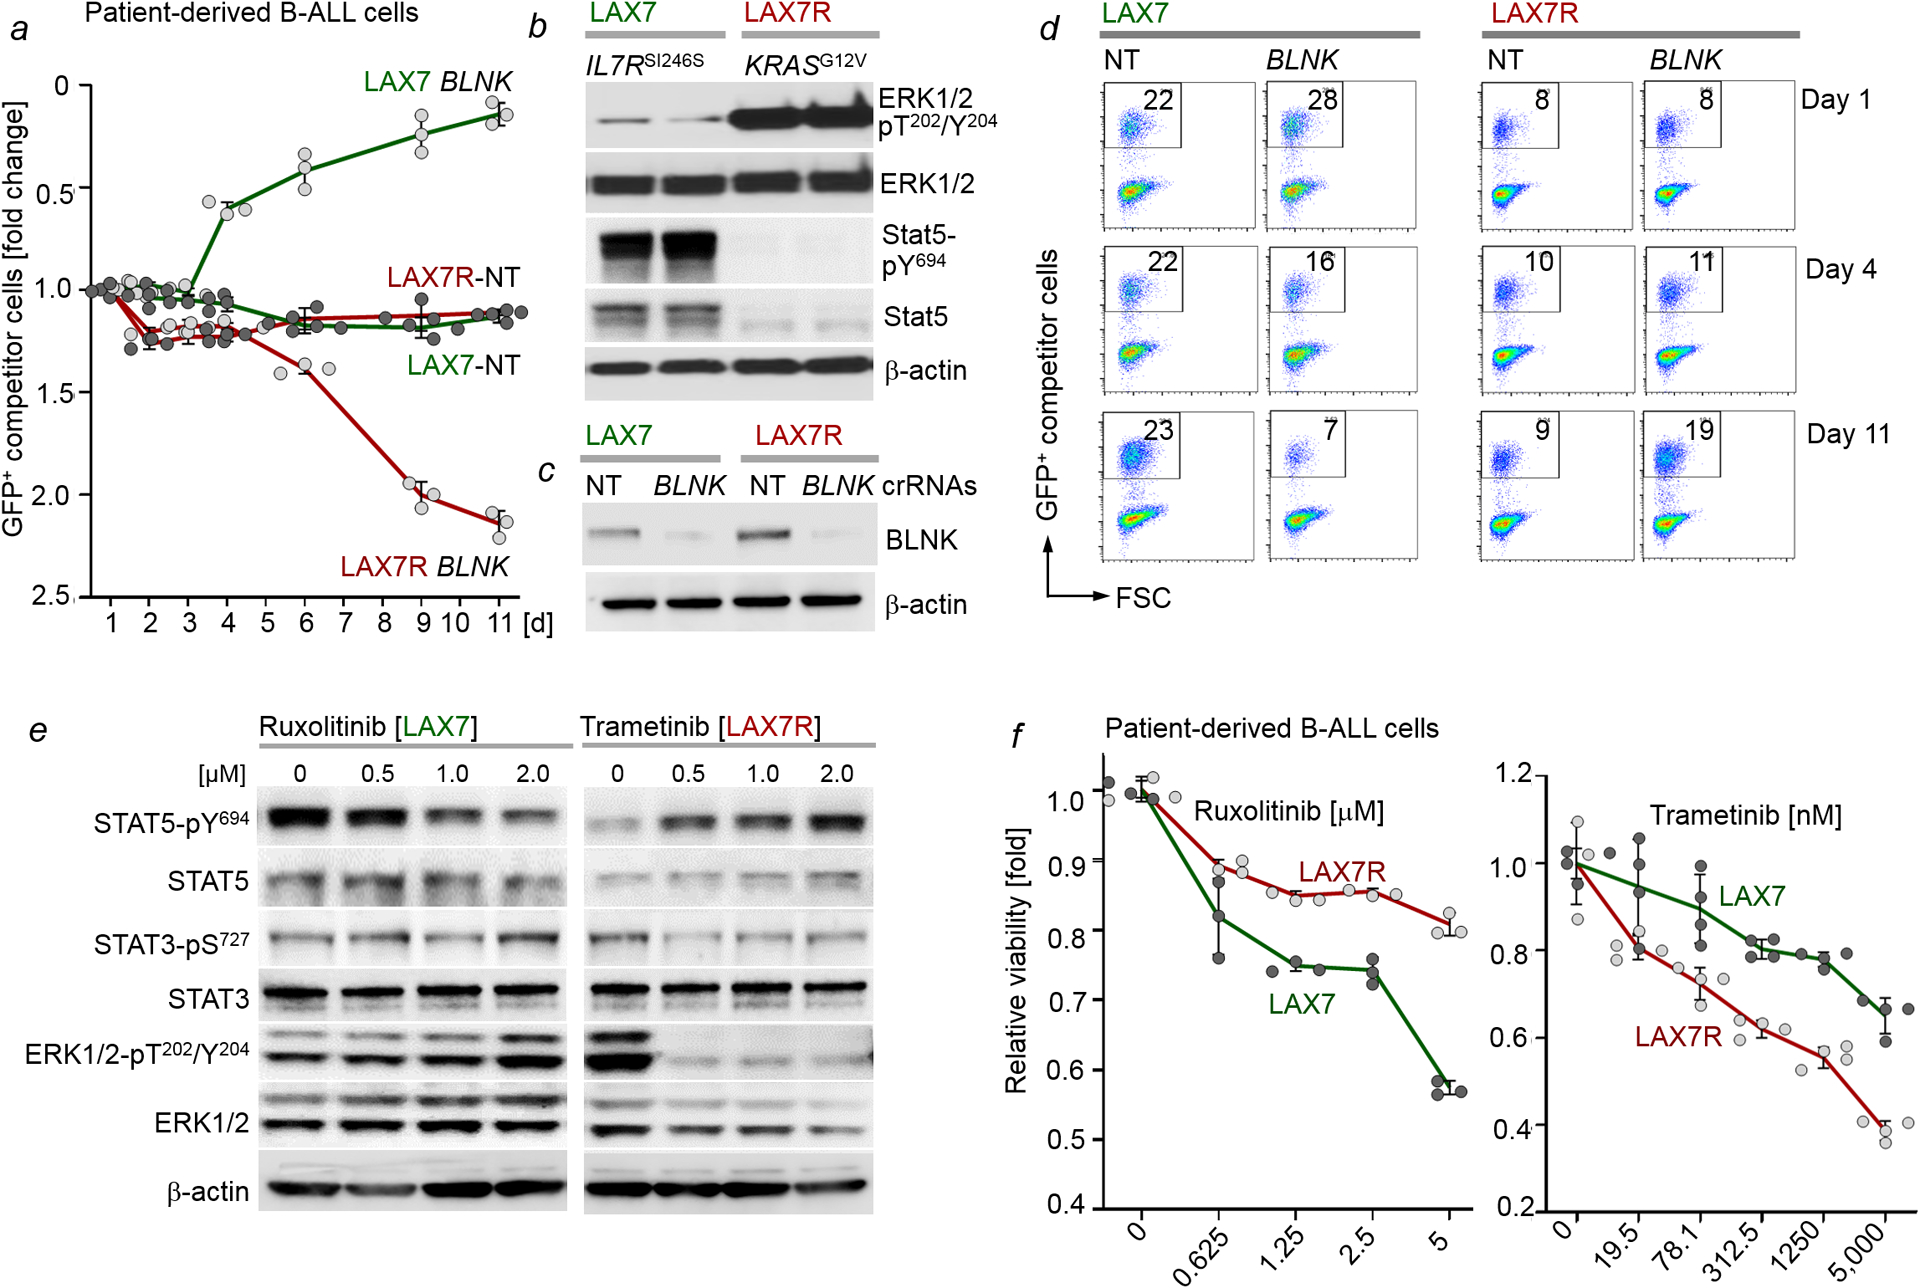
a-d, Electroporation of Cas9 ribonucleoproteins (RNPs), complexes of recombinant Cas9 with non-targeting (NT) guide RNAs or guide RNAs targeting BLNK, was performed to transfect a matched B-ALL pair from the same patient: LAX7 (at diagnosis; STAT5-driven, IL7RSI246S) and LAX7R (relapsed; ERK-driven, KRASG12V). Levels of ERK1/2-pT202/Y204, ERK1/2, STAT5-pY694 and STAT5 in patient-derived B-ALL cells (IL7RSI246S LAX7, at diagnosis; KRASG12V LAX7R, relapsed) were examined by Western blotting (b, n=3 independent experiments, shown are two of the technical replicates from an independent experiment). Efficiency of CRISPR/Cas9-mediated deletion of BLNK was assessed by Western blot (c). LAX7 and LAX7R cells transfected with Cas9/RNPs carrying NT or BLNK guide RNAs were mixed with GFP+ LAX7 and GFP+ LAX7R competitor cells, respectively. Enrichment or depletion of GFP+ cells was monitored by flow cytometry (n=3 independent experiments; a,d). Data, mean ± s.d. (note the direction of the y-axis is reverse, starting from fold change of 2.5, bottom). e, Western blotting analyses were performed to assess levels of STAT5-pY694, STAT5, STAT3-pS727, STAT3, ERK-pT202/Y204 and ERK upon treatment of LAX7 cells with ruxolitinib (left) or LAX7R cells with trametinib (right), n=3 independent experiments. f, Patient-derived B-ALL cells (LAX7 and LAX7R) were treated with increasing concentrations of ruxolitinib or trametinib for 72 hours. Relative viability (n=3; mean ± s.d.) was measured. For gel source data, see Supplementary Fig. 1.
Extended Data Figure 10. Pharmacological reactivation of suppressed divergent pathways as therapeutic strategy in B-ALL.
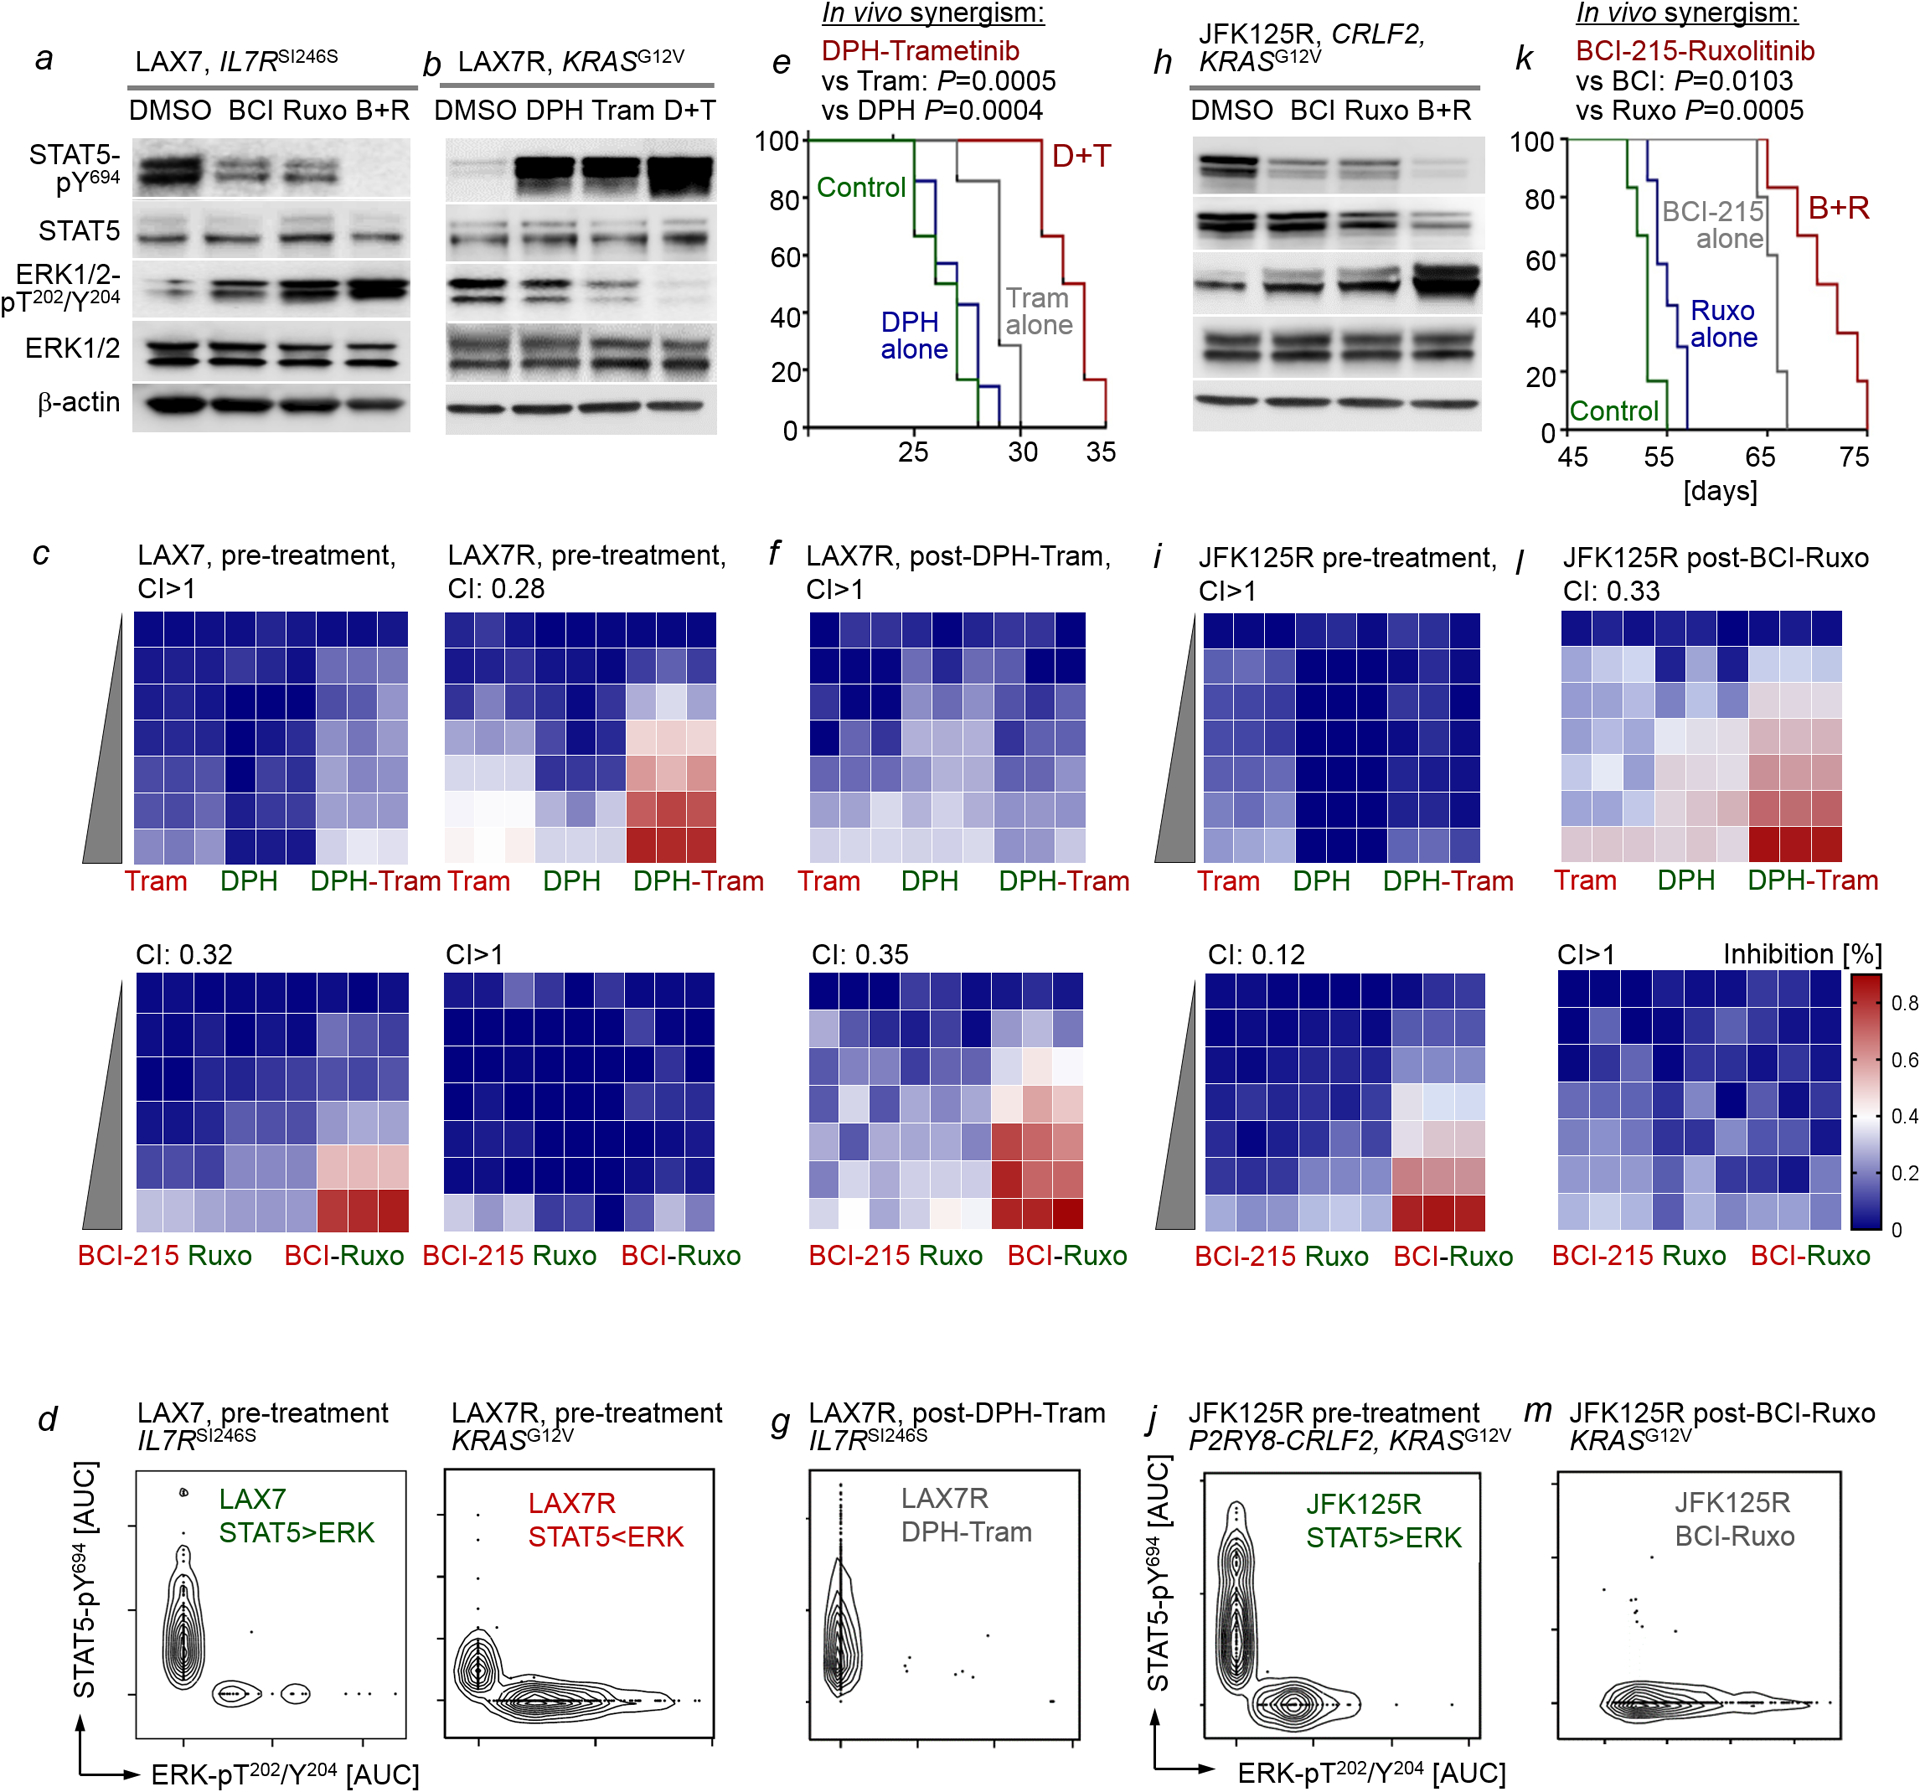
a,h, Patient-derived B-ALL cells (STAT5-driven) LAX7 (a) and JFK125R (h) were treated with vehicle control, BCI-215 (1 μM), ruxolitinib (500 nM), or a combination of BCI-215 and ruxolitinib. Western blotting was performed to measure levels of phospho-STAT5-Y694, STAT5, phospho-ERK1/2-T202/Y204 and ERK1/2 (n=3 independent experiments). b, Patient-derived B-ALL cells (ERK-driven, LAX7R) were treated with vehicle control, DPH (1 μM), trametinib (500 nM), or a combination of DPH and trametinib. Levels of phospho-STAT5-Y694, STAT5, phospho-ERK1/2-T202/Y204 and ERK1/2 were assessed (n=3 independent experiment). c,i, Patient-derived B-ALL cells, LAX7 and LAX7R (c) and JFK125R (i), were treated with increasing concentrations of BCI-215, ruxolitinib, a combination of both, DPH, trametinib, or a combination of both. Percentage growth inhibition at each concentration is shown as heatmaps (n=3 independent experiments). CI values were calculated to determine synergy for treatment combinations. DPH and trametinib concentrations used for both LAX7, LAX7R and JFK125R: (DPH, uM: 0, 0.16, 0.31, 0.63,1.3, 2.5, 5; trametinib, uM: 0, 0.032, 0.063, 0.13, 0.25, 0.5, 1). Ruxolitinib and BCI-215 concentrations used for LAX7: (Ruxo, uM: 0, 0.125, 0.25, 0.5, 1, 2; BCI-215, uM: 0, 0.04, 0.08, 0.16, 0.31, 0.63). Ruxolitinib and BCI-215 concentrations used for LAX7R and JFK125R: (Ruxo, uM: 0, 0.063, 0.125, 0.25, 0.5, 1, 2; BCI-215, uM, 0, 0.02, 0.04, 0.08, 0.16, 0.31, 0.63). d,j, Single-cell phosphoprotein analyses for phospho-STAT5-Y694 and phospho-ERK-T202/Y204 were performed for patient-derived B-ALL cells LAX7, LAX7R (d) and JFK125R (j) prior to in vivo treatment (n=3 independent experiments). e,k, Patient-derived LAX7R (e) or JFK125R (k) B-ALL cells were injected into sublethally irradiated (2Gy) NSG mice. Recipient mice injected with LAX7R were treated 6 times a week for 4 weeks with 2 mg/kg DPH, 0.5 mg/kg trametinib or a combination of both (e). Recipient mice injected with JFK125R were treated 5 times a week for 4 weeks with 2 mg/kg BCI-215, 30 mg/kg ruxolitinib or a combination of both (k). Mice were euthanized when they showed signs of overt leukemia (hunched back, weight loss and inability to move). Survival curves are shown (n=6 per group). To assess additive vs synergistic activity of single vs combination treatments in vivo, the Bliss independence model was adapted to survival analysis. With this approach, treatments are Bliss “independent” if the fraction of cells surviving combination therapy equals the product of fractions that survive the individual treatments. A Weibull distribution {exp[−(t/β)α]} was fitted to survival data for each condition, and distributions of survival benefits (treated survival time − untreated survival time) were computed for each treatment. Survival benefits of drug-1 and drug-2 were summed and added to the untreated survival distribution to compose a “sum of benefits” survival distribution (see Methods for details). f,g, l, and m, While combination treatments prolonged overall survival, transplant recipient mice ultimately developed overt leukemia. B-ALL that developed in mice bearing LAX7R (after treatment with DPH-trametinib; e) and JFK125R (after treatment with BCI-215-ruxolitinib; k) were isolated from bone marrow, suspended in cell culture medium and treated with increasing concentrations of BCI-215, ruxolitinib, a combination of both, DPH, trametinib, or a combination of both. Percentage growth inhibition at each concentration is shown as heatmaps (f, l, n=3 independent experiments). CI values were calculated to determine synergy for treatment combinations. To elucidate the clonal composition of LAX7R B-ALL post-treatment (e) and that of JFK125R post-treatment (k), single-cell phosphoprotein analyses for phospho-STAT5-Y694 and phospho-ERK-T202/Y204 were performed (g,m, n=3 independent experiments). For gel source data, see Supplementary Fig. 1.
Supplementary Material
Acknowledgments.
We would like to thank Lars Klemm, Franziska Auer and Janet Winchester for their help with some of the experiments and current and former members of the Müschen laboratory for their support and helpful discussions. Research in the Müschen laboratory is funded by the NIH through an NCI Outstanding Investigator Award R35CA197628 (to M.M.), R01CA157644 and R01CA213138 (to M.M.), a Wellcome Trust Senior Investigator Award (WT-101880) and a Leukemia and Lymphoma Scholar award (to M.M.), the Howard Hughes Medical Institute HHMI-55108547 (to M.M.), the Norman and Sadie Lee Foundation (for Pediatric Cancer, to M.M.), and the Falk Trust through a Falk Medical Research Trust Catalyst Award (to M.M.), the Pediatric Cancer Research Foundation (PCRF), the Cancer Research Institute (CRI) through a Clinic and Laboratory Integration Program (CLIP) grant (to M.M.) and the California Institute for Regenerative Medicine (CIRM) through DISC2-10061. M.M. is a Howard Hughes Medical Institute (HHMI) Faculty Scholar. T.S. is a Lymphoma Research Foundation Grantee. V.K. is supported by Career development fellow grant (5491-20) by Leukemia and Lymphoma Society and Young Investigator Award by Alex’s Lemonade Stand Foundation
Footnotes
Declaration of Interests
The authors have no competing interests.
References
- 1.Fearon ER et al. Clonal analysis of human colorectal tumors. Science 238, 193–197 (1987) [DOI] [PubMed] [Google Scholar]
- 2.Goetz C et al. STAT5 activation underlies IL7 receptor-dependent B cell development. J. Immunol 172, 4770–4778 (2004) [DOI] [PubMed] [Google Scholar]
- 3.Malin S et al. Role of STAT5 in controlling cell survival and immunoglobulin gene recombination during pro-B cell development. Nat. Immunol 11, 171–179 (2010) [DOI] [PMC free article] [PubMed] [Google Scholar]
- 4.Katerndahl CDS et al. Antagonism of B cell enhancer networks by STAT5 drives leukemia and poor patient survival. Nat. Immunol 18, 694–704 (2017) [DOI] [PMC free article] [PubMed] [Google Scholar]
- 5.Shaw AC et al. Activated Ras signals developmental progression of recombinase-activating gene (RAG)-deficient pro-B lymphocytes. J. Exp. Med 189, 123–129 (1999) [DOI] [PMC free article] [PubMed] [Google Scholar]
- 6.Irving J et al. Ras pathway mutations are prevalent in relapsed childhood acute lymphoblastic leukemia and confer sensitivity to MEK inhibition. Blood 124, 3420–3430 (2014) [DOI] [PMC free article] [PubMed] [Google Scholar]
- 7.Anderson LJ et al. EBV LMP2A provides a surrogate pre-B cell receptor signal through constitutive activation of the ERK/MAPK pathway. J. Gen. Virol 89, 1563–1568 (2008). [DOI] [PMC free article] [PubMed] [Google Scholar]
- 8.Feldhahn N et al. Mimicry of a constitutively active pre-B cell receptor in acute lymphoblastic leukemia cells. J. Exp. Med 201, 1837–1852 (2005) [DOI] [PMC free article] [PubMed] [Google Scholar]
- 9.Yasuda T et al. Erk kinases link pre-B cell receptor signaling to transcriptional events required for early B cell expansion. Immunity 28, 499–508 (2008) [DOI] [PubMed] [Google Scholar]
- 10.Shojaee S et al. PTEN opposes negative selection and enables oncogenic transformation of pre-B cells. Nat. Med 22, 379–387 (2016) [DOI] [PMC free article] [PubMed] [Google Scholar]
- 11.Martincorena I et al. Somatic mutant clones colonize the human esophagus with age. Science 362, 911–917 (2012) [DOI] [PMC free article] [PubMed] [Google Scholar]
- 12.Mandal M et al. Ras orchestrates exit from the cell cycle and light-chain recombination during early B cell development. Nat. Immunol 10, 1110–1117 (2009) [DOI] [PMC free article] [PubMed] [Google Scholar]
- 13.Duy C et al. BCL6 is critical for the development of a diverse primary B cell repertoire. J. Exp. Med 207, 1209–1221 (2010) [DOI] [PMC free article] [PubMed] [Google Scholar]
- 14.Geng H et al. Self-enforcing feedback activation between BCL6 and pre-B cell receptor signaling defines a distinct subtype of acute lymphoblastic leukemia. Cancer Cell. 27: 409–425 (2015) [DOI] [PMC free article] [PubMed] [Google Scholar]
- 15.Swaminathan S et al. Mechanisms of clonal evolution in childhood acute lymphoblastic leukemia. Nat. Immunol 16, 766–774 (2015) [DOI] [PMC free article] [PubMed] [Google Scholar]
- 16.Walker SR et al. STAT5 outcompetes STAT3 to regulate the expression of the oncogenic transcriptional modulator BCL6. Mol Cell Biol. 33, 2879–2890 (2013) [DOI] [PMC free article] [PubMed] [Google Scholar]
- 17.Korotchenko VN et al. In vivo structure-activity relationship studies support allosteric targeting of a dual specificity phosphatase. Chembiochem. 15, 1436–1445 (2014) [DOI] [PMC free article] [PubMed] [Google Scholar]
- 18.Shojaee S et al. Erk negative feedback control enables pre-B cell transformation and represents a therapeutic target in acute lymphoblastic leukemia. Cancer Cell 28, 114–128 (2015) [DOI] [PMC free article] [PubMed] [Google Scholar]
- 19.Yang J et al. Discovery and characterization of a cell-permeable, small-molecule c-Abl kinase activator that binds to the myristoyl binding site. Chem. Biol 18, 177–186 (2011) [DOI] [PubMed] [Google Scholar]
- 20.Heltemes-Harris LM et al. Sleeping Beauty transposon screen identifies signaling modules that cooperate with STAT5 activation to induce B-cell acute lymphoblastic leukemia. Oncogene 35, 3454–3464 (2016) [DOI] [PMC free article] [PubMed] [Google Scholar]
- 21.Porpaczy E et al. Aggressive B-cell lymphomas in patients with myelofibrosis receiving JAK1/2 inhibitor therapy. Blood 132,694–706 (2018) [DOI] [PMC free article] [PubMed] [Google Scholar]
- 22.Xiao W et al. Tumor suppression by phospholipase C-beta3 via SHP-1-mediated dephosphorylation of Stat5. Cancer Cell 16, 161–171 (2009) [DOI] [PMC free article] [PubMed] [Google Scholar]
- 23.Fusaki N et al. BLNK is associated with the CD72/SHP-1/Grb2 complex in the WEHI231 cell line after membrane IgM cross-linking. Eur. J. Immunol 30, 1326–1330 (2000) [DOI] [PubMed] [Google Scholar]
- 24.Imamura Y et al. BLNK binds active H-Ras to promote B cell receptor-mediated capping and ERK activation. J. Biol. Chem 284, 9804–9813 (2009) [DOI] [PMC free article] [PubMed] [Google Scholar]
- 25.Koch R et al. Biomarker-driven strategy for MCL1 inhibition in T-cell lymphomas. Blood. 133, 566–575 (2019) [DOI] [PMC free article] [PubMed] [Google Scholar]
- 26.Bliss CI The toxicity of poisons applied jointly. Ann Appl Biol. 26, 585–615 (1939) [Google Scholar]
- 27.Weibull W A statistical distribution function of wide applicability. J Appl Mech 18, 293–297 (1951) [Google Scholar]
Associated Data
This section collects any data citations, data availability statements, or supplementary materials included in this article.
Supplementary Materials
Data Availability Statement
Gel scans are provided in Supplementary Fig. 1. All other data are available from the corresponding author upon reasonable request. The GEO accession number for the gene expression profiles of diagnostic samples from 207 patients (COH P9906) is GSE11877. ChIP-seq data obtained from human B lymphocytes (GM12878) was obtained from the Encyclopedia of DNA Elements (ENCODE). Code for mutual exclusivity analyses are available on GitHub at https://github.com/muschenlab/Stat5-vs-Erk under the MIT license, which allows for reuse and distribution. Further information and requests for reagents may be directed to and will be fulfilled by the Lead Contact, Markus Müschen (mmuschen@coh.org).


