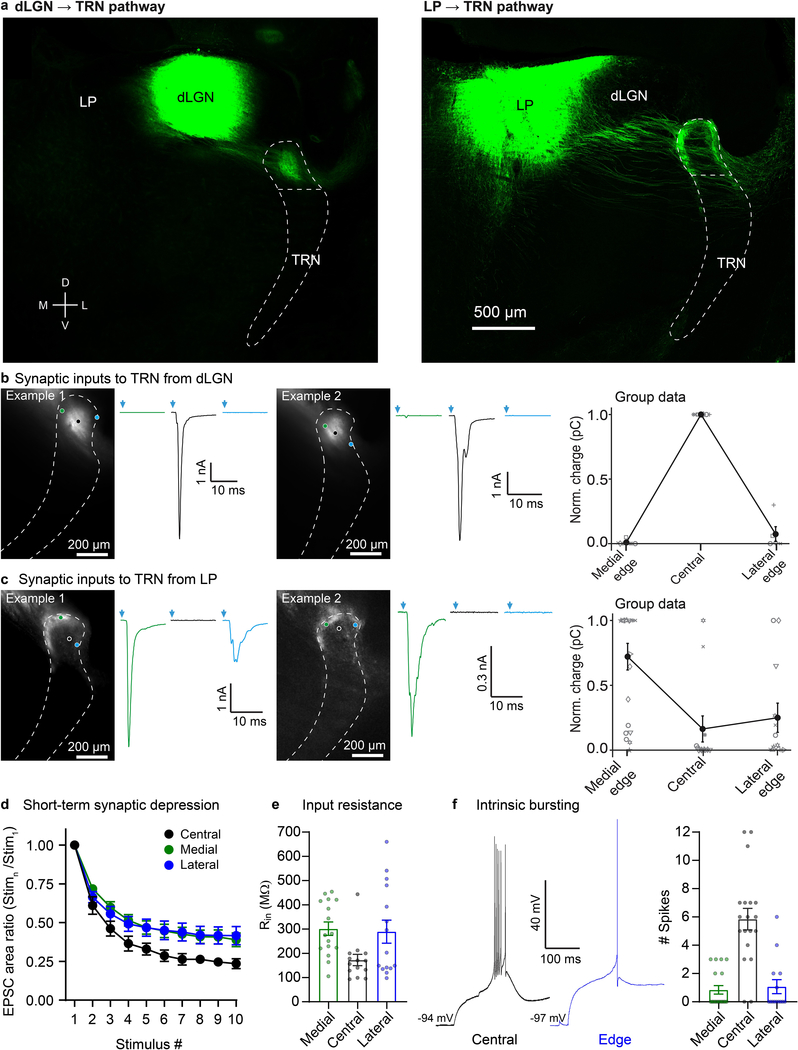
Extended Data Figure 9. Visual TRN and somatosensory TRN have similar center and edge subcircuits.
a, Representative images showing dLGN and LP injection sites and anterograde projections to TRN. dLGN projects to the central zone whereas LP projects to the edges of the visual sector of TRN. This experiment was replicated in 5 mice with dLGN viral injections, and in 13 mice with LP viral injections.
b, Two representative examples (left and middle panels) of synaptic responses from cells across the medial-lateral axis of visual TRN evoked by photostimulation of dLGN. Cells in the center of visual TRN received strong input from dLGN, whereas inputs to cells located near the edges of TRN were very weak or undetectable (average of 10 sweeps, −84 mV). Right, relationship between soma location in TRN and synaptic response amplitude (n=19 cells, 6 slice preparations, each preparation represented by a different symbol shape; means for the 3 zones are represented by filled symbols and connected by lines), showing that cells in the center of visual TRN respond strongly to dLGN input and those in the medial and lateral edges have minimal dLGN inputs (as in Fig. 2, and Extended Data Fig. 4).
c, Same as (b) except characterizing synaptic inputs to TRN from LP. Cells along the medial edge (and in some cases along the lateral edge) of visual TRN received strong input from LP. In contrast, cells located in the center of visual TRN generally had weak or no responses to LP input (average of 10 sweeps, −84 mV; n=49 cells,12 preps).
d, Dynamic properties of visual thalamoreticular responses. To study short-term synaptic depression, photostimulation intensities were chosen to evoke ~2.5 nA peak responses (average LED powers: 20.8 mW for LP, 6.6 mW for dLGN). EPSC areas were measured over the first 10 ms of each response. Short-term depression was more pronounced for the central cells than the edge cells (p < 0.0001, ANOVA, stim. 2–10). Depression in the two edge cell groups did not differ (two-tailed Bonferroni’s t-test, all p>0.99). Depression of dLGN-evoked responses in central cells was stronger than depression of LP-evoked responses in medial or lateral cells (two-tailed Bonferroni’s t-test; central vs. medial, central vs. lateral, both p<0.0001; central group: 7 cells, 5 mice; medial group: 17 cells, 11 mice; lateral group: 7 cells, 7 mice). Analogous to subcircuits of the somatosensory TRN, dLGN-evoked EPSCs of central cells in the visual TRN were less prolonged than LP-evoked EPSCs of edge cells (not shown). For example, the ratio of the EPSC areas to the peak EPSC amplitudes (as in Fig. 3b) varied as a function of cell group (ANOVA, p<0.009; central cells ratio = 2.74 ± 0.24; medial cells ratio = 5.27 ± 0.49; lateral cells ratio = 5.14 ± 0.60, same cells as for short-term depression analysis, above). The two edge groups did not differ (two-tailed Bonferroni’s t-test, p=0.99). Central cell ratios were significantly lower than medial and lateral cell ratios (two-tailed Bonferroni’s t-test, p<0.009, <0.05, respectively).
e, Input resistances of medial edge (n=16 cells, 14 mice), central (n=14 cells, 13 mice), and lateral edge cells (n=15 cells, 13 mice) varied as a function of cell group (p<0.03, ANOVA). The two edge groups were not different from one another (two-tailed Bonferoni’s t-test, p=0.99). Central cell input resistance was significantly different from medial, although not from lateral (two-tailed Bonferroni’s t-tests, p<0.04 and p=0.074, respectively).
f, Central cells of visual TRN had more robust intrinsic bursting than those along the edges. Left, representative stimulus-offset bursts. Right, average number of spikes during bursts was 5.8 ± 0.76 for central cells (n=19 cells, 15 mice), 0.8 ± 0.30 for medial cells (n=19 cells, 14 mice), and 1.1 ± 0.50 for lateral cells (n=14 cells, 12 mice) (p<0.0001, ANOVA). The two edge groups were not different from one another (two-tailed Bonferoni’s t-test, p=0.99), but the edge cells discharged far fewer spikes per burst than the central cells (two-tailed Bonferoni’s t-test, p<0.0001 for both medial vs. central cells and lateral vs. central cells). For the experiments represented in this figure, the boundaries of the TRN were determined using either tdTomato expression driven by SOM-Cre or PV-Cre, IHC for PV, or brightfield images. Data expressed as mean ± SEM.

