

Abstract
Mice lacking the superoxide anion scavenger CuZn superoxide dismutase (Sod1−/− mice) develop a number of age-related phenotypes, including an early progression of muscle atrophy and weakness (sarcopenia) associated with loss of innervation. The purpose of this study was to delineate the early development of sarcopenia in the Sod1−/− mice and to measure changes in the muscle transcriptome, proteome, and eicosanoid profile at the stage when sarcopenia is markedly induced in this model (7–9 months of age). We found a strong correlation between muscle atrophy and mitochondrial state 1 hydroperoxide production, which was 40% higher in isolated mitochondria from Sod1−/− mouse gastrocnemius muscle by 2 months of age. The primary pathways showing altered gene expression in Sod1−/− mice identified by RNA-seq transcriptomic analysis are protein ubiquitination, synaptic long-term potentiation, calcium signaling, phospholipase C signaling, AMPK, and TWEAK signaling. Targeted proteomics shows elevated expression of mitochondrial proteins, fatty acid metabolism enzymes, tricarboxylic acid (TCA) cycle enzymes, and antioxidants, while enzymes involved in carbohydrate metabolism are downregulated in Sod1−/− mice. LC-MS analysis of lipids in gastrocnemius muscle detected 78 eicosanoids, of which 31 are significantly elevated in muscle from Sod1−/− mice. These data suggest that mitochondrial hydroperoxide generation is elevated prior to muscle atrophy and may be a potential driving factor of changes in the transcriptome, proteome, and eicosanoid profile of the Sod1−/− mice. Together, these analyses revealed important molecular events that occur during muscle atrophy, which will pave the way for future studies using new approaches to treat sarcopenia.
Electronic supplementary material
The online version of this article (10.1007/s11357-020-00189-x) contains supplementary material, which is available to authorized users.
Keywords: Sarcopenia, Aging, Oxidative stress, Muscle atrophy, Reactive oxygen species (ROS), Sod1 knockout mice
Introduction
Age related loss of muscle mass and function (sarcopenia) occurs in more than 50% of individuals over the age of 80 (Cruz-Jentoft et al. 2010). Sarcopenia greatly reduces quality of life in elderly individuals and results in a tremendous financial burden (Janssen et al. 2004; Roubenoff and Hughes 2000). Previous studies from our laboratory clearly show that the primary phenotypes of sarcopenia found in older human subjects and in old wild-type mice, e.g., atrophy, loss of muscle innervation, mitochondrial dysfunction and reactive oxygen species (ROS) production, and reduced contractile force generation (Ivannikov and Van Remmen 2015; Jackson 2006; Jang et al. 2012; Jang et al. 2010; Larkin et al. 2011; Mansouri et al. 2006), are recapitulated in young adult mice lacking the CuZn superoxide dismutase gene (Sod1−/− mice). There is also a strong correlation between muscle mitochondrial hydroperoxide production and the amount of muscle mass lost during aging and in the Sod1−/− mice (Muller et al. 2007), which supports a role for oxidative stress in sarcopenia (Appell et al. 1997; Loehr et al. 2016; McClung et al. 2009; Powers et al. 2016; Whidden et al. 2010). However, the exact causal mechanisms for the development of sarcopenia are not fully elucidated.
Aged wild-type mice typically do not show a robust sarcopenia phenotype until the later stages of life (26 months or older). For this reason, the Sod1−/− mouse model, which develops many of the pathologies that occur in aged muscle by approximately 8 months of age, is an important tool for studying sarcopenia and for testing potential interventions. Specifically, Sod1−/− mice show many hallmarks of age-related muscle frailty such as loss of muscle mass and strength, loss of skeletal muscle innervation, and increased skeletal muscle protein breakdown (Ivannikov and Van Remmen 2015; Jackson 2006; Larkin et al. 2011). Similar to old mice (Gillon et al. 2018; Piekarz et al. 2020), Sod1−/− mice show neuromuscular junction degeneration and reduced muscle strength (Shi et al. 2014) and motor neuron loss (unpublished data). The Sod1−/− mouse model also shows other aging phenotypes including early impairments in cognition (Logan et al. 2019), hair loss (McFadden et al. 1999), impaired hearing (McFadden et al. 2001), hepatic collagen and lipid accumulation (Kurahashi et al. 2015; Sakiyama et al. 2016), and development of cataracts (Olofsson et al. 2007). Recently, Lagerwaard et al. (2020) have shown that mitochondrial capacity measured in TA, but not the VL and GA, was resistant to an age-driven decline in mitochondrial aging. We have shown that mitochondrial dysfunction and elevated hydroperoxide production occur in muscle mitochondria from young Sod1−/− mice and are associated with the induction of skeletal muscle atrophy programming (Jang et al. 2010; Muller et al. 2007).
While the Sod1−/− mouse model presents a faithful recapitulation of the wild-type sarcopenia phenotype, the molecular basis and regulatory networks induced during muscle atrophy in Sod1−/− mice are still not defined. By combining a time course of muscle loss and weakness with omics analyses, we provide insight into altered muscle physiology during the development of sarcopenia in these mice that can inform our understanding of the molecular basis of sarcopenia in humans.
Methods
Animals
Studies were performed using female wild-type and Sod1−/− mice at 1, 2, 3, 4, 5–6, and 7–9 months of age maintained at the Oklahoma Medical Research Foundation (OMRF) animal facility. Sod1−/− mice were previously described (Huang et al. 1997). All mice had free access to standard chow and water and were maintained on a 12-h light/dark cycle. Quantitative magnetic resonance (QMR, Echo Medial Systems, TX, USA) was performed in all age groups of mice. At the time of sacrifice (mid-morning), mice were euthanized with CO2 inhalation, and tissues were immediately dissected, weighed, and frozen in liquid nitrogen. For mitochondrial isolation, the gastrocnemius muscles were processed as described in the mitochondrial isolation section. The Institutional Animal Care and Use Committee at the OMRF approved the studies.
Mitochondrial isolation and measurement of ROS generation
Muscle mitochondrial isolation and hydroperoxide release (both hydrogen peroxide and lipid hydroperoxides) were conducted as previously described (Muller et al. 2006; Sataranatarajan et al. 2015). Briefly, gastrocnemius muscle was dissected, weighed, and immediately placed in 0.15 M ice-cold KCl solution. Chappell–Perry buffer was used for homogenizing the muscle. The isolated mitochondria were incubated at 37 °C in 100 μl of the reaction buffer containing 125 mM KCl, 10 mM HEPES, 5 mM MgCl2, and 2 mM K2HPO4 (pH 7.4). No substrates (state 1/basal), 2.5 mM glutamate and 2.5 mM malate, or 2.5 mM of succinate and 1 μM of rotenone were added to the reaction mixture to measure hydroperoxide production. The hydroperoxides released in the reaction mixture were measured by Amplex Red oxidation at an excitation of 545 nm and an emission of 590 nm using a Fluoroskan-FL Ascent Type 374 multiwell plate reader (Thermo Scientific, Waltham, MA).
RNA extraction, qPCR, and RNA sequencing
Total RNA was extracted from 30 mg of gastrocnemius tissue from wild-type and Sod1−/− knockout mice at different age groups using TRIzol reagent (Invitrogen, CA, USA) according to the manufacturer’s protocol. The RNA integrity and concentration were first assessed using an Agilent Tapestation to meet the experimental standard. An aliquot of total RNA were used to prepare cDNA using iScriptTM cDNA Synthesis kit (Bio-Rad, Hercules, CA, USA). The cDNA samples were used to amplify the denervation markers viz. AChRα, GADD45, and Sarcolipin with fast SYBR green master mix (Applied Biosystems, Grand Island, NY, USA) by RT PCR (QuantStudio 6 Flex, Applied Biosystems, NY, USA). The data were analyzed using the ΔΔCt method. An aliquot of RNA samples from 7 to 9 months old wild-type and Sod1−/− mice were given to OMRF Clinical Genomics Center (https://omrf.org/research-faculty/core-facilities/next-generation-sequencing/). Libraries were prepared using the TruSeq Stranded mRNA Library Kit (Illumina). The libraries were then sequenced on an Illumina NextSeq 500 to produce paired-end 75 base pair reads.
RNA-seq data processing followed the guidelines and practices of the ENCODE and modENCODE consortia regarding proper experimental replication, sequencing depth, data and metadata reporting, and data quality assessment (https://www.encodeproject.org/documents/cede0cbe-d324-4ce7-ace4-f0c3eddf5972/). Raw sequencing reads (in a FASTQ format) were trimmed of residual adaptor sequences using Scythe software. Low-quality bases at the beginning or the end of sequencing reads were removed using sickle, and then the quality of remaining reads was confirmed with FastQC. Further processing of quality sequencing reads was performed with utilities provided by the Tuxedo Suite software. Reads were aligned to the Mus musculus genome reference (GRCm38/mm10) using the TopHat component, then cuffquant and cuffdiff were utilized for gene-level read counting and differentially expression analysis. A false discovery rate threshold of 0.05 was used as selection criteria for differentially expressed genes between pairs of time points. Gene expression data was normalized using DESeq algorithm, and heatmap was generated using Strand NGS software package (Agilent) as previously described (Chucair-Elliott et al. 2019). Functional analysis to find overrepresented functional sets (GO, KEGG pathways) was performed using specialized R Bioconductor packages. Ingenuity Pathway Analysis (IPA, QIAGEN, Redwood City CA, https://www.qiagenbioinformatics.com/products/ingenuitypathway-analysis) was used to interactively explore significant gene networks and pathways.
Targeted mass spectrometric analysis
Gastrocnemius samples from 7- to 9-month-old wild-type and Sod1−/− female mice were provided to the Multiplexing Protein Quantification Core in the Oklahoma Nathan Shock Center for Excellence in the Biology of Aging (https://aging.ouhsc.edu/Cores/MultiplexingProteinQuantificationCore.aspx) to estimate the panel of proteins in carbohydrate metabolism, fatty acid metabolism, Krebs cycle, and antioxidant pathways as previously described (Ahn et al. 2018; Kinter et al. 2012). Data collected from the core were used to determine the relative abundance of the proteins in Sod1−/− mice relative to the wild-type mice.
Eicosanoid analysis
Eicosanoid analysis was performed at the UCSD Lipidomics Core (http://www.ucsd-lipidmaps.org/home).
Eicosanoid extraction
All solvents were of chromatography purity. Eicosanoids used for primary standards in standard curves as well as their deuterated analogs were from Cayman Chemicals (Ann Arbor, MI) and Biomol (Enzo Life Science, Framingdale, NY). For extraction, muscle samples were homogenized in 1000 μl PBS containing 10% methanol were supplemented with a cocktail consisting of 26 deuterated internal standards and purified by solid-phase extraction on Strata-X columns (Phenomenex, Torrance, CA) following the activation procedure provided by the distributor. Samples were eluted with 1 ml of 100% methanol, the eluent was dried under vacuum and dissolved in 50 μl of buffer A consisting of water/acetonitrile/acetic acid (60/40/0.02, v/v/v) and immediately used for analysis.
Reverse-phase liquid chromatography and mass spectrometry
Eicosanoids were analyzed as previously described (Quehenberger et al. 2010, 2018; Wang et al. 2014). Briefly, eicosanoids were separated by reverse phase chromatography using a 1.7 μM 2.1 × 100 mm BEH Shield Column (Waters, Milford, MA) and an Acquity UPLC system (Waters, Milford, MA). The column was equilibrated with buffer A, and 5 μl of sample was injected via the autosampler. Samples were eluted with a step gradient to 100% buffer B consisting of acetonitrile/isopropanol (50:50, v/v). The liquid chromatography effluent was interfaced with a mass spectrometer, and mass spectral analysis was performed on an AB SCIEX 6500 QTrap mass spectrometer equipped with an IonDrive Turbo V source (AB SCIEX, Framingham, MA). Eicosanoids were measured using multiple reaction monitoring (MRM) pairs with the instrument operating in the negative ion mode. Collisional activation of the eicosanoid precursor ions was achieved with nitrogen as the collision gas, and the eicosanoids were identified by matching their MRM signal and chromatographic retention time with those of pure identical standards.
Eicosanoids were quantified by the stable isotope dilution method. Briefly, identical amounts of deuterated internal standards were added to each sample and to all the primary standards used to generate standard curves. To calculate the amount of eicosanoids in a sample, ratios of peak areas between endogenous eicosanoids and matching deuterated internal eicosanoids were calculated. Ratios were converted to absolute amounts by linear regression analysis of standard curves generated under identical conditions.
Statistical analysis
Data were presented as mean ± SEM. Comparisons between groups were performed by t - test, two-way analysis of variance (ANOVA) with post hoc test designated in figure legends, or linear regression using GraphPad Prism 7.02 software (GraphPad Software, Inc., La Jolla, CA, USA). Outliers were removed from RT-PCR and proteomics analysis using ROUT (Q = 1%). Data were considered statistically significant at p < 0.05. Targeted Mass Spectrometric analysis was corrected for multiple comparisons with Benjamini-Hochberg correction (q < 0.05). Principal component analysis (PCA) plots were generated using ClustVis with default settings (Metsalu and Vilo 2015).
Results
Muscle growth is blunted after 1 month of age, and loss of mass is evident by 7–9 months of age in Sod1−/− mice
We measured the time course for development of reduced muscle mass in the Sod1−/− sarcopenia mouse model. At 1 month of age, body mass, lean mass, fat mass, and gastrocnemius muscle mass are not different between wild-type and Sod1−/− mice (Fig. 1). Lean mass, fat mass, and body mass overall increase in wild-type mice from 1 to 9 months of age (Fig. 1a–c) as this is the period of growth and development in mice. Lean mass and body mass increase in the Sod1−/− mice as well but at a slower rate, and fat mass does not increase over this time period at all (Fig. 1a–c). By 4 months of age, body mass is 15% lower in the Sod1−/− mice than in age-matched wild-type mice (Fig. 1a). Body composition analysis measured by quantitative nuclear magnetic resonance shows that lean and fat mass are 13% and 50% lower respectively in Sod1−/− mice than in wild-type mice at 5 to 6 months of age (Fig. 1 b and c). After 1 month of age, the absolute mass of the gastrocnemius in wild-type mice continues to increase as mice develop into adulthood, while the gastrocnemius mass in the Sod1−/− mice remain unchanged (Fig. 1d). The gastrocnemius muscle mass and mass normalized to bodyweight are 30% lower in the Sod1−/− mice compared to wild-type counterparts at 4 months of age and remain lower throughout the ages we measured (Fig. 1 d and e). Gastrocnemius mass normalized to lean mass (Fig. 1f) is also significantly lower in the Sod1−/− mice than in wild-type mice beginning at 2 months of age. Although muscle mass is significantly lower in the Sod1−/− mice compared to wild-type age-matched mice starting from 3 months of age, a distinct loss of muscle mass in Sod1−/− mice is evident for the first time between the 5 to 6 months and 7 to 9 months of age, approaching a value similar to that seen in 26–28-month-old wild-type mice (Jang et al. 2012). In our previous study, we reported gastrocnemius mass approaching 100 mg in female Sod1−/− mice between 16 and 20 months compared to 225 mg in age matched wild-type mice (Muller et al. 2006). Furthermore, Sod1−/−mice also show a delay in muscle growth in the quadriceps femoris, tibialis anterior (TA), soleus, and extensor digitorum longus (EDL) muscles compared to wild-type control (Fig. S1). Interestingly, kidney growth is decreased in the Sod1−/− mice while liver growth is increased (Fig. S2).
Fig. 1.

Age dependent decline in Sod1−/− mice muscle mass. a Body mass, b lean mass, c fat mass, d gastrocnemius mass, e gastrocnemius mass corrected to body mass, and f gastrocnemius mass corrected to lean mass. Data from wild-type (n = 5–15) and Sod1−/− mice (n = 4–16) are shown as mean ± SEM. Black lines represent wild-type mice and broken blue lines represents Sod1−/− mice. *p < 0.05 wild-type versus Sod1−/− mice at that age, and superscript number denotes significant difference compared to wild-type (WT) or Sod1−/− (KO) mice at the specified previous month(s) by 2-way ANOVA with Tukey’s post hoc test
Sod1−/− mice show increased muscle mitochondrial hydroperoxide generation
We measured mitochondrial generation of hydroperoxides (H2O2 and lipid hydroperoxides), a class of reactive oxygen species (ROS) from isolated muscle mitochondria from 1-, 2-, 3-, 4–6-, and 7–9–month-old wild-type and Sod1−/− mice as shown in Fig. 2. Basal (state 1) hydroperoxide production is ~ 3-fold higher as early as 2 months of age in Sod1−/− mice when compared to wild-type counterparts and remains elevated at 7 to 9 months (Fig. 2a). The addition of glutamate and malate induces a 20% increase in hydroperoxide generation from the mitochondria at 7 to 9 months of age in Sod1−/− mice (Fig. 2b). Similarly, addition of succinate and rotenone to isolated mitochondria (inducing reverse electron transfer) also resulted in a significant increase in hydroperoxide generation in Sod1−/− mice compared to controls (ANOVA genotype effect p < 0.01). Thus, loss of muscle mass (Fig. 1d) and increased mitochondrial hydroperoxide generation (Fig. 2 b and c) are both elevated by 7–9 months of age in the Sod1−/− mice. Basal (state 1) ROS production is elevated as early as 2 months of age, potentially contributing to the later development of muscle atrophy (Fig. 2a).
Fig. 2.

Hydroperoxide production in muscle mitochondria from Sod1−/− mice. Production of hydroperoxide reactive oxygen species (ROS) in isolated mitochondria from the gastrocnemius muscle of wild-type and Sod1−/− mice under a basal (state 1) conditions, b after the addition of glutamate and malate (G/M), and c after the addition of succinate and rotenone (S/R). d Correlation between gastrocnemius (GTN) normalized to body mass and basal hydroperoxide production. e Correlation between gastrocnemius normalized to body mass and hydroperoxide production after the addition of glutamate and malate. f Correlation between gastrocnemius (GTN) normalized to body mass and hydroperoxide production after the addition of succinate and rotenone. g Correlation between gastrocnemius normalized to lean mass and basal hydroperoxide production. h Correlation between gastrocnemius normalized to lean mass and hydroperoxide production after the addition of glutamate and malate. i Correlation between gastrocnemius normalized to lean mass and hydroperoxide production after the addition of succinate and rotenone. Black lines represent wild-type mice and broken blue lines represents Sod1−/− mice. Values were normalized to mg mitochondrial protein. Data from wild-type and Sod1−/− mice (n = 4–12) are shown as mean ± SEM. *p < 0.05 wild-type versus Sod1−/− mice at that age, and superscript number denotes significant difference compared to wild-type (WT) or Sod1−/− (KO) mice at the specified previous month(s) by 2-way ANOVA with Tukey’s post hoc test
We have previously reported that basal mitochondrial generation of hydroperoxides is correlated to muscle atrophy in several models (Muller et al. 2007). The loss of muscle mass in Sod1−/− mice is strongly correlated with mitochondrial hydroperoxide production in the basal (state 1) condition whether normalized to body mass or lean mass (Fig. 2d, g). This strong correlation remains similar after the addition of glutamate and malate (Fig. 2e, h), as well after the addition of succinate and rotenone (Fig. 2f, i). This correlation is not present in age-matched wild-type mice (data not shown) suggesting that gastrocnemius mass is strongly associated with hydroperoxide generation in the Sod1−/− mice.
Sod1−/− mice show loss of innervation as early as 2 months of age
We have previously shown that loss of innervation results in increased mitochondrial hydroperoxide generation (Muller et al. 2007). Here, we asked how the time course of expression for genes known to be elevated in denervation changes with age in the wild-type and Sod1−/− mice. We measured the expression of mRNA for the acetylcholine receptor alpha (AChRα) and two other markers known to increase transiently in skeletal muscle following denervation, GADD45A (Ebert et al. 2012), and sarcolipin (Nakao et al. 2017) (Fig. 3). AChRα expression is increased at 1 month of age in Sod1−/− mice, GADD45A is increased at 7–9 months of age, and sarcolipin is increased at 2 months of age (Fig. 3a–c). These data indicate that an increase in hydroperoxide production (Fig. 2a), a decrease in muscle mass (Fig. 1d), and an increase in denervation markers (Fig. 3) occur with a similar time course. The denervation markers remain significantly increased at 7–9 months although a decrease is evident at 4–6 months.
Fig. 3.

Age-dependent induction of denervation markers in Sod1−/− mice. mRNA expression of a AChRα, b GADD45A, and c sarcolipin. Black lines represent wild-type mice and broken blue lines represents Sod1−/− mice. Values were normalized to 18S. Data from wild-type and Sod1−/− mice (n = 8) are shown as mean ± SEM. *p < 0.05 wild-type versus Sod1−/− mice at that age, and superscript number denotes significant difference compared to wild-type (WT) or Sod1−/− (KO) mice at the specified previous month(s) by 2-way ANOVA with Tukey’s post-hoc test
Transcriptomic analysis in gastrocnemius muscle from Sod1−/− mice revealed 502 differentially expressed genes (DEGs)
In order to understand how oxidative stress impacts gene expression contributing to the induction of muscle atrophy in young Sod1−/− mice, we measured changes in the transcriptome by RNA-seq at the time point that the gastrocnemius muscle begins to atrophy (7–9 months). A total of 20,595 genes were identified. Five hundred two genes were found to be differentially expressed in Sod1−/− mice compared to age matched wild-type mice (Fig. 4a). Differentially regulated canonical pathways identified by ingenuity pathway analysis (IPA) include the protein ubiquitination pathway, synaptic signaling (long-term potentiation), calcium signaling, phospholipase C signaling, AMPK signaling, and TWEAK signaling (Fig. 4b). The protein ubiquitination pathway is well documented in muscle atrophy (Attaix et al. 2005; Bilodeau et al. 2016; Sandri 2013), including sarcopenia (Altun et al. 2010; Gumucio and Mendias 2013) and denervation atrophy (Bhattacharya et al. 2014), and here, we find it is altered in the Sod1−/− mouse model of sarcopenia. The number of downregulated genes is more than the number of upregulated genes in the protein ubiquitination pathway. Synaptic signaling, calcium signaling, and phospholipase C signaling share common genes (PPP3CB, PPP3R1, RAP1A, PLCD1, PLCB4, and PRKCE) (derived from the circos plot, not shown) suggesting that these pathways are activated due to oxidative stress in Sod1−/− mice that contribute to muscle atrophy. In a previous study, TWEAK overexpression (TWEAK-Tg) in skeletal muscle of mice showed skeletal muscle atrophy while the TWEAK KO showed reverse effect (Mittal et al. 2010). Here, we find the TWEAK pathway to be activated in the Sod1−/− mice that show significant muscle atrophy. Figure 4 c and d show transcription factors that are upregulated and downregulated, and Fig. 4e depicts the genes that play an important role in muscle contraction and muscle quantity. We found elevated expression of cholinergic receptors (CHRNA1, CHRNB1, CHRND, and CHRNG) and ion channels (KCNE5, CACNA1S) that are involved in positively regulating muscle contraction, as well as caspase 3 (Du et al. 2004; Sandri et al. 2001) and sarcolipin (Pant et al. 2016; Sopariwala et al. 2015; Tupling et al. 2011) that inhibit muscle contraction (Fig. 4e). RNA-seq analysis also revealed changes in expression of Nr3c1 (glucocorticoid receptor) (Sun et al. 2003), Ptgfrn (prostaglandin F2 receptor) (Tithof et al. 2007), Plcb4 (phospholipase C beta 4), Pld1(phospholipase D1), Cept1 (choline) (Arrigoni et al. 1987), AGPAT1(1-acylglycerol-3-phosphate O-acyltransferase 1), and Acsl4 (acyl-CoA synthetase long-chain family member 4) (Kuwata et al. 2019) in the Sod1−/− mice (data not shown). These selectively activated transcripts of lipid pathways may be related to the concurrent changes in inflammation related transcripts (Ti1r, Nfkb2, Nek7, Irak4, Mif) and oxidative stress although direct evidence in muscle atrophy is yet to be determined.
Fig. 4.

RNA-seq analysis of Sod1−/− mouse gastrocnemius. a Hierarchical clustering dendogram and heat map from next-generation RNA sequencing. Each row represents one gene and each column represents an individual mouse. Red indicates high expression and blue indicates low normalized expression (log2). b Ingenuity pathway analysis (IPA) showing the top 6 canonical pathways in Sod1−/− mice with number upregulated (red) and downregulated (blue) out of the total genes in the pathway indicated. c Upregulated and d downregulated transcription factors in Sod1−/− mice. e Molecules involved in the quantity and contraction of the gastrocnemius muscle in Sod1−/− mice. Data from 7- to 9-month-old wild-type and Sod1−/− mouse gastrocnemius (n = 3). Benjamini-Hochberg multiple testing was applied to determine the differentially expressed transcripts and p-values were considered statistically significant at p < 0.05
Changes in metabolic pathways in gastrocnemius muscle from Sod1−/− mice after the onset of muscle atrophy (7 to 9 months of age)
Under normal conditions, oxidative stress is counterbalanced by antioxidant defenses while chronic oxidative stress contributes to a number of pathologies. Proteomic studies done previously in the skeletal muscle of the Sod1−/− mice have shown increased antioxidants and a number of alterations in the redox proteome (Sakellariou et al. 2018). The high levels of hydroperoxides in Sod1−/− mice in gastrocnemius in the current study indicate a significant alteration in cellular processes and metabolism. In order to identify the status of metabolic and stress response proteins in Sod1−/− mice, we performed targeted mass spectrometric analysis in gastrocnemius muscle on 4 panels, i.e., carbohydrate metabolism (including glycolysis), fatty acid metabolism (including β-oxidation), the tricarboxylic acid (TCA)-cycle, and stress response proteins. The protein content signatures of metabolic and stress response proteins differed extensively and cluster separately between wild-type and Sod1−/− muscle as indicated by principle component analysis (PCA) (Fig. 5a). PC1 primarily explains variance between genotypes, while PC2 explains variance between samples within a genotype. Several key enzymes (Eno3, Ldha, Slc2a4, Akr1b1, Pgam2, and Tpi1) in carbohydrate metabolism are significantly decreased in muscle from Sod1−/− mice (Fig. 5b). Many proteins involved in fatty acid metabolism and beta oxidation (Acaa2, Fabp4, Acadm, Acadl, Etfa, Etfb, Hadh, Decr1), TCA cycle proteins (Ckmt2, Dlat, Dlst, Mdh2, Sdha, Pdhb, Aco2, Pdha1, Fh1, Cs, Idh3b, Ogdh, Sdhb, Dld, Sdhc, Idh3g, Sucla2, Idh3a, and Mdh1), and antioxidants and heat shock pathways proteins (Aldh2, Hspa9, Hspd1, Prdx5, Txn1, Sod2, Prdx3, Prdx6, Prdx2, Gpx1, Hsp90b1, and Prdx1 were significantly increased (Fig. 5c–e). Ablation of Sod1 increases 4 isoforms of Prdx and MnSOD, potentially to compensate for the loss of Sod1 (Fig. 5e). Similar to the previous study from Sakellariou et al. (2018), we observe an increase in thioredoxin, peroxiredoxins and Sod2 antioxidant enzymes in Sod1−/− mice. However, we did not find similar changes in the redox proteome and that may be due to difference in muscle type. The current study was conducted in gastrocnemius while the previous (Sakellariou et al. 2018) proteome study in Sod1−/− mice was conducted in whole skeletal muscle. An increase or decrease in TCA-cycle enzymes and antioxidant levels indicates a potential chronic oxidative stress in the mitochondria and activation of the continuous remodeling mechanisms to maintain the redox balance in the Sod1−/− mice.
Fig. 5.

Targeted mitochondrial proteins using mass spectrometry analysis in Sod1−/− mice. a Sample clustering by principal component analysis (PCA) of protein content in wild-type and Sod1−/− mice. Principal component 1 (PC1) explains the most variance between samples (57.7%), while principal component 2 (PC2) explains the second most variance (11.4%). Wild-type mice indicated by black and Sod1−/− mice indicated by blue. Ellipses represent 95% confidence level. The content of proteins involved in b carbohydrate metabolism, c fatty acid metabolism, d tricarboxylic acid (TCA) cycle, and e antioxidant and stress response pathways in gastrocnemius muscle of Sod1−/− mice relative to wild-type mice. Red bars represent a significant increase in Sod1−/− mice protein content relative to wild-type values. Blue bars represent a significant decrease and black bars indicate values are not significantly different in wild-type and Sod1−/− mice. Gene symbols are used to represent the corresponding protein. Data from 7- to 9-month old wild-type and Sod1−/− male mice (n = 3) are shown. Statistical significance was determined by two-tailed t test with Benjamini-Hochberg multiple testing correction (q < 0.05)
Muscle atrophy alters eicosanoid production in Sod1−/− mice
Oxidative stress and inflammation have been reported to induce eicosanoid generation in a number of conditions related to muscle tissue such as resistance exercise (Vella et al. 2019), Duchenne muscular dystrophy (Hoxha 2019), in response to changes in contractile and metabolic features of slow- and fast-twitch muscles (Hashimoto et al. 2016), and cancer cachexia (Vaughan et al. 2012). Treatment of HL-60, Jurkat and Raji cells with arachidonic acid at concentrations of 10–400 μM induced apoptosis that involved oxidative stress and changes in eicosanoid biosynthesis (Pompeia et al. 2002). Eicosanoids are signaling lipid molecules derived from cytosolic phospholipase A2 (cPLA2) induced release of arachidonic acid from membrane phospholipids by enzymatic or non-enzymatic free radical mechanism. Previous studies from our laboratory have shown that lipid hydroperoxides are generated by elevated cPLA2 activity associated with denervation induced atrophy (Bhattacharya et al. 2009, 2014). We have also previously reported that muscle from Sod1−/− mice contains increased levels of F2-isoprostanes, a major lipid oxidation product (Sataranatarajan et al. 2015). This current study shows increased hydroperoxides as early as 2 months of age in the mitochondria of gastrocnemius muscle prompting us to measure the eicosanoid profile. We detected 78 eicosanoids using LC-MS analysis in the gastrocnemius muscle of 7–9-month-old wild-type and Sod1−/− mice. Figure 6 a indicates a separation of samples using PCA by genotype for PC1 as well as increased heterogeneity among Sod1−/− samples for PC2. We also found a significant increase in eicosanoid content in Sod1−/− mice compared to wild-type, shown in Fig. 6b. Of the 78 detected eicosanoids, 31 are significantly increased in Sod1−/− mice, while none were significantly decreased (Fig. 6c). These results show the activation of lipoxygenase (LOX), cyclooxygenase (COX), and cytochrome P450 (CYP450) pathways through increased metabolism of docosahexaenoic acid (DHA), eicosapentaenoic acid (EPA), and arachidonic acid (AA). Notably, the saturated fatty acids DHA and EPA are reported to have anti- inflammatory effects (Calder 2006). Thus, some of the eicosanoids may induce pro-inflammatory actions while some may be produced to perform anti-inflammatory actions in response to the increased oxidative stress in Sod1−/− mice.
Fig. 6.
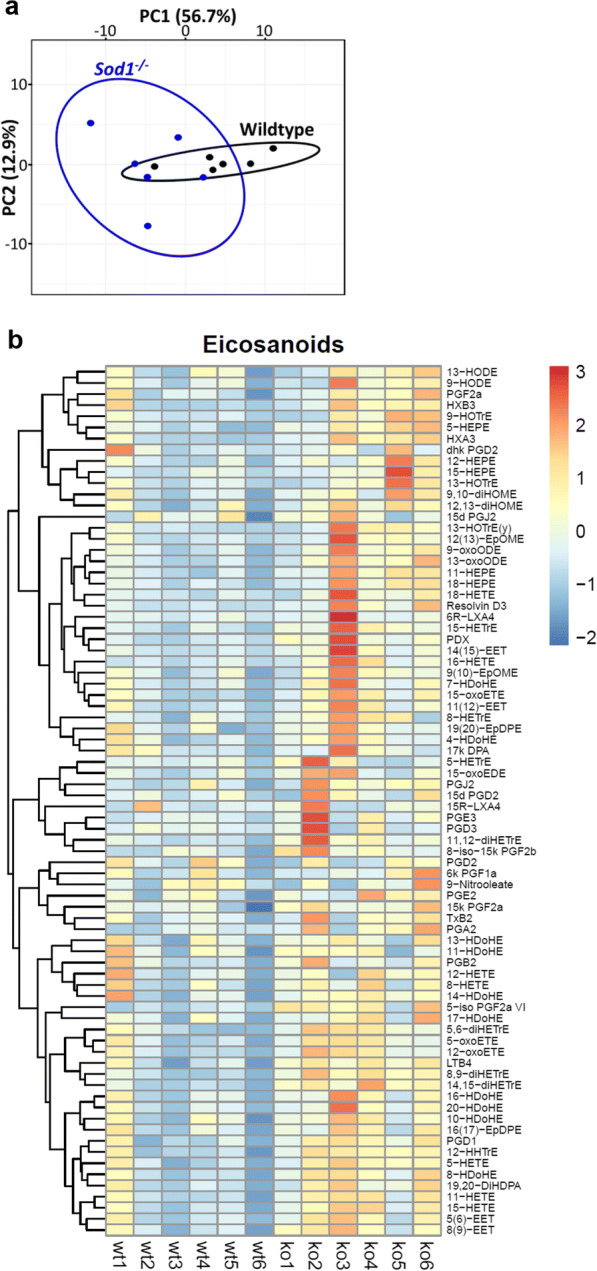

Eicosanoid profile by LC-MS in Sod1−/− mice. a Sample clustering by PCA of eicosanoid content in wild-type and Sod1−/− mice. Principal component 1 (PC1) explains the most variance between samples (56.7%), while principal component 2 (PC2) explains the second most variance (12.9%). Wild-type mice indicated by black and Sod1−/− mice indicated by blue. Ellipses represent 95% confidence level. b Heatmap of normalized abundance of eicosanoids in wild-type and Sod1−/− mice. Pheatmap library in RStudio was used to generate the heatmap. c Metabolites of the arachidonic acid derived from enzymatic action of lipoxygenases (LOX), cyclooxygenases (COX), and cytochrome P450 (CYP450). d Red bars indicate metabolites that are significantly increased possibly through cytochrome P450, blue bars indicate metabolites that are significantly increased possibly through LOX, and yellow bars indicate metabolites that are significantly increased possibly through COX enzymes. Data from 7- to 9-month-old wild-type and Sod1−/− mice (n = 6) are shown. Statistical significance was determined by two-tailed t test (p < 0.05)
Discussion
Sod1−/− mice display oxidative damage, mitochondrial dysfunction, neuromuscular junction degeneration, and muscle weakness (Jang et al. 2010; Larkin et al. 2011; Muller et al. 2006) similar to aging humans (Cui et al. 2012; Rudolf et al. 2014; Siparsky et al. 2014); however, the underlying mechanisms that drive the development of these pathologies are unknown. We used a number of approaches including RNA sequencing, proteomics, and eicosanoid profiling to identify the primary events that drive sarcopenia in Sod1−/− mice. The comprehensive omics approach used in the current study revealed how a progressive dysregulation of mitochondrial ROS contributes to changes in gene expression, metabolic and stress response proteins, and eicosanoid profile in the Sod1−/− mouse that contribute to sarcopenia in older mice.
Mitochondrial hydroperoxide generation was measured in mice over the time course of development ranging from 1 month to 9 months of age. We observed a 3-fold increase in state 1 ROS production as early as 2 months of age in Sod1−/− mice. Hydroperoxides are an initiating factor for muscle wasting (Anderson et al. 2009; Debold 2015; Koves et al. 2008; Lamb and Westerblad 2011; Liu et al. 2016a; Sivakumar and Hwang 2015). The timing of these events is a key finding in our study. Our data is clear evidence that mitochondrial peroxide production increases prior to the development of muscle loss in Sod1−/− mice. Recent results from our laboratory show that the increased state 1 hydroperoxide production is associated with loss of innervation, and is composed of both ETC-mediated ROS production and lipid hydroperoxides (Pharaoh et al. 2019). In support of this, denervation associated gene expression strongly correlates with the state 1 peroxide production as muscle atrophy develops in Sod1−/− mice and likely drives the loss of muscle mass and changes observed in the transcriptome, proteome, and lipidome observed in 7–9-month-old Sod1−/− mice in this study.
Pathway analysis from RNA sequencing revealed a cascade of canonical pathways in Sod1−/− gastrocnemius muscle. These pathways include TWEAK signaling, phospholipase C signaling, calcium signaling, AMPK signaling, and protein ubiquitination signaling. Several transcription factors are dysregulated (41 transcription factors were upregulated and 50 transcription factors were downregulated in Sod1−/− mice) and may be driving the aberrant transcriptome profile in Sod1−/− mice. TWEAK signaling is a known activator of NFκB, which is responsible for many of the pathologies associated with sarcopenia (Chen et al. 2017; Dogra et al. 2006; Rodriguez et al. 2017; Sandri 2013) and phospholipase C signaling has been shown to drive skeletal muscle contractile dysfunction (Kucukhuseyin et al. 2018; Sauc and Frieden 2017). It is evident that sustained hydroperoxide generation in Sod1−/− mice may be a key factor driving these transcriptomic changes which may contribute to the inflammatory environment and inflammation is a known contributor to sarcopenia (Bano et al. 2017; Custodero et al. 2018; Yakabe 2018).
AMPK and calcium signaling are main regulators of muscle contraction (Nelson et al. 2019; Wright et al. 2004). Transcriptomic data from this current study reveals the activation of AMPK and calcium signaling. AMPK is the key energy sensor in skeletal muscle and becomes activated with low energy levels. AMPK promotes protein breakdown (Egawa et al. 2015) and inhibits protein synthesis (Thomson 2018), thus activation may lead to skeletal muscle wasting in Sod1−/− mice. Recent studies showed reduced SERCA pump activity is partially responsible for calcium disruption and muscle weakness observed in Sod1−/− mice (Qaisar et al. 2018, 2019). Calcium uptake by mitochondria from Sod1−/− mice is impaired (Ahn and Van Remmen, unpublished data) and in addition, sarcolipin, a calcium-dependent regulatory gene is profoundly increased. Taken together, these data signify that the impaired calcium signaling and oxidative stress contribute to the muscle loss and weakness observed in the Sod1−/− mice.
Despite increased protein content of antioxidant machinery, the muscle pathology is not rescued in Sod1−/− mice. This warrants further investigation to examine the unique properties of CuZn SOD, which makes this enzyme vital for skeletal muscle health. Proteins participating in carbohydrate metabolism are downregulated, and we observe a strong upregulation of proteins involved in fatty acid metabolism, Kreb’s cycle, and mitochondrial components. This is similar to what occurs in diabetic mice (Cade 2018; Nilsson et al. 2010) and Duchene’s muscular dystrophy (Comim et al. 2016). Based on this proteomics dataset, it is clear mitochondrial components are upregulated, and therefore, it is possible that this may be a compensatory mechanism to account for the loss of muscle mass.
Earlier publications from our lab have shown high levels of hydroperoxides in Sod1−/− mice and other denervation models (Bhattacharya et al. 2009; Muller et al. 2007). However, the detailed underlying mechanisms remain unclear. A recent study in human subjects demonstrated that muscle atrophy in aging is associated with oxylipin markers (Dalle et al. 2019). Oxidation of polyunsaturated fatty acids results in formation of oxylipins that act as lipophilic signaling molecules. This led us to investigate the comprehensive eicosanoid panel in the gastrocnemius of the Sod1−/− mice. We found 78 eicosanoids increased in Sod1−/− mice suggesting activation of the cyclooxygenase and lipoxygenase pathway. This is the first study to reveal that oxidative stress induced sarcopenia is accompanied by significant alterations in eicosanoids. A prior report from our laboratory shows that genetic deletion of 12/15-lipoxygenase, a key enzyme in eicosanoid generation, protects against denervation-induced muscle loss, which indicates that downstream eicosanoids may lead to muscle loss (Bhattacharya et al. 2009, 2014). Eicosanoids are involved in a plethora of biological processes. For example, resolvin D3 is reduced in inflammed joints and administration of RvD3 alleviates arthritis progression and limits leukocyte numbers in mice (Arnardottir et al. 2016) whereas PGE2 induces IL-6 and MuRF-1 transcription in human skeletal muscle (Standley et al. 2013). Aging skeletal muscle has been shown to have elevated PGE2 production but decreased receptor levels with no change in COX-1 (Liu et al. 2016b). Decreasing COX2 activity using the inhibitor NS-398 blunts muscle hypertrophy and decreased macrophage accumulation and cell proliferation in synergistic ablation model (Novak et al. 2009). Another study by Bondesen et al. 2004 showed that the COX2 inhibitor SC-236 impairs myofiber growth with reduction in intramuscular inflammatory cells in localized freeze injury in tibialis anterior muscle. In addition, COX-2(−/−) satellite cells have been shown to have impaired proliferation in vitro (Bondesen et al. 2004). The study of eicosanoids with respect to muscle physiology and pathology is still in its infancy and much remains to be defined. More research is needed to completely understand the specific effects of eicosanoids in muscle cellular processes.
The current study has identified transcripts, proteins and metabolic pathways relevant to oxidative-stress induced sarcopenia. Importantly, this study is also the first to define the pattern of eicosanoid production in association with induction of muscle atrophy using the Sod1−/− mouse model of accelerated sarcopenia. Our lab is currently focusing on therapeutic approaches to correct the muscle loss and contractile dysfunction associated with sarcopenia by targeting eicosanoids and arachidonic acid metabolism.
Electronic supplementary material
(PPTX 218 kb)
Acknowledgments
The authors thank the Multiplex Protein Quantification Cores at Oklahoma Nathan Shock Center, Oklahoma, Clinical genomic center at Oklahoma Medical Research Foundation, Oklahoma and Lipidomics core, UCSD, La Jolla, CA, for sharing their expertise.
Author’ contributions
HVR designed the study. KS, GP, CG, RR, KSt, and CK performed experiments and collected data. KS, GP, KP, JW, MK, WF, AR, and HVR analyzed data. KS, GP, JB, and HVR wrote the manuscript.
Funding information
This work was supported by the National Institute of Health, National Institute of Aging (AG050676, AG051442) and Veterans Affairs (I01BX002595). Dr. Van Remmen is the recipient of a Senior Research Career Scientist award (1IK6BX005234) from the Department of Veterans Affairs.
Compliance with ethical standards
Conflict of interest
The authors declare no potential conflict of interest.
Ethics approval
The current research was conducted in accordance with the recommendations of USDA guidelines by the Institutional Animal Care and Use Committee at Oklahoma Medical Research Foundation.
Consent to participate
Not applicable.
Consent for publication
Not applicable.
Availability of data and material
Data available upon request.
Code availability
Not applicable.
Footnotes
Publisher’s note
Springer Nature remains neutral with regard to jurisdictional claims in published maps and institutional affiliations.
References
- Ahn B, Pharaoh G, Premkumar P, Huseman K, Ranjit R, Kinter M, Szweda L, Kiss T, Fulop G, Tarantini S, Csiszar A, Ungvari Z, van Remmen H. Nrf2 deficiency exacerbates age-related contractile dysfunction and loss of skeletal muscle mass. Redox Biol. 2018;17:47–58. doi: 10.1016/j.redox.2018.04.004. [DOI] [PMC free article] [PubMed] [Google Scholar]
- Altun M, Besche HC, Overkleeft HS, Piccirillo R, Edelmann MJ, Kessler BM, Goldberg AL, Ulfhake B. Muscle wasting in aged, sarcopenic rats is associated with enhanced activity of the ubiquitin proteasome pathway. J Biol Chem. 2010;285:39597–39608. doi: 10.1074/jbc.M110.129718. [DOI] [PMC free article] [PubMed] [Google Scholar]
- Anderson EJ, Lustig ME, Boyle KE, Woodlief TL, Kane DA, Lin CT, Price JW, 3rd, Kang L, Rabinovitch PS, Szeto HH, et al. Mitochondrial H2O2 emission and cellular redox state link excess fat intake to insulin resistance in both rodents and humans. J Clin Invest. 2009;119:573–581. doi: 10.1172/JCI37048. [DOI] [PMC free article] [PubMed] [Google Scholar]
- Appell HJ, Duarte JA, Soares JM. Supplementation of vitamin E may attenuate skeletal muscle immobilization atrophy. Int J Sports Med. 1997;18:157–160. doi: 10.1055/s-2007-972612. [DOI] [PubMed] [Google Scholar]
- Arnardottir HH, Dalli J, Norling LV, Colas RA, Perretti M, Serhan CN. Resolvin D3 is dysregulated in arthritis and reduces arthritic inflammation. J Immunol. 2016;197:2362–2368. doi: 10.4049/jimmunol.1502268. [DOI] [PMC free article] [PubMed] [Google Scholar]
- Arrigoni E, Averet N, Cohadon F. Effects of CDP-choline on phospholipase A2 and cholinephosphotransferase activities following a cryogenic brain injury in the rabbit. Biochem Pharmacol. 1987;36:3697–3700. doi: 10.1016/0006-2952(87)90022-0. [DOI] [PubMed] [Google Scholar]
- Attaix D, Ventadour S, Codran A, Bechet D, Taillandier D, Combaret L. The ubiquitin-proteasome system and skeletal muscle wasting. Essays Biochem. 2005;41:173–186. doi: 10.1042/EB0410173. [DOI] [PubMed] [Google Scholar]
- Bano G, Trevisan C, Carraro S, Solmi M, Luchini C, Stubbs B, Manzato E, Sergi G, Veronese N. Inflammation and sarcopenia: a systematic review and meta-analysis. Maturitas. 2017;96:10–15. doi: 10.1016/j.maturitas.2016.11.006. [DOI] [PubMed] [Google Scholar]
- Bhattacharya A, Muller FL, Liu Y, Sabia M, Liang H, Song W, Jang YC, Ran Q, Van Remmen H. Denervation induces cytosolic phospholipase A2-mediated fatty acid hydroperoxide generation by muscle mitochondria. J Biol Chem. 2009;284:46–55. doi: 10.1074/jbc.M806311200. [DOI] [PMC free article] [PubMed] [Google Scholar]
- Bhattacharya A, Hamilton R, Jernigan A, Zhang Y, Sabia M, Rahman MM, Li Y, Wei R, Chaudhuri A, Van Remmen H. Genetic ablation of 12/15-lipoxygenase but not 5-lipoxygenase protects against denervation-induced muscle atrophy. Free Radic Biol Med. 2014;67:30–40. doi: 10.1016/j.freeradbiomed.2013.10.002. [DOI] [PubMed] [Google Scholar]
- Bilodeau PA, Coyne ES, Wing SS. The ubiquitin proteasome system in atrophying skeletal muscle: roles and regulation. Am J Phys Cell Physiol. 2016;311:C392–C403. doi: 10.1152/ajpcell.00125.2016. [DOI] [PubMed] [Google Scholar]
- Bondesen BA, Mills ST, Kegley KM, Pavlath GK. The COX-2 pathway is essential during early stages of skeletal muscle regeneration. Am J Phys Cell Physiol. 2004;287:C475–C483. doi: 10.1152/ajpcell.00088.2004. [DOI] [PubMed] [Google Scholar]
- Cade WT. The manifold role of the mitochondria in skeletal muscle insulin resistance. Curr Opin Clin Nutr metab Care. 2018;21:267–272. doi: 10.1097/MCO.0000000000000480. [DOI] [PMC free article] [PubMed] [Google Scholar]
- Calder PC. N-3 polyunsaturated fatty acids, inflammation, and inflammatory diseases. Am J Clin Nutr. 2006;83:1505S–1519S. doi: 10.1093/ajcn/83.6.1505S. [DOI] [PubMed] [Google Scholar]
- Chen C, Ju R, Zhu L, Li J, Chen W, Zhang DC, Ye CY, Guo L. Carboxyamidotriazole alleviates muscle atrophy in tumor-bearing mice by inhibiting NF-kappaB and activating SIRT1. Naunyn Schmiedeberg's Arch Pharmacol. 2017;390:423–433. doi: 10.1007/s00210-017-1345-8. [DOI] [PubMed] [Google Scholar]
- Chucair-Elliott AJ, Ocanas SR, Stanford DR, Hadad N, Wronowski B, Otalora L, Stout MB, Freeman WM. Tamoxifen induction of Cre recombinase does not cause long-lasting or sexually divergent responses in the CNS epigenome or transcriptome: implications for the design of aging studies. Geroscience. 2019;41:691–708. doi: 10.1007/s11357-019-00090-2. [DOI] [PMC free article] [PubMed] [Google Scholar]
- Comim CM, Hoepers A, Ventura L, Freiberger V, Dominguini D, Mina F, Mendonca BP, Scaini G, Vainzof M, Streck EL, et al. Activity of Krebs cycle enzymes in mdx mice. Muscle Nerve. 2016;53:91–95. doi: 10.1002/mus.24704. [DOI] [PubMed] [Google Scholar]
- Cruz-Jentoft AJ, Landi F, Topinkova E, Michel JP. Understanding sarcopenia as a geriatric syndrome. Curr Opin Clin Nutr Metab Care. 2010;13:1–7. doi: 10.1097/MCO.0b013e328333c1c1. [DOI] [PubMed] [Google Scholar]
- Cui H, Kong Y, Zhang H. Oxidative stress, mitochondrial dysfunction, and aging. J Signal Transduct. 2012;2012:646354-67. [DOI] [PMC free article] [PubMed]
- Custodero C, Mankowski RT, Lee SA, Chen Z, Wu S, Manini TM, Hincapie Echeverri J, Sabba C, Beavers DP, Cauley JA, et al. Evidence-based nutritional and pharmacological interventions targeting chronic low-grade inflammation in middle-age and older adults: a systematic review and meta-analysis. Ageing Res Rev. 2018;46:42–59. doi: 10.1016/j.arr.2018.05.004. [DOI] [PMC free article] [PubMed] [Google Scholar]
- Dalle C, Ostermann AI, Konrad T, Coudy-Gandilhon C, Decourt A, Barthelemy JC, Roche F, Feasson L, Mazur A, Bechet D, et al. Muscle loss associated changes of oxylipin signatures during biological aging: an exploratory study from the PROOF cohort. J Gerontol A Biol Sci Med Sci. 2019;74:608–615. doi: 10.1093/gerona/gly187. [DOI] [PubMed] [Google Scholar]
- Debold EP. Potential molecular mechanisms underlying muscle fatigue mediated by reactive oxygen and nitrogen species. Front Physiol. 2015;6:239. doi: 10.3389/fphys.2015.00239. [DOI] [PMC free article] [PubMed] [Google Scholar]
- Dogra C, Changotra H, Mohan S, Kumar A. Tumor necrosis factor-like weak inducer of apoptosis inhibits skeletal myogenesis through sustained activation of nuclear factor-kappaB and degradation of MyoD protein. J Biol Chem. 2006;281:10327–10336. doi: 10.1074/jbc.M511131200. [DOI] [PubMed] [Google Scholar]
- Du J, Wang X, Miereles C, Bailey JL, Debigare R, Zheng B, Price SR, Mitch WE. Activation of caspase-3 is an initial step triggering accelerated muscle proteolysis in catabolic conditions. J Clin Invest. 2004;113:115–123. doi: 10.1172/JCI200418330. [DOI] [PMC free article] [PubMed] [Google Scholar]
- Ebert SM, Dyle MC, Kunkel SD, Bullard SA, Bongers KS, Fox DK, Dierdorff JM, Foster ED, Adams CM. Stress-induced skeletal muscle Gadd45a expression reprograms myonuclei and causes muscle atrophy. J Biol Chem. 2012;287:27290–27301. doi: 10.1074/jbc.M112.374777. [DOI] [PMC free article] [PubMed] [Google Scholar]
- Egawa T, Goto A, Ohno Y, Yokoyama S, Ikuta A, Suzuki M, Sugiura T, Ohira Y, Yoshioka T, Hayashi T, Goto K. Involvement of AMPK in regulating slow-twitch muscle atrophy during hindlimb unloading in mice. Am J Physiol Endocrinol Metab. 2015;309:E651–E662. doi: 10.1152/ajpendo.00165.2015. [DOI] [PubMed] [Google Scholar]
- Gillon A, Nielsen K, Steel C, Cornwall J, Sheard P. Exercise attenuates age-associated changes in motoneuron number, nucleocytoplasmic transport proteins and neuromuscular health. Geroscience. 2018;40:177–192. doi: 10.1007/s11357-018-0020-4. [DOI] [PMC free article] [PubMed] [Google Scholar]
- Gumucio JP, Mendias CL. Atrogin-1, MuRF-1, and sarcopenia. Endocrine. 2013;43:12–21. doi: 10.1007/s12020-012-9751-7. [DOI] [PMC free article] [PubMed] [Google Scholar]
- Hashimoto M, Inoue T, Katakura M, Hossain S, Mamun AA, Matsuzaki K, Arai H, Shido O. Differential effects of docoosahexaenoic and arachidonic acid on fatty acid composition and myosin heavy chain-related genes of slow- and fast-twitch skeletal muscle tissues. Mol Cell Biochem. 2016;415:169–181. doi: 10.1007/s11010-016-2689-y. [DOI] [PubMed] [Google Scholar]
- Hoxha M. Duchenne muscular dystrophy: focus on arachidonic acid metabolites. Biomed Pharmacother. 2019;110:796–802. doi: 10.1016/j.biopha.2018.12.034. [DOI] [PubMed] [Google Scholar]
- Huang TT, Yasunami M, Carlson EJ, Gillespie AM, Reaume AG, Hoffman EK, Chan PH, Scott RW, Epstein CJ. Superoxide-mediated cytotoxicity in superoxide dismutase-deficient fetal fibroblasts. Arch Biochem Biophys. 1997;344:424–432. doi: 10.1006/abbi.1997.0237. [DOI] [PubMed] [Google Scholar]
- Ivannikov MV, Van Remmen H. Sod1 gene ablation in adult mice leads to physiological changes at the neuromuscular junction similar to changes that occur in old wild-type mice. Free Radic Biol Med. 2015;84:254–262. doi: 10.1016/j.freeradbiomed.2015.03.021. [DOI] [PMC free article] [PubMed] [Google Scholar]
- Jackson MJ. Lack of CuZnSOD activity: a pointer to the mechanisms underlying age-related loss of muscle function, a commentary on “absence of CuZn superoxide dismutase leads to elevated oxidative stress and acceleration of age-dependent skeletal muscle atrophy”. Free Radic Biol Med. 2006;40:1900–1902. doi: 10.1016/j.freeradbiomed.2006.02.022. [DOI] [PubMed] [Google Scholar]
- Jang YC, Lustgarten MS, Liu Y, Muller FL, Bhattacharya A, Liang H, Salmon AB, Brooks SV, Larkin L, Hayworth CR, Richardson A, van Remmen H. Increased superoxide in vivo accelerates age-associated muscle atrophy through mitochondrial dysfunction and neuromuscular junction degeneration. FASEB J. 2010;24:1376–1390. doi: 10.1096/fj.09-146308. [DOI] [PMC free article] [PubMed] [Google Scholar]
- Jang YC, Liu Y, Hayworth CR, Bhattacharya A, Lustgarten MS, Muller FL, Chaudhuri A, Qi W, Li Y, Huang JY, Verdin E, Richardson A, van Remmen H. Dietary restriction attenuates age-associated muscle atrophy by lowering oxidative stress in mice even in complete absence of CuZnSOD. Aging Cell. 2012;11:770–782. doi: 10.1111/j.1474-9726.2012.00843.x. [DOI] [PMC free article] [PubMed] [Google Scholar]
- Janssen I, Shepard DS, Katzmarzyk PT, Roubenoff R. The healthcare costs of sarcopenia in the United States. J Am Geriatr Soc. 2004;52:80–85. doi: 10.1111/j.1532-5415.2004.52014.x. [DOI] [PubMed] [Google Scholar]
- Kinter CS, Lundie JM, Patel H, Rindler PM, Szweda LI, Kinter M. A quantitative proteomic profile of the Nrf2-mediated antioxidant response of macrophages to oxidized LDL determined by multiplexed selected reaction monitoring. PLoS One. 2012;7:e50016. doi: 10.1371/journal.pone.0050016. [DOI] [PMC free article] [PubMed] [Google Scholar]
- Koves TR, Ussher JR, Noland RC, Slentz D, Mosedale M, Ilkayeva O, Bain J, Stevens R, Dyck JR, Newgard CB, et al. Mitochondrial overload and incomplete fatty acid oxidation contribute to skeletal muscle insulin resistance. Cell Metab. 2008;7:45–56. doi: 10.1016/j.cmet.2007.10.013. [DOI] [PubMed] [Google Scholar]
- Kucukhuseyin O, Khalid S, Sabitaliyevich UY, Kucukhuseyin C. The role of PLC-IP3 cascade on 4-aminopyridine (4-AP) contracture in electrically-driven rat atrial and diaphragmatic strips: new evidence by neomycin and heparin. Cell Mol Biol (Noisy-le-Grand, France) 2018;64:26–32. [PubMed] [Google Scholar]
- Kurahashi T, Hamashima S, Shirato T, Lee J, Homma T, Kang ES, Fujii J. An SOD1 deficiency enhances lipid droplet accumulation in the fasted mouse liver by aborting lipophagy. Biochem Biophys Res Commun. 2015;467:866–871. doi: 10.1016/j.bbrc.2015.10.052. [DOI] [PubMed] [Google Scholar]
- Kuwata H, Nakatani E, Shimbara-Matsubayashi S, Ishikawa F, Shibanuma M, Sasaki Y, Yoda E, Nakatani Y, Hara S. Long-chain acyl-CoA synthetase 4 participates in the formation of highly unsaturated fatty acid-containing phospholipids in murine macrophages. Biochim Biophys Acta Mol Cell Biol Lipids. 2019;1864:1606–1618. doi: 10.1016/j.bbalip.2019.07.013. [DOI] [PubMed] [Google Scholar]
- Lagerwaard B, Nieuwenhuizen AG, de Boer VCJ, Keijer J. In vivo assessment of mitochondrial capacity using NIRS in locomotor muscles of young and elderly males with similar physical activity levels. Geroscience. 2020;42:299–310. doi: 10.1007/s11357-019-00145-4. [DOI] [PMC free article] [PubMed] [Google Scholar]
- Lamb GD, Westerblad H. Acute effects of reactive oxygen and nitrogen species on the contractile function of skeletal muscle. J Physiol. 2011;589:2119–2127. doi: 10.1113/jphysiol.2010.199059. [DOI] [PMC free article] [PubMed] [Google Scholar]
- Larkin LM, Davis CS, Sims-Robinson C, Kostrominova TY, Van Remmen H, Richardson A, Feldman EL, Brooks SV. Skeletal muscle weakness due to deficiency of CuZn-superoxide dismutase is associated with loss of functional innervation. Am J Phys Regul Integr Comp Phys. 2011;301:R1400–R1407. doi: 10.1152/ajpregu.00093.2011. [DOI] [PMC free article] [PubMed] [Google Scholar]
- Liu J, Peng Y, Wang X, Fan Y, Qin C, Shi L, Tang Y, Cao K, Li H, Long J, Liu J. Mitochondrial dysfunction launches dexamethasone-induced skeletal muscle atrophy via AMPK/FOXO3 signaling. Mol Pharm. 2016;13:73–84. doi: 10.1021/acs.molpharmaceut.5b00516. [DOI] [PubMed] [Google Scholar]
- Liu SZ, Jemiolo B, Lavin KM, Lester BE, Trappe SW, Trappe TA. Prostaglandin E2/cyclooxygenase pathway in human skeletal muscle: influence of muscle fiber type and age. J Appl Physiol (1985) 2016;120:546–551. doi: 10.1152/japplphysiol.00396.2015. [DOI] [PMC free article] [PubMed] [Google Scholar]
- Loehr JA, Stinnett GR, Hernandez-Rivera M, Roten WT, Wilson LJ, Pautler RG, Rodney GG. Eliminating Nox2 reactive oxygen species production protects dystrophic skeletal muscle from pathological calcium influx assessed in vivo by manganese-enhanced magnetic resonance imaging. J Physiol. 2016;594:6395–6405. doi: 10.1113/JP272907. [DOI] [PMC free article] [PubMed] [Google Scholar]
- Logan S, Royce GH, Owen D, Farley J, Ranjo-Bishop M, Sonntag WE, Deepa SS. Accelerated decline in cognition in a mouse model of increased oxidative stress. Geroscience. 2019;41:591–607. doi: 10.1007/s11357-019-00105-y. [DOI] [PMC free article] [PubMed] [Google Scholar]
- Mansouri A, Muller FL, Liu Y, Ng R, Faulkner J, Hamilton M, Richardson A, Huang TT, Epstein CJ, Van Remmen H. Alterations in mitochondrial function, hydrogen peroxide release and oxidative damage in mouse hind-limb skeletal muscle during aging. Mech Ageing Dev. 2006;127:298–306. doi: 10.1016/j.mad.2005.11.004. [DOI] [PubMed] [Google Scholar]
- McClung JM, Judge AR, Talbert EE, Powers SK. Calpain-1 is required for hydrogen peroxide-induced myotube atrophy. Am J Phys Cell Physiol. 2009;296:C363–C371. doi: 10.1152/ajpcell.00497.2008. [DOI] [PMC free article] [PubMed] [Google Scholar]
- McFadden SL, Ding D, Reaume AG, Flood DG, Salvi RJ. Age-related cochlear hair cell loss is enhanced in mice lacking copper/zinc superoxide dismutase. Neurobiol Aging. 1999;20:1–8. doi: 10.1016/s0197-4580(99)00018-4. [DOI] [PubMed] [Google Scholar]
- McFadden SL, Ding D, Salvi R. Anatomical, metabolic and genetic aspects of age-related hearing loss in mice. Audiology. 2001;40:313–321. [PubMed] [Google Scholar]
- Metsalu T, Vilo J. ClustVis: a web tool for visualizing clustering of multivariate data using principal component analysis and heatmap. Nucleic Acids Res. 2015;43:W566–W570. doi: 10.1093/nar/gkv468. [DOI] [PMC free article] [PubMed] [Google Scholar]
- Mittal A, Bhatnagar S, Kumar A, Lach-Trifilieff E, Wauters S, Li H, Makonchuk DY, Glass DJ, Kumar A. The TWEAK-Fn14 system is a critical regulator of denervation-induced skeletal muscle atrophy in mice. J Cell Biol. 2010;188:833–849. doi: 10.1083/jcb.200909117. [DOI] [PMC free article] [PubMed] [Google Scholar]
- Muller FL, Song W, Liu Y, Chaudhuri A, Pieke-Dahl S, Strong R, Huang TT, Epstein CJ, Roberts LJ, 2nd, Csete M, et al. Absence of CuZn superoxide dismutase leads to elevated oxidative stress and acceleration of age-dependent skeletal muscle atrophy. Free Radic Biol Med. 2006;40:1993–2004. doi: 10.1016/j.freeradbiomed.2006.01.036. [DOI] [PubMed] [Google Scholar]
- Muller FL, Song W, Jang YC, Liu Y, Sabia M, Richardson A, Van Remmen H. Denervation-induced skeletal muscle atrophy is associated with increased mitochondrial ROS production. Am J Phys Regul Integr Comp Phys. 2007;293:R1159–R1168. doi: 10.1152/ajpregu.00767.2006. [DOI] [PubMed] [Google Scholar]
- Nakao R, Shimba S, Oishi K. Ketogenic diet induces expression of the muscle circadian gene Slc25a25 via neural pathway that might be involved in muscle thermogenesis. Sci Rep. 2017;7:2885. doi: 10.1038/s41598-017-03119-8. [DOI] [PMC free article] [PubMed] [Google Scholar]
- Nelson ME, Parker BL, Burchfield JG, Hoffman NJ, Needham EJ, Cooke KC, Naim T, Sylow L, Ling NX, Francis D, et al. Phosphoproteomics reveals conserved exercise-stimulated signaling and AMPK regulation of store-operated calcium entry. EMBO J. 2019;38:e102578. doi: 10.15252/embj.2019102578. [DOI] [PMC free article] [PubMed] [Google Scholar]
- Nilsson MI, Greene NP, Dobson JP, Wiggs MP, Gasier HG, Macias BR, Shimkus KL, Fluckey JD. Insulin resistance syndrome blunts the mitochondrial anabolic response following resistance exercise. Am J Physiol Endocrinol Metab. 2010;299:E466–E474. doi: 10.1152/ajpendo.00118.2010. [DOI] [PubMed] [Google Scholar]
- Novak ML, Billich W, Smith SM, Sukhija KB, McLoughlin TJ, Hornberger TA, Koh TJ. COX-2 inhibitor reduces skeletal muscle hypertrophy in mice. Am J Phys Regul Integr Comp Phys. 2009;296:R1132–R1139. doi: 10.1152/ajpregu.90874.2008. [DOI] [PMC free article] [PubMed] [Google Scholar]
- Olofsson EM, Marklund SL, Behndig A. Glucose-induced cataract in CuZn-SOD null lenses: an effect of nitric oxide? Free Radic Biol Med. 2007;42:1098–1105. doi: 10.1016/j.freeradbiomed.2007.01.012. [DOI] [PubMed] [Google Scholar]
- Pant M, Bal NC, Periasamy M. Sarcolipin: a key thermogenic and metabolic regulator in skeletal muscle. Trends Endocrinol Metab. 2016;27:881–892. doi: 10.1016/j.tem.2016.08.006. [DOI] [PMC free article] [PubMed] [Google Scholar]
- Pharaoh G, Sataranatarajan K, Street K, Hill S, Gregston J, Ahn B, Kinter C, Kinter M, Van Remmen H. Metabolic and stress response changes precede disease onset in the spinal cord of mutant SOD1 ALS mice. Front Neurosci. 2019;13:487. doi: 10.3389/fnins.2019.00487. [DOI] [PMC free article] [PubMed] [Google Scholar]
- Piekarz KM, Bhaskaran S, Sataranatarajan K, Street K, Premkumar P, Saunders D, et al. Molecular changes associated with spinal cord aging. Geroscience. 2020. doi: 10.1007/s11357-020-00172-6. [DOI] [PMC free article] [PubMed]
- Pompeia C, Freitas JJ, Kim JS, Zyngier SB, Curi R. Arachidonic acid cytotoxicity in leukocytes: implications of oxidative stress and eicosanoid synthesis. Biol Cell. 2002;94:251–265. doi: 10.1016/s0248-4900(02)01200-5. [DOI] [PubMed] [Google Scholar]
- Powers SK, Morton AB, Ahn B, Smuder AJ. Redox control of skeletal muscle atrophy. Free Radic Biol Med. 2016;98:208–217. doi: 10.1016/j.freeradbiomed.2016.02.021. [DOI] [PMC free article] [PubMed] [Google Scholar]
- Qaisar R, Bhaskaran S, Premkumar P, Ranjit R, Natarajan KS, Ahn B, Riddle K, Claflin DR, Richardson A, Brooks SV, van Remmen H. Oxidative stress-induced dysregulation of excitation-contraction coupling contributes to muscle weakness. J Cachexia Sarcopenia Muscle. 2018;9:1003–1017. doi: 10.1002/jcsm.12339. [DOI] [PMC free article] [PubMed] [Google Scholar]
- Qaisar R, Bhaskaran S, Ranjit R, Sataranatarajan K, Premkumar P, Huseman K, Van Remmen H. Restoration of SERCA ATPase prevents oxidative stress-related muscle atrophy and weakness. Redox Biol. 2019;20:68–74. doi: 10.1016/j.redox.2018.09.018. [DOI] [PMC free article] [PubMed] [Google Scholar]
- Quehenberger O, Armando AM, Brown AH, Milne SB, Myers DS, Merrill AH, Bandyopadhyay S, Jones KN, Kelly S, Shaner RL, Sullards CM, Wang E, Murphy RC, Barkley RM, Leiker TJ, Raetz CRH, Guan Z, Laird GM, Six DA, Russell DW, McDonald JG, Subramaniam S, Fahy E, Dennis EA. Lipidomics reveals a remarkable diversity of lipids in human plasma. J Lipid Res. 2010;51:3299–3305. doi: 10.1194/jlr.M009449. [DOI] [PMC free article] [PubMed] [Google Scholar]
- Quehenberger O, Dahlberg-Wright S, Jiang J, Armando AM, Dennis EA. Quantitative determination of esterified eicosanoids and related oxygenated metabolites after base hydrolysis. J Lipid Res. 2018;59:2436–2445. doi: 10.1194/jlr.D089516. [DOI] [PMC free article] [PubMed] [Google Scholar]
- Rodriguez J, Caille O, Ferreira D, Francaux M. Pomegranate extract prevents skeletal muscle of mice against wasting induced by acute TNF-alpha injection. Mol Nutr Food Res. 2017;61: 1600169-81. [DOI] [PubMed]
- Roubenoff R, Hughes VA. Sarcopenia: current concepts. J Gerontol A Biol Sci Med Sci. 2000;55:M716–M724. doi: 10.1093/gerona/55.12.m716. [DOI] [PubMed] [Google Scholar]
- Rudolf R, Khan MM, Labeit S, Deschenes MR. Degeneration of neuromuscular junction in age and dystrophy. Front Aging Neurosci. 2014;6:99. doi: 10.3389/fnagi.2014.00099. [DOI] [PMC free article] [PubMed] [Google Scholar]
- Sakellariou GK, McDonagh B, Porter H, Giakoumaki II, Earl KE, Nye GA, Vasilaki A, Brooks SV, Richardson A, Van Remmen H, McArdle A, Jackson MJ. Comparison of whole body SOD1 knockout with muscle-specific SOD1 knockout mice reveals a role for nerve redox signaling in regulation of degenerative pathways in skeletal muscle. Antioxid Redox Signal. 2018;28:275–295. doi: 10.1089/ars.2017.7249. [DOI] [PMC free article] [PubMed] [Google Scholar]
- Sakiyama H, Fujiwara N, Yoneoka Y, Yoshihara D, Eguchi H, Suzuki K. Cu,Zn-SOD deficiency induces the accumulation of hepatic collagen. Free Radic Res. 2016;50:666–677. doi: 10.3109/10715762.2016.1164856. [DOI] [PubMed] [Google Scholar]
- Sandri M. Protein breakdown in muscle wasting: role of autophagy-lysosome and ubiquitin-proteasome. Int J Biochem Cell Biol. 2013;45:2121–2129. doi: 10.1016/j.biocel.2013.04.023. [DOI] [PMC free article] [PubMed] [Google Scholar]
- Sandri M, El Meslemani AH, Sandri C, Schjerling P, Vissing K, Andersen JL, Rossini K, Carraro U, Angelini C. Caspase 3 expression correlates with skeletal muscle apoptosis in Duchenne and facioscapulo human muscular dystrophy. A potential target for pharmacological treatment? J Neuropathol Exp Neurol. 2001;60:302–312. doi: 10.1093/jnen/60.3.302. [DOI] [PubMed] [Google Scholar]
- Sataranatarajan K, Qaisar R, Davis C, Sakellariou GK, Vasilaki A, Zhang Y, Liu Y, Bhaskaran S, McArdle A, Jackson M, Brooks SV, Richardson A, van Remmen H. Neuron specific reduction in CuZnSOD is not sufficient to initiate a full sarcopenia phenotype. Redox Biol. 2015;5:140–148. doi: 10.1016/j.redox.2015.04.005. [DOI] [PMC free article] [PubMed] [Google Scholar]
- Sauc S, Frieden M. Neurological and motor disorders: TRPC in the skeletal muscle. Adv Exp Med Biol. 2017;993:557–575. doi: 10.1007/978-3-319-57732-6_28. [DOI] [PubMed] [Google Scholar]
- Shi Y, Ivannikov MV, Walsh ME, Liu Y, Zhang Y, Jaramillo CA, Macleod GT, Van Remmen H. The lack of CuZnSOD leads to impaired neurotransmitter release, neuromuscular junction destabilization and reduced muscle strength in mice. PLoS One. 2014;9:e100834. doi: 10.1371/journal.pone.0100834. [DOI] [PMC free article] [PubMed] [Google Scholar]
- Siparsky PN, Kirkendall DT, Garrett WE., Jr Muscle changes in aging: understanding sarcopenia. Sports Health. 2014;6:36–40. doi: 10.1177/1941738113502296. [DOI] [PMC free article] [PubMed] [Google Scholar]
- Sivakumar AS, Hwang I. Effects of Sunphenon and Polyphenon 60 on proteolytic pathways, inflammatory cytokines and myogenic markers in H2O2-treated C2C12 cells. J Biosci. 2015;40:53–59. doi: 10.1007/s12038-015-9503-y. [DOI] [PubMed] [Google Scholar]
- Sopariwala DH, Pant M, Shaikh SA, Goonasekera SA, Molkentin JD, Weisleder N, Ma J, Pan Z, Periasamy M. Sarcolipin overexpression improves muscle energetics and reduces fatigue. J Appl Physiol (1985) 2015;118:1050–1058. doi: 10.1152/japplphysiol.01066.2014. [DOI] [PMC free article] [PubMed] [Google Scholar]
- Standley RA, Liu SZ, Jemiolo B, Trappe SW, Trappe TA. Prostaglandin E2 induces transcription of skeletal muscle mass regulators interleukin-6 and muscle RING finger-1 in humans. Prostaglandins Leukot Essent Fat Acids. 2013;88:361–364. doi: 10.1016/j.plefa.2013.02.004. [DOI] [PMC free article] [PubMed] [Google Scholar]
- Sun K, Ma R, Cui X, Campos B, Webster R, Brockman D, Myatt L. Glucocorticoids induce cytosolic phospholipase A2 and prostaglandin H synthase type 2 but not microsomal prostaglandin E synthase (PGES) and cytosolic PGES expression in cultured primary human amnion cells. J Clin Endocrinol Metab. 2003;88:5564–5571. doi: 10.1210/jc.2003-030875. [DOI] [PubMed] [Google Scholar]
- Thomson DM. The role of AMPK in the regulation of skeletal muscle size, hypertrophy, and regeneration. Int J Mol Sci. 2018;19: 3125-45 [DOI] [PMC free article] [PubMed]
- Tithof PK, Roberts MP, Guan W, Elgayyar M, Godkin JD. Distinct phospholipase A2 enzymes regulate prostaglandin E2 and F2alpha production by bovine endometrial epithelial cells. Reprod Biol Endocrinol. 2007;5:16. doi: 10.1186/1477-7827-5-16. [DOI] [PMC free article] [PubMed] [Google Scholar]
- Tupling AR, Bombardier E, Gupta SC, Hussain D, Vigna C, Bloemberg D, Quadrilatero J, Trivieri MG, Babu GJ, Backx PH, Periasamy M, MacLennan DH, Gramolini AO. Enhanced Ca2+ transport and muscle relaxation in skeletal muscle from sarcolipin-null mice. Am J Phys Cell Physiol. 2011;301:C841–C849. doi: 10.1152/ajpcell.00409.2010. [DOI] [PMC free article] [PubMed] [Google Scholar]
- Vaughan VC, Sullivan-Gunn M, Hinch E, Martin P, Lewandowski PA. Eicosapentaenoic acid and oxypurinol in the treatment of muscle wasting in a mouse model of cancer cachexia. PLoS One. 2012;7:e45900. doi: 10.1371/journal.pone.0045900. [DOI] [PMC free article] [PubMed] [Google Scholar]
- Vella L, Markworth JF, Farnfield MM, Maddipati KR, Russell AP, Cameron-Smith D. Intramuscular inflammatory and resolving lipid profile responses to an acute bout of resistance exercise in men. Phys Rep. 2019;7:e14108. doi: 10.14814/phy2.14108. [DOI] [PMC free article] [PubMed] [Google Scholar]
- Wang Y, Armando AM, Quehenberger O, Yan C, Dennis EA. Comprehensive ultra-performance liquid chromatographic separation and mass spectrometric analysis of eicosanoid metabolites in human samples. J Chromatogr A. 2014;1359:60–69. doi: 10.1016/j.chroma.2014.07.006. [DOI] [PMC free article] [PubMed] [Google Scholar]
- Whidden MA, Smuder AJ, Wu M, Hudson MB, Nelson WB, Powers SK. Oxidative stress is required for mechanical ventilation-induced protease activation in the diaphragm. J Appl Physiol (1985) 2010;108:1376–1382. doi: 10.1152/japplphysiol.00098.2010. [DOI] [PMC free article] [PubMed] [Google Scholar]
- Wright DC, Hucker KA, Holloszy JO, Han DH. Ca2+ and AMPK both mediate stimulation of glucose transport by muscle contractions. Diabetes. 2004;53:330–335. doi: 10.2337/diabetes.53.2.330. [DOI] [PubMed] [Google Scholar]
- Yakabe M. Aging-related frailty and sarcopenia. The relationship between "inflammaging" and frailty/sarcopenia. Clin Calcium. 2018;28:1215–1219. [PubMed] [Google Scholar]
Associated Data
This section collects any data citations, data availability statements, or supplementary materials included in this article.
Supplementary Materials
(PPTX 218 kb)