Abstract
In this study, biological deoxygenation of graphene oxide (GO) using an Eclipta prostrata phytoextract was performed via the infusion method. The presence of oxide groups on the surface of graphene and removal of oxides groups by reduction were characterized through morphological and structural analyses. Field emission scanning electron microscopy images revealed that the synthesized GO and rGO were smooth and morphologically sound. Transmission electron microscopy images showed rGO developing lattice fringes with smooth edges and transparent sheets. Atomic force microscopy images showed an increase in the surface roughness of graphite oxide (14.29 nm) compared with that of graphite (1.784 nm) due to the presence of oxide groups after oxidation, and the restoration of surface roughness to 2.051 nm upon reduction. Energy dispersive X-ray analysis indicated a difference in the carbon/oxygen ratio between GO (1.90) and rGO (2.70). Fourier-transform infrared spectroscopy spectrum revealed peak stretches at 1029, 1388, 1578, and 1630 cm−1 for GO, and a decrease in the peak intensity after reduction that confirmed the removal of oxide groups. X-ray photoelectron microscopy also showed a decrease in the intensity of oxygen peak after reduction. In addition, thermogravimetric analysis suggested that rGO was less thermally stable than graphite, graphite oxide, and GO, with rGO decomposing after heating at temperatures ranging from room temperature to 600 °C.
Keywords: Reduced graphene oxide, Graphene, Medicinal phytoextract, Cleaner production, Eclipta prostrate, Hummer’s method
Introduction
Graphene is a single atomic planar film with a hexagonal honeycomb lattice composed of carbon atoms with an sp2 hybrid orbit that are covalently bonded to three other atoms through 0.142 nm carbon–carbon bonds (Zhang et al. 2017). It has gradually become one of the most promising nanomaterials, and the application of reduced graphene nanomaterials has attracted further attention in various fields including medical, electronic, electrical, chemical sensor, biosensor, mechanical, and wastewater treatment (Gao 2015; Yavari and Koratkar 2012; Pena-Bahamonde et al. 2018; Aboelfetoh et al. 2020). Recently, Wu et al. (2020) reported that reduced graphene could be used to detect NH3 and NO2 at room temperature. In particular, the greatest interest has been in medical applications requiring naturally produced non-immunogenic graphene materials.
Generally, the micromechanical cleavage method is used to produce graphene from three-dimensional graphite. To produce large quantities of reduced graphene oxide (rGO), graphite is usually first oxidized chemically into graphene oxide (GO) (Gao 2015; Gopinath et al. 2018). Various methods are used to produce GO from graphite, such as the Hummers, Brodie’s, and Staudenmaier methods (Poh et al. 2012). Among these, the Hummer’s method, introduced by Hummers in 1958, is historically the most common method used for preparing GO. It has long been considered quick, efficient, and safe, using a mixture of potassium permanganate, sulfuric acid, and sodium nitrate for oxidizing graphite. Recently, the use of sodium nitrate was eliminated from the Hummer’s and modified Hummer’s methods, owing to the advent of green technology (Chen et al. 2015). However, toxic chemicals are often used to reduce GO to graphene, and it cannot be used in biomedical applications due to its toxicity. To reduce the use of chemicals in deoxygenating GO, biological reducing agents including phytoextracts, bacteria, and fungi have gained popularity among researchers. In this study, we used an aqueous Eclipta prostrata phytoextract as the biological reductant for preparing rGO.
Eclipta prostrata, commonly known as false daisy and belongs to a family of medicinal plants known as Asteraceae. E. prostrata is an annual plant and is widely distributed between altitudes of 0 and 2000 m in tropical and subtropical regions worldwide (Chung et al. 2017). This plant usually grows along rivers, ponds, and ditches. All parts of the plant contain useful chemical compounds, such as ecliptine, alkaloids, nicotine, and coumarin; the leaf extract is used in Ayurvedic medicine as a powerful liver tonic and rejuvenator, especially for improving quality of hair. Therefore, E. prostrata phytoextract can be used as a biological reductant for reducing GO. The successful reduction of GO to rGO by aqueous E. prostrata was confirmed by morphological—field emission scanning electron microscopy (FE-SEM), transmission electron microscopy (TEM), atomic force microscopy (AFM), structural X-ray photoelectron spectroscopy (XPS), Fourier-transform infrared spectroscopy (FTIR), and thermal stability thermogravimetric analysis (TGA) analyses. The nanosized rGO synthesized using E. prostrata extract could be suitable for a wide range of biomedical applications including biosensing, drug delivery, and bioimaging.
Materials and methods
Materials
Eclipta prostrata was collected from Tamil Nadu, India. Graphite powder, sulfuric acid (98%), hydrochloric acid (37%), hydrogen peroxide, and potassium permanganate were purchased from Sigma-Aldrich (St. Louis, MO, USA). Whatman filter paper was procured from Sartorius Stedim Biotech (Göttingen, Germany). Carbon-coated copper grids for TEM analysis were purchased from Electron Microscopy Sciences (Hatfield, PA, USA). Other reagents used were of analytical grade.
Preparation of aqueous E. prostrata phytoextract
Eclipta prostrata leaves were cut into small pieces and washed with tap water followed by sterile distilled water to remove impurities. Next, the washed leaves were dried under shade for one week to ensure that all leaves were completely dried. The dried leaves were ground into a fine powder, and about 1 g powder was mixed with 50 mL of distilled water in a beaker and agitated at 50 °C for 30 min. Finally, the aqueous phytoextract was filtered using Whatman no. 1 filter paper and stored in a glass vial at 4 °C until further use.
Preparation of graphene oxide (GO)
To prepare GO, about 3 g of graphite was mixed with 70 mL of 0.5 M sulfuric acid in a beaker on ice and stirred at a constant speed. Next, 9 g of potassium permanganate was slowly added to the mixture and stirred for 30 min with the temperature maintained at 35 °C. Next, 150 mL of distilled water was added to the mixture and the temperature was increased to 95 °C, until the color was observed to change to dark brown, indicating graphene oxidation. The reaction was terminated with 500 mL of distilled water and 15 mL of 30% hydrogen peroxide, and the color of the solution changed to bright yellow. The suspension was washed with 10 mL of 1 M HCl and centrifuged at 7000 rpm for 15 min. The resulting supernatant was decanted, and the sediment was washed with distilled water and re-centrifuged. The pellet was air-dried to obtain graphene oxide powder and stored in a glass vial at room temperature until further characterization (Paulchamy et al. 2015).
Biological reduction of graphene oxide (rGO)
To reduce GO (rGO), 0.05 g of prepared GO was mixed with 200 mL of water in a 500 mL beaker and placed in the ultrasonic bath for 2 h. Next, the aqueous phytoextract (20 mL) was added to the sonicated solution and stirred magnetically at room temperature to disperse rGO homogenously. The dispersed rGO was separated from the phytoextract solution by centrifugation at 10,000 rpm for 15 min, followed by several washes with distilled water to remove unwanted side products deposited on the rGO sheets post reduction (Lee and Kim 2014). UV spectrometric analysis was used to confirm the reduction reaction. After UV analysis, the rGOs settle down at the bottom of the beaker, and thus, should be washed again several times with distilled water for removing unwanted waste matter. The rGO samples were then stored in a glass vial until further analyses.
Characterization of graphite and its derivatives
Morphological analyses
The morphology and size of graphite, graphite oxide, GO, and rGO were examined by FE-SEM (S-4300 SE, Hitachi High-Technologies, Tokyo, Japan). FE-SEM samples were prepared by dropping the suspension on a silicon wafer and allowing the solvent to evaporate. The wafer was adhered to the aluminum sample holder using conductive carbon. The elemental composition of graphite, graphite oxide, GO, and rGO was analyzed using EDX. Variation in the stacking characteristics of graphite, graphite oxide, GO, and rGO was analyzed using TEM (JEM-2100F, JEOL Ltd., Tokyo, Japan). The samples were prepared by placing a small quantity of the samples on a copper 200-mesh TEM grid and covering the grids with thin amorphous carbon films for observation. The samples were dried using a vacuum desiccator. AFM (Nano Scope, Veeco, Plainview, New York, USA) was used to accurately determine the sheet thickness, morphological features, and lateral dimensions of GO. AFM samples were prepared by suspending the treated graphite, graphite oxide, GO, and rGO in N, N-dimethylformamide and subjecting the samples to ultrasonic treatment for 30 min. The suspension was then spin-coated at 2000 rpm on clean glass, and AFM analysis and imaging were performed in contact mode under ambient conditions to accurately determine the sheet thickness.
Structural analyses
XPS was used to identify the surface composition of graphite, graphite oxide, GO, and rGO. XPS (K-Alpha, Thermo Fisher Scientific, Oxford, England) characterization was carried out at a voltage of 12 kV and current of 10 mA to assess any changes in the carbon/oxygen (C/O) ratio and functional groups. XPS samples were prepared by dispersing them in water and dropping them on silica substrates. Specifically, for rGO, XPS analysis was carried out under the operating condition of 1027 Pa using a 100 W X-ray source; for GO, an X-ray beam source of 1486.6 eV and 14 kV was used to determine sample surface. FTIR (Vertex 80v, Bruker, Ettlingen, Germany) was used to analyze the bonding interactions of graphene before and after oxidation. About 3 mg of sample was mixed with a KBr pellet to study the FTIR spectrum from 4000 to 400 cm−1. The thermal properties of graphite, graphite oxide, GO, and rGO were assessed using TGA (TG 209 F3 Tarsus, NETZSCH Thermal Analysis, Selb, Germany), with a scanning rate of 10 °C min−1 in a nitrogen atmosphere. All the samples were tested at temperatures ranging from room temperature to 600 °C using ~ 10 mg sample.
Results and discussion
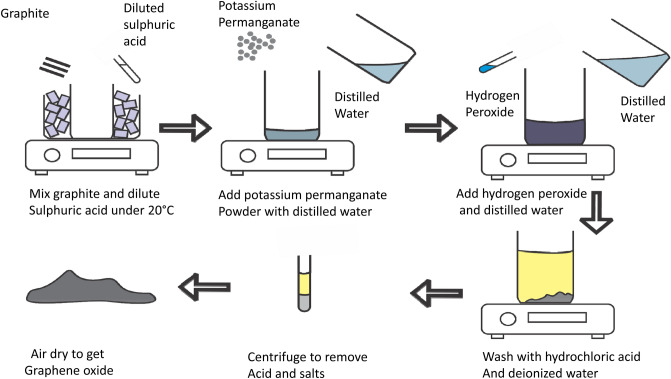
To synthesize GO, graphite powder was oxidized to produce different oxygen-containing functional groups, such as hydroxyl and alkoxy groups, that could bind to surrounding surfaces, including the edges and basal planes of the graphite layer (Fig. 1). Graphite was exfoliated using an ultrasonicator to produce an aqueous dispersion of GO to which aqueous E. prostrata phytoextract was added to obtain rGO by stirring for 4 h at room temperature followed by overnight reduction for 15 h. Morphological, structural, and optical analyses were performed to confirm the synthesis of the reduced graphene material. In addition, thermogravimetric analysis was used to determine the thermal stability of graphite and its derivatives.
Fig. 1.
Schematic diagram for preparation of graphene oxide from graphite. All steps followed are displayed
Morphological and topographic analyses
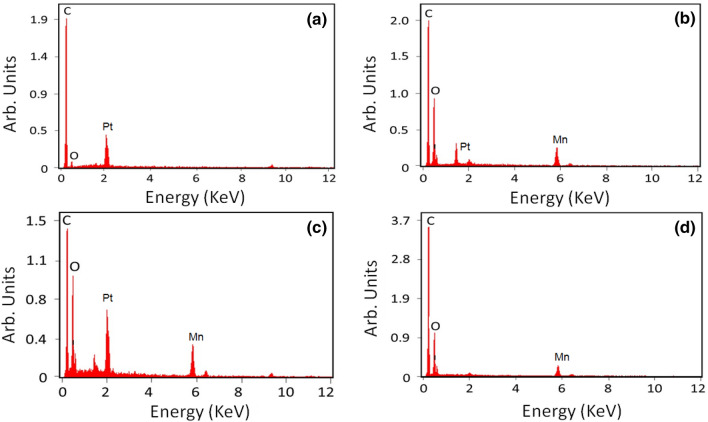
FESEM and EDX analyses were used to investigate the morphology and elemental composition, respectively. Figure 2 shows the images of graphite, graphite oxide, GO, and rGO at a magnification of 5 μm. As observed in the dark-colored region, the graphite sheets tended to stack clumped together as a thick cake (Fig. 2a). This may be due to the strong Van der Waals force between the graphene layers, which cause them to attract one another (Aunkor et al. 2016). After oxidation, oxygen-containing functional groups began to appear on the surface of graphene. The images of graphite oxide showed that the outer layers were ready to be exfoliated into matrices, which would lead to better dispersion (Bhawal et al. 2016). Figure 2b shows that the corners and edges of graphite oxide were rounded before exfoliation and transformed into sharp edges after exfoliation. After exfoliation, the FESEM images of GO displayed interconnected, three-dimensional, well-defined graphene sheets similar in structure to a loose sponge due to the porous networking system (Bykkam et al. 2013). Furthermore, FESEM was also used to evaluate the uniform distribution and degree of exfoliation of graphite oxide into GO (Johra et al. 2014) (Fig. 2c). In addition, due to the reduced number of graphene layers in GO, its FESEM images showed a more open structure and better dispersion when compared with graphite (Sharma et al. 2016). Post deoxygenating GO by aqueous E. prostrata extract, FESEM images of rGO showed a clear, highly wrinkled surface (Fig. 2d). At higher magnifications, the synthesized rGO displayed a uniform shape and smooth surface, and this surface clearly developed the sinuate structural characteristics of rGO after reduction (Gopinath et al. 2018). This could be caused by the removal of oxygen-containing functional groups in GO (Sharma et al. 2016). EDX analysis showed that the C/O ratio of graphite was 9.81, and such a high C/O ratio indicates that pure graphite mainly contains carbon (Table 1; Fig. 3a). It also confirmed the presence of oxygen-containing functional groups in graphite oxide and showed a decrease in the C/O ratio from 9.81 to 2.03 for pristine graphite (Table 1; Fig. 3b). In contrast to graphite oxide, GO had a slightly lower C/O ratio (1.90 v 2.03) due to the reduced number of graphene layers post exfoliation (Table 1; Fig. 3c). Furthermore, the C/O ratio for rGO was 2.70, which was higher than those for graphite oxide (2.03) and GO (1.90), indicating that the oxygen on the surface of GO was effectively removed by the aqueous E. prostrata extract (Table 1; Fig. 3d).
Fig. 2.
Field emission-Scanning electron microscope images. a Graphite; b graphite oxide; c graphene oxide; d reduced graphene oxide. Scale bar was followed at 5 µm
Table 1.
EDX measurements of graphite, graphite oxide, GO and rGO
| No | Material | C (at %) | O (at %) | C/O ratio |
|---|---|---|---|---|
| 1 | Graphite | 90.75 | 9.25 | 9.81 |
| 2 | Graphite oxide | 50.75 | 25.02 | 2.03 |
| 3 | GO | 44.9 | 23.59 | 1.90 |
| 4 | rGO | 60.39 | 22.34 | 2.70 |
Fig. 3.
Energy dispersive X-ray analysis. a Graphite; b graphite oxide; c graphene oxide; d reduced graphene oxide. The appropriate elements are displayed
TEM analysis also showed the morphology of graphite, graphite oxide, GO, and synthesized rGO. Figure 4a displays images of the lengthy platelet-like graphite. The dark-colored region indicates the graphite pile (Kuila et al. 2012). In addition, TEM images of graphite displayed increased folding and wrinkling. After oxidation, the oxides were present on the edges, corners, or planes of the graphene layers and had increased in the internal gaps between graphene layers (Fig. 4b), where the dark-colored region was less visible as compared with graphite. Furthermore, the edges and corners of graphite oxide seemed to be crumpled. Exfoliated GO showed a relatively flat structure with low contrast, indicating a thickness of only few graphene layers and sharp edges (Jana et al. 2014) (Fig. 4c). After deoxygenation by aqueous E. prostrata extract, the rGO sheets (Fig. 4d) clearly displayed lattice fringes with smooth edges and transparent sheets (Shalaby et al. 2015). In addition, a flat morphology with decreased folding and wrinkling was also observed (Hou et al. 2016).
Fig. 4.
Transmission electron microscope images. a Graphite; b graphite oxide; c graphene oxide; d reduced graphene oxide. Scale bar followed is at 200 nm
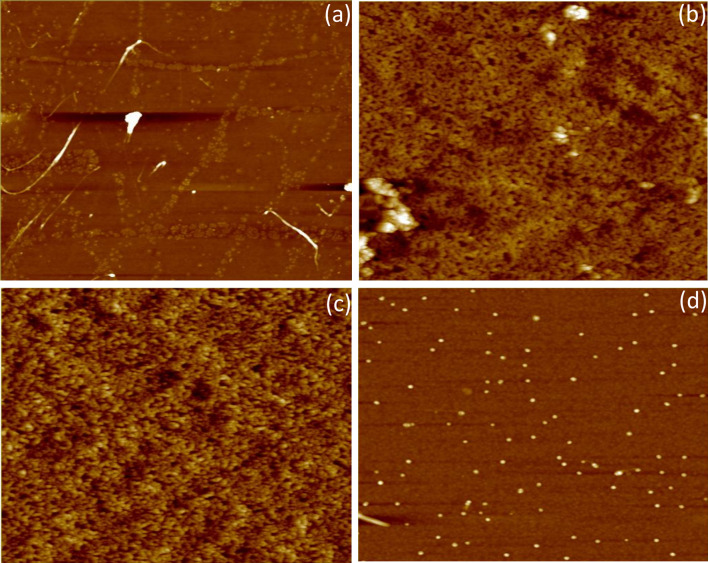
AFM was used to determine the surface roughness of graphite, graphite oxide, GO, and rGO. The Z-range of graphite increased from 62.003 to 176.16 nm (a difference of 114.157 nm), suggesting that oxidation was successful, because the presence of oxide groups and intercalation of water molecules in the gaps between the graphene layers caused the Z-range to increase and the graphite oxide to become thicker (Aunkor et al. 2016). The RMS value of graphite oxide was higher than that of graphite, which suggests that the presence of oxide groups on the surface and edges of graphite oxide causes its surface to become relatively rough as compared with that of graphite (Drewniak et al. 2016) (Fig. 5a, b). During exfoliation, the internal van der Waals forces between graphene layers in graphite oxide weaken, and the layers tend to separate from one another; this caused the Z-range to decrease to 60.07 nm (Oh and Zhang 2011). Exfoliation also polished the surface, edges, and corners of the graphene layers, thus decreasing the surface roughness of GO (8.141 nm) in comparison with that of graphite oxide (14.285 nm) (Fig. 5c). After successive reduction using aqueous E. prostrata extract, the decrease in the Z-range of rGO suggests that oxide groups have been removed, resulting in the formation of thinner sheets. Moreover, the RMS of rGO, which was only 2.051 nm, suggests the restored surface roughness after deoxygenation (Fig. 5d) (Da-Costa-Rocha et al. 2014).
Fig. 5.
Atomic force microscope images. a Graphite; b graphite oxide; c graphene oxide; d reduced graphene oxide
Structural analyses
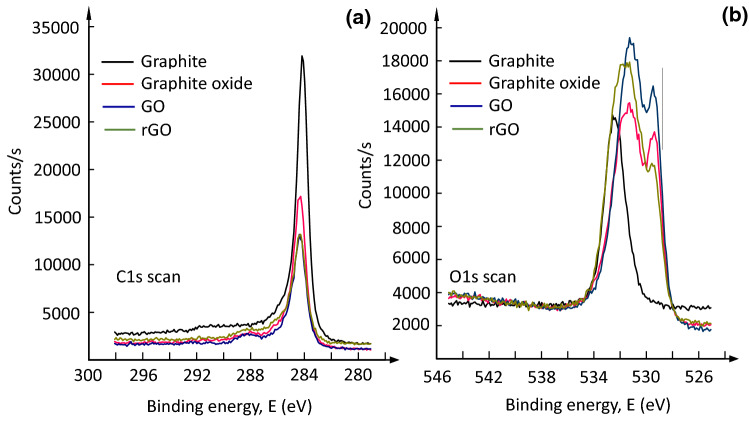
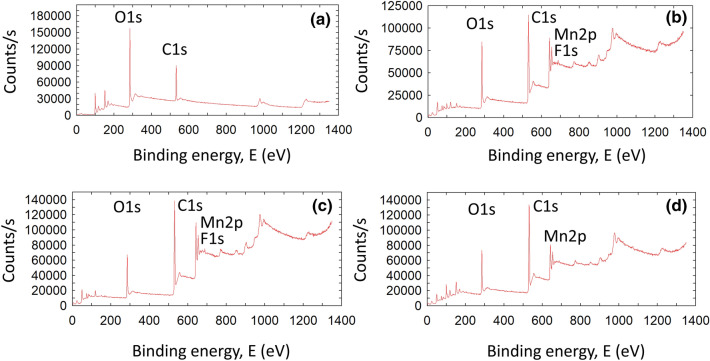
Figure 6a shows the C1s scans of graphite, graphite oxide, GO, and rGO. Graphite and its derivatives had a carbon peak with a binding energy of 284.5 eV, which corresponded to the C–C element peak. After oxidation, the carbon peak count of graphite oxide decreased due to the presence of oxide groups and was similar to that of exfoliated GO and rGO (Yu et al. 2014). The O1s scan of graphite exhibited an oxygen peak at 533 eV, which can be attributed to C–O and the moisture content; however, after oxidation, the oxygen peak of graphite oxide differed from that of graphite and exhibited component peaks of C=O groups at 529–531 eV (Drewniak et al. 2016). Furthermore, exfoliated GO also showed an oxygen peak similar to that of graphite oxide, with a higher peak count due to exfoliation (Fig. 6b). After reduction by aqueous E. prostrata extract, the C=O group peak at 529 eV further decreased due to the removal of functional groups (Gao 2015). In addition, Fig. 7 displays the XPS survey scan of graphite, graphite oxide, GO, and rGO and shows additional aluminum, iron, manganese, and silicon peaks resulting from side reactions between residual components of the reaction mixture. These peaks showed the involvement of reagents in the oxidation and reduction reactions (Aunkor et al. 2016).
Fig. 6.
X-ray photoelectron spectroscopy pattern. a C1s and b O1s. Graphite, graphene oxide and reduced graphene oxide are overlapped
Fig. 7.
X-ray photoelectron spectroscopy. Survey scan of, a graphite; b graphite oxide; c graphene oxide; d reduced graphene oxide
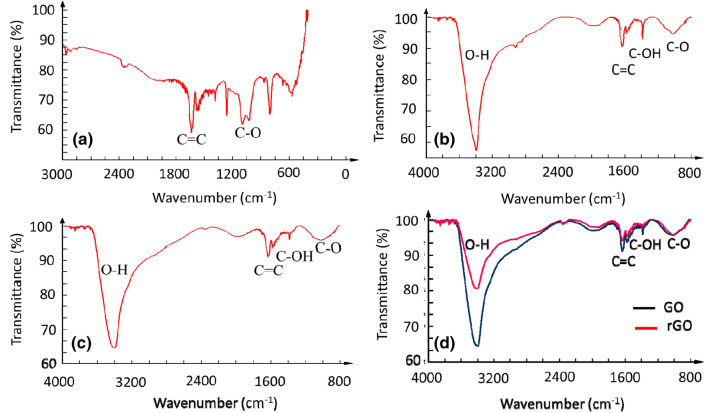
The FTIR spectrum showed graphite as a small, sharp peak at 1635 cm−1, due to the C=C skeletal bond vibrations that appear between the graphite layers (Fig. 8a). In the spectrum of graphite oxide, the most intense peak was observed at 3400 cm−1 representing O–H stretching due to the vibration of the hydroxyl groups caused by absorbed water molecules (Fig. 8b). GO showed a stronger O–H stretching peak than graphite oxide (Fig. 8c). In both the samples, other peaks at 1625 cm−1, 1580 cm−1, 1385 cm−1, and 1020 cm−1, which can be attributed to the C=C, C=O, C–OH, and C–O bonds, respectively, and skeletal vibrations of graphite domains were observed (Aunkor et al. 2016; Drewniak et al. 2016; Khan et al. 2015). Thus, the presence of various oxygen-containing functional groups indicates the success of oxidation reaction. Most peaks observed for GO were also present in rGO, with the bands showing a slight shift or decrease in intensity (Fig. 8d). This suggests that the phytochemicals in E. prostrata acted as reductants for deoxygenating GO by removing the oxide groups on the surface of graphene.
Fig. 8.
Fourier-transform infrared spectroscopy spectra. a Graphite; b graphite oxide; c graphene oxide; d GO reduced graphene oxide. The FTIR spectrum was considered from 4000 to 400 cm−1
Thermal stability analysis
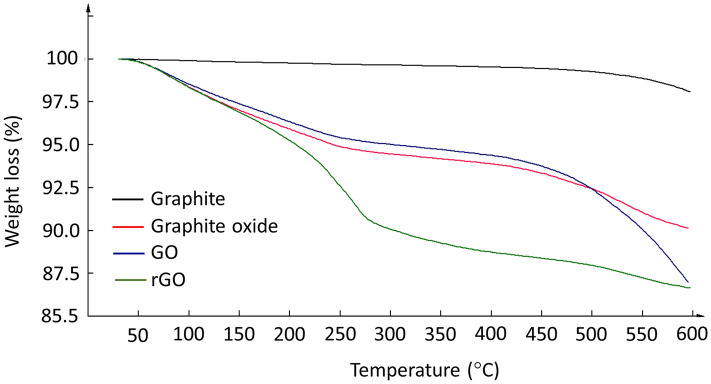
TGA analysis showed that graphite was the most thermally stable and decomposed at temperatures above 500 °C (Fig. 9). Graphite oxide, GO, and rGO were less thermally stable and started to lose mass upon heating at temperatures as low as 100 °C. The decomposition of oxide functional groups upon heating usually releases carbon monoxide and carbon dioxide together with steam (Bhawal et al. 2016). Therefore, GO is slightly more thermally stable than graphite oxide at temperatures between room temperature and 500 °C, as indicated by the higher loss in the mass of graphite oxide than that in the mass of GO. Beyond 500 °C, GO decomposed and lost mass more rapidly than graphite oxide. rGO was the least thermally stable among the materials tested, because after reduction, the newly restored C–C transition was not stable leading to rapid degradation, which was observed at temperatures ranging from room temperature to 278 °C (Ning et al. 2012).
Fig. 9.
Thermogravimetric analysis curves of graphite (black), graphite oxide (red), graphene oxide (GO) (blue) and reduced graphene oxide (rGO) (green). Measured until 600 °C
Conclusion
In this study, we synthesized graphene oxide from graphite using the simplified Hummer’s method. The synthesized materials were further characterized by morphological and structural analyses. Field emission scanning electron microscopy showed a uniform shape, smooth surface and the development of the sinuate structural characteristics of rGO after reduction. Transmission electron microscopy also showed rGO sheets developing lattice fringes with smooth edges and transparent sheets. In addition, Atomic force microscopy confirmed the surface roughness of the rGO. The presence of oxygen-containing functional groups was confirmed by energy dispersive X-ray analysis, which revealed that the oxygen content lowered in rGO after reduction of GO. This was also confirmed by the reduced oxygen peak intensity shown in X-ray photoelectron spectroscopy and Fourier-transform infrared spectroscopy analyses. In addition, thermal stability analysis suggested that rGO is less thermally stable than graphite, graphite oxide, and GO. Overall, this study confirmed the viability of the reduction of graphene oxide using aqueous phytoextract from E. prostrata.
Contributor Information
Subash C. B. Gopinath, Email: subash@unimap.edu.my
Periasamy Anbu, Email: anbu25@inha.ac.kr.
References
- Aboelfetoh EF, Gemeay AH, El-Sharkawy RG. Effective disposal of methylene blue using green immobilized silver nanoparticles on graphene oxide and reduced graphene oxide sheets through one-spot synthesis. Environ Monit Assess. 2020;192:355. doi: 10.1007/s10661-020-08278-2. [DOI] [PubMed] [Google Scholar]
- Aunkor MTH, Mahbubul IM, Saidur R, Metselaar HSC. The green reduction of graphene oxide. RSC Adv. 2016;6:27807–27828. doi: 10.1039/C6RA03189G. [DOI] [Google Scholar]
- Bhawal P, Ganguly S, Chaki TK, Das NC. The green reduction of graphene oxide filled ethylene methyl acrylate hybrid nanocomposites. RSC Adv. 2016;6:20781–20790. doi: 10.1039/C5RA24914G. [DOI] [Google Scholar]
- Bykkam S, Rao K, Shilpa Chakra CH, Thunugunta T. Synthesis and characterization of graphene oxide and its animicrobial activity against Klebseilla and Staphylococcus. Int J Adv Biotechnol Res. 2013;4:142–146. [Google Scholar]
- Chen J, Li Y, Huang L, Li C, Shi G. High-yield preparation of graphene oxide from small graphite flakes via an improved Hummers method with a simple purification process. Carbon. 2015;81:826–834. doi: 10.1016/j.carbon.2014.10.033. [DOI] [Google Scholar]
- Chung IM, Rajkumar G, Lee JH, Kim SH, Thiruvengadam M. Ethnopharmacological uses, phytochemistry, biological activities and biotechnological applications of Eclipta prostrata. Appl Microbiol Biotechnol. 2017;101:5247–5257. doi: 10.1007/s00253-017-8363-9. [DOI] [PubMed] [Google Scholar]
- Da-Costa-Rocha I, Bonnlaender B, Sievers H, Pischel I, Heinrich M. Hibiscus sabdariffa L. A phytochemicl and pharmacological review. Food Chem. 2014;165:424–443. doi: 10.1016/j.foodchem.2014.05.002. [DOI] [PubMed] [Google Scholar]
- Drewniak S, Muzyka R, Stolarczyk A, Pustelny T, Kotyczka-Moranska M, Setkiewicz M. Studies of reduced graphene oxide and graphite oxide in the aspect oof their possible applications in gas sensors. Sensors. 2016;16:103. doi: 10.3390/s16010103. [DOI] [PMC free article] [PubMed] [Google Scholar]
- Gao W. The chemistry of graphene oxide. Graphical oxide: reduction recipes spectroscopy and applications. Berlin: Springer International Publisher; 2015. pp. 61–95. [Google Scholar]
- Gopinath SCB, Anbu P, Theivasanthi T, Md Arshad MK, Lakshmipriya T, Voon CH, Pandian K, Velusamy P, Chinni SV. Characterization of reduced graphene oxide obtained from vacuum-assisted low temperature exfoliated graphite. Microsyst Technol. 2018;24:5007–5016. doi: 10.1007/s00542-018-3921-3. [DOI] [Google Scholar]
- Hou D, Liu Q, Cheng H, Li K, Wang D, Zhang H. Chrysanthemum extract assisted green reductin of graphene oxide. Mater Chem Phys. 2016;183:76–82. doi: 10.1016/j.matchemphys.2016.08.004. [DOI] [Google Scholar]
- Jana M, Saha S, Khanra P, Murmu NC, Srivastava SK, Kuila T, Lee JH. Bio-recutiond of graphene oxide using drained water frrom soaked mung beans (Phaseolus aureus L.) and its application as energy storage electrrode material. Mater Sci Eng B. 2014;186:33–40. doi: 10.1016/j.mseb.2014.03.004. [DOI] [Google Scholar]
- Johra FT, Lee JW, Jung WG. Facile and safe graphene preparation on solution based platform. J Ind Eng Chem. 2014;20:2883–2887. doi: 10.1016/j.jiec.2013.11.022. [DOI] [Google Scholar]
- Khan M, Al-Marri AH, Khan M, Shaik MR, Mohri N, Adil SF, Kuniyil M, Alkhathlan HZ, Al-Warthan A, Tremel W, Tahir MN, Siddiqui MRH. Green approach for the effective reduction of graphene oxide using Salvadora persica L. root (Miswak) extract. Nanoscale Res Lett. 2015;10:281. doi: 10.1186/s11671-015-0987-z. [DOI] [PMC free article] [PubMed] [Google Scholar]
- Kuila T, Bose S, Khanra P, Mishra AK, Kim NH, Lee JH. A green approach for the reduction of graphene oxide by wild carrrot root. Carbon. 2012;50:914–921. doi: 10.1016/j.carbon.2011.09.053. [DOI] [Google Scholar]
- Lee G, Kim BS. Biological reduction of graphene oxide using plant leaf extract. Biotechnol Prog. 2014;30:463–469. doi: 10.1002/btpr.1862. [DOI] [PubMed] [Google Scholar]
- Ning Y, Wang C, Ngai T, Yang Y, Tong Z. Hierarchical porus polymeric microspheres for efficient adsorption and catalyst scaffold. Electron Suppl Inf. 2012;2:1–5. [Google Scholar]
- Oh WC, Zhang FJ. Preparation and characterization of graphene oxide reduced from a mild chemical method. Asian J Chem. 2011;23:875–879. [Google Scholar]
- Paulchamy B, Arthi G, Lignesh BD. A simple approach to stepwise synthesis of graphene oxide nanomaterial. J Nanomed Nanotechnol. 2015;6:1000253. [Google Scholar]
- Pena-Bahamonde J, Nguyen HN, Fanourakis SK, Rodrigues DF. Recent advances in graphene-based biosensor technology with application in life sciences. J Nanobiotechnol. 2018;16:75. doi: 10.1186/s12951-018-0400-z. [DOI] [PMC free article] [PubMed] [Google Scholar]
- Poh HL, Sanek F, Ambrosi A, Zhao G, Sofer Z, Pumera M. Graphenes prepared by staudenmaier, hofmann and hummers methods with consequent thermal exfoliation exhib very different elecctrochemical properties. Nanoscale. 2012;4:3515–3522. doi: 10.1039/c2nr30490b. [DOI] [PubMed] [Google Scholar]
- Shalaby A, Nihtianova D, Markov P, Staneva AD, Iordanova RS, Dimitriev YB. Structural analysis of reduced graphene oxide by tansmission electron microscopy. Bulg Chem Commun. 2015;47:291–295. [Google Scholar]
- Sharma D, Kanchi S, Sabela MI, Bisetty K. Insight into the biosensing of graphene oxide: present and future prospects. Arab J Chem. 2016;9:238–261. doi: 10.1016/j.arabjc.2015.07.015. [DOI] [Google Scholar]
- Sharma N, Sharma V, Jain Y, Kumari M, Gupta R, Sharma SK, Sachdev K. Synthesis and characterization of graphene oxide (GO) and reduced graphene oxide (rGO) for gas sensing application. Macromol Symp. 2017;376:1700006. doi: 10.1002/masy.201700006. [DOI] [Google Scholar]
- Wu J, Wei Y, Dsing H, Wu Z, Yang X, Li Z, Huang W, Xie X, Tao K, Wang X. Green synthesis of 3D chemically functionaized graphene hydrogel for high performance NH3 and NO2 detection at room temperature. ACS Appl Mater Interface. 2020;12:20623–20632. doi: 10.1021/acsami.0c00578. [DOI] [PubMed] [Google Scholar]
- Yavari F, Koratkar N. Graphene based chemical sensors. J Phys Chem Lett. 2012;3:1746–1753. doi: 10.1021/jz300358t. [DOI] [PubMed] [Google Scholar]
- Yu J, Jin J, Cheng B, Jaroniec M. A nobal metal-free reudced graphene oxide-CdS nanorod composite for the enhanced visible-light photocatalytic reduction of CO2 to solar fuel. J Mater Chem A. 2014;2:3407–3416. doi: 10.1039/c3ta14493c. [DOI] [Google Scholar]
- Zhang Z, Kutana A, Yang Y, Krainyukova NV, Penev ES, Yakobson BI. Nanomechnics of carbon honeycomb cellular structures. Carbon. 2017;113:26–32. doi: 10.1016/j.carbon.2016.11.020. [DOI] [Google Scholar]


