

Abstract
The global rise in fatty liver is a major public health problem. Thus, it is critical to identify both global and population‐specific genetic variants associated with liver fat. We conducted a genome‐wide association study (GWAS) of percent liver fat and nonalcoholic fatty liver disease (NAFLD) assessed by magnetic resonance imaging in 1,709 participants from the population‐based Multiethnic Cohort Adiposity Phenotype Study. Our participants comprised older adults of five U.S. racial/ethnic groups: African Americans (n = 277), Japanese Americans (n = 424), Latinos (n = 348), Native Hawaiians (n = 274), and European Americans (n = 386). The established missense risk variant rs738409 located in patatin‐like phospholipase domain containing 3 (PNPLA3) at 22q13 was confirmed to be associated with percent liver fat (P = 3.52 × 10⁻¹⁵) but more strongly in women than men (P heterogeneity = 0.002). Its frequency correlated with the prevalence of NAFLD across the five ethnic/racial groups. Rs738409 was also associated with homeostasis model assessment of insulin resistance (HOMA‐IR) (beta = 0.028; P = 0.009) and circulating levels of insulin (beta = 0.022; P = 0.020) and alanine aminotransferase (beta = 0.016; P = 0.030). A novel association of percent liver fat with rs77249491 (located at 6q13 between limb region 1 domain containing 1 [LMBRD1] and collagen type XIX alpha 1 chain [COL19A1] (P = 1.42 × 10⁻⁸) was also observed. Rs7724941 was associated with HOMA‐IR (beta = 0.12; P = 0.0005), insulin (beta = 0.11; P = 0.0003), triglycerides (beta = 0.059; P = 0.01), high‐density lipoprotein (beta = −0.046; P = 0.04), and sex hormone binding globulin (beta = −0.084; P = 0.0012). This variant was present in Japanese Americans (minor allele frequency [MAF], 8%) and Native Hawaiians (MAF, 2%). Conclusion: We replicated the PNPLA3 rs738409 association in a multiethnic population and identified a novel liver fat risk variant in Japanese Americans and Native Hawaiians. GWASes of percent liver fat in East Asian and Oceanic populations are needed to replicate the rs77249491 association.
We conducted a genome‐wide association study of % liver fat and NAFLD assessed by magnetic resonance imaging (MRI) in 1,709 participants from the population‐based Multiethnic Cohort‐Adiposity Phenotype Study (MEC‐APS), comprised of older adults of five US racial/ethnic groups: African Americans (n = 277), Japanese Americans (n = 424), Latinos (n = 348), Native Hawaiians (n = 274), and European Americans (n = 386). The established missense risk variant, rs738409, located in PNPLA3 at 22q13, was confirmed to be associated with % liver fat (P = 3.52 × 10⁻¹⁵). Also, a novel association of % liver fat with rs77249491 (located at 6q13 between LMBRD1 and COL19A1; P = 1.42 × 10⁸) was observed.

Abbreviations
- ALT
alanine aminotransferase
- BMI
body mass index
- COL19A1
collagen type XIX alpha 1 chain
- CRP
C‐reactive protein
- DXA
dual energy X‐ray absorptiometry
- GCKR
glucokinase regulator
- GWAS
genome‐wide association study
- HDL
high‐density lipoprotein
- HOMA‐IR
homeostasis model assessment of insulin resistance
- LD
linkage disequilibrium
- LDL
low‐density lipoprotein
- LMBRD1
limb region 1 domain containing 1
- MAF
minor allele frequency
- MEC‐APS
Multiethnic Cohort‐Adiposity Phenotype Study
- MRI
magnetic resonance imaging
- NAFLD
nonalcoholic fatty liver disease
- OR
odds ratio
- PNPLA3
patatin‐like phospholipase domain containing 3
- QC
quality control
- ROI
region of interest
- SHBG
sex hormone binding globulin
- SNP
single‐nucleotide polymorphism
- TM6SF2
transmembrane 6 superfamily member 2
Fatty liver is a major public health problem. High levels of liver fat are associated with dysmetabolism, metabolic syndrome, and insulin resistance that can progress to adverse clinical conditions, such as chronic liver disease, cirrhosis, and hepatocellular carcinoma.( 1 , 2 ) Nonalcoholic fatty liver disease (NAFLD), defined as the accumulation of liver fat not caused by heavy alcohol use, is projected to exceed viral hepatitis as the primary cause of liver disease.( 1 ) The primary risk factors for high levels of liver fat include obesity, sedentary lifestyle, diet, and genetics. Body weight reduction, diet modifications, and increased physical activity are the only means to reduce liver fat and limit progression to adverse liver conditions. Thus, identifying populations at high risk for liver fat that may benefit from early detection and targeted lifestyle interventions would aid in the prevention of fatty liver conditions.
Fatty liver is a heritable trait with reported heritability estimates ranging from 22% to 38%.( 3 , 4 ) Prior genome‐wide association studies (GWASes) of liver fat have mostly included patients diagnosed with NAFLD based on elevated liver enzymes, computed tomography (CT), magnetic resonance imaging (MRI), magnetic resonance spectroscopy imaging of hepatic steatosis, or liver biopsy and have treated liver fat as a binary trait as opposed to a continuous measure from CT or MRI. While approximately 14 variants have been associated with nonalcoholic fatty liver,( 5 , 6 , 7 ) only three independent risk loci (P < 5 × 10⁻⁸) have been consistently replicated to date.( 5 ) The patatin‐like phospholipase domain containing 3 (PNPLA3) missense variant rs738409 (I148M) is the best established NAFLD risk variant.( 6 , 8 , 9 ) PNPLA3 encodes for triacylglycerol lipase that is expressed in adipocytes and hepatocytes, and the variant G allele in rs738409 (I148M) reduces PNPLA3 enzymatic lipase activity. The transmembrane 6 superfamily member 2 (TM6SF2) missense variant rs58542926 (E167K) was first identified in an exome‐wide association study of patients with NAFLD.( 8 ) TM6SF2 is a regulator of liver fat metabolism, and lower activity of this enzyme has been associated with reduced secretion of triglyceride‐rich lipoproteins.( 10 ) The T allele of rs58542926, which results in a change in amino acid from glutamic acid to lysine, has been associated with higher liver triglyceride content and lower circulating triglyceride levels.( 8 ) The glucokinase regulator (GCKR) gene variant rs780094 has been associated with NAFLD and metabolic traits.( 7 , 11 ) GCKR encodes for a regulatory protein that inhibits glucokinase in both the liver and pancreatic islet cells.
The majority of prior GWASes of liver fat have focused on patients with NAFLD based on single ancestral populations of Europeans or East Asians.( 7 , 12 , 13 , 14 ) The most racially/ethnically diverse study was conducted in the Dallas Heart Study and included 1,324 African Americans, 882 European Americans, 467 Latinos, and 63 others.( 6 , 8 ) A GWAS of liver fat among a multiethnic sample of the general population with wide ranges in liver fat and genetic variation is a powerful and efficient approach to discover novel risk variants.( 15 ) In a report from the Multiethnic Cohort Adiposity Phenotype Study (MEC‐APS), we observed striking differences in the distribution of percent liver fat across five racial/ethnic groups (P heterogeneity < 1.6 × 10⁻¹²).( 16 ) For instance, we found that the total fat‐adjusted mean percent liver fat for Japanese American men and women (5.8% and 7.1%, respectively) was 2‐fold greater than for African American men and women (3.6% and 3.2%, respectively), the group with the lowest amount of liver fat.( 16 ) After correction for sampling fractions, Latinos had the highest prevalence of NAFLD (52.0%) and African Americans had the lowest prevalence (20.2%).( 16 )
In this report, we describe a GWAS of liver fat and NAFLD in the MEC‐APS, a comprehensive population‐based study of adiposity phenotypes and obesity‐associated biomarkers (measured in serum or plasma) conducted among African Americans, Japanese Americans, Latinos, Native Hawaiians, and European Americans. Liver fat and NAFLD (liver fat >5.5%) were quantified by abdominal MRI, a noninvasive reference assessment method.( 17 ) With a focus on investigating the genetic determinants of liver fat as a continuous trait, we improved our ability (study power) to detect modest effects and to quantify the effects by allelic dose across and within specific populations. Furthermore, with our comprehensive measures of body size, such as clinically measured height and dual energy X‐ray absorptiometry (DXA)‐measured total fat mass, we were able to account for confounding and/or effect modification due to variation in adiposity across populations. Lastly, for the most significant variants, we examined their relationships with circulating concentrations of obesity‐related clinical biomarkers to evaluate their possible biological effects.
Participants and Methods
Study Population
The MEC study was established in 1993‐1996 to examine diet, lifestyle factors, and genetic susceptibility in relation to cancer.( 18 ) It is an ongoing prospective study of more than 215,000 adult men and women primarily of African American, Japanese American, Latino, Native Hawaiian, and European American ancestry. In 2013‐2016, the MEC‐APS was conducted to identify predictors of body fat distribution and to examine their associations with obesity‐related cancers. Study recruitment and methods have been described in detail.( 16 ) In brief, 1,861 men and postmenopausal women who were healthy, not currently smoking, no history of chronic hepatitis, aged 60‐77 years, and a body mass index (BMI) between 17.1‐46.2 kg/m2 were enrolled in the study with stratified sampling by sex, race/ethnicity, and six BMI categories. All MEC‐APS participants provided written informed consent that was approved by the respective institutional review boards (IRBs) at the University of Hawaii (UH) or University of Southern California (USC). The IRBs at UH (CHS‐#17200), USC (#HS‐12‐00623), and University of California, San Francisco (#17‐23399) approved the study protocol, which conforms to the 1975 Helsinki Declaration. Study participants underwent an abdominal MRI and body composition assessment by whole‐body DXA and completed an in‐person interview, blood collection, and self‐administered questionnaire. Ninety‐one participants were excluded after quality control (QC) filtering of the genotype data (see below), and 61 were excluded for invalid MRI scans (due to motion artifacts or presence of intravisceral masses). Thus, the final study population for analysis was comprised of 1,709 participants (Supporting Fig. S1).( 16 )
Percentage Liver Fat, NAFLD, Total Fat Mass
The MRI scanners Siemens TIM Trio at UH and General Electric HDx at USC, both with a 3‐tesla magnetic field strength, were used to quantify liver fat. The MRI protocol assessed four abdominal intervertebral segments of the intra‐abdominal cavity (L1‐L2, L2‐L3, L3‐L4, L4‐L5) and did not include the intrathoracic or intrapelvic cavity. Percent liver fat was estimated from a series of axial triple gradient‐echo Dixon‐type scans (10‐mm slices, no gap; echo time, 2.4, 3.7, and 5.0 milliseconds; repetition time, 160 milliseconds; 25‐degree flip angle) by analyzing in‐phase, out‐of‐phase, and in‐phase signals in a circular region of interest (ROI; 20 cm2) in the lateral right lobe of the liver that was manually selected to avoid intrahepatic vessels and bile ducts.( 19 ) Additional details regarding the protocol can be found in Lim et al.( 16 ) We selected two ROIs for each participant and repeat scanned each ROI, the average of which was used for the estimation of liver fat. NAFLD was defined as percent liver fat of 5.5% or greater excluding subjects with excessive alcohol consumption defined as >30 g/day of alcohol in men and >20 g/day of alcohol in women in the past year.( 20 ) Body fat distribution was determined by a whole‐body DXA scan (Hologic Discovery A densitometer; Bedford, MA). Total fat mass (kg) was estimated for the whole body, as described.( 21 )
Obesity‐Related, Hormonal, and Liver Enzyme Biomarkers
Fasting blood samples were collected at the time of body composition measurement, processed into components, and stored at −80°C. A Cobas MiraPlus chemistry autoanalyzer (Roche, Indianapolis, IN) was used to measure concentrations of serum total and high‐density lipoprotein (HDL) cholesterol (kits H7510 and H7545; Pointe Scientific), glucose (kit GL1611; Randox Laboratories), high‐sensitivity C‐reactive protein (CRP; kit C7568; Core Lab Supplies), triglycerides (kit T7532, Pointe Scientific), and the liver enzyme alanine aminotransferase (ALT; kit AL1205; Randox Laboratories). Enzyme‐linked immunosorbent assays were used to measure insulin (kit EZH1‐14K; EMD Millipore) and sex hormone binding globulin (SHBG; kit GWB‐D8B5DE; GenWay). Homeostasis model assessment of insulin resistance (HOMA‐IR) and HOMA‐beta were derived from glucose and insulin data,( 22 , 23 ) low‐density lipoprotein (LDL) cholesterol was derived from the Friedewald equation using triglyceride, and total and HDL cholesterol concentrations were derived for a valid range of triglyceride concentrations.( 24 ).
Genotyping
DNA extraction from blood samples for the MEC‐APS participants was performed using the Qiagen QIAmp DNA kit (Qiagen Inc., Valencia, CA). DNA samples were genotyped by the Illumina MEGAEX array. Single‐nucleotide polymorphisms (SNPs) with a call rate <0.95, a replicate concordance <1.00% based on 39 QC replicate samples, and those with poor clustering after visual inspection were removed. Problematic samples with a call rate <0.95 or gender/sex mismatches were removed. From an initial 2,046,060 genotyped SNPs, there were 1,847,764 genotyped SNPs available.
Imputation
Additional QC steps were implemented before SNP imputation. These included removing all monomorphic SNPs in the overall data set, SNPs with call rate <0.98, SNPs with estimated minor allele frequencies (MAF) that deviated by ≥20% in comparison to the corresponding ancestral group in the 1000 Genomes Project (phase 3), and insertion/deletion polymorphisms not identified within the Haplotype Reference Consortium (HRC). These additional QC steps resulted in 1,417,570 SNPs with typed genotypes that were available for imputation. Imputation (including both haplotype phasing and SNP imputation) was performed using the HRC( 25 ) imputation server (version r1.1 2016) with a cosmopolitan reference panel of all 1000 Genome Project samples in addition to the panel described by McCarthy et al.( 25 ) Postimputation imputed SNPs with MAF <1% or an imputation quality score <0.4 were filtered out for a total of 9,789,995 SNPs available for analysis.
Statistical Analysis
QQ plots and lambdaGC were used to assess genomic inflation, comparing the empirically observed distribution of the test statistic to the expected median for percent liver fat and NAFLD with lambdas of 0.939 and 1.007, respectively. For percent liver fat, SNP associations (additive genetic model) were estimated using a linear regression of log‐transformed percent liver fat, adjusting for age, sex, and eight genetic ancestry proportions (African, Southern and Northern European, Amerindian, Japanese, Okinawan, Native Hawaiian, and Native Hawaiian/Chinese/Filipino) to account for population stratification. Ancestry proportion estimates were computed using Admixture software( 26 ) based on multilocus genotype data of a random sample of 20,000 SNPs and a cross‐validation parameter (K) of 8 based on a cross‐validation procedure. For NAFLD, SNP associations (additive genetic model) were estimated using a logistic regression model, adjusting for the same above‐mentioned variables. A P‐value threshold of 5 × 10⁻⁸ was used to determine genome‐wide statistical significance. For top associations, statistical models were also adjusted for total fat mass. To evaluate independent SNP effects, conditional analysis was conducted that included less correlated lead SNPs (r 2 < 0.9; P < 5 × 10⁻⁸). Stratified analyses for top SNP associations were conducted by self‐reported race/ethnicity, sex, and total fat mass. Heterogeneity in effects by self‐reported race/ethnicity, sex, and total fat mass were examined by including a cross‐product term in our statistical models of the top SNPs with race/ethnicity, sex, or total fat mass, respectively. Sensitivity analyses were conducted for the top SNPs with additional adjustment for visceral fat.
We examined the association of the top SNPs with 11 obesity‐related, hormonal, and liver enzyme biomarkers (HDL, LDL, total cholesterol, glucose, insulin, HOMA‐beta, HOMA‐IR, CRP, SHBG, triglycerides, and ALT). Each log‐transformed biomarker was regressed on the top SNPs adjusted for age, sex, genetic ancestry proportions, and total fat mass.
Results
Study characteristics of the 1,709 MEC‐APS participants (n = 277 African Americans, 424 Japanese Americans, 348 Latinos, 274 Native Hawaiians, and 386 European Americans) are presented in Table 1. The mean overall age at clinic visit was 69.2 years. Without adjusting for the sampling fractions, Japanese Americans (mean percent liver fat, 6.8 ± 5.3%; prevalence of NAFLD, 44.5%) and Latinos (mean, 6.4 ± 4.3%; NAFLD prevalence, 43.5%) had the highest level of percent liver fat and prevalence of NAFLD. This was followed by Native Hawaiians (mean, 5.8 ± 4.7%; NAFLD prevalence, 35.0%) and European Americans (mean, 4.9 ± 4.6%; NAFLD prevalence, 21.5%). African Americans had the lowest percent liver fat and NAFLD prevalence (mean, 4.0 ± 2.7%; NAFLD prevalence, 14.5%). Mean percent liver fat and NAFLD prevalence did not differ by sex; however, mean total fat mass was greater in women than men (27.6 vs. 22.7 kg) (Supporting Table S1). The participants’ genetic ancestry estimates were consistent with self‐reported race/ethnicity (Supporting Table S2).
Table 1.
MEC‐APS Study Characteristics* by Race/Ethnicity (N = 1,709)
| African Americans (n = 277) | Japanese Americans (n = 424) | Latinos (n = 348) | Native Hawaiians (n = 274) | European Americans (n = 386) | |
|---|---|---|---|---|---|
| Age, years; mean (SD) | 69.9 (2.7) | 68.9 (2.5) | 69.7 (2.7) | 68.6 (3.4) | 69.0 (2.3) |
| Education, n (%) | |||||
| High school | 38 (13.8) | 35 (8.4) | 147 (42.6) | 58 (21.2) | 28 (7.3) |
| Some college | 130 (47.1) | 116 (27.7) | 120 (34.8) | 102 (37.4) | 75 (19.5) |
| College | 61 (22.1) | 161 (38.4) | 42 (12.2) | 70 (25.6) | 107 (27.8) |
| Graduate and professional school | 47 (17.0) | 107 (25.5) | 36 (10.43) | 43 (15.8) | 175 (45.5) |
| Smoking status, n (%) | |||||
| Never | 169 (61.0) | 249 (58.7) | 235 (67.53) | 167 (60.9) | 242 (62.7) |
| Former | 108 (39.0) | 175 (41.3) | 113 (32.47) | 107 (39.1) | 144 (37.3) |
| Alcohol, g/day; mean (SD) | 6.2 (14.5) | 4.7 (9.8) | 7.3 (13.0) | 7.0 (14.2) | 10.9 (17.5) |
| BMI, kg/m2; mean (SD) | 29.2 (4.9) | 26.2 (4.03) | 29.01 (4.79) | 28.6 (4.8) | 26.9 (4.6) |
| % liver fat, mean (SD) | 4.0 (2.7) | 6.8 (5.3) | 6.4 (4.3) | 5.8 (4.7) | 4.9 (4.6) |
| NAFLD, yes; n (%) † | 37 (14.5) | 177 (44.5) | 140 (43.5) | 85 (35.0) | 67 (21.5) |
| Total fat mass, kg; mean (SD) ‡ | 31.4 (9.3) | 24.5 (7.6) | 20.4 (5.9) | 28.9 (8.0) | 23.3 (7.7) |
All characteristics were assessed at time of clinic visit except education information, which was obtained from the MEC study baseline questionnaire (1993‐1996).
NAFLD was defined as liver fat >5.5%, and 180 participants were excluded due to excessive alcohol consumption (<30 g/day in men or < 20 g/day in women). Total NAFLD sample size was n = 1529.
Total sample size of MEC‐APS Study subjects with GWAS, % liver fat and total fat mass information was n = 1690.
In the association analysis with percent liver fat, we identified 10 SNPs that reached a genome‐wide significance threshold of P < 5 × 10⁻⁸, with seven SNPs located in chromosome 22q13 and three SNPs located in chromosome 6q13 (Fig. 1; Table 2). All variants associated with percent liver fat with P < 10−6 without adjustment for total fat mass are presented in Supporting Table S3. None of the variants deviated from Hardy‐Weinberg equilibrium (threshold for deviation P < 1.0 × 10⁻⁶). For 22q13, the seven SNPs associated with percentage liver fat are located in the known PNPLA3 risk locus (Table 2). Five of the seven variants were originally genotyped and two were imputed. Imputed genotypes were used for all analyses; here, all seven had an imputation score of >0.97 (Table 2). Six of the 22q13 SNPs were highly correlated (r 2 > 0.90), and rs16991236 was modestly correlated with these SNPs (r2 ~ 0.6). The most significant association (P = 3.52 × 10⁻¹⁵) was observed with the established NAFLD missense variant rs738409 (I148M) and was the primary signal in a conditional analysis that included the only modestly correlated SNP (rs16991236). The G allele of rs738409 was associated with a 1.20‐fold increase (beta = 0.08) in (geometric) mean percent liver fat with evidence of heterogeneity in effects by sex (P heterogeneity = 0.043). Interestingly, the effect estimate for percent liver fat was greater and more significant in women than in men (P heterogeneity = 0.002). The G allele was associated with approximately a 1.23‐fold increase (beta = 0.09) in (geometric) mean percent liver fat in women (P = 3.35 × 10⁻¹⁰) and a 1.15‐fold increase (beta = 0.06) in men (P = 1.16 × 10⁻⁶) (Table 2). As women on average have a higher total fat mass than men (Supporting Table S1), we tested the interaction of rs738409 with total fat mass category(< and ≥ median of 24.45 kg) on percent liver fat in each sex and found the suggestion of an interaction between the SNP and total fat mass in women (P interaction = 0.04 and 0.25 for women and men, respectively, Supporting Table S4). With additional adjustment for visceral fat, the association between rs738409 and percent liver fat was highly significant (P = 8.88 × 10⁻¹⁶; data not shown).
Fig. 1.
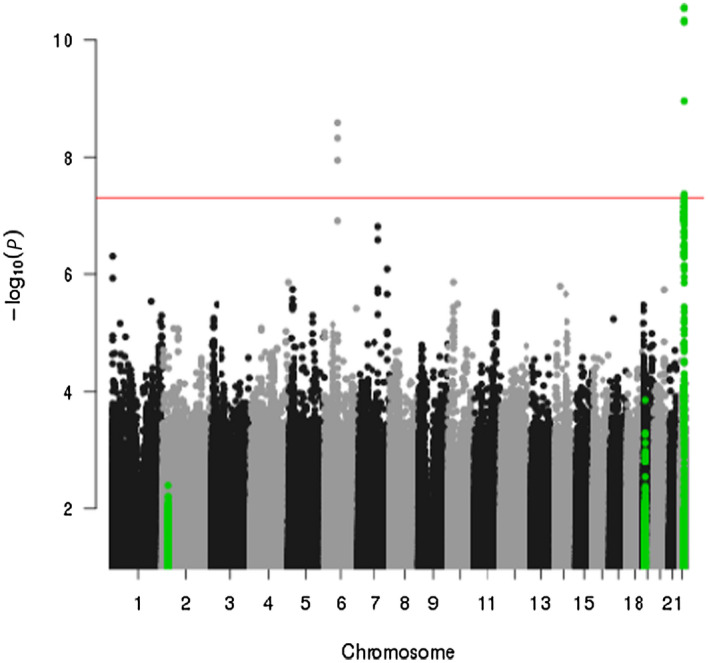
Manhattan plot of the association between genetic variants and percent liver fat, adjusted for age, sex, and genetic ancestry proportions. The red line indicates the statistical significance threshold P = 5 × 10⁻⁸. Green dots represent known liver fat risk loci on chromosomes 2, 19, and 22.
Table 2.
Ten Genetic Variants Associated With Percent Liver Fat in MEC‐APS (P < 5 × 10⁻⁸) Overall and by Sex*
| SNP | Chrom | Position | Imputed Information score | Ref. Allele | Overall (n = 1,690) | Males (n = 826) | Females (n = 864) | ||||||||
|---|---|---|---|---|---|---|---|---|---|---|---|---|---|---|---|
| Minor Allele | MAF | Beta † | SE | P Value | Beta † | SE | P Value | Beta † | SE | P Value | |||||
| rs738409 ‡ | 22q13 | 44324727 | 0.98 | C | G | 0.32 | 0.08 | 0.010 | 3.52 × 10⁻¹⁵ | 0.06 | 0.013 | 1.16 × 10⁻⁶ | 0.09 | 0.014 | 3.35 × 10⁻¹⁰ |
| rs738408 | 22q13 | 44324730 | 0.98 | C | T | 0.32 | 0.08 | 0.010 | 3.66 × 10⁻¹⁵ | 0.06 | 0.013 | 1.20 × 10⁻⁶ | 0.09 | 0.014 | 3.35 × 10⁻¹⁰ |
| rs3747207 | 22q13 | 44324855 | 0.97 | G | A | 0.32 | 0.08 | 0.010 | 7.65 × 10⁻¹⁵ | 0.06 | 0.013 | 2.24 × 10⁻⁶ | 0.09 | 0.014 | 4.00 × 10⁻¹⁰ |
| rs2294915 | 22q13 | 44340904 | >0.99 | C | T | 0.33 | 0.07 | 0.009 | 6.06 × 10⁻¹⁵ | 0.07 | 0.013 | 1.32 × 10⁻⁷ | 0.08 | 0.014 | 9.44 × 10⁻⁹ |
| rs16991236 | 22q13 | 44358997 | >0.99 | A | G | 0.19 | 0.08 | 0.012 | 1.30 × 10⁻¹¹ | 0.08 | 0.016 | 1.21 × 10⁻⁶ | 0.08 | 0.018 | 3.50 × 10⁻⁶ |
| rs1883349 | 22q13 | 44331943 | 0.99 | G | A | 0.29 | 0.07 | 0.010 | 6.88 × 10⁻¹¹ | 0.05 | 0.013 | 5.81 × 10⁻⁵ | 0.07 | 0.015 | 3.32 × 10⁻⁷ |
| rs1977080 | 22q13 | 44330031 | 0.99 | C | T | 0.29 | 0.07 | 0.010 | 4.63 × 10⁻¹¹ | 0.06 | 0.013 | 3.70 × 10⁻⁵ | 0.08 | 0.015 | 3.12 × 10⁻⁷ |
| rs77249491 ‡ | 6q13 | 70539253 | 0.98 | G | A | 0.02 | 0.18 | 0.031 | 1.42 × 10⁻⁸ | 0.18 | 0.043 | 2.26 × 10⁻⁵ | 0.16 | 0.043 | 1.45 × 10⁻⁴ |
| rs146418612 | 6q13 | 70542348 | 0.98 | C | T | 0.02 | 0.17 | 0.031 | 2.14 × 10⁻⁸ | 0.18 | 0.043 | 2.50 × 10⁻⁵ | 0.16 | 0.044 | 2.02 × 10⁻⁴ |
| rs78276535 | 6q13 | 70538918 | 0.98 | G | A | 0.02 | 0.17 | 0.031 | 6.27 × 10⁻⁸ | 0.18 | 0.043 | 2.21 × 10⁻⁵ | 0.15 | 0.043 | 4.86 × 10⁻⁴ |
Additive genetic model, adjusting for age, sex, and genetic ancestry proportions and total fat mass were used to estimate the associations between genetic variants and percent liver fat.
Log based 10 unit change per allele increase.
rs738409 P heterogeneity by sex = 0.043; rs77249491 P heterogeneity by sex = 0.470.
Abbreviations: chrom, chromosome; ref., reference.
The MAF for the rs738409 PNPLA3 variant differed across racial/ethnic groups; it was most frequent in Latinos (46%) and Japanese Americans (43%) then followed by Native Hawaiians (26%), European Americans (24%), and African Americans (14%). In race/ethnicity‐specific analyses, the largest effect estimate and most significant association for rs738409 and percent liver fat was in European Americans (beta = 0.10; P = 1.40 × 10⁻⁷) followed by Japanese Americans (beta = 0.09; P = 7.30 × 10⁻⁷) (Table 3; Supporting Fig. S2A,B). Modest associations were found in African Americans (beta = 0.07; P = 0.017), Latinos (beta = 0.06; P = 0.002), and Native Hawaiians (beta = 0.05; P = 0.101) (Table 3). Heterogeneity by race/ethnicity was not detected (P heterogeneity = 0.46; Table 3; Supporting Table S5).
Table 3.
Ten Genetic Variants Associated With Percent Liver Fat in MEC‐APS by Race/Ethnicity*
| SNP | Chr | African Americans (n = 269) | Japanese Americans (n = 424) | Latinos (n = 345) | Native Hawaiians (n = 270) | European Americans (n = 382) | |||||||||||||||
|---|---|---|---|---|---|---|---|---|---|---|---|---|---|---|---|---|---|---|---|---|---|
| MAF | Beta † | SE | P Value | MAF | Beta † | SE | P Value | MAF | Beta † | SE | P Value | MAF | Beta † | SE | P Value | MAF | Beta † | SE | P Value | ||
| rs738409 ‡ | 22q13 | 0.14 | 0.07 | 0.03 | 0.017 | 0.43 | 0.09 | 0.02 | 7.30 × 10⁻⁷ | 0.46 | 0.06 | 0.02 | 0.002 | 0.26 | 0.05 | 0.03 | 0.101 | 0.24 | 0.10 | 0.02 | 1.40 × 10⁻⁷ |
| rs738408 | 22q13 | 0.14 | 0.07 | 0.03 | 0.017 | 0.43 | 0.09 | 0.02 | 7.94 × 10⁻⁷ | 0.46 | 0.06 | 0.02 | 0.002 | 0.26 | 0.05 | 0.03 | 0.101 | 0.24 | 0.10 | 0.02 | 1.40 × 10⁻⁷ |
| rs3747207 | 22q13 | 0.14 | 0.08 | 0.03 | 0.007 | 0.43 | 0.09 | 0.02 | 8.58 × 10⁻⁷ | 0.46 | 0.05 | 0.02 | 0.004 | 0.26 | 0.05 | 0.03 | 0.097 | 0.23 | 0.10 | 0.02 | 4.86 × 10⁻⁷ |
| rs2294915 | 22q13 | 0.20 | 0.07 | 0.02 | 0.005 | 0.42 | 0.09 | 0.02 | 8.41 × 10⁻⁷ | 0.46 | 0.06 | 0.02 | 0.001 | 0.26 | 0.05 | 0.03 | 0.090 | 0.26 | 0.09 | 0.02 | 1.13 × 10⁻⁶ |
| rs16991236 | 22q13 | 0.03 | 0.13 | 0.05 | 0.024 | 0.35 | 0.09 | 0.02 | 2.33 × 10⁻⁵ | 0.20 | 0.06 | 0.02 | 0.009 | 0.19 | 0.1 | 0.03 | 0.107 | 0.1 | 0.11 | 0.03 | 2.84 × 10⁻⁴ |
| rs1883349 | 22q13 | 0.15 | 0.08 | 0.03 | 0.004 | 0.42 | 0.09 | 0.02 | 1.48 × 10⁻⁶ | 0.41 | 0.04 | 0.02 | 0.026 | 0.24 | 0.06 | 0.03 | 0.03 | 0.20 | 0.07 | 0.02 | 6.42 × 10⁻⁴ |
| rs1977080 | 22q13 | 0.15 | 0.08 | 0.03 | 0.003 | 0.42 | 0.09 | 0.02 | 1.02 × 10⁻⁶ | 0.41 | 0.05 | 0.02 | 0.016 | 0.24 | 0.06 | 0.03 | 0.04 | 0.19 | 0.07 | 0.02 | 6.34 × 10⁻⁴ |
| rs77249491 ‡ | 6q13 | – | – | – | – | 0.08 | 0.16 | 0.04 | 5.21 × 10⁻⁶ | – | – | – | – | 0.02 | 0.15 | 0.09 | – | – | – | – | – |
| rs146418612 | 6q13 | – | – | – | – | 0.08 | 0.16 | 0.04 | 7.16 × 10⁻⁶ | – | – | – | – | 0.02 | 0.17 | 0.09 | – | – | – | – | – |
| rs78276535 | 6q13 | – | – | – | – | 0.08 | 0.16 | 0.04 | 4.89 × 10⁻⁶ | – | – | – | – | 0.02 | 0.15 | 0.09 | 0.08 | – | – | – | – |
Additive genetic model, adjusting for age, sex, and genetic ancestry proportions and total fat mass were used to estimate the associations between genetic variants and percent liver fat.
Log based 10 unit change per allele increase.
rs738409 P heterogeneity by race/ethnicity = 0.46; rs77249491 P heterogeneity by race/ethnicity = 0.95.
Abbreviation: Chr, chromosome.
For 6q13, three genome‐wide associations were observed for rs77249491, rs146418612, and rs78276535 with percent liver fat (Fig. 1; Supporting Table S3) that remained statistically significant with adjustment for total fat mass (Table 2). These three variants were imputed with an imputation score of >0.98 (Table 2) and are in high linkage disequilibrium (LD) (r 2 > 0.95). Thus, we could not distinguish the primary signal and only considered the strongest association (rs77249491; P = 1.42 × 10⁻⁸) in further analyses. The A allele of rs77249491 was associated with a 1.51‐fold increase (beta = 0.18) in (geometric) mean percent liver fat (Table 2). This association was primarily driven by Japanese Americans (beta = 0.16; P = 5.21 × 10⁻⁶; Table 3; Supporting Fig. S3). The minor A allele of rs77249491 was more common in Japanese Americans (MAF, 8%), rare in Native Hawaiians (MAF, 2%), practically absent in African Americans (MAF, 0.1%), and monomorphic in Latinos and European Americans. With additional adjustment for visceral fat, the association between rs77249491 and percent liver fat remained (P = 2.60 × 10⁻⁶).
SNP association results for NAFLD (P < 10−6) are presented in Supporting Fig. S4 and Supporting Table S6. For rs738409 in PNPLA3, a 1.5‐fold increased risk of NAFLD was observed (P = 1.84 × 10⁻⁶; data not shown) with similar patterns of positive associations observed across race/ethnicity (Supporting Table S7). For rs77249491 in 6q13, a 4.0‐fold statistically significant increased risk of NAFLD (P = 7.39 × 10⁻⁷; Supporting Table S6) was observed that was driven by the Japanese American data (odds ratio [OR], 3.91; P = 1.00 × 10⁻⁵; Supporting Table S7). With additional adjustment for total fat mass, the NAFLD association for rs738409 was stronger (OR, 1.66; P = 4.02 × 10⁻⁸) and slightly weaker for rs77249491 (OR, 3.54; P = 8.59 × 10⁻⁶).
Weak overall associations with consistent direction in effects were seen with percent liver fat and NAFLD for the two other known GWAS‐identified NAFLD risk variants, rs58542926 in TM6SF2 ( 8 ) (P = 0.03 and 0.65, respectively) and rs780094 in GCKR (P = 0.05 and 0.08, respectively) (Supporting Tables S8 and S9). For other candidate NAFLD risk variants reported in studies of largely European ancestry populations,( 27 , 28 ) we found that rs626283 in membrane bound O‐acyltransferase domain containing 7 (MBOAT7) and rs6834314 in hydroxysteroid 17‐beta dehydrogenase 13 (HSD17B13) were not statistically significantly associated with NAFLD (OR, 1.01; P = 0.92; and OR, 1.02; P = 0.58, respectively) and percent liver fat (beta = 0.014; P = 0.15; and beta = −0.004; P = 0.68, respectively). In European Americans, a weak association for rs626283 in MBOAT7 with percent liver fat was found (beta = 0.034; P = 0.05), and no association was seen with NAFLD (Supporting Tables S8 and S9).
Lastly, we evaluated the associations of rs738409 and rs77249491 with obesity‐related circulating biomarkers (Table 4). For rs738409 in PNPLA3, the variant allele was positively associated with HOMA‐IR (beta = 0.028; P = 0.009), insulin (beta = 0.022; P = 0.020), and ALT (beta = 0.016; P = 0.030). For rs77249491 in 6q13, the A allele was positively associated with HOMA‐beta (beta = 0.089; P = 0.023), HOMA‐IR (beta = 0.12; P = 0.0005), insulin (beta = 0.11; P = 0.0003), and triglyceride (beta = 0.059; P = 0.013) levels and inversely associated with HDL (beta = −0.046; P = 0.039) and SHBG (beta = −0.084; P = 0.0012). When restricting to only Japanese Americans and Native Hawaiians combined, the association for rs77249491 remained statistically significant for the same biomarkers except for HDL (P = 0.078) (Supporting Table S10). These associations were no longer statistically significant after adjustment for percent liver fat, suggesting that liver fat is the pathway by which these variants influence these metabolic phenotypes.
Table 4.
Association Between rs738409 and rs77249491 With Obesity‐Related, Hormonal, and Liver Enzyme Biomarkers in MEC‐APS*
| n | Beta | P Value † | |
|---|---|---|---|
| rs738409 | |||
| HDL (mg/dL) | 1,741 | −0.003 | 0.68 |
| LDL (mg/dL) | 1,736 | −0.009 | 0.16 |
| Total cholesterol (mg/dL) | 1,742 | −0.007 | 0.10 |
| Glucose (mg/dL) | 1,740 | 0.004 | 0.24 |
| HOMA‐beta (%) | 1,718 | 0.016 | 0.19 |
| HOMA‐IR | 1,727 | 0.028 | 0.009 |
| CRP (mg/L) | 1,518 | 0.004 | 0.82 |
| Insulin (μU/mL) | 1,729 | 0.022 | 0.020 |
| SHBG (nmol/L) | 1,735 | 0.010 | 0.20 |
| Triglycerides (mg/dL) | 1,742 | −0.009 | 0.22 |
| ALT (U/L) | 1,738 | 0.016 | 0.030 |
| rs77249491 | |||
| HDL (mg/dL) | 1,741 | −0.046 | 0.039 |
| LDL (mg/dL) | 1,736 | −0.032 | 0.12 |
| Total cholesterol (mg/dL) | 1,742 | −0.017 | 0.23 |
| Glucose (mg/dL) | 1,740 | 0.0098 | 0.41 |
| HOMA‐beta (%) | 1,718 | 0.089 | 0.023 |
| HOMA‐IR | 1,727 | 0.12 | 0.0005 |
| CRP (mg/L) | 1,518 | 0.082 | 0.16 |
| Insulin (μU/mL) | 1,729 | 0.11 | 0.0003 |
| SHBG (nmol/L) | 1,735 | −0.084 | 0.0012 |
| Triglycerides (mg/dL) | 1,742 | 0.059 | 0.0133 |
| ALT (U/L) | 1,738 | 0.032 | 0.18 |
Additive genetic model, adjusting for age, sex, and genetic ancestry proportions and total fat mass were used to estimate the associations between genetic variants and obesity‐related, hormonal, and liver enzyme biomarkers.
P < 0.05 is considered significant.
Discussion
In this GWAS conducted in a multiethnic population‐based cohort, we found two risk loci associated with MRI‐assessed percent liver fat that were independent of total adiposity. The strongest association was with rs738409 in PNPLA3, a known missense NAFLD risk variant( 6 , 8 , 9 ); this variant demonstrated consistent effects in the five racial/ethnic groups studied. In addition, the rs738409 and percent liver fat association was found to be significantly stronger in women than men. The second risk variant was a novel locus, rs77249491 in 6q13. This association was driven primarily by Japanese Americans as the minor risk allele is common in East Asians yet rare or absent in the other four racial/ethnic groups. Our data are also consistent with reported associations for two other NAFLD risk variants in GCKR and TM6SF2; however, these associations did not reach statistical significance. In addition, rs738409 and rs77249491 were associated with several circulating obesity‐related biomarkers, supporting the biological relevance of these variants.
Our study observed consistent patterns of associations for rs738409 in PNPLA3 with percent liver fat and NAFLD across race/ethnicity and found that the population‐specific frequency of the minor allele correlated with the population‐specific prevalence of NAFLD in the MEC. PNPLA3 encodes for triacylglycerol lipase that is expressed in adipocytes and hepatocytes. The G allele (global frequency, 32%) in rs738409 leads to a change in the amino acid isoleucine to methionine, which results in a reduction of liver lipase activity.( 29 ) Lower liver lipase activity may result in reduced breakdown of liver fatty acids and the accumulation of fat in the liver.( 29 , 30 ) In addition, the PNPLA3 s738409 variant has been found in a mouse model to result in the accumulation of triglycerides from hepatic lipid droplets.( 31 ) The potential functional relevance of rs738409 was reported to be deleterious using wANNOVAR (http://wannovar.wglab.org/).( 32 )
Additionally, this study is the first to suggest that PNPLA3 rs738409 may have a greater effect in women than men. In support of our finding, a meta‐analysis study of rs738409 and NAFLD found that studies with a greater proportion of men were correlated with a lower mean difference across rs738409 genotypes.( 9 )
To our knowledge, there have been no other GWASes of percent liver fat among East Asians. Thus, our findings remain to be replicated. Three prior GWASes of NAFLD in East Asian populations( 12 , 13 , 33 ) did not report associations with variants in 6q13, despite this variant being present in those of East Asian ancestry (MAF, 7% in East Asians; 1000 Genomes Project). This may be due to the use of NAFLD as a binary trait, which is less powerful for detecting associations than a continuous measure of percent liver fat. In addition, two of these three studies focused on patients with NAFLD,( 13 , 33 ) that may miss asymptomatic subjects with NAFLD who may be present in the general population. In our study, the association of rs77249491 with percent liver fat as a continuous measure reached genome‐wide significance; yet a more modest association was observed for NAFLD as a binary trait with our relatively limited sample size.
The rs77249491 variant is located ~32 kb upstream and ~36 kb downstream from two genes, limb region 1 domain containing 1 (LMBRD1) and collagen type XIX alpha 1 chain (COL19A1), respectively. The other two variants in LD (rs146418612 and rs78276535) are <3 kb from the top hit (rs77249491) and also located between these two genes. LMBRD1 encodes for the protein LMBD1, a membrane protein involved in intracellular lysosomal‐mediated transport and metabolism of cobalamin (vitamin B12).( 34 ) In addition, LMBD1 localizes to the plasma membrane functioning to regulate the levels of membrane‐bound insulin receptor. Mouse knockdown experiments show that heterozygous loss of LMBDR1 leads to an up‐regulation of the insulin receptor pathway activation, which can in turn activate lipogenesis in the liver.( 34 , 35 ) Variants in LMBRD1 have been associated with triglyceride levels and BMI.( 5 ) COL19A1 encodes for the alpha chain of type XIX collagen, which is a member of the fibril‐associated collagens with interrupted triple helices (FACIT) family. The specific function of COL19A1 remains unknown; however, other members of this collagen family maintain the integrity of the extracellular matrix.( 36 ) Variants of COL19A1 have been associated with immunoglobulin G (IgG) glycosylation and interleukin‐18 (IL‐18) levels.( 5 ) N‐glycosylation of IgG may serve as a biomarker for nonalcoholic steatohepatitis,( 37 ) and IL‐18 in mice is involved in hepatic homeostasis.( 38 ) No potential functional activity for rs77249491 was reported using ANNOVAR. Also, we queried an East Asian eQTL data set that included blood samples from 298 Japanese subjects and found no significant cis‐eQTLs for rs7724941 with its neighboring genes LMBRD1 or COL19A (P > 0.01).( 39 ) However, two potential trans‐eQTLs (P < 1 × 10⁻⁵) were identified, the G protein‐coupled receptor 148 (GPR148) on chromosome 2 and glucosamine‐6‐phosphate deaminase 1 (GNPDA1) on chromosome 5. GPR148 belongs to the super family of GPCRs, which are primarily involved in cyclic adenosine monophosphate and phosphatidylinositol signal transduction pathways. GNPDA1 is involved in pathways related to amino sugar and nucleotide sugar metabolism, specifically where it has been found to catalyze the reversible conversion of D‐glucoasmine‐6‐phosphate into D‐fructose 6 phosphate and ammonium.
NAFLD often presents in individuals who are overweight or obese and have elevated fasting blood glucose, triglycerides, and liver enzymes and increased insulin resistance as measured by HOMA‐IR and HOMA‐beta. For rs738409 in PNPLA3, similar to prior findings,( 40 , 41 ) we found that the risk allele was associated with increased levels of ALT, HOMA‐IR, and insulin. Increased HOMA‐IR and ALT have been used as markers of NAFLD severity, Matteoni histological classification, and disease progression.( 42 ) In 1,357 subjects of European ancestry with impaired glucose regulation, the rs738409 risk allele was associated with decreased serum triglycerides.( 41 ) In a study of over 15,000 subjects, Palmer et al.( 40 ) reported that the PNPLA3 risk allele was positively associated with insulin resistance and inversely associated with serum triglycerides among subjects who were severely obese. In our multiethnic population with a balanced distribution of BMI across sex and race/ethnicity, we also observed a statistically significant positive association of rs738409 with insulin levels (beta = 0.22; P = 0.02) and a suggestive inverse association with triglycerides (beta = −0.009; P = 0.22). For rs77249491 in 6q13, the risk allele was positively associated with HOMA‐beta, HOMA‐IR, insulin, and triglycerides and inversely associated with HDL and SHBG.
Our study found suggestive associations for the previously identified liver fat risk loci rs780094 in GCKR ( 7 , 11 ) and rs58542926 in TM6SF2 ( 8 ) in directions that are consistent with prior studies. For rs780094, associations have been reported among European ancestry populations (MAF, 41%), with only modest or weak associations among Asian populations (MAF, 48%).( 13 , 43 ) Rs58542926 in TM6SF2 was previously identified in an exome‐wide study of NAFLD in African Americans (MAF, 3%), Hispanics (MAF, 6%), and European Americans (MAF, 7%).( 8 ) This variant has been replicated in two Chinese populations (MAF, 9%)( 44 , 45 ) but not in two other studies with populations from China( 46 ) and Latin America.( 47 ) The reasons for these discrepancies are unclear and may be due to differences in the methods used to identify NAFLD. For rs72613567, the insertion of an A allele in hydroxysteroid 17‐β dehydrogenase 13 (HSD17B13) had an inverse relationship with both NAFLD risk and ALT.( 48 ) This inserted allele was found to alter messenger RNA splicing so that the truncated protein reduced enzymatic activity. In our study, rs72613567 was not available in our data set for replication; however, rs6834314, which is in high LD with rs72613567 (r 2 = 0.94),( 49 ) was not associated with NAFLD (OR, 1.02; P = 0.58) or ALT (P = 0.79). Our null findings may be a result of our inclusion of participants with mostly asymptomatic NAFLD as NAFLD was detected from MRI in healthy individuals. This aligns with findings that rs6834314 is associated with increased liver steatosis but decreased liver inflammation and enzymes.( 49 )
This study has several strengths. We used the Illumina MEGAEX genotyping array, which to date provides the largest coverage of SNPs across the genome for diverse ancestral populations.( 50 ) In addition, our population‐based design of five major U.S. racial/ethnic groups with substantial variation in the distribution of percent liver fat and genetic variants provides broad representation. This allows for an effective approach in detecting liver fat risk variants and assessing heterogeneity of effects across populations. Notably, this is the first study to assess genetic determinants of liver fat among Native Hawaiians, an understudied population that experiences a disproportionately high burden of obesity and metabolic diseases. We used highly sensitive methods to assess percent liver fat (MRI) and total fat mass (DXA). These two measures allowed for testing whether associations with liver fat were independent of total fat mass.
There were a few study limitations worth considering. While the total study population with MRI‐assessed percent liver fat was large (n = 1,709), the sample size was modest for each of the five racial/ethnic groups (ranging from 269 to 424) and our analysis for NAFLD (n = 1,529) had limited statistical power. In addition, we did not have information on NAFLD‐related conditions and disease severity, such as liver fibrosis.
In summary, rs738409 in PNPLA3 and rs77249491 at 6q13 were identified as statistically significant risk loci for percent liver fat and were associated with circulating metabolic biomarkers in this multiethnic study. The novel association with rs77249491 in Japanese Americans and Native Hawaiians warrants further replication and may represent a population‐specific variant that contributes to the higher risk of NAFLD in East Asians. Additional efforts are needed to translate knowledge on genetic susceptibility into behavioral and therapeutic interventions that would reduce the metabolic consequences and significant morbidities associated with liver fat.
Supporting information
Fig S1
Fig S2
Fig S3
Fig S4
Table S1‐S10
Acknowledgment
We acknowledge the contribution of the study staff members whose dedication and excellent performance made this research possible: the Recruitment and Data Collection Core staff at USC (Dr. Valencerina, Adelaida Irimian, Chanthel Figueroa, Brenda Figueroa, Carla Flores, Karla Soriano) and UH (Dr. Terrilea Burnett, Jane Yakuma, Naomi Hee, Clara Richards, Cheryl Toyofuku, Hui Chang, Janice Nako‐Piburn, Reid Sakamoto, Sara Sameshima, Pacer Lee, Emmalyn Pilande, Neelima Nuti, Shirley So, Maya Yamane, Juanita Kaaukai); the Data Management and Analysis Core staff at USC (Zhihan Huang) and UH (Maj Earle, Joel Julian, Anne Tome, Yun Oh Jung, Emil Svrcina); the Project Administrative Core staff at UH (Eugene Okiyama); and the UH Analytical Biochemistry Shared Resource laboratory staff (Dr. Xingnan Li, Laurie Custer, Jen Lai, Tricia DeBaun, Melanie Nakatani, Karly Torii, Alyson Omori).
Supported by the U.S. National Institutes of Health (NIH), National Cancer Institute (NCI) for the Adiposity Phenotype Study (P01 CA168530 to L.L.M.) and Multiethnic Cohort Study (U01 CA164973 to L.L.M., L.R.W., and C.A.H.); NCI (P30 CA071789 to University of Hawaii Cancer Center Biostatistics, Analytical Biochemistry, and Nutrition Support Shared Resources); and the National Center for Advancing Translational Science, NIH, for recruitment activities ( UL1TR000130 to Southern California Clinical and Translational Science Institute).
Potential conflict of interest: Nothing to report.
References
Author names in bold designate shared co‐first authorship.
- 1. Estes C, Razavi H, Loomba R, Younossi Z, Sanyal AJ. Modeling the epidemic of nonalcoholic fatty liver disease demonstrates an exponential increase in burden of disease. Hepatology 2018;67:123‐133. [DOI] [PMC free article] [PubMed] [Google Scholar]
- 2. Dongiovanni P, Stender S, Pietrelli A, Mancina RM, Cespiati A, Petta S, et al. Causal relationship of hepatic fat with liver damage and insulin resistance in nonalcoholic fatty liver. J Intern Med 2018;283:356‐370. [DOI] [PMC free article] [PubMed] [Google Scholar]
- 3. Sookoian S, Pirola CJ. Genetic predisposition in nonalcoholic fatty liver disease. Clin Mol Hepatol 2017;23:1‐12. [DOI] [PMC free article] [PubMed] [Google Scholar]
- 4. Palmer ND, Musani SK, Yerges‐Armstrong LM, Feitosa MF, Bielak LF, Hernaez R, et al. Characterization of European ancestry nonalcoholic fatty liver disease‐associated variants in individuals of African and Hispanic descent. Hepatology 2013;58:966‐975. [DOI] [PMC free article] [PubMed] [Google Scholar]
- 5. Welter D, MacArthur J, Morales J, Burdett T, Hall P, Junkins H, et al. The NHGRI GWAS Catalog, a curated resource of SNP‐trait associations. Nucleic Acids Res 2014;42:D1001‐D1006. [DOI] [PMC free article] [PubMed] [Google Scholar]
- 6. Romeo S, Kozlitina J, Xing C, Pertsemlidis A, Cox D, Pennacchio LA, et al. Genetic variation in PNPLA3 confers susceptibility to nonalcoholic fatty liver disease. Nat Genet 2008;40:1461‐1465. [DOI] [PMC free article] [PubMed] [Google Scholar]
- 7. Speliotes EK, Yerges‐Armstrong LM, Wu J, Hernaez R, Kim LJ, Palmer CD, et al.; NASH CRN ; GIANT Consortium ; MAGIC Investigators ; GOLD Consortium . Genome‐wide association analysis identifies variants associated with nonalcoholic fatty liver disease that have distinct effects on metabolic traits. PLoS Genet 2011;7:e1001324. [DOI] [PMC free article] [PubMed] [Google Scholar]
- 8. Kozlitina J, Smagris E, Stender S, Nordestgaard BG, Zhou HH, Tybjærg‐Hansen A, et al. Exome‐wide association study identifies a TM6SF2 variant that confers susceptibility to nonalcoholic fatty liver disease. Nat Genet 2014;46:352‐356. [DOI] [PMC free article] [PubMed] [Google Scholar]
- 9. Sookoian S, Pirola CJ. Meta‐analysis of the influence of I148M variant of patatin‐like phospholipase domain containing 3 gene (PNPLA3) on the susceptibility and histological severity of nonalcoholic fatty liver disease. Hepatology 2011;53:1883‐1894. [DOI] [PubMed] [Google Scholar]
- 10. Mahdessian H, Taxiarchis A, Popov S, Silveira A, Franco‐Cereceda A, Hamsten A, et al. TM6SF2 is a regulator of liver fat metabolism influencing triglyceride secretion and hepatic lipid droplet content. Proc Natl Acad Sci U S A 2014;111:8913‐8918. [DOI] [PMC free article] [PubMed] [Google Scholar]
- 11. Zain SM, Mohamed Z, Mohamed R. Common variant in the glucokinase regulatory gene rs780094 and risk of nonalcoholic fatty liver disease: a meta‐analysis. J Gastroenterol Hepatol 2015;30:21‐27. [DOI] [PubMed] [Google Scholar]
- 12. Chung GE, Lee Y, Yim JY, Choe EK, Kwak MS, Yang JI, et al. Genetic polymorphisms of PNPLA3 and SAMM50 are associated with nonalcoholic fatty liver disease in a Korean population. Gut Liver 2018;12:316‐323. [DOI] [PMC free article] [PubMed] [Google Scholar]
- 13. Kawaguchi T, Sumida Y, Umemura A, Matsuo K, Takahashi M, Takamura T, et al.; Japan Study Group of Nonalcoholic Fatty Liver Disease . Genetic polymorphisms of the human PNPLA3 gene are strongly associated with severity of non‐alcoholic fatty liver disease in Japanese. PLoS One 2012;7:e38322. [DOI] [PMC free article] [PubMed] [Google Scholar]
- 14. Chalasani N, Guo X, Loomba R, Goodarzi MO, Haritunians T, Kwon S, et al.; Nonalcoholic Steatohepatitis Clinical Research Network . Genome‐wide association study identifies variants associated with histologic features of nonalcoholic fatty liver disease. Gastroenterology 2010;139:1567‐1576.e1‐e6. [DOI] [PMC free article] [PubMed] [Google Scholar]
- 15. Wojcik GL, Graff M, Nishimura KK, Tao R, Haessler J, Gignoux CR, Highland HM, Patel YM, et al. The PAGE Study: how genetic diversity improves our understanding of the architecture of complex traits. Nature 2019;570:514‐548.31217584 [Google Scholar]
- 16. Lim U, Monroe KR, Buchthal S, Fan B, Cheng I, Kristal BS, et al. Propensity for intra‐abdominal and hepatic adiposity varies among ethnic groups. Gastroenterology 2019;156:966‐975.e10. [DOI] [PMC free article] [PubMed] [Google Scholar]
- 17. Lee SS, Park SH. Radiologic evaluation of nonalcoholic fatty liver disease. World J Gastroenterol 2014;20:7392‐7402. [DOI] [PMC free article] [PubMed] [Google Scholar]
- 18. Kolonel LN, Henderson BE, Hankin JH, Nomura AM, Wilkens LR, Pike MC, et al. A multiethnic cohort in Hawaii and Los Angeles: baseline characteristics. Am J Epidemiol 2000;151:346‐357. [DOI] [PMC free article] [PubMed] [Google Scholar]
- 19. Guiu B, Loffroy R, Petit JM, Aho S, Ben Salem D, Masson D, et al. Mapping of liver fat with triple‐echo gradient echo imaging: validation against 3.0‐T proton MR spectroscopy. Eur Radiol 2009;19:1786‐1793. [DOI] [PubMed] [Google Scholar]
- 20. Szczepaniak LS, Babcock EE, Schick F, Dobbins RL, Garg A, Burns DK, et al. Measurement of intracellular triglyceride stores by H spectroscopy: validation in vivo. Am J Physiol 1999;276:E977‐E989. [DOI] [PubMed] [Google Scholar]
- 21. Shepherd JA, Ng BK, Sommer MJ, Heymsfield SB. Body composition by DXA. Bone 2017;104:101‐105. [DOI] [PMC free article] [PubMed] [Google Scholar]
- 22. Matthews DR, Hosker JP, Rudenski AS, Naylor BA, Treacher DF, Turner RC. Homeostasis model assessment: insulin resistance and beta‐cell function from fasting plasma glucose and insulin concentrations in man. Diabetologia 1985;28:412‐419. [DOI] [PubMed] [Google Scholar]
- 23. Mojiminiyi OA, Abdella NA. Effect of homeostasis model assessment computational method on the definition and associations of insulin resistance. Clin Chem Lab Med 2010;48:1629‐1634. [DOI] [PubMed] [Google Scholar]
- 24. Friedewald WT, Levy RI, Fredrickson DS. Estimation of the concentration of low‐density lipoprotein cholesterol in plasma, without use of the preparative ultracentrifuge. Clin Chem 1972;18:499‐502. [PubMed] [Google Scholar]
- 25. McCarthy S, Das S, Kretzschmar W, Delaneau O, Wood AR, Teumer A et al.; Haplotype Reference Consortium . A reference panel of 64,976 haplotypes for genotype imputation. Nat Genet 2016;48:1279‐1283. [DOI] [PMC free article] [PubMed] [Google Scholar]
- 26. Alexander DH, Novembre J, Lange K. Fast model‐based estimation of ancestry in unrelated individuals. Genome Res 2009;19:1655‐1664. [DOI] [PMC free article] [PubMed] [Google Scholar]
- 27. Mancina RM, Dongiovanni P, Petta S, Pingitore P, Meroni M, Rametta R, et al. The MBOAT7‐TMC4 variant rs641738 increases risk of nonalcoholic fatty liver disease in individuals of European descent. Gastroenterology 2016;150:1219‐1230.e6. [DOI] [PMC free article] [PubMed] [Google Scholar]
- 28. Pirola CJ, Garaycoechea M, Flichman D, Arrese M, San Martino J, Gazzi C, et al. Splice variant rs72613567 prevents worst histologic outcomes in patients with nonalcoholic fatty liver disease. J Lipid Res 2019;60:176‐185. [DOI] [PMC free article] [PubMed] [Google Scholar]
- 29. He S, McPhaul C, Li JZ, Garuti R, Kinch L, Grishin NV, et al. A sequence variation (I148M) in PNPLA3 associated with nonalcoholic fatty liver disease disrupts triglyceride hydrolysis. J Biol Chem 2010;285:6706‐6715. [DOI] [PMC free article] [PubMed] [Google Scholar]
- 30. Baratta F, Pastori D, Del Ben M, Polimeni L, Labbadia G, Di Santo S, et al. Reduced lysosomal acid lipase activity in adult patients with non‐alcoholic fatty liver disease. EBioMedicine 2015;2:750‐754. [DOI] [PMC free article] [PubMed] [Google Scholar]
- 31. BasuRay S, Smagris E, Cohen JC, Hobbs HH. The PNPLA3 variant associated with fatty liver disease (I148M) accumulates on lipid droplets by evading ubiquitylation. Hepatology 2017;66:1111‐1124. [DOI] [PMC free article] [PubMed] [Google Scholar]
- 32. Yang H, Wang K. Genomic variant annotation and prioritization with ANNOVAR and wANNOVAR. Nat Protoc 2015;10:1556‐1566. [DOI] [PMC free article] [PubMed] [Google Scholar]
- 33. Kitamoto T, Kitamoto A, Yoneda M, Hyogo H, Ochi H, Nakamura T, et al. Genome‐wide scan revealed that polymorphisms in the PNPLA3, SAMM50, and PARVB genes are associated with development and progression of nonalcoholic fatty liver disease in Japan. Hum Genet 2013;132:783‐792. [DOI] [PubMed] [Google Scholar]
- 34. Rutsch F, Gailus S, Suormala T, Fowler B. LMBRD1: the gene for the cblF defect of vitamin B(12) metabolism. J Inherit Metab Dis 2011;34:121‐126. [DOI] [PubMed] [Google Scholar]
- 35. Tseng LT, Lin CL, Tzen KY, Chang SC, Chang MF. LMBD1 protein serves as a specific adaptor for insulin receptor internalization. J Biol Chem 2013;288:32424‐32432. [DOI] [PMC free article] [PubMed] [Google Scholar]
- 36. Oudart JB, Monboisse JC, Maquart FX, Brassart B, Brassart‐Pasco S, Ramont L. Type XIX collagen: a new partner in the interactions between tumor cells and their microenvironment. Matrix Biol 2017;58:169‐177. [DOI] [PubMed] [Google Scholar]
- 37. Blomme B, Francque S, Trépo E, Libbrecht L, Vanderschaeghe D, Verrijken A, et al. N‐glycan based biomarker distinguishing non‐alcoholic steatohepatitis from steatosis independently of fibrosis. Dig Liver Dis 2012;44:315‐322. [DOI] [PubMed] [Google Scholar]
- 38. Lana JP, Martins LB, Oliveira MC, Menezes‐Garcia Z, Yamada LT, Vieira LQ, et al. TNF and IL‐18 cytokines may regulate liver fat storage under homeostasis conditions. Appl Physiol Nutr Metab 2016;41:1295‐1302. [DOI] [PubMed] [Google Scholar]
- 39. Narahara M, Higasa K, Nakamura S, Tabara Y, Kawaguchi T, Ishii M, et al. Large‐scale East‐Asian eQTL mapping reveals novel candidate genes for LD mapping and the genomic landscape of transcriptional effects of sequence variants. PLOS One 2014;9:e100924. [DOI] [PMC free article] [PubMed] [Google Scholar]
- 40. Palmer CN, Maglio C, Pirazzi C, Burza MA, Adiels M, Burch L, et al. Paradoxical lower serum triglyceride levels and higher type 2 diabetes mellitus susceptibility in obese individuals with the PNPLA3 148M variant. PLOS One 2012;7:e39362. [DOI] [PMC free article] [PubMed] [Google Scholar]
- 41. Krarup NT, Grarup N, Banasik K, Friedrichsen M, Færch K, Sandholt CH, et al. The PNPLA3 rs738409 G‐allele associates with reduced fasting serum triglyceride and serum cholesterol in Danes with impaired glucose regulation. PLOS One 2012;7:e40376. [DOI] [PMC free article] [PubMed] [Google Scholar]
- 42. Matteoni CA, Younossi ZM, Gramlich T, Boparai N, Liu YC, McCullough AJ. Nonalcoholic fatty liver disease: a spectrum of clinical and pathological severity. Gastroenterology 1999;116:1413‐1419. [DOI] [PubMed] [Google Scholar]
- 43. Kitamoto A, Kitamoto T, Nakamura T, Ogawa Y, Yoneda M, Hyogo H, et al. Association of polymorphisms in GCKR and TRIB1 with nonalcoholic fatty liver disease and metabolic syndrome traits. Endocr J 2014;61:683‐689. [DOI] [PubMed] [Google Scholar]
- 44. Wang X, Liu Z, Peng Z, Liu W. The TM6SF2 rs58542926 T allele is significantly associated with non‐alcoholic fatty liver disease in Chinese. J Hepatol 2015;62:1438‐1439. [DOI] [PubMed] [Google Scholar]
- 45. Liu YL, Reeves HL, Burt AD, Tiniakos D, McPherson S, Leathart JB, et al. TM6SF2 rs58542926 influences hepatic fibrosis progression in patients with non‐alcoholic fatty liver disease. Nat Commun 2014;5:4309. [DOI] [PMC free article] [PubMed] [Google Scholar]
- 46. Wong VW, Wong GL, Tse CH, Chan HL. Prevalence of the TM6SF2 variant and non‐alcoholic fatty liver disease in Chinese. J Hepatol 2014;61:708‐709. [DOI] [PubMed] [Google Scholar]
- 47. Sookoian S, Castano GO, Scian R, Mallardi P, Fernandez Gianotti T, Burgueno AL, et al. Genetic variation in transmembrane 6 superfamily member 2 and the risk of nonalcoholic fatty liver disease and histological disease severity. Hepatology 2015;61:515‐525. [DOI] [PubMed] [Google Scholar]
- 48. Abul‐Husn NS, Cheng X, Li AH, Xin Y, Schurmann C, Stevis P, et al. A protein‐truncating HSD17B13 variant and protection from chronic liver disease. N Engl J Med 2018;378:1096‐1106. [DOI] [PMC free article] [PubMed] [Google Scholar]
- 49. Ma Y, Belyaeva OV, Brown PM, Fujita K, Valles K, Karki S, et al.; Nonalcoholic Steatohepatitis Clinical Research Network . 17‐Beta hydroxysteroid dehydrogenase 13 is a hepatic retinol dehydrogenase associated with histological features of nonalcoholic fatty liver disease. Hepatology 2019;69:1504‐1519. [DOI] [PMC free article] [PubMed] [Google Scholar]
- 50. Bien SA, Wojcik GL, Zubair N, Gignoux CR, Martin AR, Kocarnik JM, et al.; PAGE Study . Strategies for enriching variant coverage in candidate disease loci on a multiethnic genotyping array. PLoS One 2016;11:e0167758. [DOI] [PMC free article] [PubMed] [Google Scholar]
Associated Data
This section collects any data citations, data availability statements, or supplementary materials included in this article.
Supplementary Materials
Fig S1
Fig S2
Fig S3
Fig S4
Table S1‐S10