

Abstract
Nicotinamide adenine dinucleotide (NAD+) and related coenzymes play critical roles in liver function. Although hepatic alcohol metabolism depresses NAD+, current understanding of the NAD+ metabolome in alcohol‐related liver disease (ArLD) is based on animal models. We used human liver samples to quantify the NAD+ metabolome in ArLD with samples obtained at the time of liver transplantation or resection at University Hospitals Birmingham National Health Service Foundation Trust. The severity of steatohepatitis in liver from patients with ArLD was assessed with standard liver function tests and histology. NAD‐targeted quantitative metabolomic analysis of liver tissue was performed by liquid chromatography–tandem mass spectrometry. Seventy‐two human liver specimens were analyzed, including 43 with ArLD. The NAD+ metabolome differed significantly between different types of liver disease (two‐way analysis of variance [ANOVA], P = 0.001). ArLD liver tissue showed markedly depressed concentrations of NAD+ (432 μM vs. 616 μM in normal liver) and precursor molecules nicotinic acid and nicotinamide riboside. There was a significant overall difference in the NAD+ metabolome between ArLD samples with and without steatohepatitis (two‐way ANOVA, P = 0.018). After correcting for multiple comparisons, a significant difference for individual components of the metabolome was observed for the concentration of NAD+ (mean, 462 μM vs. 322 μM; P < 0.01 in nonsevere vs. severe alcoholic steatohepatitis, respectively). NAD+ concentration was inversely related to serum bilirubin concentration (r 2 = −0.127; P = 0.04) and positively correlated with myeloperoxidase activity (r 2 = 0.31; P = 0.003). The concentration of NAD+ and its precursor molecules are significantly reduced in ArLD and are associated with disease activity. Conclusion: Liver samples from people with ArLD show depressed NAD+ and precursor levels as well as depressed myeloperoxidase activity.
Here we show that NAD+, NADP+, nicotinic acid and nicotinamide riboside are depressed in the livers of patients with alcohol‐related liver diseases, that the hepatic NAD metabolome correlates with clinical presentations, and that hepatic NAD status correlates with markers of immune function. These first‐in‐people clinical data reinforce preclinical insights in support of potential NAD‐boosting interventions in alcohol‐related liver diseases.
Abbreviations
- ADPR
adenine dinucleotide phosphate ribose
- AH
alcoholic hepatitis
- ALT
alanine aminotransferase
- ANOVA
analysis of variance
- ArLD
alcohol‐related liver disease
- ASH
alcoholic steatohepatitis
- AST
aspartate transaminase
- BMI
body mass index
- me2PY
N1‐methyl‐2‐pyridone‐5‐carboxamide
- me4PY
N1‐methyl‐4‐pyridone‐5‐carboxamide
- MeNAM
N‐methyl‐ nicotinamide
- NA
nicotinic acid
- NAD+
nicotinamide adenine dinucleotide
- NADH
reduced form of nicotinamide adenine dinucleotide
- NADP+
nicotinamide adenine dinucleotide phosphate
- NADPH
reduced form of nicotinamide adenine dinucleotide phosphate
- NAFLD
nonalcoholic fatty liver disease
- NAM
nicotinamide
- NASH
nonalcoholic steatohepatitis
- NL
normal liver
- NMN
nicotinamide mononucleotide
- NR
nicotinamide riboside
- PBC
primary biliary cholangitis
- PSC
primary sclerosing cholangitis
- TBARS
thiobarbituric acid reactive substances
Alcohol‐related liver disease (ArLD) is common throughout the world and causes a significant burden of morbidity and premature mortality.( 1 , 2 , 3 ) ArLD follows a course from simple hepatic steatosis through steatohepatitis to cirrhosis and hepatocellular carcinoma. The exception to this is acute alcoholic hepatitis (AH), which can occur at any stage along this spectrum. AH is characterized clinically by jaundice and liver failure( 4 ) with steatohepatitis (alcoholic steatohepatitis [ASH]) and cholestasis seen histologically.( 5 ) AH is associated with poor short‐term mortality, which has not improved over time despite multiple tested interventions.( 6 ) Hepatic metabolism is markedly impaired in AH. For example, urea disposal( 7 ) and hepatic mitochondrial function( 8 ) are significantly depressed.
Nicotinamide adenine dinucleotide (NAD+) is the central regulator of metabolism as coenzyme for hydride transfer reactions and as a substrate of NAD+‐consuming enzymes, including sirtuins, which are responsible for NAD+‐dependent protein lysine deacylation.( 9 ) NAD+ is a hydride group acceptor in the oxidation of carbohydrates, amino acids, and fats, forming reduced NAD (NADH). NADH is reoxidized to NAD+ by the electron transfer chain in oxidative phosphorylation. In addition, NADH is also reoxidized to NAD+ in hepatic gluconeogenesis and ketogenesis. Obesity and type 2 diabetes moderately depress hepatic NAD+ while greatly depressing hepatic nicotinamide adenine dinucleotide phosphate (NADP+) and its reduced form (NADPH).( 10 ) Alcohol metabolism depresses hepatic NAD+ concentration( 11 ) on the basis of two successive oxidation reactions in which NAD+ is reduced to NADH.( 12 , 13 ) This is accompanied by increased liver protein acetylation,( 14 , 15 ) reduced hepatic adenosine monophosphate–activated protein kinase activity,( 16 ) and reduced sirtuin‐1 (SIRT1) expression and activity.( 17 , 18 ) Depressed NAD+ synthesis in liver is associated with accumulated DNA damage and carcinogenesis.( 19 ) In addition sirtuins, particularly SIRT1, are protective against alcohol and obesity‐induced hepatic injury( 20 , 21 , 22 ) and require NAD+ as a cofactor.
Depression of the NAD+ metabolome can be counteracted by de novo NAD+ synthesis from tryptophan or through salvage pathways from precursor vitamins, nicotinamide (NAM), nicotinic acid (NA), and nicotinamide riboside (NR).( 23 , 24 ) In rodent models, hepatic carcinogenesis,( 19 ) diet‐induced steatosis,( 25 ) alcohol‐induced liver injury,( 26 ) and fibrosis( 27 ) can be counteracted by provision of NR while NA protects against alcoholic fatty liver.( 11 ) Moreover, in mice, the condition of postpartum depresses the maternal hepatic NAD metabolome( 28 ) and endogenous metabolism of NR is protective against diet‐induced liver damage.( 29 ) However, the present understanding of the normal and diseased hepatic NAD+ metabolome is based solely on animal models of ArLD. Here, we used human liver samples to assess the NAD+ metabolome in liver diseases and discovered functionally important and actionable associations with clinical markers of disease.
Materials and Methods
Human Samples
Human liver specimens were obtained at the time of transplantation or resection of metastatic disease from University Hospitals Birmingham National Health Service Foundation Trust. Collection and use of tissue for research was approved by the research ethics committee (Birmingham Research Ethics Committee, reference 06/Q2708/11). All patients gave signed informed consent for the use of their tissue and data. All procedures involved in the research were performed in concordance with relevant guidelines and legal regulations. Tissues were snap frozen in liquid nitrogen and stored at −80°C until use. Specimens were obtained from patients without hepatocellular carcinoma or cholangiocarcinoma who underwent liver transplantation for decompensated cirrhosis due to ArLD, nonalcoholic fatty liver disease (NAFLD), primary sclerosing cholangitis (PSC), or primary biliary cholangitis (PBC). In addition, liver tissue was obtained from patients undergoing liver resection, usually for metastatic disease, who had otherwise normal background liver tissue and who had not received adjuvant chemotherapy within 6 weeks of liver resection. Samples were taken from sites distal to the lesion that was resected.
Patients undergoing liver transplantation for ArLD were assessed for abstinence by addiction specialists and monitored with blood and breath testing for evidence of alcohol use during their time on the transplant wait list. During the period of this research project, there was an expectation of 6 months of abstinence before listing for liver transplantation. For control samples, clinical records were reviewed to exclude patients who consumed more than United Kingdom government‐recommended amounts of alcohol (14 units/126 g of alcohol per week). Infection with hepatitis viruses was routinely excluded in all patients by testing for viral serology.
Clinical Information
The following routine clinical data were noted: age, sex, body mass index (BMI), and laboratory parameters. The presence and severity of ASH in liver tissue specimens from patients with ArLD was based on a scoring system proposed by Altamirano and colleagues.( 30 ) Fibrosis was excluded given that all specimens were fibrotic. Included in the histologic assessment were steatosis (scored 0‐2), ballooning of hepatocytes (0‐1), neutrophilic infiltration (0‐1), bilirubinostasis (0‐3), and megamitochondria (0‐1), giving a final overall score up to a maximum of 8 points. ASH was defined as nonsevere/severe, with a cutoff of 3 points or above.
Quantitative Targeted Analysis of the NAD Metabolome
Sample extraction, liquid chromatography–mass spectrometry (LC‐MS), and quantification were performed as described.( 10 , 25 ) As the reduced coenzymes become oxidized and to some degree lost in extraction, the values of NAD+ and NADP+ are taken as indicators of the sum of hepatic NAD+ plus NADH and NADP+ plus NADPH. As a rule, most of the NAD+ plus NADH pool would be expected to be in the NAD+ form, whereas most of the NADP+ plus NADPH pool would be in the NADPH form.
Measurement of Oxidative Stress in Liver Tissue
Oxidative stress in human liver tissue specimens was assessed by colorimetric assay (Cell Bio Laboratories, San Diego, CA) of glutathione content, malonaldehyde content, myeloperoxidase activity, and superoxidase dismutase activity, according to the manufacturer’s instructions. This was performed when a sufficient quantity of sample remained after metabolomic analysis; hence, results are not available for all 43 patients with ArLD.
Statistics
When considering all diagnostic groups, overall differences in components of the NAD+ metabolome were compared with one‐way analysis of variance (ANOVA). When ArLD was compared to the aggregate values all other non‐ArLD liver diseases, Student t tests were used because data were normally distributed. To consider individual components of the NAD+ metabolome (between normal and ArLD liver tissue or ArLD specimens with or without steatohepatitis), Sidak’s method to correct for multiple comparisons was used. Statistical analyses were performed in Prism v6 for Mac (GraphPad, San Diego, CA).
Results
In total, 72 human liver specimens were analyzed: 43 specimens of liver from patients with ArLD, five NAFLD specimens, five PSC specimens, five PBC specimens, and 14 specimens of normal liver (NL). Clinical characteristics of each group are shown in Table 1. Groups differed with regard to BMI, serum aspartate aminotransferase (AST) concentration, and serum glucose. These values were distributed as would be expected by each diagnosis. Histologic characteristics of the samples from ArLD specimens are shown in Supporting Table S1.
Table 1.
Clinical Characteristics of Human Liver Samples
| Normal n = 14 | PBC n = 5 | PSC n = 5 | NASH n = 5 | All non‐ArLD disease n = 15 | ArLD n = 43 | P (one‐way ANOVA) | |||||||
|---|---|---|---|---|---|---|---|---|---|---|---|---|---|
| Mean | SD | Mean | SD | Mean | SD | Mean | SD | Mean | SD | Mean | SD | ||
| Age (years) | 62.5 | 7.1 | 61.4 | 10.8 | 49.0 | 19.0 | 56.6 | 7.9 | 55.7 | 13.5 | 56.4 | 9.6 | 0.105 |
| BMI (kg/m2) | 30.4 | 6.5 | 26.7 | 3.0 | 24.4 | 2.7 | 32.5 | 32.4 | 27.8 | 4.9 | 27.6 | 4.3 | 0.028 |
| Random glucose (mmol/L) | 4.80 | 1.0 | 4.92 | 0.9 | 5.36 | 1.6 | 14.1 | 6.5 | 8.1 | 5.7 | 7.6 | 4.1 | 0.005 |
| HbA1c (mol/mmol) | 58.7 | 6.4 | 23.0 | 7.1 | 30.7 | 4.0 | 46.7 | 19.1 | 34.8 | 15.0 | 30.1 | 11.8 | 0.002 |
| AST (U/L) | 29.0 | 9.6 | 87.5 | 87.5 | 93.8 | 45.3 | 44.0 | 14.8 | 79.3 | 39.4 | 54.6 | 27.5 | 0.005 |
| ALT (U/L) | 31.4 | 31.3 | 47.6 | 47.6 | 75.8 | 52.9 | 21.4 | 5.8 | 48.3 | 37.7 | 39.5 | 39.4 | 0.167 |
| Bilirubin (mmol/L) | 9.7 | 5.4 | 57.2 | 57.2 | 97.4 | 59.9 | 50.8 | 44.4 | 68.5 | 49.4 | 64.1 | 71.1 | 0.038 |
The NAD Metabolome Is Depressed in ArLD
LC‐MS analysis showed the NAD+ metabolome differed significantly between different types of liver disease (two‐way ANOVA, P < 0.01) (Fig. 1; Table 2). In particular, specimens from ArLD liver showed markedly depressed NAD+ (432 μM vs. 616 μM in NL; P < 0.001) and NADP+ (99 μM vs. 236 μM in NL; P < 0.001) (Fig. 1A,E). Levels of NAD precursors NA and NR were markedly lower in all liver diseases, including ArLD (1.94 μM vs. 5.74 in NL tissue and 4.0 μM vs. 19.6 in NL tissue, respectively) (Fig. 1C,G).
Fig. 1.
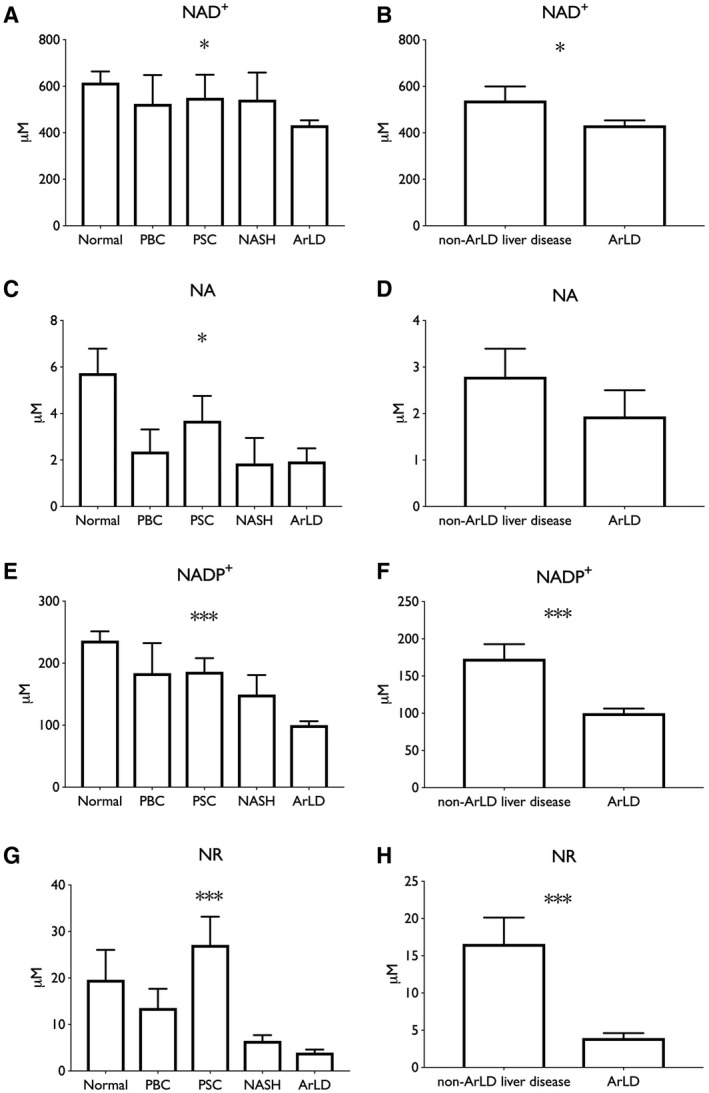
NAD coenzymes and precursors are depressed in ArLD liver samples. (A,B) NAD+; (C,D) NA; (E,F) NADP+; (G,H) NR. Data are shown as mean and SEM; *P < 0.05 and ***P < 0.001, by Student t test.
Table 2.
Quantitative Analysis of the NAD Metabolome in Liver Disease
| Metabolite* | Normal | PBC | PSC | NASH | ArLD | ALD without ASH | ALD with ASH |
|---|---|---|---|---|---|---|---|
| NAD+ | 616 | 524 | 550 | 542 | 432 | 462 | 322 |
| NADP+ | 236 | 184 | 186 | 149 | 99 | 106 | 73 |
| NMN | 5.71 | 4.84 | 4.70 | 4.43 | 3.93 | 3.93 | 2.89 |
| ADPR | 202 | 180 | 98.2 | 339 | 178 | 188 | 141 |
| cADPR | 1.83 | 2.08 | 2.15 | 2.13 | 1.71 | 1.76 | 1.29 |
| NR | 19.6 | 13.6 | 27.1 | 6.5 | 4.0 | 3.23 | 7.27 |
| NAM | 155 | 170 | 212 | 155 | 165 | 164 | 142 |
| NA | 5.74 | 2.37 | 3.69 | 1.85 | 1.94 | 2.21 | 1.38 |
| MeNAM | 15.8 | 27.3 | 30.0 | 28.7 | 36.7 | 36.6 | 35.1 |
| Me4PY | 4.33 | 3.83 | 4.41 | 2.75 | 3.45 | 3.61 | 2.86 |
| Me2PY | 25.1 | 19.8 | 24.1 | 14.9 | 21.9 | 23.0 | 17.8 |
Metabolites are expressed as mean values in μM.
Abbreviations: ALD, alcoholic liver disease; cADPR, cyclic adenine dinucleotide phosphate ribose.
Depressed NAD+ Is Associated With Clinical and Histologic Findings
Specimens from ArLD liver were grouped by the histologic severity of ASH. Of the 43 specimens analyzed, nine (21%) had severe ASH. There was a significant overall difference in the NAD+ metabolome between groups (two‐way ANOVA; P = 0.03) (Fig. 2; Table 2). After correcting for multiple comparisons, a significant difference for individual components of the metabolome in liver tissue was observed only in NAD+ concentration (mean, 462 μM vs. 322 μM; P < 0.01 in nonsevere vs. severe ASH, respectively). Comparison of metabolomic data with clinical and laboratory values showed a statistically significant inverse correlation between serum bilirubin concentration and NAD+ content of liver tissue (r 2 = −0.127; P = 0.04) (Fig. 3), whereas AST, hemoglobin A1c (HbA1c), and BMI all trended in the same direction as bilirubin. There was little indication that alanine aminotransferase (ALT) or age had a meaningful correlation with hepatic NAD+ concentration in the sampled population.
Fig. 2.
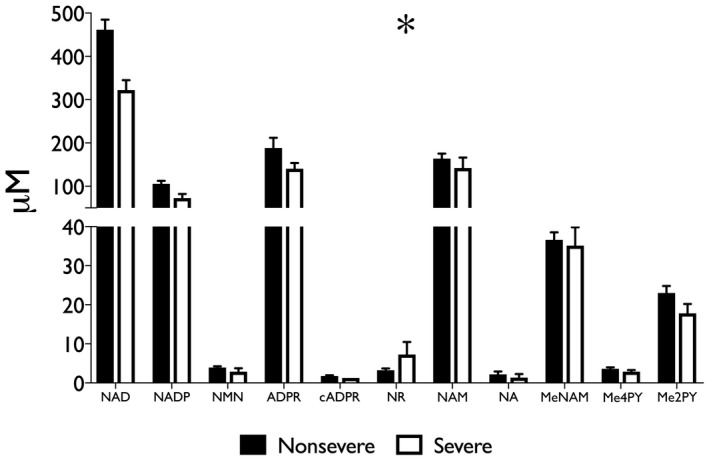
Histologically severe ASH further depresses the liver NAD metabolome with respect to nonsevere ASH. Steatohepatitis was described histologically as per the scoring system described by Altamirano et al.( 30 ); severe disease in this cohort was defined as a cutoff of 3 points or greater. Data are shown as mean and SEM; *P < 0.05, by two‐way ANOVA.
Fig. 3.
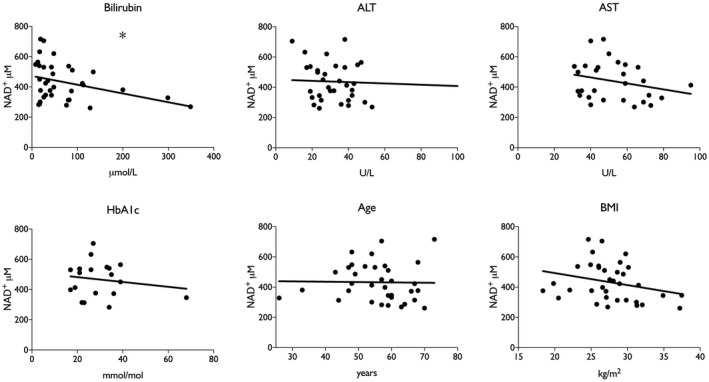
Depressed hepatic NAD+ correlates with higher bilirubin in human patients. *P < 0.05, by linear regression.
Association With Oxidative Stress
ArLD is driven by oxidative stress caused by the metabolism of alcohol in hepatocytes( 31 ) and is also associated with increased prevalence and severity of bacterial infections.( 32 ) To further examine the association of NAD+ metabolites with disease activity, human liver samples were analyzed for glutathione levels and superoxidase dismutase activity and content of thiobarbituric acid reactive substances (TBARS) and myeloperoxidase activity. There was a trend toward lower glutathione levels and higher levels of superoxide dismutase activity consistent with an elevated burden of reactive oxygen species (ROS), whereas there was a clear depression of TBARS (9.88 μM vs. 25.7μM; Student t test, P < 0.001) and myeloperoxidase activity (27.2 mU/mL vs. 47.3 mU/mL; Student t test, P < 0.001) compared to NL tissue (Fig. 4). In addition, myeloperoxidase activity correlated with NAD+ content of liver tissue (r 2 = 0.31; P = 0.003) (Fig. 5).
Fig. 4.
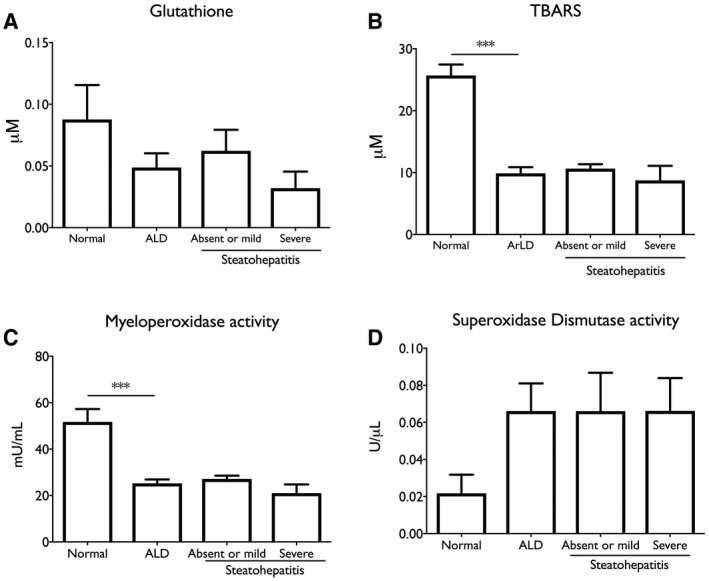
Indications of depressed neutrophil infection defenses in ArLD liver tissue. (A) Glutathione; (B) TBARS; (C) myeloperoxidase activity; (D) superoxidase dismutase activity. Data are shown as mean and SEM; **P < 0.01, by Student t test.
Fig. 5.
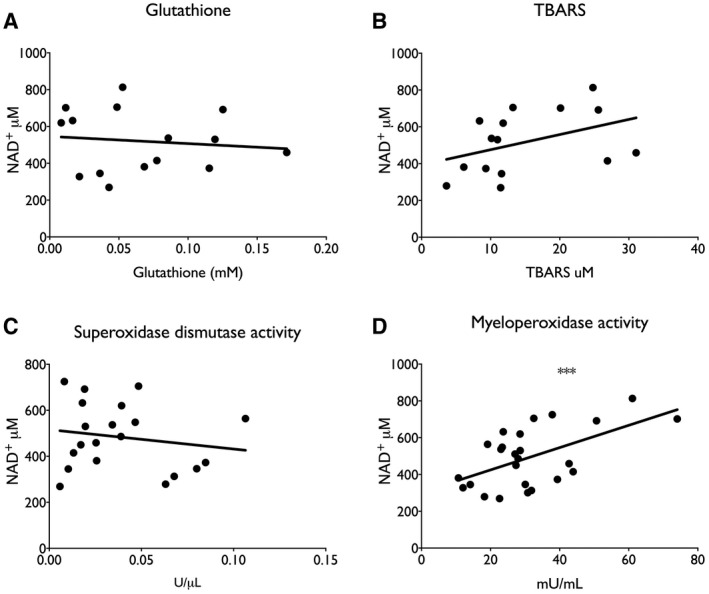
Association between myeloperoxidase activity and NAD+ content in liver tissue. (A) Glutathione; (B) TBARS; (C) myeloperoxidase activity; (D) superoxidase dismutase activity. ***P < 0.001, by linear regression.
Discussion
These data constitute the first report of the NAD+ metabolome in human liver biopsies. Using samples from explanted and resected liver tissue, we show that the concentration of NAD+ and precursor molecules are significantly lower in ArLD compared to other liver diseases and NL tissue. The concentration of NAD+ is inversely correlated with disease activity, defined by histologic presence of steatohepatitis and serum bilirubin and decreased myeloperoxidase activity. The functional consequences of depressed NAD+ and NADPH concentration is to retard fuel oxidation and limit ROS‐dependent antibacterial defenses in disease states, exacerbating and perpetuating liver injury. It is noteworthy that these changes persist despite abstinence indicating ongoing liver damage and the possibility for therapeutic intervention.
The liver has the potential not only to produce NAD coenzymes but also to circulate NAD precursors to other tissues.( 33 , 34 ) In this regard, it was interesting that levels of NA were strikingly depressed in liver diseases. It should be noted that there is no known mechanism for vertebrate formation of NA other than bacterial deamidation of NAM, which one would expect to occur largely in the gut.( 23 ) This also constitutes the first observation of a substantive NR concentration in nonsupplemented human tissues. The role of endogenous NR metabolism has been heightened by recent observation that loss of hepatic nicotinamide riboside kinase 1 (NRK1) expression depresses liver function and that endogenous hepatic NRK1 expression declines in mice on a high‐fat diet.( 29 , 35 )
Levels of nicotinamide mononucleotide (NMN) and NAM were unremarkable with respect to human disease state; however, several other metabolites appear to be characteristically dysregulated. Nonalcoholic steatohepatitis (NASH) liver samples had somewhat depressed levels of NAD coenzymes. Essentially, all the missing NAD+ and NADP+ was made up for by an increase in adenosine diphosphate ribose (ADPR; P = 0.019). PSC samples, on the other hand, had half the ADPR levels found in NL. These data suggest that ADPR‐forming enzymes, such as poly(ADPR) polymerase plus poly(ADPR) glycohydrolase, might be overactive in NASH and depressed in PSC. Such NAD‐consuming enzymes necessarily liberate NAM with production of ADPR‐related metabolites.( 9 ) Although NAM, N1‐methyl‐2‐pyridone‐5‐carboxamide (me2PY), and me4PY levels were not modulated by disease state, the levels of N‐methyl‐NAM (MeNAM) were elevated in all disease conditions, suggesting that nicotinamide‐N‐methyltransferase activity may limit NAD salvage in human liver disease.( 36 )
The depression of TBARS and myeloperoxidase activity compared to NL tissue could be interpreted as a defect in neutrophil functions required for antibacterial protection in the alcoholic liver.( 37 ) Experimental models of liver disease have often indicated an increase in TBARS during the development of liver injury, but TBARS has been noted to fall as fibrosis advances.( 38 ) It is well recognized that steatosis falls away as fibrosis increases, so lipid substrates may be less available in cirrhosis. Importantly, data from human liver regarding TBARS measurements are lacking. Our observations may therefore reflect TBARS activity in advanced disease. Conversely, myeloperoxidase activity has frequently been described in the context of human alcoholic liver disease, and our observations are consistent with impaired neutrophil responses.( 39 ) The association with reduced NAD+ availability reinforces the link with defects in immune function.
This study has limitations. The necessary use of explant or resection material excluded patients who were actively drinking or those with clinically severe AH. These groups may be studied as laboratory techniques improve and as early liver transplantation for severe AH becomes more widespread, allowing greater access to specimens for research purposes. Nevertheless histologic assessment of severity allows for careful extrapolation of our results to a wider population of patients with ArLD. For similar reasons, the very limited availability of NL tissue meant that we relied on resection specimens. We were careful to exclude those who drank hazardous levels of alcohol or with evidence of liver disease, including a prior diagnosis of NAFLD, although we note that this group had, on average, a high BMI and HbA1c. Moreover, use of explanted tissue from patients who had undergone transplantation necessarily restricted data to end‐stage disease. This may not accurately reflect earlier stages of ArLD.
The degree of active disease in transplant recipients is likely much less than patients without transplantation because patients who are actively drinking are excluded from transplantation. Nevertheless, in common with other transplant programs around the globe, examination of explanted liver tissue occasionally demonstrates a degree of steatohepatitis. This is thought to sometimes relate to covert alcohol consumption,( 40 ) although steatohepatitis can take some time to resolve even with abstinence.( 41 ) The presence of steatohepatitis signifies active hepatic inflammation rather than simple “burnt‐out” cirrhosis. As the key barometer of ASH,( 42 ) it was interesting that bilirubin also showed a significant correlation with hepatic NAD+ concentration. It is notable that despite the period of abstinence, our data are comparable to observations in experimental models of ArLD where animals are actively consuming alcohol up to the time of analysis. Li et al.( 11 ) observed lower hepatic NAD+ content in rats given ad libitum alcohol, while Wang and colleagues( 26 ) showed that mice given chronic and binge alcohol levels for 10 days had reduced hepatic NAD+ content.
Animal models have also shown that methods to increase NAD+ content can improve alcohol‐induced liver disease. In particular, supplementation of either NA( 43 , 44 ) or NR( 26 ) in rodent models can protect against alcoholic liver injury. On the basis of recent data showing that NR has the highest level of hepatic oral availability of the NAD+ precursor vitamins,( 25 ) that endogenous NR metabolism protects the liver,( 29 , 35 ) and that high‐dose NR is safe and potentially valuable in and fatty liver,( 45 ) measures to increase NAD+ content in human liver might be of clinical benefit. Vitamin B1 supplementation is well established in ArLD, primarily for the prophylaxis or treatment of Wernicke's encephalopathy. Our data raise the intriguing possibility that vitamin B3 supplementation may be beneficial for present or former abusers of alcohol, although this must be evaluated in clinical trials. We also note that the improved efficacy of NR with respect to NAM has been observed in diseases and conditions in which the NR kinase pathway is induced and/or NAM salvage expression is diminished.( 46 , 47 , 48 )
In summary, these are the first data that describe the NAD+ metabolome in human liver. The data indicate that two agents, NA and NR, which are protective in rodent models of liver disease, are depressed in ArLD and that the NAD+ metabolome is depressed in ArLD in ways that correlate with functional impairment of defense against infection. In combination with human safety and preclinical efficacy data of NA and NR,( 31 , 37 , 49 , 50 ) these data provide the rationale for the investigation of vitamin B3 supplementation in ArLD.
Supporting information
Table S1
Acknowledgment
We thank Noah Fluharty of the University of Iowa for advice and assistance in editing and formatting.
Supported by the Roy J. Carver Charitable Trust (to C.B.).
Data sets generated and/or analyzed during the current study are available from the corresponding author on request.
Potential conflict of interest: Dr. Brenner owns stock in, consults for and advises, and has received grants from ChromaDex, Inc; he consults for and advises Cytokinetics. The other authors have nothing to report.
Contributor Information
Richard Parker, Email: richardparker@nhs.net.
Charles Brenner, Email: charles-brenner@uiowa.edu.
References
Author names in bold designate shared co‐first authorship.
- 1. Fleming KM, Aithal GP, Solaymani‐Dodaran M, Card TR, West J. Incidence and prevalence of cirrhosis in the United Kingdom, 1992‐2001: a general population‐based study. J Hepatol 2008;49:732‐738. [DOI] [PubMed] [Google Scholar]
- 2. Park SH, Kim CH, Kim DJ, Park JH, Kim TO, Yang SY, et al. Prevalence of alcoholic liver disease among Korean adults: results from the fourth Korea National Health and Nutrition Examination Survey, 2009. Subst Use Misuse 2011;46:1755‐1762. [DOI] [PubMed] [Google Scholar]
- 3. Jepsen P, Vilstrup H, Sørensen HT. Alcoholic cirrhosis in Denmark ‐ population‐based incidence, prevalence, and hospitalization rates between 1988 and 2005: a descriptive cohort study. BMC Gastroenterol 2008;8:3. [DOI] [PMC free article] [PubMed] [Google Scholar]
- 4. Lucey MR, Mathurin P, Morgan TR. Alcoholic hepatitis. N Engl J Med 2009;360:2758‐2769. [DOI] [PubMed] [Google Scholar]
- 5. [No authors listed] . Alcoholic liver disease: morphological manifestations. review by international group. Lancet 1981;1:707‐711. [PubMed] [Google Scholar]
- 6. Hughes E, Hopkins LJ, Parker R. Survival from alcoholic hepatitis has not improved over time. PLoS One 2018;13:e0192393. Erratum in: PLoS One 2018;13:e0195857. [DOI] [PMC free article] [PubMed] [Google Scholar]
- 7. Glavind E, Aagaard NK, Grønbæk H, Møller HJ, Orntoft NW, Vilstrup H, et al. Alcoholic hepatitis markedly decreases the capacity for urea synthesis. PLoS One 2016;11:e0158388. [DOI] [PMC free article] [PubMed] [Google Scholar]
- 8. Mantena SK, King AL, Andringa KK, Eccleston HB, Bailey SM. Mitochondrial dysfunction and oxidative stress in the pathogenesis of alcohol‐ and obesity‐induced fatty liver diseases. Free Radic Biol Med 2008;44:1259‐1272. [DOI] [PMC free article] [PubMed] [Google Scholar]
- 9. Belenky P, Bogan KL, Brenner C. NAD+ metabolism in health and disease. Trends Biochem Sci 2007;32:12‐19. [DOI] [PubMed] [Google Scholar]
- 10. Trammell SA, Brenner C. Targeted, LCMS‐based metabolomics for quantitative measurement of NAD(+) metabolites. Comput Struct Biotechnol J 2013;4:e201301012. [DOI] [PMC free article] [PubMed] [Google Scholar]
- 11. Li Q, Xie G, Zhang W, Zhong W, Sun X, Tan X, et al. Dietary nicotinic acid supplementation ameliorates chronic alcohol‐induced fatty liver in rats. Alcohol Clin Exp Res 2014;38:1982‐1992. [DOI] [PMC free article] [PubMed] [Google Scholar]
- 12. Cherrick GR, Leevy CM. The effect of ethanol metabolism on levels on oxidized and reduced nicotinamide‐adenine dinucleotide in liver, kidney, and heart. Biochim Biophys Acta 1965;107:29‐37. [DOI] [PubMed] [Google Scholar]
- 13. Zakhari S, Li TK. Determinants of alcohol use and abuse: impact of quantity and frequency patterns on liver disease. Hepatology 2007;46:2032‐2039. [DOI] [PubMed] [Google Scholar]
- 14. Shepard BD, Tuma PL. Alcohol‐induced protein hyperacetylation: mechanisms and consequences. World J Gastroenterol 2009;15:1219‐1230. [DOI] [PMC free article] [PubMed] [Google Scholar]
- 15. Picklo MJ Sr. Ethanol intoxication increases hepatic N‐lysyl protein acetylation. Biochem Biophys Res Commun 2008;376:615‐619. [DOI] [PubMed] [Google Scholar]
- 16. You M, Matsumoto M, Pacold CM, Cho WK, Crabb DW. The role of AMP‐activated protein kinase in the action of ethanol in the liver. Gastroenterology 2004;127:1798‐1808. [DOI] [PubMed] [Google Scholar]
- 17. Shen Z, Liang X, Rogers CQ, Rideout D, You M. Involvement of adiponectin‐SIRT1‐AMPK signaling in the protective action of rosiglitazone against alcoholic fatty liver in mice. Am J Physiol Gastrointest Liver Physiol 2010;298:G364‐G374. [DOI] [PMC free article] [PubMed] [Google Scholar]
- 18. Lieber CS, Leo MA, Wang X, Decarli LM. Effect of chronic alcohol consumption on Hepatic SIRT1 and PGC‐1alpha in rats. Biochem Biophys Res Commun 2008;370:44‐48. [DOI] [PubMed] [Google Scholar]
- 19. Tummala KS, Gomes AL, Yilmaz M, Grana O, Bakiri L, Ruppen I, et al. Inhibition of de novo NAD(+) synthesis by oncogenic URI causes liver tumorigenesis through DNA damage. Cancer Cell 2014;26:826‐839. [DOI] [PubMed] [Google Scholar]
- 20. Yin H, Hu M, Liang X, Ajmo JM, Li X, Bataller R, et al. Deletion of SIRT1 from hepatocytes in mice disrupts lipin‐1 signaling and aggravates alcoholic fatty liver. Gastroenterology 2014;146:801‐811. [DOI] [PMC free article] [PubMed] [Google Scholar]
- 21. Purushotham A, Schug TT, Xu Q, Surapureddi S, Guo X, Li X. Hepatocyte‐specific deletion of SIRT1 alters fatty acid metabolism and results in hepatic steatosis and inflammation. Cell Metab 2009;9:327‐338. [DOI] [PMC free article] [PubMed] [Google Scholar]
- 22. Pfluger PT, Herranz D, Velasco‐Miguel S, Serrano M, Tschöp MH. Sirt1 protects against high‐fat diet‐induced metabolic damage. Proc Natl Acad Sci U S A 2008;105:9793‐9798. [DOI] [PMC free article] [PubMed] [Google Scholar]
- 23. Bogan KL, Brenner C. Nicotinic acid, nicotinamide, and nicotinamide riboside: a molecular evaluation of NAD+ precursor vitamins in human nutrition. Annu Rev Nutr 2008;28:115‐130. [DOI] [PubMed] [Google Scholar]
- 24. Bieganowski P, Brenner C. Discoveries of nicotinamide riboside as a nutrient and conserved NRK genes establish a Preiss‐Handler independent route to NAD+ in fungi and humans. Cell 2004;117:495‐502. [DOI] [PubMed] [Google Scholar]
- 25. Trammell SA, Weidemann BJ, Chadda A, Yorek MS, Holmes A, Coppey LJ, et al. Nicotinamide riboside opposes type 2 diabetes and neuropathy in mice. Sci Rep 2016;6:26933. [DOI] [PMC free article] [PubMed] [Google Scholar]
- 26. Wang S, Wan T, Ye M, Qiu Y, Pei L, Jiang R, et al. Nicotinamide riboside attenuates alcohol induced liver injuries via activation of SirT1/PGC‐1alpha/mitochondrial biosynthesis pathway. Redox Biol 2018;17:89‐98. [DOI] [PMC free article] [PubMed] [Google Scholar]
- 27. Jiang R, Zhou Y, Wang S, Pang N, Huang Y, Ye M, et al. Nicotinamide riboside protects against liver fibrosis induced by CCl4 via regulating the acetylation of Smads signaling pathway. Life Sci 2019;225:20‐28. [DOI] [PubMed] [Google Scholar]
- 28. Ear PH, Chadda A, Gumusoglu SB, Schmidt MS, Vogeler S, Malicoat J, et al. Maternal nicotinamide riboside enhances postpartum weight loss, juvenile offspring development, and neurogenesis of adult offspring. Cell Rep 2019;26:969‐983.e964. [DOI] [PubMed] [Google Scholar]
- 29. Sambeat A, Ratajczak J, Joffraud M, Sanchez‐Garcia JL, Giner MP, Valsesia A, et al. Endogenous nicotinamide riboside metabolism protects against diet‐induced liver damage. Nat Commun 2019;10:4291. [DOI] [PMC free article] [PubMed] [Google Scholar]
- 30. Altamirano J, Miquel R, Katoonizadeh A, Abraldes JG, Duarte‐Rojo A, Louvet A, et al. A histologic scoring system for prognosis of patients with alcoholic hepatitis. Gastroenterology 2014;146:1231‐1239.e1231‐1236. [DOI] [PMC free article] [PubMed] [Google Scholar]
- 31. Cederbaum AI, Lu Y, Wu D. Role of oxidative stress in alcohol‐induced liver injury. Arch Toxicol 2009;83:519‐548. [DOI] [PubMed] [Google Scholar]
- 32. Trevejo‐Nunez G, Kolls JK, de Wit M. Alcohol use as a risk factor in infections and healing: a clinician's perspective. Alcohol Res 2015;37:177‐184. [PMC free article] [PubMed] [Google Scholar]
- 33. Trammell SA, Schmidt MS, Weidemann BJ, Redpath P, Jaksch F, Dellinger RW, et al. Nicotinamide riboside is uniquely and orally bioavailable in mice and humans. Nat Commun 2016;7:12948. [DOI] [PMC free article] [PubMed] [Google Scholar]
- 34. Liu L, Su X, Quinn WJ 3rd, Hui S, Krukenberg K, Frederick DW, et al. Quantitative analysis of NAD synthesis‐breakdown fluxes. Cell Metab 2018;27:1067‐1080.e1065. [DOI] [PMC free article] [PubMed] [Google Scholar]
- 35. Fan R, Cui J, Ren F, Wang Q, Huang Y, Zhao B, et al. Overexpression of NRK1 ameliorates diet‐ and age‐induced hepatic steatosis and insulin resistance. Biochem Biophys Res Commun 2018;500:476‐483. [DOI] [PubMed] [Google Scholar]
- 36. Brenner C. Metabolism: targeting a fat‐accumulation gene. Nature 2014;508:194‐195. [DOI] [PubMed] [Google Scholar]
- 37. Moreau R, Perianin A, Arroyo V. Review of defective NADPH oxidase activity and myeloperoxidase release in neutrophils from patients with cirrhosis. Front Immunol 2019;10:1044. [DOI] [PMC free article] [PubMed] [Google Scholar]
- 38. Hernandez‐Munoz R, Diaz‐Munoz M, Lopez V, Lopez‐Barrera F, Yanez L, Vidrio S, et al. Balance between oxidative damage and proliferative potential in an experimental rat model of CCl4‐induced cirrhosis: protective role of adenosine administration. Hepatology 1997;26:1100‐1110. [DOI] [PubMed] [Google Scholar]
- 39. Boussif A, Rolas L, Weiss E, Bouriche H, Moreau R, Perianin A. Impaired intracellular signaling, myeloperoxidase release and bactericidal activity of neutrophils from patients with alcoholic cirrhosis. J Hepatol 2016;64:1041‐1048. [DOI] [PubMed] [Google Scholar]
- 40. Wells JT, Said A, Agni R, Tome S, Hughes S, Dureja P, et al. The impact of acute alcoholic hepatitis in the explanted recipient liver on outcome after liver transplantation. Liver Transpl 2007;13:1728‐1735. [DOI] [PubMed] [Google Scholar]
- 41. Majumdar SK, Dias N, Aps EJ. Relationship between hepatic histology and conventional biochemical liver function test in chronic alcoholic patients. Drug Alcohol Depend 1991;28:211‐214. [DOI] [PubMed] [Google Scholar]
- 42. Louvet A, Naveau S, Abdelnour M, Ramond MJ, Diaz E, Fartoux L, et al. The Lille model: a new tool for therapeutic strategy in patients with severe alcoholic hepatitis treated with steroids. Hepatology 2007;45:1348‐1354. [DOI] [PubMed] [Google Scholar]
- 43. Dou X, Shen C, Wang Z, Li S, Zhang X, Song Z. Protection of nicotinic acid against oxidative stress‐induced cell death in hepatocytes contributes to its beneficial effect on alcohol‐induced liver injury in mice. J Nutr Biochem 2013;24:1520‐1528. [DOI] [PMC free article] [PubMed] [Google Scholar]
- 44. Kolovou GD, Salpea KD, Mihas C, Malakos I, Kafaltis N, Bilianou HG, et al. Comparison of simvastatin and nicotinic acid administration in alcohol‐treated Wistar rats. Hellenic J Cardiol 2008;49:79‐85. [PubMed] [Google Scholar]
- 45. Dollerup OL, Christensen B, Svart M, Schmidt MS, Sulek K, Ringgaard S, et al. A randomized placebo‐controlled clinical trial of nicotinamide riboside in obese men: safety, insulin‐sensitivity, and lipid‐mobilizing effects. Am J Clin Nutr 2018;108:343‐353. [DOI] [PubMed] [Google Scholar]
- 46. Diguet N, Trammell SAJ, Tannous C, Deloux R, Piquereau J, Mougenot N, et al. Nicotinamide riboside preserves cardiac function in a mouse model of dilated cardiomyopathy. Circulation 2018;137:2256‐2273. [DOI] [PMC free article] [PubMed] [Google Scholar]
- 47. Vaur P, Brugg B, Mericskay M, Li Z, Schmidt MS, Vivien D, et al. Nicotinamide riboside, a form of vitamin B3, protects against excitotoxicity‐induced axonal degeneration. FASEB J 2017;31:5440‐5452. [DOI] [PubMed] [Google Scholar]
- 48. Liu HW, Smith CB, Schmidt MS, Cambronne XA, Cohen MS, Migaud ME, et al. Pharmacological bypass of NAD(+) salvage pathway protects neurons from chemotherapy‐induced degeneration. Proc Natl Acad Sci U S A 2018;115:10654‐10659. [DOI] [PMC free article] [PubMed] [Google Scholar]
- 49. Conze D, Brenner C, Kruger CL. Safety and metabolism of long‐term administration of NIAGEN (nicotinamide riboside chloride) in a randomized, double‐blind, placebo‐controlled clinical trial of healthy overweight adults. Sci Rep 2019;9:9772. [DOI] [PMC free article] [PubMed] [Google Scholar]
- 50. Elhassan YS, Kluckova K, Fletcher RS, Schmidt MS, Garten A, Doig CL, et al. Nicotinamide riboside augments the aged human skeletal muscle NAD(+) metabolome and induces transcriptomic and anti‐inflammatory signatures. Cell Rep 2019;28:1717‐1728.e1716. [DOI] [PMC free article] [PubMed] [Google Scholar]
Associated Data
This section collects any data citations, data availability statements, or supplementary materials included in this article.
Supplementary Materials
Table S1