High-grade B-cell lymphoma (HGBL) is a new, provisional entity in the most recent World Health Organization classification1 and includes cases displaying features intermediate between diffuse large B-cell lymphoma (DLBCL) and Burkitt lymphoma (BL): the diagnosis is challenging, and the molecular bases of this morphological spectrum are not fully understood.
While morphologic intra-tumor heterogeneity has long been observed, advances in molecular biology have unveiled genetic heterogeneity only in recent years, identifying two different patterns of tumor evolution: a “linear” model, in which tumor subclones maintain all genetic lesions present in the initial clone with additional subclonal mutations, and a “divergent” model, in which tumor clones share some genetic alterations — inherited from a common ancestor cell — but also display “private” mutations, which are acquired during early evolutionary divergence.2
In several studies of solid cancers the relationship between morphological and genetic heterogeneity in regions spatially separated from the same primary tumor have been investigated, revealing a divergent evolutionary pattern.3,4
However, in the field of aggressive B-cell lymphomas, previous works have generally compared temporally distinct samples to infer clonal evolution during high-grade transformation or disease progression,5–7 whereas few studies have adopted spatial sequencing to define tumor evolution.8,9
We applied spatial sequencing to a case of HGBL that displayed striking morphological heterogeneity within the same biopsy and unveiled the divergent evolution of DLBCL and BL areas from a common precursor cell.
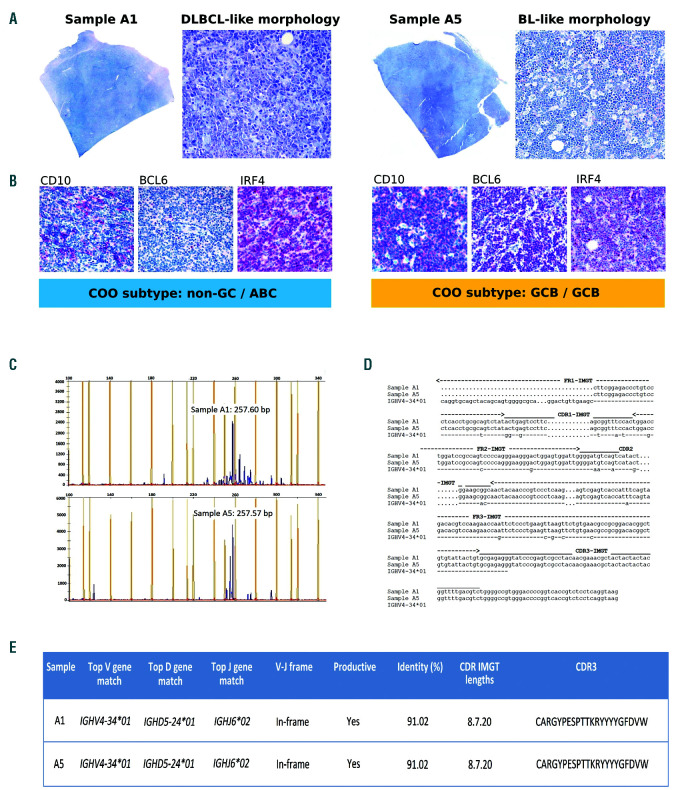
A 74-year-old man presented with lower limb edema and swollen bilateral inguinal lymph nodes. A computed tomography scan revealed extensive lymphadenopathy above and below the diaphragm, with the largest lymph node measuring 7 cm at the greatest dimension. The blood screen results were unremarkable. A bone marrow biopsy was negative for lymphoma involvement. An inguinal lymph node biopsy revealed a straightforward histological heterogeneity: samples A1 to A4 presented DLBCL-like appearances, while sample A5 displayed morphological features reminiscent of classical BL, with a ‘starry sky’ pattern (Figure 1A). Both areas were strongly positive for CD20 and BCL2 (>50% of neoplastic cells), with partial c-MYC expression (<40%) and negative staining for CD5 and Tdt; the Ki-67 proliferation index varied from 80%, in the DLBCL-like area, to 98-100%, in the BL-like area. The Epstein-Barr encoding region (EBER) in situ hybridization was negative.
Figure 1.
Morphological features, cell-of-origin (COO) subtypes and clonality analysis of diffuse large B-cell lymphoma-like and Burkitt lymphoma-like areas. (A) Sample A1 shows diffuse large B-cell lymphoma-like (DLBCL-like) histology (diffuse growth of large-sized polymorphous cells with prominent nucleoli); sample A5 displays Burkitt lymphoma (BL-like) features (‘starry sky’ pattern, medium-sized tumor cells with finely clumped chromatin, multiple nucleoli and basophilic cytoplasm, admixed with numerous tingible body macrophages) (Giemsa stain; original magnification 20* and 200*). (B) DLBCL-like area exhibits a ‘non-germinal center’ (non-GC) profile according to Hans algorithm and an activated B-cell (ABC) signature by gene expression profiling (left panel); conversely, BL-like area presents a ‘germinal center-like’ phenotype and a germinal centre-like (GCB) signature (right panel). Both samples display the same immunoglobulin (IGH) gene rearrangement (C) and identical hypermutated IGHV4-34 sequences (D). No detectable amplifications were observed using the leader primers; therefore, the sequences were obtained with FR1 consensus primers: nucleotide changes are shown from codon 15 in FR1-IMGT to the end of CDR3-IMGT. Hyphens (-) indicate nucleotide identity with the germline, dots (.) represent gaps. (E) IMGT/V-QUEST summary displaying V-D-J alignment, nucleotide identity to germline (%), and CDR3 sequence.
Cell-of-origin (COO) subtyping according to the Hans algorithm showed different results (Online Supplementary Table S1): the DLBCL-like region exhibited a ‘non-germinal centre’ (non-GC) immunoprofile (CD107BCL67 IRF4+), while BL-like cells showed a ‘germinal centre-like’ (GCB) phenotype (CD10+/BCL6+/IRF4 partially positive).1 At the gene expression level, both areas presented similar microenvironmental profiles (Online Supplementary Figure S1),10 but differed in their COO signatures: in line with the Hans algorithm results, the DLBCL-like and BL-like areas were associated with an activated B-cell (ABC) and a GCB subtype, respectively (Figure 1B and Online Supplementary Table S2).1
An immunoglobulin (IGH) gene clonality assessment of sample A1 (DLBCL-like area) and sample A5 (BL-like area) showed monoclonal peaks of nearly identical size (Figure 1C). The Sanger sequencing results of the rearranged regions documented the same productive, hypermutated IGHV4-34/IGHD5-24/IGHJ6 sequence (Figure 1D-E and Online Supplementary Table S3). An analysis of the IGHV4-34 mutational pattern revealed evidence of antigen-driven selection (Online Supplementary Figure S2A-B) and suggested the retained autoreactive potential of the neoplastic B-cell receptor (Online Supplementary Figure S2C).
Fluorescence in situ hybridization (FISH) revealed a CDKN2A homozygous deletion and BCL2 gain in both samples (Online Supplementary Table S4), whereas MYC, BCL6, and TP53 did not display abnormalities. Thus, a diagnosis of HGBL not otherwise specified (HGBL, NOS) with features intermediate between DLBCL and BL was made.1 The patient underwent six rituximab plus cyclophosphamide, doxorubicin, vincristine, and prednisone (R-CHOP) cycles with complete response. He relapsed with disseminated disease 36 months after treatment; a second lymph node biopsy was not performed, due to the rapid worsening of his general condition. He received palliative care and died soon afterward.
To reconstruct the evolutionary relationship between DLBCL-like and BL-like areas, we performed targeted DNA next generation sequencing on spatially separated samples, and identified 20 nonsynonymous singlenucleotide mutations and two indels in sample A1 (DLBCL-like area), and 16 nonsynonymous singlenucleotide mutations in sample A5 (BL-like area). Of all the alterations detected, five (15%) were shared mutations (involving the genes CD79B, MYD88, BTG2, KLF2, and HIST1H1B), whereas the remainder were unique to either the A1 or A5 samples (Online Supplementary Tables S5-6).
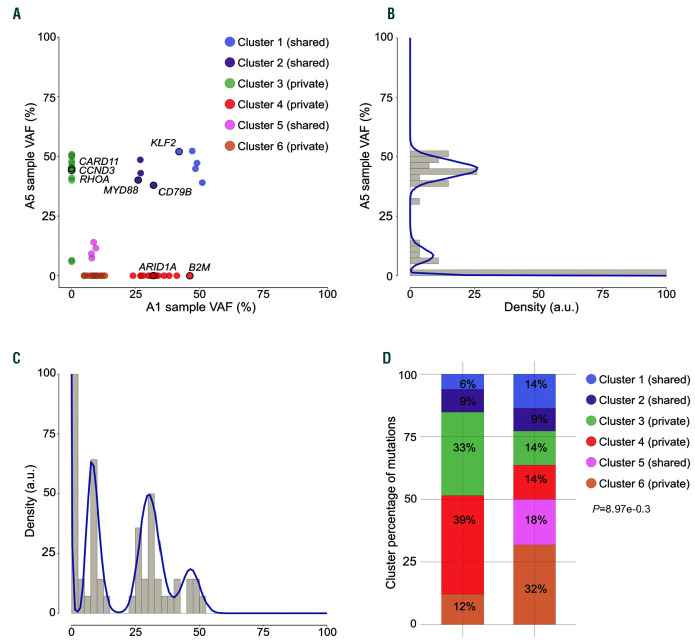
To dissect the genetic heterogeneity of sample A1 and sample A5, we inferred the tumoral subclonal structure by analyzing the variant allele frequencies (VAF) of somatic mutations (Figure 2A-C). Single analysis of sample A5 (Figure 2B) suggested a simple clonal architecture consisting of a high-VAF major clone (average VAF 44.7%) and a single subclone (average VAF 9.2%); similarly, the sample A1 density plot (Figure 2C) showed two poorly separated high-VAF clones (average VAF 46.5% and 30.6%) and a low-frequency subclone (average VAF 8.7%).
Figure 2.
Inferring subclonal architecture in sample A1 and sample A5. (A) SciClone two-dimensional analysis of sample A1/A5 revealed six distinct variant clusters, which were not evident in the one-dimensional single-sample kernel density distributions of sample A5 (B) and sample A1 (C). Driver genes that are recurrently mutated in diffuse large B-cell lymphoma and Burkitt lymphoma are highlighted. (D) Stacked bar chart depicting the proportions of non-silent and silent mutations across the clonal clusters (C1-C6). P-values were calculated with the two-sided Fisher’s exact test.
The multidimensional analysis allowed a more precise definition of the subclonal structure, identifying six different clusters (Figure 2A) among the clones that occurred at similar frequencies in the single-sample analysis. The A1 and A5 high-VAF clones were dissected into two shared clusters (C1 and C2), plus the private clusters C3 (in sample A5) and C4 (in sample A1). Shared clusters C1 and C2 harbored a KLF2 deleterious mutation and the gain-of-function mutations CD79B Y196H and MYD88 L265P, respectively: all of which are ABC DLBCL-specific lesions that trigger nuclear factor kappa B (NF-κB) activity.11,12
The DLBCL-like high-VAF cluster C4 displayed private mutations in epigenetic modifiers (ARID1A, HIST1H1E) and a frameshift deletion of B2M, whose disruption may result in defective HLA-I expression, facilitating evasion from T-cell mediated immunosurveillance.13 The low-VAF private cluster C6 represented the back-bone of A1-sub- clone, and comprised an additional HIST1H1E mutation (Online Supplementary Figure S3).
The major clone of the BL-like area was composed of a private cluster (C3), which overlapped with shared clusters C1 and C2. Interestingly, cluster C3 displayed hotspot mutations in CCDN3 I290R and RHOA L69R, two genes that are recurrently involved in BL.14,15 In addition, the BL-like private cluster C3 presented a private CARD11 missense substitution, which may also boost the NF-κB pathway.11
We also observed evidence of divergent progression at the individual gene level: both areas shared the mutations BTG2 Q43Ter and HIST1H1B A151S, but both areas also independently developed additional private events involving these two genes (Online Supplementary Figure S4).
To further investigate the evolutionary trajectories that shaped DLBCL-like and BL-like areas, we examined the distribution of non-silent (dN) and silent (dS) mutations among distinct clusters. Analysis of the dN/dS ratio, which is a measure of positive or negative selection that is widely used in evolutionary genetics, revealed an excess of non-silent alterations at both global and singlegene levels, identifying six significative genes (Online Supplementary Figure S5). Some of these genes are well- known activation-induced deaminase (AID) targets; therefore, we could not exclude the possibility that the high dN/dS values observed at these loci may reflect aberrant somatic hypermutation, rather than positive selection. However, even when considering only the non-AID targets, these genes primarily belonged to private clusters, which were also characterized by a significant skewing in non-silent mutations (Figure 2D), suggesting a positive selective pressure that promoted the expansion of private clones.
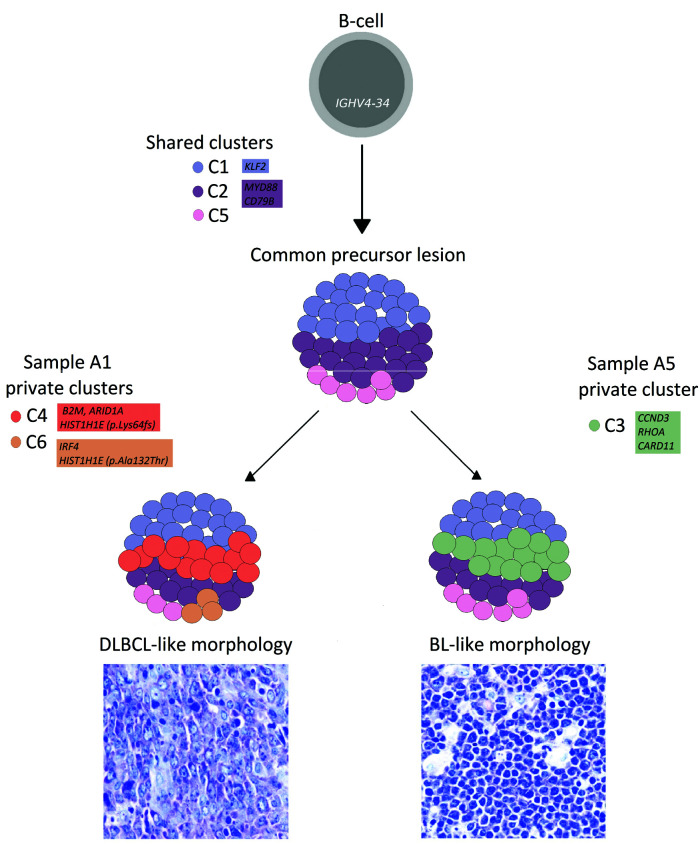
This mutational landscape resembles the divergent evolutionary model observed in follicular lymphoma transformation and DLBCL relapse,6–9 suggesting that DLBCL-like and BL-like components may derive from the branching evolution of a clonal common precursor and that shared alterations may have occurred early during tumor evolution (Figure 3). CD79B and MYD88 are typical ABC-DLBCL lesions, but are extremely uncommon in GCB-DLBCL, and are virtually absent in BL: their cooccurrence in both DLBCL and BL-like regions may indicate that the common precursor cell initially gave rise to an ABC DLBCL histotype, with chronic activation of the B-cell receptor and NF-kB signaling.11
Figure 3.
Hypothetical development of diffuse large B-cell lymphoma-like and Burkitt lymphoma-like areas. The mutation clusters C1, C2, and C5 are present in both areas and likely occurred in a common precursor lesion, derived from an IGHV4-34 B-cell. The diffuse large B-cell lymphoma-like (DLBCL-like) and Burkitt lymphoma-like (BL-like) clones may have derived through the independent acquisition of distinct mutations (private clusters C3, C4, and C6). CCDN3 and RHOA mutations may have influenced the BL-like morphology (Giemsa stain; original magnification 600*). Shared and private clusters are depicted as color-coded circles; the schematic representation of cluster prevalence in DLBCL-like and BL-like areas is approximated from the median variant allele frequency (VAF) values of each cluster detected in sample A1 and sample A5. Genes recurrently altered in both DLBCL and BL are highlighted.
On the one hand, a daughter cell may have acquired additional independent mutations in CCDN3 and RHOA—two genes more frequently altered in BL than in ABC DLBCL14 that may have induced the development of a ‘Burkitt-like’ morphology and the switch from an ABC to a GCB signature in the BL-like area; the biallelic loss of CDKN2A in most of the A5 nuclei may also have contributed to the BL-like mitotic rate by deregulating the cell cycle, together with the CCND3 mutation. On the other hand, the DLBCL-like component may have undergone other private genetic events in genes involved in epigenetic remodelling and immune escape.
To the best of our knowledge, we document, herein for the first time, the divergent molecular evolution from a common precursor cell in DLBCL-like and BL-like areas belonging to the same HGBL, NOS sample. Our findings suggest that HGBL, NOS clonal evolution may proceed in a divergent, rather than a linear manner, as already postulated for transformed FL and relapsed DLBCL,5–7 likely driven by a non-neutral positive-selective pressure. Moreover, intra-tumor molecular heterogeneity may have broad clinical implications, potentially contributing to drug resistance through Darwinian selection: unravelling tumor heterogeneity and evolution may provide new tools for the diagnosis and therapy of HGBL.
Acknowledgments
The authors would like to thank Prof. Riccardo Dalla Favera for discussions and critical comments on the manuscript and Virginia Maltoni, Pierluigi Antoniotti, and Sebastiano Spagnolo for their skilled technical assistance.
Footnotes
Funding: this work was founded by the 5×1000 grant n. 21198 of the Italian Association for Cancer Research (AIRC), Milan and partially supported by the Italian Ministry of Health with Ricerca Corrente and 5×1000 funds.
Information on authorship, contributions, and financial & other disclosures was provided by the authors and is available with the online version of this article at www.haematologica.org.
References
- 1.Swerdlow SH, Campo E, Harris NL, et al. WHO Classification of Tumours of Haematopoietic and Lymphoid Tissues. Lyon: International Agency for Research on Cancer (IARC); 2016. [Google Scholar]
- 2.Campbell PJ, Pleasance ED, Stephens PJ, et al. Subclonal phylogenetic structures in cancer revealed by ultra-deep sequencing. Proc Natl Acad Sci U S A. 2008;105(35):13081–13086. [DOI] [PMC free article] [PubMed] [Google Scholar]
- 3.De Bruin EC, McGranahan N, Mitter R, et al. Spatial and temporal diversity in genomic instability processes defines lung cancer evolution. Science. 2014;346(6206):251–256. [DOI] [PMC free article] [PubMed] [Google Scholar]
- 4.Gerlinger M, Rowan AJ, Horswell S, et al. Intratumor heterogeneity and branched evolution revealed by multiregion sequencing. N Engl J Med. 2012;366(10):883–892. [DOI] [PMC free article] [PubMed] [Google Scholar]
- 5.Pasqualucci L, Khiabanian H, Fangazio M, et al. Genetics of follicular lymphoma transformation. Cell Rep. 2014;6(1):130–140. [DOI] [PMC free article] [PubMed] [Google Scholar]
- 6.Zhang J, Grubor V, Love CL, et al. Genetic heterogeneity of diffuse large B-cell lymphoma. Proc Natl Acad Sci U S A. 2013;110(4):1398–1403. [DOI] [PMC free article] [PubMed] [Google Scholar]
- 7.Barranco GI, Fernández S, Oña R, et al. Branched clonal evolution: nodal follicular lymphoma and primary diffuse large B-cell lymphoma of the central nervous system. Haematologica. 2019;104(7):e326–e329. [DOI] [PMC free article] [PubMed] [Google Scholar]
- 8.Rossi D, Diop F, Spaccarotella E, et al. Diffuse large B-cell lymphoma genotyping on the liquid biopsy. Blood. 2017;129(14):1947–1957. [DOI] [PubMed] [Google Scholar]
- 9.Araf S, Wang J, Korfi K, et al. Genomic profiling reveals spatial intratumor heterogeneity in follicular lymphoma. Leukemia. 2018;32(5):1261–1265 [DOI] [PMC free article] [PubMed] [Google Scholar]
- 10.Ciavarella S, Vegliante MC, Fabbri M, et al. Dissection of DLBCL microenvironment provides a gene expression-based predictor of survival applicable to formalin-fixed paraffin-embedded tissue. Ann Oncol. 2018;29(12):2363–2370. [DOI] [PMC free article] [PubMed] [Google Scholar]
- 11.Davis RE, Ngo VN, Lenz G, et al. Chronic active B-cell-receptor signalling in diffuse large B-cell lymphoma. Nature. 2010;463(7277):88–92. [DOI] [PMC free article] [PubMed] [Google Scholar]
- 12.Ngo VN, Young RM, Schmitz R, et al. Oncogenically active MYD88 mutations in human lymphoma. Nature. 2011;470(7332):115–119. [DOI] [PMC free article] [PubMed] [Google Scholar]
- 13.Challa-Malladi M, Lieu YK, Califano O, et al. Combined genetic inactivation of b2-microglobulin and CD58 reveals frequent escape from immune recognition in diffuse large B cell lymphoma. Cancer Cell. 2011;20(6):728–740. [DOI] [PMC free article] [PubMed] [Google Scholar]
- 14.Schmitz R, Young RM, Ceribelli M, et al. Burkitt lymphoma pathogenesis and therapeutic targets from structural and functional genomics. Nature. 2012;490(7418):116–120. [DOI] [PMC free article] [PubMed] [Google Scholar]
- 15.O’Hayre M, Inoue A, Kufareva I, et al. Inactivating mutations in GNA13 and RHOA in Burkitt’s lymphoma and diffuse large B-cell lymphoma: a tumor suppressor function for the Ga13/RhoA axis in B cells. Oncogene. 2016;35(29):3771–3780. [DOI] [PMC free article] [PubMed] [Google Scholar]


