Abstract
Transferrin receptor 1 (Tfr1) mediates the endocytosis of diferric transferrin in order to transport iron, and Tfr1 has been suggested to play an important role in hematopoiesis. To study the role of Tfr1 in hematopoiesis, we generated hematopoietic stem cell (HSC) specific Tfr1 knockout mice. We found that Tfr1 conditional knockout mice reached full term but died within one week of birth. Further analyses revealed that Tfr1-deficient HSC had impaired development of all hematopoietic progenitors except thrombocytes and B lymphocytes. In addition, Tfr1-deficient cells had cellular iron deficiency, which blocked the proliferation and differentiation of hematopoietic precursor cells, attenuated the commitment of hematopoietic lineages, and reduced the regeneration potential of HSC. Notably, hemin rescued the colony-forming capacity of Tfr1-deficient HSC, whereas expressing a mutant Tfr1 that lacks the protein’s iron-transporting capacity failed to rescue hematopoiesis. These findings provide direct evidence that Tfr1 is essential for hematopoiesis through binding diferric transferrin to supply iron to cells.
Introduction
Hematopoietic stem cells (HSC) are essential for the continuous replenishment of the hematopoietic system throughout the lifespan of an organism.1–4 HSC regulate development5,6 and undergo important changes during aging.7 However, precisely how HSC orchestrate the delicate balance between proliferation, differentiation, and self-renewal remains one of the major topics of study in the field of stem cell biology.
Iron is essential for a variety of fundamental metabolic processes and is incorporated into many proteins in the form of cofactors such as heme and iron-sulfur clusters. In adults, a substantial proportion of iron is present in the liver and the hematopoietic system. Excess iron in the liver is clinically relevant, as individuals with systemic iron overload often develop liver cirrhosis and hepatocellular carcinoma.8 On the other hand, hematopoiesis is sensitive to iron deficiency, and insufficient iron leads to iron deficiency anemia.9 Although iron serves as an essential cofactor for enzymes involved in cell proliferation and differentiation, the precise mechanism that regulates iron homeostasis in HSC is unknown.
Transferrin receptor 1 (Tfr1) facilitates the uptake of iron at the cell surface by internalizing diferric transferrin.10 Tfr1 is ubiquitously expressed in mammalian tissues and has been called the “cellular iron gate”.11 Tfr1 is essential for erythropoiesis, a process that consumes the majority of circulating iron.12 Accordingly, mice that globally lack Tfr1 (i.e. homozygous Tfr1 knockout mice) are embryonic lethal; moreover, although heterozygous Tfr1 knockout mice survive to adulthood they have microcytic hypochromic erythrocytes, consistent with Tfr1’s essential role in erythropoiesis.13 In addition, Tfr1 plays an important role in the development and proliferation of lymphocytes.14 A recent study found that patients who carry a homozygous mutation in the TFR1 gene have reduced T-cell and B-cell proliferation, as well as reduced antibody production.15
Several key questions remain, however, regarding the function of Tfr1 in hematopoiesis. First, because previous studies focused on mature hematopoietic lineages, whether Tfr1 plays a role in upstream of hematopoiesis (for example, in stem cells, progenitors, and precursor cells) is unknown. Second, Tfr1 plays a role in signal transduction pathways other than iron uptake and is required for maintaining intestinal epithelial homeostasis,16 thus raising the question of whether the function of Tfr1 in hematopoiesis is independent of its iron-uptake function. Finally, because Tfr1 knockout embryos die at embryonic stage E10.5-E12.5, the embryo’s iron demands at later stages of development have not been investigated.
To address these key questions, we generated mice that lack Tfr1 expression selectively in HSC and used this model to study the role of Tfr1 in hematopoiesis. We found that loss of Tfr1 in HSC does not affect the production of hematopoietic stem/progenitor cells (HSPC) in the fetal liver (FL) but markedly impairs the expansion of functional HSC in the bone marrow (BM). Mechanistically, iron uptake rather than signal transduction appears to be the key function of Tfr1 in hematopoiesis, and iron uptake mediated by Tfr1 is required for the differentiation of HSPC, particularly in mid-gestation.
Methods
All animal experiments were approved by the Institutional Animal Care and Use Committee of Zhejiang University. Tfr1fl/fl mice on the C57BL6/J background were obtained from Dr. Ying Shen.17 To generate HSC-specific Tfr1 knockout mice (Tfr1fl/fl;Vav-Cre, referred to hereafter as cKO mice), we crossed female Tfr1fl/fl mice with male Tfr1fl/wt;Vav-Cre transgenic mice; the Vav-Cre line we used was B6.Cg-Commd10Tg(Vav1-icre)A2Kio, the Vav-Cre transgene is expressed mainly in hematopoietic cells.18 Hematological parameters, blood smears, embryo dissection and single-cell isolation, flow cytometric analysis, evaluation of intracellular iron status, iron parameters, colony formation assays, and transplantation assays are described in the Online Supplementary Materials and Methods. Except where indicated otherwise, all summary data are presented as the mean ± standard deviation. The Student’s t-test was used to compare two groups, multiple groups were subjected to analysis of variance (ANOVA) with Bonferroni post hoc test comparison, and the log-rank (Mantel-Cox) test for survival curve analysis (GraphPad version 7). P-values <0.05 were considered statistically significant.
Results
Trf1 is expressed at higher levels in hematopoietic progenitor cells than in HSC and mature cell lineages
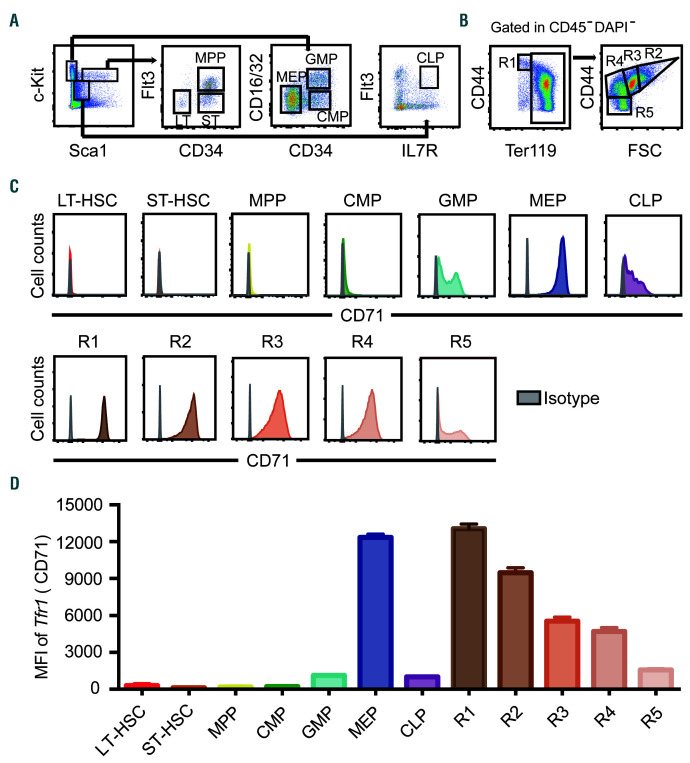
First, we measured Tfr1 expression in mouse FL HSPC and the different stages of erythroid differentiation using multiparametric flow cytometry and the gating strategies shown in Figure 1A-B. As shown in Figure 1C-D, Tfr1 expression was extremely low in Lin−Sca1+cKit+ subsets, virtually undetectable on the surface of long-term HSC, short-term HSC, multipotent progenitors, and common myeloid progenitors. In contrast, Tfr1 expression was relatively high in granulocyte/monocyte progenitors and common lymphoid progenitors, and was highest in megakaryocyte/erythrocyte progenitors. In erythroid lineage, Tfr1 expression was high in pro-erythroblast, and gradually decreased with the differentiation of erythroblast. These findings at the protein level were generally consistent with RNA sequencing data (Online Supplementary Figure S1) that we extracted from previous studies.19,20 In addition, Tfr1 expression was higher in progenitors/precursors (early T-cell progenitors, progenitor B cells, and granulocyte monocyte progenitors) compared to their mature counterparts (T cells, B cells, NK cells, granulocytes, and monocytes) (Online Supplementary Figure S1), suggesting that Tfr1 may play a more important role in the progenitor/precursor stages than in stem cells.
Figure 1.
Tfr1 expression in hematopoietic stem/progenitor cells. (A) Representative gating strategy for analyzing long-term hematopoietic stem cells (HSC) (LT-HSC, Lin−cKit+Sca1hiCD34−Flt3−), short-term HSC (ST-HSC, Lin−cKit+Sca1hiCD34+Flt3−), multipotent progenitor (MPP, Lin−cKit+Sca1hiCD34+ Flt3+) cells, common myeloid progenitor (CMP, Lin−cKit+Sca1-CD34+ CD16/32int) cells, granulocyte-macrophage progenitor (GMP, Lin-cKit+Sca1-CD34+CD16/32hi) cells, megakaryocyte-erythroid progenitor (MEP, Lin−cKit+Sca1-CD34−CD16/32lo) cells, and common lymphoid progenitor (CLP, Lin−cKitintSca1intIL-7R+Flt3+) cells. (B) Erythrocytes gating strategy was used based on the expression levels of Ter119 and CD44: R1, proerythroblasts (Ter119loCD44hi); R2, early basophilic erythroblasts (CD44hiFSChi); R3, polychromatophilic erythroblasts (CD44hiFSCmed); R4, orthochromatophilic erythroblasts (CD44medFSCmed); and R5, mature erythrocytes (CD44loFSClo). (C) Flow cytometric analysis of Tfr1 expression in HSPC and erythroblasts in fetal liver of E16.5 mouse embryos. Grey histogram: isotype control (Rat IgG2a, k-PE). (D) Quantification of the flow cytometry data in C, showing the mean fluorescence intensity (MFI) of Tfr1 in the indicated hematopoietic stem/progenitor cells (HSPC) and erythroblasts.
HSC-specific loss of Tfr1 causes early postnatal lethality
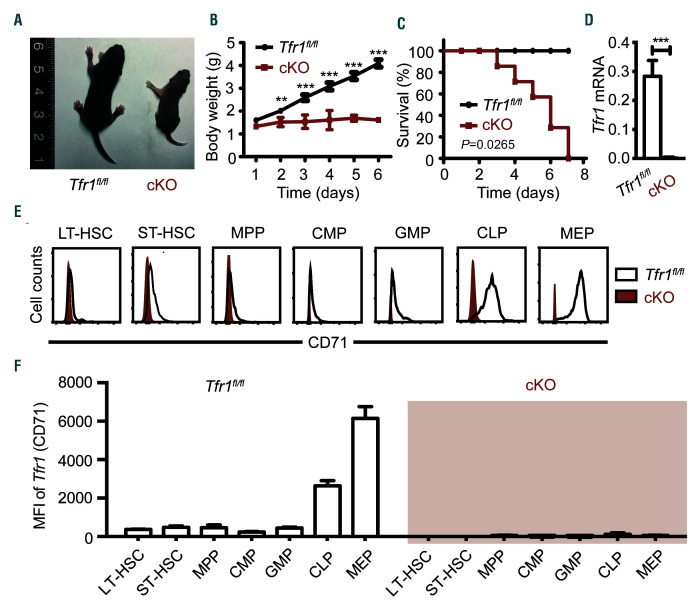
To examine further the role of Tfr1 in hematopoiesis, we generated HSC-specific Tfr1 cKO mice. The cKO offspring were born at the expected Mendelian ratio but smaller and paler than control (Tfr1fl/fl) littermates (Figure 2A). Importantly, although cKO pups were born at the expected Mendelian ratio, homozygous cKO pups failed to thrive and died by postnatal day 7 (P7), whereas both heterozygous and control littermates grew normally (Figure 2B-C). We confirmed the knockout efficiency in both mRNA and protein level. Tfr1 mRNA was virtually non-detectable in the BM of cKO mice (Figure 2D) and Trf1 (CD71) expression in cKO HSPC significantly decreased compared to control littermates by flow cytometry analysis (Figure 2E-F).
Figure 2.
Loss of Tfr1 in hematopoietic stem cells results in early postnatal lethality. (A) Representative images of a control (Tfr1fl/fl) and a Trf1 conditional knockout (cKO) mouse at P6. (B) Body weight of control and cKO mice at the indicated days after birth (n=4 for each group). (C) Kaplan–Meier survival curve for control and cKO mice (n=7 for each group). (D) Tfr1 mRNA was measured in bone marrow cells obtained from control and cKO mice (n=3 for each group). (E) Flow cytometric analysis of Tfr1 expression in hematopoietic stem/progenitor cells (HSPC) in fetal liver of E14.5 mouse embryos. Open histogram: Tfr1fl/fl control; red histogram: cKO. (F) Quantification of the flow cytometry data in (D). The mean fluorescence intensity (MFI) of Tfr1 in the indicated HSPC. **P<0.01; ***P<0.001.
Tfr1-deficient HSC have multiple lineage defects in hematopoiesis
A possible explanation for the early postnatal mortality and paleness of the cKO mice is that the Tfr1-deficient HSC may perturb erythropoiesis. To test this possibility, we examined various hematopoietic organs. In peripheral blood, cKO mice had significantly fewer red blood cells, fragmented and irregularly shaped (Online Supplementary Figure S2), as well as reduced erythrocyte mean corpuscular volume (MCV), mean corpuscular hemoglobin (MCH), mean corpuscular hemoglobin concentration (MCHC), and hemoglobin concentration (Online Supplementary Table S1) compared to control, indicating that cKO mice had microcytic hypochromic anemia. In addition, cKO pups had reduced numbers of white blood cells and reticulocytes, and increased numbers of platelets (Online Supplementary Table S1).
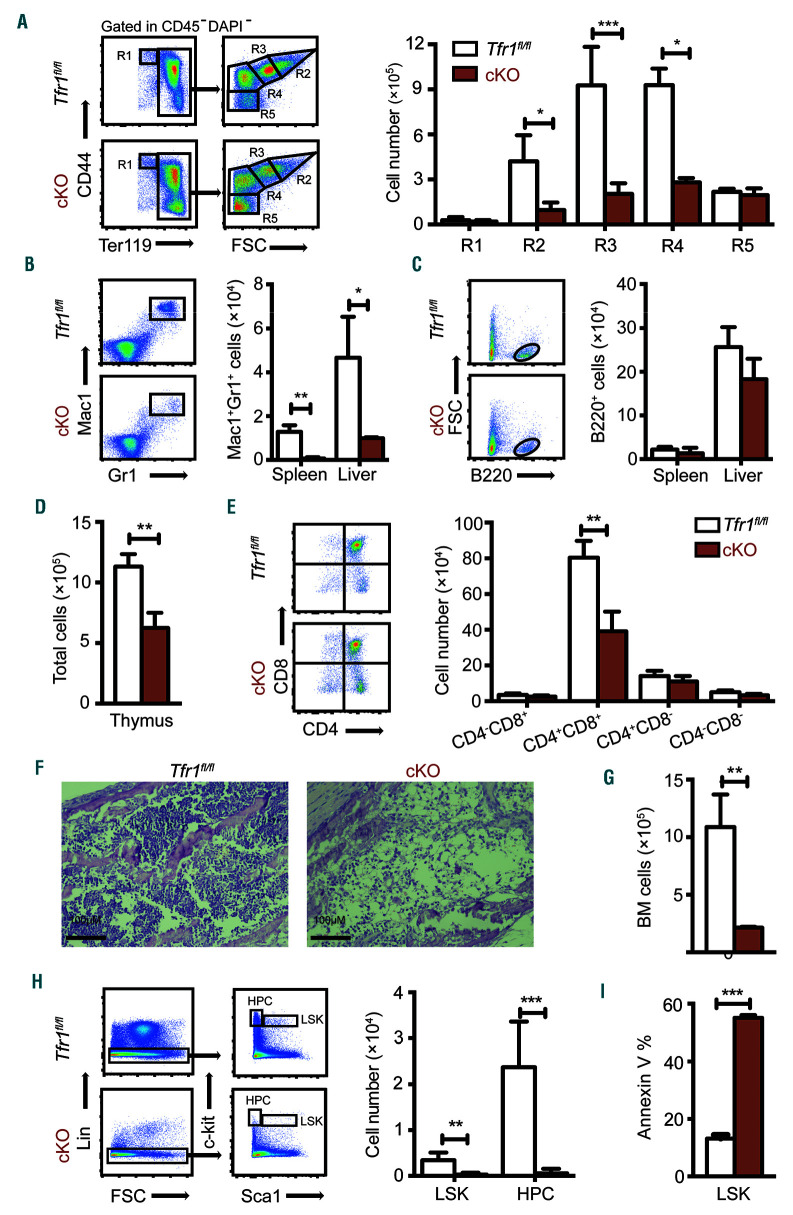
To examine the role of Tfr1 in the development of proerythroblasts into mature red blood cells, we performed flow cytometry using the markers Ter119 and CD44.21,22 The number of early basophilic erythroblasts (R2), polychromatophilic erythroblasts (R3), and orthochromatophilic erythroblasts (R4) decreased significantly in cKO mice compared to controls (Figure 3A). In addition, orthochromatophilic erythroblasts (R4) and mature erythrocytes (R5) decreased significantly in the spleen of cKO mice (Online Supplementary Figure S3A). These data indicate that erythrocyte development is severely blocked in the early stages in the absence of Tfr1. Moreover, cKO mice had fewer Mac1+Gr1+ (mature macrophage/granulocyte) cells in the spleen and liver compared to control littermates (Figure 3B); in contrast, the number of B220+ cells in the liver and spleen was similar between cKO and control mice (Figure 3C). We also found significantly fewer cells in the thymus of cKO mice (Figure 3D), particularly CD4+CD8+ T cells (Figure 3E). Taken together, these results indicate that Tfr1 is required for the generation of T cells, macrophages, granulocytes, and erythrocytes, but is not required for the production of B cells or platelets.
Figure 3.
Neonatal Tfr1 conditional knockout mice have defects in multiple cell lineages. (A) Gating strategy (left panel) and the absolute number of erythrocytes (right panel) at the indicated differentiation stages measured in the bone marrow of control and Tfr1 knockout (cKO) mice at P3 (n=4 per group). (B, C) Gating strategy (left panel) and absolute numbers (right panel) of Mac1+Gr1+ myeloid cells (B) and B220+ B cells (C) in the spleen and liver of control and cKO mice (n=4 for each group). (D) Total number of cells in the thymus. (E) Cells were gated according to CD4 and CD8 expression (left panel), and the absolute cell numbers are shown at the right. (F) H&E-stained bone marrow sections obtained from a control and cKO mouse at P3. (G) Total number of cells in the bone marrow of control and cKO mice at P3 (n=4 for each group). (H) Absolute numbers of LSK (Lin-cKit+Sca1hi) and hematopoietc progenitor cells (HPC)(Lin-cKit+Sca1−) cells in the bone marrow of control and cKO mice at P3 (n = 4 for each group). (I) Percentage of Annexin V−positive LSK cells in control and cKO mice (n=4 for each group). *P<0.05; **P<0.01; ***P<0.001.
Loss of Tfr1 impairs hematopoiesis in the BM
During late embryogenesis, HSC populate the BM, providing stem cells and progenitor cells for all blood cell lin eages; thus, during postnatal development the BM becomes the primary site of hematopoiesis.23 Hematoxylin and eosin staining revealed significantly fewer cells in cKO BM compared to control littermates (Figure 3F-G). Specifically, hematopoietic stem cells (LSK, Lin−Sca1+cKit+) and hematopoietic progenitor cells (HPC, Lin−Sca1−c-Kit+) were extremely rare in the BM of cKO pups (Figure 3H and Online Supplementary Figure S3B). The reduced number of LSK cells in the BM of cKO mice was accompanied by a significant increase of apoptotic cells (Figure 3I). Thus, Tfr1 plays a critical role in hematopoiesis in the BM and is required for the survival of HSC in the BM of postnatal mice.
Loss of Tfr1 in HSC causes impaired development of various cell lineages in the FL
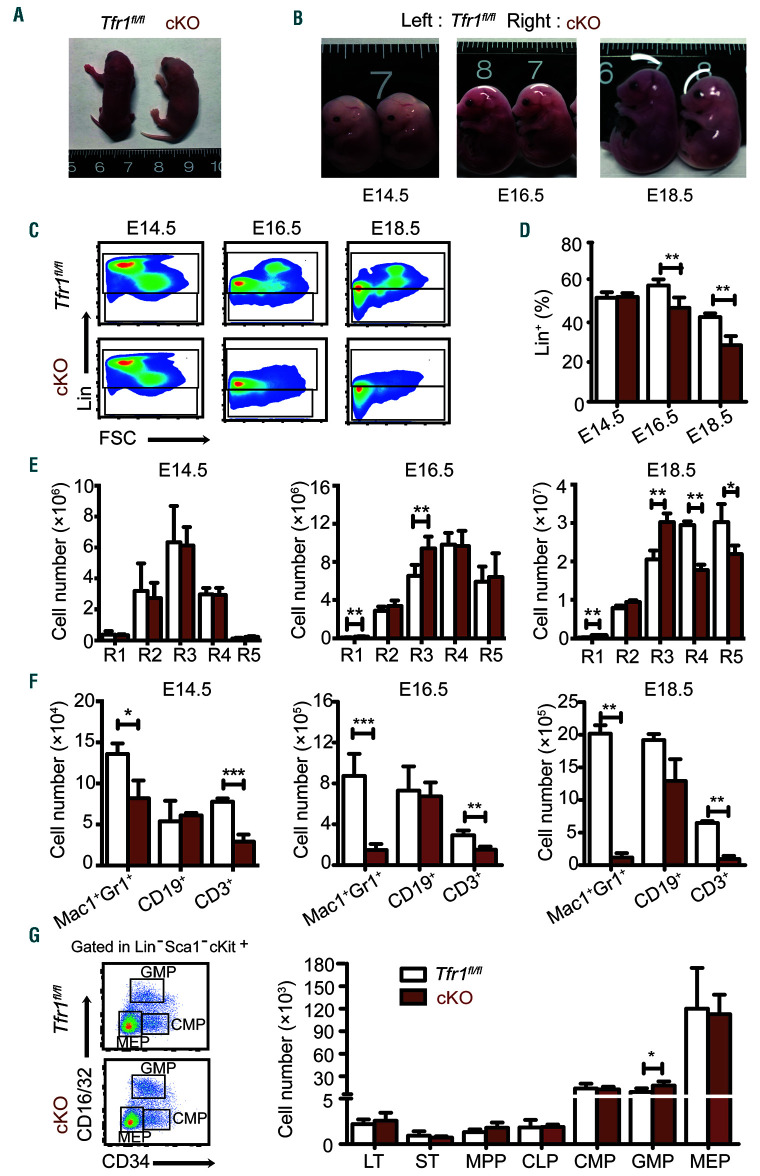
Our finding that cKO pup were anemic at birth (Figure 4A) suggests that hematopoiesis is impaired in prenatal development. Moreover, definitive hematopoiesis involves the colonization of the FL, thymus, spleen, and ultimately the BM.5,6 Therefore, we harvested FL cells from cKO and control embryos at E14.5, E16.5, and E18.5 and performed hematopoietic phenotyping using multi-color flow cytometry. Our analysis revealed no difference between cKO and control embryos at E14.5. However, during later stages of development, the cKO embryos became progressively smaller and paler than control siblings (Figure 4B). The most prominent difference was a significant decrease in lineage-positive (Lin+) cells beginning at E16.5 and becoming much more pronounced by E18.5 (Figure 4C-D), indicating that some cell lineages were severely impaired.
Figure 4.
Loss of Tfr1 in hematopoietic stem cells causes progressively impaired cellular maturation in fetal liver. (A) Representative images of a control and Tfr1 knockout (cKO) embryo at P1. (B) Representative images of control and cKO embryos at E14.5, E16.5, and E18.5. (C) Representative flow cytometric profiles of Lin+ and Lin-cell populations in the liver of control and cKO embryos at E14.5, E16.5, and E18.5. (D) Percentage of Lin+ cells in the liver of control and cKO embryos at E14.5, E16.5, and E18.5 (n=5 per group). (E) Absolute numbers of the indicated erythrocyte development stages in the liver of control and cKO embryos at E14.5, E16.5, and E18.5 (n=5 per group). (F) Absolute number of myeloid cells (Mac1+Gr1+), B cells (CD19+), and T cells (CD3+) in the liver of control and cKO embryos at E14.5, E16.5, and E18.5 (n=5 per group). (G) Hematopoietic progenitor cells (HPC) were gated for fetal liver cells in control and cKO embryos using flow cytometry (left panel). The bar graph (right panel) shows the absolute numbers of LT, ST, MPP, CLP, CMP, GMP, and MEP cells in control and cKO fetal liver cells at E16.5 (n = 5 for each group); note the break in the y-axis. LT: long-term HSC; ST: short-term HSC; MPP: multipotent progenitor cells; CLP: common lymphoid progenitor cells; CMP: common myeloid progenitor cells; GMP: granulocyte/monocyte progenitor cells; MEP: megakaryocyte/erythrocyte progenitor cells. *P<0.05; **P<0.01; ***P<0.001.
To examine this effect in further detail, we measured the development of erythroid, myeloid, and lymphoid cells in FL. With respect to erythropoiesis, we found no effect at E14.5. In contrast, R1 and R3 increased at both E16.5 and E18.5, and R4 and R5 significantly reduced at E18.5 (Figure 4E); thus, progressive erythropenia in cKO embryos occurs after E14.5. With respect to myelopoiesis and lymphogenesis, we found reduced numbers of both Mac1+Gr1+ granulocytes and CD3+ T cells in the cKO embryos beginning at E14.5, whereas the number of CD19+ B cells was similar between cKO and control embryos (Figure 4F). These results indicate that the loss of Tfr1 in HSC causes impaired development of myeloid cells, erythrocytes, and T cells but spares B-cell development in the FL, consistent with our results obtained in neonatal mice.
Given the inability of cKO mice to produce several mature cell lineages, we examined HSPC in the FL of cKO and control embryos at E16.5, the gestational stage in which Lin+ cells dramatically decreased. Interestingly, we found no difference between cKO and control embryos, with the exception of a slight albeit significant increase in granulocyte/macrophage progenitors (Figure 4G). These data suggest that in the FL, Tfr1 preferentially functions at the progenitor/precursor stage rather than the HSC stage, consistent with our findings shown in Figure 1 and Online Supplementary Figure S1.
Loss of Tfr1 in HSC causes intracellular iron decrease in hematopoietic cells in postnatal mice
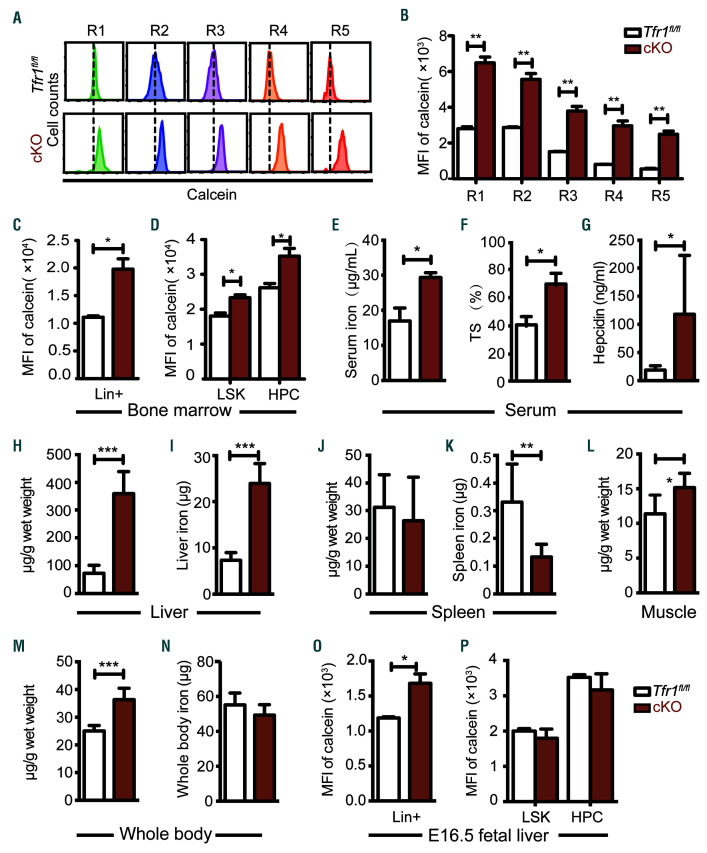
Given that the principal function of Tfr1 is iron uptake through the cell membrane, we reasoned that the loss of Tfr1 might cause cellular iron deficiency, thereby affecting systemic iron levels. Therefore we evaluated intracellular iron concentration in hematopoietic cells by loading BM derived HSPC with the iron-sensitive fluorophore calcein-AM, which is quenched upon binding ferrous iron (Fe2+).24 Intracellular iron was significantly lower in cKO erythrocytes compared to control cells at all five stages (Figure 5A-B). In addition, intracellular iron was lower in cKO Lin+ mature cells (Figure 5C), as well as LSK and HPC cells (Figure 5D), compared to their respective controls.
Figure 5.
Postnatal Tfr1 conditional knockout mice have dysregulated cellular iron homeostasis. (A) Flow cytometric analysis of calcein fluorescence was measured in the indicated stages of erythroid differentiation. (B) Relative mean fluorescence intensity (MFI) of calcein in figure 5A (n=4 per group). (C-D) Relative mean fluorescence intensity (MFI) of calcein measured in mature hematopoietic (Lin+) cells (C) and LSK and hematopoietic progenitor cells (HPC) cells (D) obtained from control and Tfr1 knockout (cKO) bone marrow (n=4 per group). (E) Serum iron concentration, (F) transferrin saturation, and (G) serum hepcidin. (H-I) Liver non-heme iron, (J-K) spleen non-heme iron, (L) muscle non-heme iron, and (M-N) whole body non-heme iron were measured in control and cKO pups at P3 (n=5 per group). (O-P) Relative mean fluorescence intensity (MFI) of calcein measured in Lin+ cells (O), LSK (Lin-cKit+Sca1hi) and HPC (Lin−cKit+Sca1−) cells (P) obtained from control and cKO livers at E16.5 (n = 4 for each group). *P<0.05; **P<0.01; ***P<0.001.
Next, we measured systematic iron levels and found that cKO pups have higher levels of serum iron (Figure 5E), transferrin saturation (Figure 5F), and serum hepcidin (Figure 5G). Considering smaller sizes of the livers and spleens in cKO pups compared to the controls (Online Supplementary Figure S4A-B), we found that liver non-heme iron was significantly higher than control measured either in mg/g wet weight or absolute amount of iron (Figure 5H-I). In contrast, splenic non-heme iron levels of cKO in μg/g wet weight didn’t change (Figure 5J), whereas the absolute amount of iron decreased (Figure 5K). In the muscle of cKO pups, non-heme iron (μg/g wet weight) increased (Figure 5L). In addition, whole body non-heme iron levels (μg/g wet weight) in cKO pups were significantly increased (Figure 5M), whereas the absolute amount of body iron (μg) remained unchanged (Figure 5N). Taken together, these data suggest that hematopoietic Tfr1 deficiency significantly impaired iron uptake of hematopoietic cells, in turn led to iron redistribution to other organs (e.g. serum, liver and muscle).
Loss of Tfr1 in HSC affects iron homeostasis in mature cells but not HSPC in the FL
Next, we investigated whether Tfr1 affects iron homeostasis differently between prenatal and postnatal stages of development. Intracellular iron levels were lower in cKO Lin+ cells at E16.5 (Figure 5O), which is consistent with decreased numbers of mature cells. Interestingly, intracellular iron levels and ferritin protein levels (Online Supplementary Figure S5A) in both LSK and HPC cells were similar between cKO and control embryos at E16.5 (Figure 5P), indicating that loss of Tfr1 does not affect intracellular iron in HSPC during prenatal development. Meanwhile, we found no difference between cKO and control HPC cells with respect to the mRNA levels of various membrane iron transporters and Alas2, catalyzing the rate-limiting step of heme biosynthesis in erythroid cells (Online Supplementary Figure S5B). Therefore, we hypothesized that hematopoietic Tfr1 is required for differentiation into lineages in which iron plays an essential role. In addition, we quantified expression levels of critical transcription factors required for cell fate determination of HSC.1 We found significant decreases of a subset of transcription factors involved in the development and differentiation of HPC, including Gli1, C/EBPa, Fli, PU.1, Gata2, Notch1, and Gata3 (Online Supplementary Figure S5C).
Loss of Tfr1 in HSC impairs the regeneration capacity of HSPC
The maintenance and survival of HSPC requires an interplay between these cells and their niche within the BM.25 Therefore, we speculated whether loss of Tfr1 in cKO HSPC disrupts this niche, leading to a feedback loop that impairs hematopoiesis. To test this possibility, we performed a transplantation assay to measure the regenerative capacity of HSPC in recipient BM. We used FL cells obtained from E14.5 embryos, as cells at this stage were only mildly affected in the cKO mice.
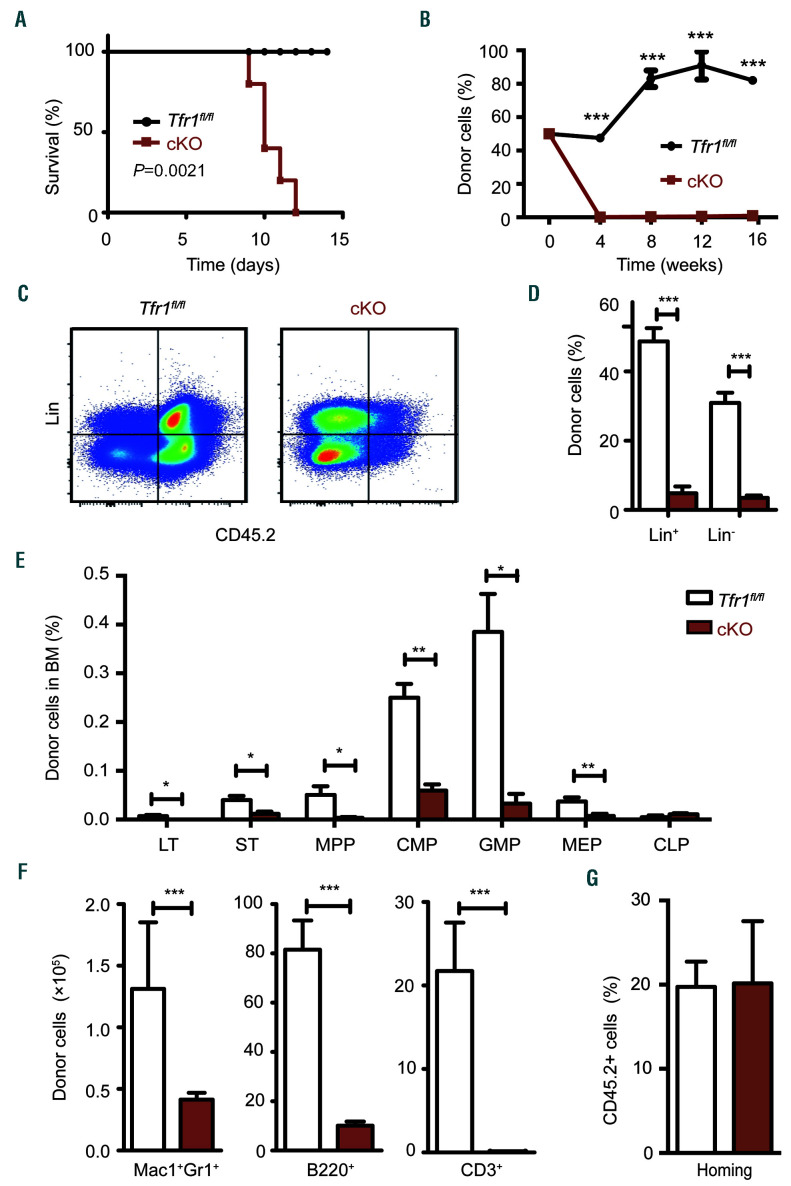
To determine their short-term regenerative capacity, FL cells were isolated from cKO and control mice expressing the alloantigen CD45.2 and injected into the tail vein in lethally irradiated CD45.1 recipient mice. We found that recipient mice that received control cells had 100% survival, whereas mice that received cKO cells all died within 12 days of transplantation (Figure 6A). Next, we performed competitive BM transplants in order to assess the long-term regenerative capacity and found that recipient mice that received 50% cKO cells and 50% CD45.1 competitor cells had virtually no donor-derived cKO cells in their peripheral blood by four weeks post-transplantation (Figure 6B). In addition, virtually no contribution of cKO HSPC or committed cell lineages in the recipient mice was measured 16 weeks after transplantation (Figure 6C-E). Finally, we found virtually no contribution of cKO HSPC to myeloid cells, B cells in the spleen, or T cells in the thymus of the recipient mice (Figure 6F). These results indicate that Tfr1 is required for both the short-term and long-term regeneration of FL cells.
Figure 6.
Tfr1 knockout hemtopoi-etic stem cells have impaired capacity for restoring hematopoiesis following transplantation. (A) Kaplan–Meier survival curve of CD45.1 mice that were lethally irradiated and then transplanted with fetal liver cells obtained from CD45.2 control or Tfr1 knockout (cKO) embryos (n=5 recipients per group). (B) Recipient mice received a 50/50 combination of the indicated donor-derived fetal liver (CD45.2) cells and competitor (CD45.1) cells were measured at the indicated time points following transplantation (n=3 recipients per group). (C) Donor-derived (CD45.2+) lineage-negative cells (Lin−) and mature hematopoietic cells (Lin+) were gated by flow cytometry. (D) The percentage of donor-derived Lin− and Lin+ cells in the recipient bone marrow cells after transplantation for 16 weeks. (E) The absolute number of donor-derived LT (long-term HSC), ST (short-term HSC), MPP (multipotent progenitor cells), CMP (common myeloid progenitor cells), GMP (granulocyte/monocyte progenitor cells), MEP (megakaryocyte/erythrocyte progenitor cells), and CLP (common lymphoid progenitor cells) were measured 16 weeks after co-transplantation with control and cKO donor cells (n=3 for each group). (F) The absolute number of donor-derived myeloid cells (Mac1+Gr1+) and B cells (B220+) in the spleen, and T cells (CD3+) in the thymus of recipient mice 16 weeks after co-transplantation with control and cKO cells (n=3 for each group). (G) Homing efficiency of fetal liver cells obtained from either control or cKO mice 40 hours after transplantation into lethally irradiated recipient mice (n=3 per group). *P<0.05; **P<0.01; ***P<0.001.
Upon transplantation, HSPC migrate to the recipient’s BM, where they home to their proper niche. When we analyzed BM cells in lethally irradiated CD45.1 recipient mice 40 hours after transplanted with CD45.2 cKO or control FL cells, no difference was found (Figure 6G), indicating that the homing process is not impaired in cKO FL cells. Taken together, these results suggest that the reduced regenerative capacity in Tfr1-deficient HSPC is due to a cell-autonomous mechanism.
Hemin treatment rescues the proliferation and differentiation defects in Tfr1-deficient HSPC
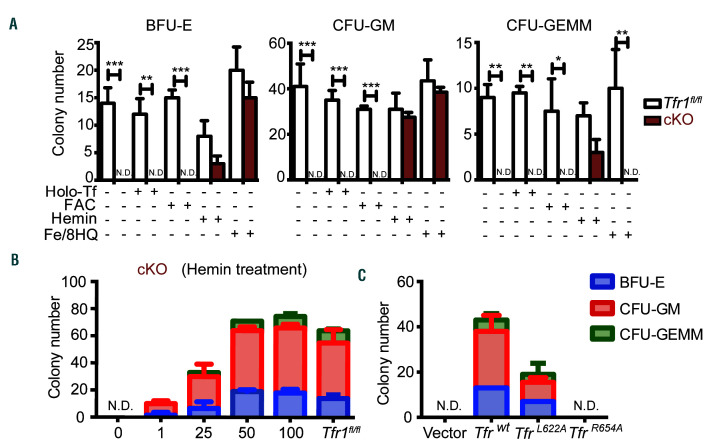
The results described above indicate that the composition of cKO HSPC is normal in the early stages of embryonic development. Thus, other modes of iron delivery might be presented in order to support the demand of FL HSPC for iron. To examine whether an alternative modes of iron deliver is able to bypass the loss of Tfr1 in cKO HSPC, we performed various in vitro rescue experiments using a methylcellulose colony formation assay with FL cells obtained from E14.5 embryos. cKit+ cells were sorted and then cultured in a methylcellulose medium containing IL-6, IL-3, stem cell factor, and erythropoietin. We found that colony-forming units (CFU) were formed by control cells, whereas cKO cells failed to develop any of these CFU (Figure 7A). These results are consistent with our in vivo data and suggest that the differentiation of both myeloid and erythrocyte cell lineages are blocked in cKO mice.
Figure 7.
Treating Tfr1 knockout hematopoietic stem/progenitor cells with hemin restores their differentiation capacity. (A) In vivo colony assays were performed using hematopoietic stem/progenitor cells (HSPC) obtained from control and Tfr1 knockout (cKO) embryos at E14.5 (n=3 for each group) and treated with or without 5 μM holo-transferrin (holo-Tf), 10 μM ferric ammonium citrate (FAC), 10 μM hemin, or 0.25 μM Fe (III)/8-hydroxyquinoline (Fe/8-HQ). Colonies were measured on day 12, and the number of erythrocyte burst-forming units (BFU-E), granulocyte/macrophage colony-forming units (CFU-GM), and granulocytes, erythrocytes, macrophages, and megakaryocyte colony-forming units (CFU-GEMM) is shown. (B) Number of CFU formed by HSPC of cKO fetal liver treated with the indicated concentrations of hemin, and control cells. (C) Number of CFU formed by HSPC infected with the indicated Tfr1-expressing lentivirus. N.D.: not detectable. *P<0.05; **P<0.01; ***P<0.001.
Next, we treated the cells with 5 μM holo-transferrin (holo-Tf), 10 mM ferric ammonium citrate (FAC), 10 μM hemin, or 0.25 mM Fe (III)/8-hydroxyquinoline (Fe/8-HQ), a highly membrane-permeable complex that delivers iron directly into the cells,26 thereby bypassing Tfr1. Interestingly, at these concentrations of both hemin and Fe/8-HQ partially rescued the colony-forming capacity of cKO cells, whereas holo-Tf and FAC had no effect (Figure 7A). The effect of hemin on the colony-forming capacity was concentration-dependent, and 50 mM hemin was sufficient to rescue the colony-forming capacity of cKO cells to control levels (Figure 7B). In contrast, 0.25 mM Fe/8-HQ failed to rescue CFU-GEMM forming capacity of cKO cells, while Fe/8-HQ at a higher dose of 0.5 mM was toxic (data not shown). These results suggest that heme may serve as an alternative iron source other than Tf-iron in order to meet the cellular iron demand in FL HSPC in the absence of Tfr1.
Overexpressing wild-type Tfr1 but not the R654A mutant rescues Tfr1-deficient HSPC
Noncanonical functions of Tfr1 have been reported, including maintaining intestinal epithelial function independent of iron uptake,16 cell survival,27 and regulating mitochondrial morphology.28 Additionally, the missense mutation R654A in Tfr1 prevents Tf binding without affecting the receptor’s ability to bind Hfe protein.29 We therefore expressed either wild-type Tfr1 or mutant Tfr1 in cKO FL cells using lentivirus infection. Expressing wild-type Tfr1 in cKO cells rescued the colony-forming capacity; interestingly, expressing the Tfr1L622A mutant (which lacks the ability to bind Hfe) partially rescued, whereas expressing the Tfr1R654A mutant was completely unable to rescue the impaired colony-forming capacity of cKO cells (Figure 7C). These results suggest that its function in iron uptake rather than signal transduction is the sole mechanism by which Tfr1 controls differentiation and survival in the hematopoietic system.
Discussion
Tfr1 has long been used as a marker of red blood cells and is believed to play an essential role in erythropoiesis; however, its role in HSPC is poorly understood. Here, we generated and characterized a mouse model in which Tfr1 expression was deleted specifically in HSC and observed profoundly impaired BM function and defects in multiple cell lineages. These defects, which cause cKO offspring to die within one week of age, indicate that Tfr1 plays an essential role in hematopoiesis.
Specifically, our HSC-specific Tfr1-deficient mouse model allowed us to systematically dissect the role of Tfr1 in the development of erythrocytes, granulocytes, thrombocytes, and lymphocytes. Our findings of microcytic hypochromic anemia in neonatal cKO pups and progressive erythropenia in FL of cKO embryos reveal that Tfr1 is required for erythropoiesis at an early stage, as loss of Tfr1 primarily blocked the differentiation of erythroblast precursors (e.g. proerythroblasts, polychromatophilic erythroblasts), leading to decreased mature erythrocytes. In addition, although T-cell development was severely impaired in cKO mice, B-cell development was largely unaffected. These findings are supported by previous experiments showing that developing T cells derived from Tfr1-/- ES cells arrested in an early stage, whereas B-cell development was affected less severely.14 Moreover, a recent study by Wang et al. found that Tfr1fl/fl;Cd4-Cre mice develop normally, but have reduced production of pro-inflammatory cytokines.30 Although the production of B cells was generally unaffected in our cKO mice, antibody production was likely affected given that patients with a mutation in the TFR1 gene have severe hypogammaglobulinemia.15 Importantly, we found that monocyte development is severely blocked in embryonic development in cKO mice, providing the first direct evidence that Tfr1 plays an important role in monocyte development, which is consistent with studies demonstrating the role of Tfr1 in monocytes.31–33
A wide range of peripheral blood cell types were decreased in cKO mouse, while the number of platelets was increased. On one hand, iron deficiency anemia has been shown to cause reactive thrombocytosis in both patients34 and animal models,35 and iron deficiency itself can promote megakaryopoiesis.36 On the other hand, megakaryocytes are reported to arise directly from stem-like megakaryocyte-committed progenitor cells, a population that shares many features with multipotent HSC and serves as a megakaryocyte lineage-restricted emergency pool,37 these progenitor cells might escape the impaired proliferation that affects other cell types.
Although, Tfr1fl/fl;Vav-Cre mice have concomitant deletion of Tfr1 in hematopoietic and endothelial cells, it remains elusive with respect to the effect of endothelial Tfr1 on systemic iron regulation. Most recently, Canali et al. and Koch et al. independently reported that liver sinusoidal endothelial cells (LSEC) are the major source of bone morphogenetic proteins (BMP), which are essential to the hepcidin expression.38,39 Specifically, it is suggested that downregulation of liver hepcidin expression could be attributed to iron overload resulted from depletion of Bmp2 or Bmp6 in LSEC. On the contrary, our Tfr1fl/fl;Vav-Cre mice had increased levels of liver and serum hepcidin. Interestingly, Stat5a/bf/f;TC (Tie2-Cre driven Stat5a/b gene deletion in HSC and endothelial cells) mutant mice displayed a 50% reduction of Tfr1 mRNA and protein expression, higher liver and serum iron levels, and elevated transferrin saturation,40 which phenotypes are similar to those observed in our Tfr1fl/fl;Vav-Cre mice. Therefore, it is possible that serum iron and organ iron could be attributed to concomitant deletion of Tfr1 in both hematopoietic and endothelial cells.
Interestingly, we found that iron storage is similar between cKO embryos and control embryos, indicating that the maternal transfer of iron is unaffected by the loss of Tfr1 in the embryo’s HSC. Previous studies showed that neonatal iron status is significantly correlated with three placental heme iron transporters41 and that newborn absorb a significantly higher fraction of heme iron compared to non-heme iron.42 In this respect, it is interesting to note that our in vitro colony-forming assay revealed that heme may serve as an alternative source of iron during early embryonic development.
Given that intracellular iron homeostasis is controlled by a complex molecular network, it is possible that transporters of non-transferrin bound iron43–46 may also play a role in hematopoiesis. Several studies revealed compelling evidence of other iron transporters in hematopoiesis. For example, the putative heme transporter FLVCR (group C feline leukemia virus receptor) did not appear to be essential for HSC function.47 Slc39a14-/- mice had no effect on hematological parameters,48 either. In addition, Slc11a2-/-mice only showed impaired erythropoiesis.49 While, Tfr2-deficient mice had an increased red blood cell count and terminal erythropoiesis in the BM.50 In general, none of the aforementioned knockout mouse models present with hematopoietic impairments as severe as our HSC-specific Tfr1-deficient mice. Thus, although other currently unknown transporters and/or other modes of iron delivery may play a role in iron uptake in HSPC, Tfr1 is clearly the predominant pathways for iron uptake, particularly in the downstream differentiation of progenitor cells.
In addition to its central role in facilitating cellular iron uptake, Tfr1 also appears to play a role in signal transduction in intestinal homeostasis.16 We found that overexpressing of wild-type Tfr1 but not the R654A mutant rescued both differentiation and proliferation. Interestingly, the L622A mutant only partially rescued the defects in cKO cells, possibly because Tfr1-Hfe may also regulate hematopoiesis. These results indicate that iron uptake but not signal transduction is the main mechanism by which Tfr1 promotes the differentiation and survival of hematopoietic cells.
In conclusion, we provide direct in vivo evidence that Tfr1 plays an essential role in hematopoiesis. In particular, we show that Tfr1 is required for the differentiation of HSPC into a range of mature cell types. Importantly, our results indicate that iron uptake appears to be the principal mechanism by which Tfr1 mediates the differentiation and survival of hematopoietic cells, thereby underscoring the important role that intracellular iron homeostasis plays in hematopoiesis.
Acknowledgments
The authors would like to thank the grants from the National Natural Science Foundation of China (31930057 and 31530034 to FW, 31570791 and 91542205 to JM, and 31701034 to QW) and the National Key R&D Program of China (2018YFA0507802 to FW and 2018YFA0507801 to JM). The authors thank the members of the Wang and Min laboratory for helpful discussions.
Footnotes
Check the online version for the most updated information on this article, online supplements, and information on authorship & disclosures: www.haematologica.org/content/105/8/2071
References
- 1.Orkin SH, Zon LI. Hematopoiesis: an evolving paradigm for stem cell biology. Cell. 2008;132(4):631–644. [DOI] [PMC free article] [PubMed] [Google Scholar]
- 2.Doulatov S, Notta F, Laurenti E, Dick JE. Hematopoiesis: a human perspective. Cell Stem Cell. 2012;10(2):120–136. [DOI] [PubMed] [Google Scholar]
- 3.Copley MR, Beer PA, Eaves CJ. Hematopoietic stem cell heterogeneity takes center stage. Cell Stem Cell. 2012; 10(6):690–697. [DOI] [PubMed] [Google Scholar]
- 4.Wilson A, Laurenti E, Oser G, et al. Hematopoietic stem cells reversibly switch from dormancy to self-renewal during homeostasis and repair. Cell. 2008; 135(6): 1118–1129. [DOI] [PubMed] [Google Scholar]
- 5.Dzierzak E, Speck NA. Of lineage and legacy: the development of mammalian hematopoietic stem cells. Nat Immunol. 2008;9(2):129–136. [DOI] [PMC free article] [PubMed] [Google Scholar]
- 6.Medvinsky A, Rybtsov S, Taoudi S. Embryonic origin of the adult hematopoietic system: advances and questions. Development. 2011;138(6):1017–1031. [DOI] [PubMed] [Google Scholar]
- 7.Rossi DJ, Jamieson CH, Weissman IL. Stems cells and the pathways to aging and cancer. Cell. 2008;132(4):681–696. [DOI] [PubMed] [Google Scholar]
- 8.Bacon BR, Adams PC, Kowdley KV, et al. Diagnosis and management of hemochromatosis: practice guideline by the American Association for the Study of Liver Diseases. Hepatology. 2011;54(1):328–343. [DOI] [PMC free article] [PubMed] [Google Scholar]
- 9.Camaschella C. Iron-deficiency anemia. N Engl J Med. 2015;372(5):485–486. [DOI] [PubMed] [Google Scholar]
- 10.Hentze MW, Muckenthaler MU, Andrews NC. Balancing acts: Molecular control of mammalian iron metabolism. Cell. 2004; 117(3):285–297. [DOI] [PubMed] [Google Scholar]
- 11.Gammella E, Buratti P, Cairo G, Recalcati S. The transferrin receptor: the cellular iron gate. Metallomics. 2017;9(10):1367–1375. [DOI] [PubMed] [Google Scholar]
- 12.Papanikolaou G, Pantopoulos K. Systemic iron homeostasis and erythropoiesis. IUBMB Life. 2017;69(6):399–413. [DOI] [PubMed] [Google Scholar]
- 13.Levy JE, Jin O, Fujiwara Y, Kuo F, Andrews NC. Transferrin receptor is necessary for development of erythrocytes and the nervous system. Nat Genet. 1999;21(4):396–399. [DOI] [PubMed] [Google Scholar]
- 14.Ned RM, Swat W, Andrews NC. Transferrin receptor 1 is differentially required in lymphocyte development. Blood. 2003;102(10): 3711–3718. [DOI] [PubMed] [Google Scholar]
- 15.Jabara HH, Boyden SE, Chou J, et al. A missense mutation in TFRC, encoding transferrin receptor 1, causes combined immunodeficiency. Nat Genet. 2016;48(1):74–78. [DOI] [PMC free article] [PubMed] [Google Scholar]
- 16.Chen AC, Donovan A, Ned-Sykes R, Andrews NC. Noncanonical role of transferrin receptor 1 is essential for intestinal homeostasis. Proc Natl Acad Sci U S A. 2015;112(37):11714–11719. [DOI] [PMC free article] [PubMed] [Google Scholar]
- 17.Zhou JH, Wang XT, Zhou L, et al. Ablation of TFR1 in Purkinje cells inhibits mGlu1 trafficking and impairs motor coordination, but not autistic-like behaviors. J Neurosci. 2017; 37(47):11335–11352. [DOI] [PMC free article] [PubMed] [Google Scholar]
- 18.Chen MJ, Yokomizo T, Zeigler BM, Dzierzak E, Speck NA. Runx1 is required for the endothelial to haematopoietic cell transition but not thereafter. Nature. 2009; 457(7231):887–891. [DOI] [PMC free article] [PubMed] [Google Scholar]
- 19.Bagger FO, Sasivarevic D, Sohi SH, et al. BloodSpot: a database of gene expression profiles and transcriptional programs for healthy and malignant haematopoiesis. Nucleic Acids Res. 2016;44(D1):D917–D924. [DOI] [PMC free article] [PubMed] [Google Scholar]
- 20.Lara-Astiaso D, Weiner A, Lorenzo-Vivas E, et al. Immunogenetics. Chromatin state dynamics during blood formation. Science. 2014;345(6199):943–949. [DOI] [PMC free article] [PubMed] [Google Scholar]
- 21.Chen K, Liu J, Heck S, et al. Resolving the distinct stages in erythroid differentiation based on dynamic changes in membrane protein expression during erythropoiesis. Proc Natl Acad Sci U S A. 2009; 106(41):17413–17418. [DOI] [PMC free article] [PubMed] [Google Scholar]
- 22.Liu J, Zhang J, Ginzburg Y, et al. Quantitative analysis of murine terminal erythroid differentiation in vivo: novel method to study normal and disordered erythropoiesis. Blood. 2013;121(8):e43–e49. [DOI] [PMC free article] [PubMed] [Google Scholar]
- 23.Cumano A, Godin I. Ontogeny of the hematopoietic system. Annu Rev Immunol. 2007;25:745–785 [DOI] [PubMed] [Google Scholar]
- 24.Kakhlon O, Cabantchik ZI. The labile iron pool: characterization, measurement, and participation in cellular processes. Free Radic Biol Med. 2002;33(8):1037–1046. [DOI] [PubMed] [Google Scholar]
- 25.Kiel MJ, Morrison SJ. Uncertainty in the niches that maintain haematopoietic stem cells. Nat Rev Immunol. 2008;8(4):290–301. [DOI] [PubMed] [Google Scholar]
- 26.Petrat F, Rauen U, de Groot H. Determination of the chelatable iron pool of isolated rat hepatocytes by digital fluorescence microscopy using the fluorescent probe, phen green SK. Hepatology. 1999; 29(4):1171–1179. [DOI] [PubMed] [Google Scholar]
- 27.Jian J, Yang Q, Huang X. Src regulates Tyr (20) phosphorylation of transferrin receptor-1 and potentiates breast cancer cell survival. J Biol Chem. 2011;286(41):35708–35715. [DOI] [PMC free article] [PubMed] [Google Scholar]
- 28.Senyilmaz D, Virtue S, Xu X, et al. Regulation of mitochondrial morphology and function by stearoylation of TFR1. Nature. 2015;525(7567):124–128. [DOI] [PMC free article] [PubMed] [Google Scholar]
- 29.Schmidt PJ, Toran PT, Giannetti AM, Bjorkman PJ, Andrews NC. The transferrin receptor modulates Hfe-dependent regulation of hepcidin expression. Cell Metab. 2008;7(3):205–214. [DOI] [PMC free article] [PubMed] [Google Scholar]
- 30.Wang Z, Yin W, Zhu L, et al. Iron drives T helper cell pathogenicity by promoting RNA-binding protein PCBP1-mediated proinflammatory cytokine production. Immunity. 2018;49(1):80–92. [DOI] [PubMed] [Google Scholar]
- 31.Ludwiczek S, Aigner E, Theurl I, Weiss G. Cytokine-mediated regulation of iron transport in human monocytic cells. Blood. 2003; 101(10):4148–4154. [DOI] [PubMed] [Google Scholar]
- 32.Kim S, Ponka P. Effects of interferon-gamma and lipopolysaccharide on macrophage iron metabolism are mediated by nitric oxide-induced degradation of iron regulatory protein 2. J Biol Chem. 2000;275(9):6220–6226. [DOI] [PubMed] [Google Scholar]
- 33.Testa U, Kühn L, Petrini M, Quaranta MT, Pelosi E, Peschle C. Differential regulation of iron regulatory element-binding protein(s) in cell extracts of activated lymphocytes versus monocytes-macrophages. J Biol Chem. 1991;266(21):13925–13930. [PubMed] [Google Scholar]
- 34.Voudoukis E, Karmiris K, Oustamanolakis P, et al. Association between thrombocytosis and iron deficiency anemia in inflammatory bowel disease. Eur J Gastroenterol Hepatol. 2013;25(10):1212–1216. [DOI] [PubMed] [Google Scholar]
- 35.Choi SI, Simone JV, Jackson CW. Megakaryocytopoiesis in experimental iron deficiency anemia. Blood. 1974;43(1):111–120. [PubMed] [Google Scholar]
- 36.Evstatiev R, Bukaty A, Jimenez K, et al. Iron deficiency alters megakaryopoiesis and platelet phenotype independent of throm-bopoietin. Am J Hematol. 2014;89(5):524–529. [DOI] [PMC free article] [PubMed] [Google Scholar]
- 37.Haas S, Hansson J, Klimmeck D, et al. Inflammation-induced emergency megakaryopoiesis driven by hematopoietic stem cell-like megakaryocyte progenitors. Cell Stem Cell. 2015; 17(4):422–434. [DOI] [PubMed] [Google Scholar]
- 38.Canali S, Zumbrennen-Bullough KB, Core AB, et al. Endothelial cells produce bone morphogenetic protein 6 required for iron homeostasis in mice. Blood. 2017; 129(4):405–414. [DOI] [PMC free article] [PubMed] [Google Scholar]
- 39.Koch P-S, Olsavszky V, Ulbrich F, et al. Angiocrine Bmp2 signaling in murine liver controls normal iron homeostasis. Blood. 2017;129(4):415–419. [DOI] [PMC free article] [PubMed] [Google Scholar]
- 40.Zhu BM, McLaughlin SK, Na R, et al. Hematopoietic-specific Stat5-null mice display microcytic hypochromic anemia associated with reduced transferrin receptor gene expression. Blood. 2008;112(5):2071–2080. [DOI] [PMC free article] [PubMed] [Google Scholar]
- 41.Best CM, Pressman EK, Cao C, et al. Maternal iron status during pregnancy compared with neonatal iron status better predicts placental iron transporter expression in humans. FASEB J. 2016;30(10):3541–3550. [DOI] [PMC free article] [PubMed] [Google Scholar]
- 42.Young MF, Griffin I, Pressman E, et al. Maternal hepcidin is associated with placental transfer of iron derived from dietary heme and nonheme sources. J Nutr. 2012; 142(1):33–39. [DOI] [PMC free article] [PubMed] [Google Scholar]
- 43.Goetz DH, Holmes MA, Borregaard N, et al. The neutrophil lipocalin NGAL is a bacteriostatic agent that interferes with siderophore-mediated iron acquisition. Mol Cell. 2002; 10(5):1033–1043. [DOI] [PubMed] [Google Scholar]
- 44.Yang J, Goetz D, Li JY, et al. An iron delivery pathway mediated by a lipocalin. Mol Cell. 2002;10(5):1045–1056. [DOI] [PubMed] [Google Scholar]
- 45.Kaplan J. Mechanisms of cellular iron acquisition: another iron in the fire. Cell. 2002;111(5):603–606. [DOI] [PubMed] [Google Scholar]
- 46.Oudit GY, Sun H, Trivieri MG, et al. L-type Ca(2+) channels provide a major pathway for iron entry into cardiomyocytes in iron-overload cardiomyopathy. Nat Med. 2003; 9(9):1187–1194. [DOI] [PubMed] [Google Scholar]
- 47.Byon JC, Chen J, Doty RT, Abkowitz JL. FLVCR is necessary for erythroid maturation, may contribute to platelet maturation, but is dispensable for normal hematopoietic stem cell function. Blood. 2013;122(16): 2903–2910. [DOI] [PMC free article] [PubMed] [Google Scholar]
- 48.Jenkitkasemwong S, Wang CY, Coffey R, et al. SLC39A14 is required for the development of hepatocellular iron overload in murine models of hereditary hemochromatosis. Cell Metabolism. 2015;22(1):138–150. [DOI] [PMC free article] [PubMed] [Google Scholar]
- 49.Gunshin H, Fujiwara Y, Custodio AO, et al. Slc11a2 is required for intestinal iron absorption and erythropoiesis but dispensable in placenta and liver. J Clin Invest. 2005; 115(5):1258–1266. [DOI] [PMC free article] [PubMed] [Google Scholar]
- 50.Nai A, Lidonnici MR, Rausa M, et al. The second transferrin receptor regulates red blood cell production in mice. Blood. 2015; 125(7):1170–1179. [DOI] [PMC free article] [PubMed] [Google Scholar]


