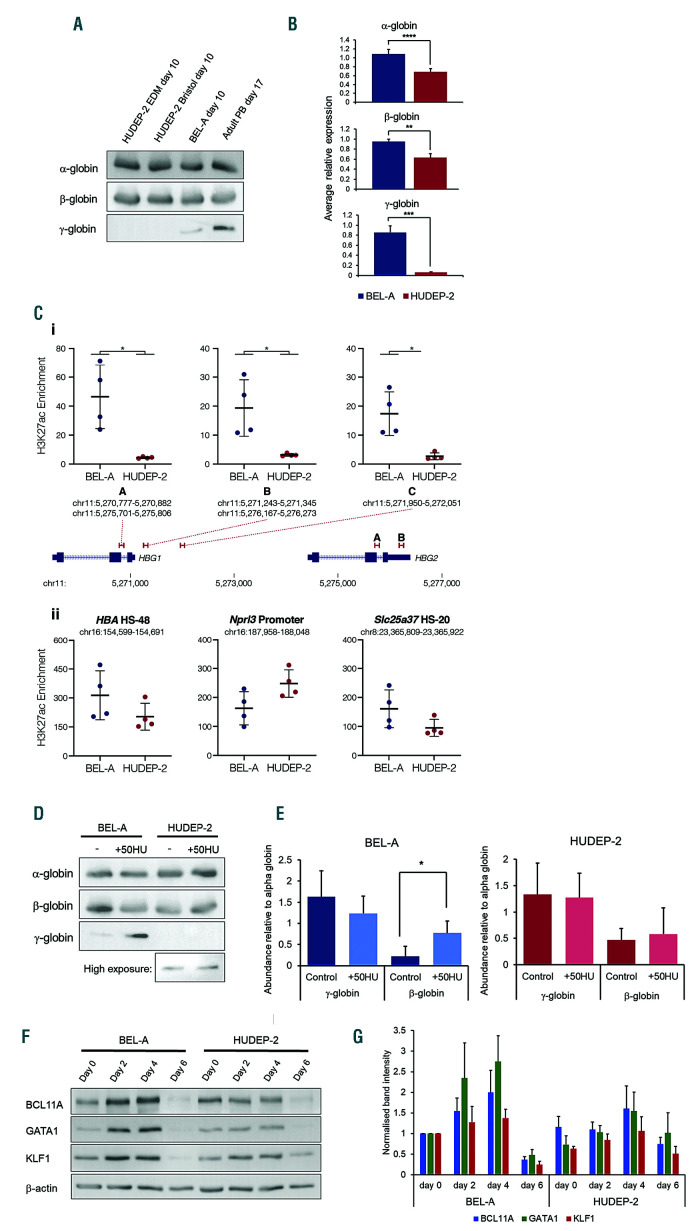
Figure 2.
Globin subunit expression by BEL-A and HUDEP-2. (A). Western blots of lysates obtained from late stage (day 10) HUDEP-2 in EDM media, HUDEP-2 and BEL-A in Bristol media and adult peripheral blood (PB; day 17) erythroid cells incubated with antibodies to α-, β- and γ-globin (sc-514378; sc-21757; sc-21756; all Santa Cruz). (B) Analysis of α-, β- and γ-globin mRNA levels in BEL-A and HUDEP-2 in Bristol media on day 6 of culture by quantitative PCR (qPCR). Target gene expression was normalised to PABPC1 reference gene (using the 2-DDCt method) and compared to a BEL-A control sample. Results are means ± standard deviation (SD), n=4. TaqMan gene expression assays used were: HBA (Hs00361191_g1), HBB (Hs00747223_g1), HBG (Hs00361131_g1) and PABPC1 (Hs00743792_s1) (Fisher Scientific). (C) H3K27ac chromatin immunoprecipitation (ChIP) was carried out in 5×10⁶ day 4 cells by fixing in 1% formaldehyde and performing immunoprecipitation (IP) with the ChIP Assay Kit (Merck Millipore) using 0.3 mg anti-H3K27ac (ab4729; Abcam). Enrichment at the HBG1/2 promoters (i) and control regions (ii) was determined using qPCR by comparing to a background control (hg19, chr16:6,002,736-6,002,834). Bars depict mean and standard deviation for IP from four separate differentiations (circles). *Mann-Whitney rank sum P=0.0286 (D-E) Response of BEL-A and HUDEP-2 cells to hydroxyurea treatment. Hydroxyurea (H8627; Sigma) was added to cells at 50 μM every two days from four days prior to the start of differentiation until harvesting of cells on day 10 of differentiation. (D) Representative Western blot of cell lysates from ± hydroxyurea (HU) cultures incubated with antibodies to α-, β- and γ-globin and (E) densitometric analysis of the bands obtained from at least three independent experiments normalised to α-globin expression (means ± SD). *P<0.05 two-tailed Student t-test. (F-G) Expression of BCL11A, GATA1 and KLF1 by BEL-A and HUDEP-2. β-actin was used as a protein loading control. (F) Representative western blots of lysates obtained from cells at day 0, 2, 4 and 6 of BEL-A and HUDEP-2 cultures incubated with BCL11A (ab19487; Abcam), GATA1 (sc-266; Santa Cruz), KLF1 (sc-14034; Santa Cruz) and β-actin (A1978; Sigma) antibodies, and (G) densitometric analysis of the bands obtained from two independent experiments normalised to β-actin expression and then compared to BEL-A day 0 (means ± SD).

