

Abstract
Despite the agronomic importance of sugar beet (Beta vulgaris L.), the early‐stage development of its taproot has only been poorly investigated. Thus, the mechanisms that determine growth and sugar accumulation in sugar beet are largely unknown. In the presented study, a physiological characterization of early‐stage sugar beet taproot development was conducted. Activities were analyzed for fourteen key enzymes of carbohydrate metabolism in developing taproots over the first 80 days after sowing. In addition, we performed in situ localizations of selected carbohydrate‐metabolic enzyme activities, anatomical investigations, and quantifications of soluble carbohydrates, hexose phosphates, and phytohormones. Based on the accumulation dynamics of biomass and sucrose, as well as on anatomical parameters, the early phase of taproot development could be subdivided into three stages—prestorage, transition, secondary growth and sucrose accumulation stage—each of which was characterized by distinct metabolic and phytohormonal signatures. The enzyme activity signatures corresponding to these stages were also shown to be robustly reproducible in experiments conducted in two additional locations. The results from this physiological phenotyping approach contribute to the identification of the key regulators of sugar beet taproot development and open up new perspectives for sugar beet crop improvement concerning both physiological marker‐based breeding and biotechnological approaches.
Keywords: assimilate partitioning, carbohydrate metabolism, developmental regulation, physiological phenotyping, sucrose accumulation, taproot development
1. INTRODUCTION
Sugar beet, a cultivar of Beta vulgaris L. subsp. vulgaris (Chenopodiaceae), is one of the two crop species from which sucrose is obtained. The sugar beet storage organ, commonly referred to as the taproot or beet‐root, is composed of mainly root and hypocotyl tissues that, upon completion of primary development, enter a stage of potentially unlimited secondary thickening growth (Bell, Milford, & Leigh, 1996; Milford, 2006). The mature beet is composed of alternating zones of vascular and parenchymatic tissues (Elliott & Weston, 1993). Sucrose is stored in the vacuoles of parenchyma cells between and within the consecutive zones of vascular tissue of the beet (Giaquinta, 1979; Leigh, Ap Rees, Fuller, & Banfield, 1979). This structure arises from an anomalous type of secondary root thickening growth that is found in all members of the genus Beta, the formation of supernumerary cambia (Artschwager, 1926; Elliott & Weston, 1993; Fasahat, Aghaeezadeh, Jabbari, Sadeghzadeh Hemayati, & Townson, 2018; Getz, 2000; Krumbiegel, 1998; Milford, 2006; Zamski & Azenkot, 1981). The innermost six to seven rings that account for the bulk of the mature beet are sequentially initiated at the early stages of sugar beet development (Artschwager, 1926; Elliott & Weston, 1993). Throughout the growing season, growth by cell division and cell expansion occurs simultaneously in all rings. In parallel, additional rings are formed, which remain in a more or less meristem‐like state and do not contribute to a large extent to final beet size and weight (Artschwager, 1926; Elliott & Weston, 1993).
Sugar beet plants, as photoautotrophic organisms, cover their demand for carbohydrates by the photosynthetic fixation of carbon in green leaves. The carbohydrates are then translocated via the phloem pathway, mostly in the form of sucrose (Wang & Ruan, 2016), from these source organs to the heterotrophic tissues/organs with a net underproduction of photosynthates, which are commonly known as sink tissues/organs (Li, Wu, Foster, & Ruan, 2017; Slewinski & Braun, 2010). Within a plant, various sinks compete for the available carbohydrate, and the amount of carbohydrate that is allocated to a certain sink depends on its sink strength (Getz, 2000; Roitsch & Gonzalez, 2004; Yu, Lo, & Ho, 2015). Although carbohydrate partitioning is a major determinant for plant growth and crop yield, relatively little is known about the regulatory network underlying source‐sink relations, the key components of which are just starting to be discovered (Balibrea Lara et al., 2004; Braun, Wang, & Ruan, 2014; Ehneß, Ecker, Godt, & Roitsch, 1997; Getz, 2000; Slewinski & Braun, 2010; Wan, Wu, Yang, Zhou, & Ruan, 2018; Yu et al., 2015). Sinks have been categorized into two groups according to the fate of the imported sucrose: utilization/consuming sinks (meristems, young organs), where carbohydrates are rapidly metabolized in order to release energy for growth, and storage/accumulating sinks (storage organs, fruits, seeds), where carbohydrates are stored in the form of soluble sugars or polysaccharides (reviewed by Getz, 2000; Yu et al., 2015; Zamski, 1996). Due to their anomalous growth characteristics, Beta roots simultaneously represent both consuming sinks (actively dividing meristems, expanding cells) and storage sinks (sucrose‐storing cells) from a very early developmental stage onwards (Getz, 2000; Wyse, 1979). Therefore, a fine‐tuned regulatory network is necessary in order to ensure the simultaneous channeling of sucrose allocated to the taproot into various processes: the release of energy by respiration, the synthesis of macromolecules, the generation of sugar signals as developmental cues, and the sucrose storage process. Despite the agronomic importance of sugar beet, current knowledge is scarce on the mechanisms that regulate sugar metabolism, sucrose accumulation, and taproot development in sugar beet during the early growth stages.
Sugar yield, the central parameter of interest in sugar beet breeding, is a product of two traits, sugar content and root biomass yield (Bosemark, 2006), which have been shown to be negatively correlated with each other (Artschwager, 1930; Bosemark, 2006; Doney, Wyse, & Theurer, 1981; Pack, 1927; Stich, Piepho, Schulz, & Melchinger, 2008). Genetic selection techniques that improved relative sugar content reduced beet yield, and vice versa (Artschwager, 1930; Bergen, 1967; Oldemeyer, 1975; Powers, 1956). These findings suggest that common regulatory mechanisms are involved in the development of both traits (Doney et al., 1981; Milford, 2006).
To date, most of the research on sucrose storage and transport in sugar beet has been carried out on mature beets. Even large‐scale analyses aimed at identifying regulators of sucrose content and root yield were focused on mature beets or started at developmental stages when secondary thickening had already begun (Bellin, Schulz, Soerensen, Salamini, & Schneider, 2007; Bellin et al., 2002; Herwig et al., 2002; Zhang et al., 2017). Thus, there is still very little knowledge about the earliest stages of taproot development, including primary growth, although several studies indicate that the decisive events that determine final beet yield and sugar content take place during the early phase of the growing season, that is, at a very young developmental stage (Artschwager, 1926; Doney, 1979; Elliott & Weston, 1993; Getz, 2000; Giaquinta, 1979; Hoffmann, Kenter, & Bloch, 2005). Therefore, it is likely that important determinants for final sugar yield have been simply overlooked so far.
In recent years, the value of classical physiological assays for modern plant science has been re‐discovered. Assay platforms have been developed that allow a collection of physiological data at a high throughput (Gibon et al., 2004; Gibon, Vigeolas, Tiessen, Geigenberger, & Stitt, 2002) or a semi‐high throughput scale (Fimognari et al., 2020; Großkinsky et al., 2014; Jammer et al., 2015). Semi‐high throughput platforms for enzyme activity profiling have successfully been used to study carbohydrate‐metabolic changes during plant‐pathogen interaction (Cuesta‐Seijo et al., 2019; Kuska, Behmann, Grosskinsky, Roitsch, & Mahlein, 2018; Prezelj et al., 2016), and to investigate antioxidant metabolism during biotic and abiotic stress response (Fimognari et al., 2020). In the presented study, semi‐high throughput assay platforms for carbohydrate‐metabolic enzyme activities (Jammer et al., 2015) and phytohormones (Großkinsky et al., 2014) were employed in a developmental context: In order to gain a better understanding of the metabolic processes during early‐stage sugar beet taproot development, we performed a detailed physiological characterization of this phase. An experimental time span of 80 days after sowing (das) was selected based on a previous sugar beet study (Godt & Roitsch, 2006) which showed clear differential developmental patterns of regulation for the sucrolytic enzymes in the taproot during this period. Our approach included time‐course analyses of developmental (biomass accumulation; root structure and anatomy) and physiological (enzyme activities; metabolite content; sucrose accumulation; phytohormone levels) parameters. Our study resulted in a detailed physiological description of the early phase of sugar beet taproot development. Based on the data we collected, we were able to show that the developmental transition from primary root development to secondary growth and sucrose storage in sugar beet taproots was accompanied by characteristic changes in enzyme activities, metabolite concentrations, and phytohormone levels. Each of the three developmental stages—primary growth stage, transition stage, and secondary growth and sucrose storage stage—was characterized by distinct physiological signatures. The enzyme activity profiling was repeated for a selected subset of eight enzymes in a total of five independent experiments in two additional locations. Thus, we were able to verify that the physiological changes we observed were independent of the growth conditions and robustly related to the developmental transition from primary growth to secondary growth and sucrose storage in sugar beet taproots.
2. MATERIAL AND METHODS
2.1. Sources of chemicals and enzymes
All standard chemicals were purchased from Applichem (Darmstadt, Germany), Carl Roth (Karlsruhe, Germany), or Sigma‐Aldrich (Munich, Germany). All consumables were purchased from Greiner Bio One (Kremsmünster, Austria) or Sarstedt (Nümbrecht, Germany). Sources of auxiliary enzymes, substrates, and other chemicals required for enzyme activity assays, which were also used for histochemical localization of enzyme activities and for hexose phosphate assays, are listed in Jammer et al. (2015).
2.2. Plant material and growth conditions
Sugar beet (Beta vulgaris L.; supplied by KWS Saat AG, Einbeck, Germany) plants were grown in greenhouses under semi‐controlled growth conditions in three different locations in Europe at different times of the year (spring—sp; early summer—es; summer—s; autumn—a; for details, see Table 1). This experimental setup was chosen in order to identify robust developmental patterns in the analyzed parameters (for a detailed description of the experimental setup, see Material and Methods S1). The main set of six independent experiments was conducted in location A (Graz, Austria, 47°4′N, 15°26′E; experiments A1‐es, A2‐s, A3‐a, A4‐sp, A5‐es, A6‐sp). Two additional sets of experiments were then carried out in locations B (Tulln, Austria, 48°20′N, 16°3′E; two independent experiments B1‐es, B2‐s) and C (Taastrup, Denmark; 55°39′04″N, 12°15′58″E; three independent experiments C1‐es, C2‐s, C3‐s). The technical details differed between the greenhouses in the three locations (see below), and the differences in plant growth that arose therefrom are pointed out in the Results and Discussion sections. Plants were grown in soil (locations A and B: Naturahum; Gramoflor, Vechta, Germany; location C: Green line, with clay and silica; SW Horto AB, Hammenhög, Sweden) in containers of different size (depending on sampling time point). In locations A and B, plants were kept at 20°C to 24°C achieved by additional heating during colder outside temperatures, and a 16 hr/8 hr day/night cycle by supplementary illumination (location A: Plug and Grow™ 200 W 6,400 K fluorescent lamps; Trade Hydro, Cleckheaton, United Kingdom; location B: Master Agro 400 W 2,000 K High‐Pressure Sodium lamp, Philipps Lighting Holding B.V., The Netherlands), resulting in a photosynthetically active radiation of at least 75 µmol photons m−2 s‐1. In location C, plants were kept at 17°C to 22°C achieved by additional heating during colder outside temperatures, and a 12 hr/12 hr day/night cycle by supplementary illumination (Fiona FL300 Grow LED, Senmatic, Søndersø, Denmark, and Son‐T Master Green Power 600 W 2,000 K High‐Pressure Sodium lamp, Philipps Lighting Holding B.V., Netherlands), resulting in a photosynthetically active radiation of at least 200 µmol photons m−2 s‐1. Taproots (including hypocotyls) were dug from the soil at six to seven sampling time points over a period of 80, 60, or 45 das in locations A, B, and C, respectively (see Table 1), washed with tap water, and either directly used for anatomical/histochemical studies, or frozen in liquid nitrogen for biochemical studies. Frozen material (pooled samples of at least 15 individuals per time point) was ground in liquid nitrogen, with 0.1% polyvinyl‐polypyrrolidone to bind phenolics and stored at −80°C until further use.
TABLE 1.
Overview of growing and sampling regimes for time‐course experiments in three different locations
| Location | Code | Start date – end date | Season | Sampling time points [das] |
|---|---|---|---|---|
| A | A1‐es | 25/05/2010–13/08/2010 | Early summer | 10, 15, 30, 53, 60, 80 |
| A2‐s | 20/07/2010–08/10/2010 | Summer | 10, 15, 30, 53, 60, 80 | |
| A3‐a | 05/10/2010–22/12/2010 | Autumn | 10, 15, 20, 30, 40, 60, 80 | |
| A4‐sp | 01/03/2011–20/05/2011 | Spring | 10, 15, 20, 30, 40, 60, 80 | |
| A5‐es | 27/05/2011–15/08/2011 | Early summer | 10, 15, 20, 30, 40, 60, 80 | |
| A6‐sp | 06/03/2012–29/05/2012 | Spring | 10, 15, 20, 30, 40, 60, 80 | |
| B | B1‐es | 28/05/2013–26/07/2013 | Early summer | 10, 15, 20, 30, 40, 60 |
| B2‐s | 09/07/2013–06/09/2013 | Summer | 10, 15, 20, 30, 40, 60 | |
| C | C1‐es | 20/05/2014–04/07/2014 | Early summer | 10, 15, 20, 27, 35, 45 |
| C2‐s | 10/06/2014–25/07/2014 | Summer | 10, 15, 20, 27, 35, 45 | |
| C3‐s | 01/07/2014–15/08/2014 | Summer | 10, 15, 20, 27, 35, 45 |
Plants were grown in greenhouses in three locations in Europe: location A = Graz, Austria; location B = Tulln, Austria; location C = Taastrup, Denmark.
Abbreviations: a, autumn experiment; das, days after sowing; es, early summer experiment; s, summer experiment; sp, spring experiment.
2.3. Enzyme activity assays
Specific enzyme activities for vacuolar, cytoplasmic, and cell wall‐bound isoenzymes of invertase (vacInv, cytInv, cwInv; EC:3.2.1.26), sucrose synthase (SuSy; EC:2.4.1.13), fructokinase (FK; EC:2.7.1.4), hexokinase (HXK; EC:2.7.1.1), uridine‐5’‐diphosphoglucose pyrophosphorylase (UGPase; EC:2.7.7.9), phosphoglucoisomerase (PGI; EC:5.3.1.9), phosphoglucomutase (PGM; EC:5.4.2.2), fructose‐1,6‐bisphosphate aldolase (Ald; EC:4.1.2.13), phosphofructokinase (PFK; EC:2.7.1.11), glucose‐6‐phosphate dehydrogenase (G6PDH; EC:1.1.1.49), and adenosine‐5’‐diphosphoglucose pyrophosphorylase (AGPase; EC:2.7.7.27) were measured in miniaturized spectrophotometric assays in a 96‐well format as previously described by Jammer et al. (2015). Specific enzyme activities were expressed in nkat mg−1 protein. In the main set of experiments (location A), enzyme activities for invertases, SuSy, FK, HXK, UGPAse, PGI, PGM, Ald, and G6PDH were measured in duplicate in two parallel extracts per time point for six independent experiments, while AGPase activity was measured for one experiment only (experiment A1‐es). In all experiments from locations B and C, enzyme activities for vacInv, cwInv, SuSy, PGI, PGM, Ald, and G6PDH were measured in triplicate in single extracts.
For determination of sucrose‐phosphate synthase activity (SPS; EC:2.4.1.14), aliquots (5 µl) of dialyzed crude extracts were incubated at 38°C for 20 min in a total reaction volume of 25 µl with 5 mM MgCl2, 10 mM UDPGlc, and 10 mM F6P in 50 mM HEPES/NaOH at pH 7.5 (modified from Fieuw & Willenbrink, 1987, 1990). For controls, F6P was omitted. Reactions were stopped by adding 25 µl 1 N NaOH on ice, and remaining F6P was destroyed by boiling the samples in a water bath for 45 min. After cooling the samples on ice, 250 µl of anthrone reagent (0.5 g/L anthrone and 10 g/L thiourea in 65% sulfuric acid) were added to the samples and standards prior to 10 min incubation in a water bath at 90°C. Reaction mixes were cooled on ice, 100 µl per sample or standard were transferred to a flat bottom 96‐well plate, and absorbance at 620 nm was measured in a microplate reader (Ascent Multiskan; Thermo Fisher Scientific, Waltham, Massachusetts, USA). Specific activities were expressed in nkat mg−1 protein. SPS activity was analyzed in duplicate in two parallel extracts per time point for one experiment from location A (experiment A4‐sp).
2.4. HPLC analysis of carbohydrate levels
Soluble sugar levels and starch levels were analyzed as described by Bonfig, Schreiber, Gabler, Roitsch, and Berger (2006) and Gasperl, Morvan‐Bertrand, Prud'homme, van der Graaff, and Roitsch (2016). Data were expressed in µg g−1 FW or mg g−1 FW. Analyses were carried out for five biologically independent experiments from location A (measured in duplicate in two parallel extracts per time point for experiments A1‐es, A2‐s, and A6‐sp; single extracts for experiments A4‐sp and A5‐es). Starch was analyzed for one experiment from location A (A1‐es).
2.5. Hexose phosphate assays
Metabolites were extracted according to a protocol modified from Jelitto, Sonnewald, Willmitzer, Hajirezeai, and Stitt (1992). Per sample, 1 ml 16% (w/v) trichloroacetic acid (TCA) in diethyl ether (DEE) was added to 200 mg of ground plant material, and samples were mixed vigorously for 2 min at 4°C. Samples were incubated on ice for 20 min and mixed at regular intervals. In the following step, 600 µl 16% (w/v) TCA in water containing 5 mM EDTA were added, samples were mixed vigorously, and incubated on ice for 3 hr. After 10 min centrifugation at 4°C and 20,000 g, the DEE phase was discarded. The aqueous phase was transferred to 50 ml tubes and extracted with 2.5 ml water‐saturated DEE to remove TCA from the metabolite extracts. Samples were centrifuged for 5 min at 4°C and 1,650 g. The DEE phase was discarded, and the samples were extracted again with 1.5 ml water‐saturated DEE to remove remnants of TCA from the metabolite extracts. Samples were centrifuged for 5 min at 4°C and 1,650 g. Aqueous metabolite extracts were transferred to 1.5 ml tubes, and pH was adjusted to 6–7 with 5 M KOH/1 M triethanolamine. Tubes were then incubated on ice with open caps in order to allow evaporation of remaining DEE prior to removal of particulate contamination by 20 min centrifugation at 4°C and 20,000 g. Aliquots of TCA extracts were snap‐frozen in liquid nitrogen and stored at −80°C until further use.
Metabolite levels of glucose‐6‐phosphate (G6P), glucose‐1‐phosphate (G1P), and fructose‐6‐phosphate (F6P) were determined by means of enzymatic cycling assays according to Gibon et al. (2002). The reaction mixtures were prepared on ice, and the cycling reactions were started by placing the plates containing the final reaction mixtures in a microplate reader (Ascent Multiskan; Thermo Fisher Scientific) preheated to 30°C, and monitored for 10 min at 540 nm. Hexose phosphate levels were expressed in ng g−1 FW. Hexose phosphates were analyzed in duplicate in two parallel extracts for two biologically independent experiments from location A (experiments A4‐sp and A5‐es).
2.6. HPLC‐MS/MS analysis of phytohormone levels
Phytohormone levels of trans‐isopentenyl adenine (tiP), trans‐zeatin (tZ), trans‐zeatin riboside (tZR), dehydrozeatin (DHZ), dehydrozeatin‐riboside (DZR), cis‐zeatin (cZ), zeatin‐o‐glucoside (ZOG), zeatin‐riboside‐o‐glucoside (ZROG), indole‐3‐acetic acid (IAA), abscisic acid (ABA), salicylic acid (SA), and jasmonic acid (JA) were analyzed as previously described by Großkinsky et al. (2014). Phytohormone levels were expressed in ng g−1 FW. Analyses were carried out for four biologically independent experiments from location A, with duplicate measurements in two parallel extracts per time point for experiments A1‐es and A6‐sp, and single extracts for experiments A4‐sp and A5‐es.
2.7. Histochemical enzyme activity staining
Sugar beet taproot segments (approx. 5 mm long) were stabilized by fixing them to blocks cut from carrot taproots with cyanoacrylate glue and cut into 150 µm transverse sections with a vibrating blade microtome (LeicaVT1000S, Leica Biosytems, Nussloch, Germany). Sections were prepared for staining according to Sergeeva and Vreugdenhil (2002), transferred to 1.5 ml microcentrifuge tubes, snap‐frozen in liquid nitrogen, and stored at −80°C until further use.
Histochemical localization of invertase, SuSy, PGI, and PGM activities was carried out according to enzyme‐coupled protocols (Sergeeva & Vreugdenhil, 2002). The G6PDH activity staining protocol was adapted from the protocol used for the in vitro activity assay for this enzyme (Jammer et al., 2015). Sections for G6PDH localization were incubated at 30°C with 5 mM MgCl2, 0.4 mM NADP, 0.03% (w/v) NBT (AppliChem), and 1 mM G6P in 100 mM Tris‐HCl at pH 7.6; for controls, G6P was omitted. For all staining protocols, tissue sections were removed from liquid nitrogen, thawed at room temperature in 1 ml staining solution and then incubated for 1 hr at the respective temperatures (37°C for invertase; 30°C for all other enzymes). Reactions were stopped by replacing the staining solution with 1 ml 70% ethanol and incubating the sections at 37°C for at least 1 hr. Samples were stored at room temperature in distilled water until evaluation. Sections were evaluated with an SXZ9 binocular (Olympus, Tokyo, Japan) and an AX70 microscope (Olympus) in bright field mode, and photographs were taken with an E330 camera and a ColorViewIII digital camera (both Olympus), respectively.
2.8. Anatomical studies
Sections from the same batch of material used for the histochemical enzyme activity staining were also used for anatomical investigation. Sections were stained with fuchsin, chrysoidin, and astra blue according to Etzold (2002). Sections were evaluated and photographs were taken with the equipment listed in the previous section (Histochemical enzyme activity staining). The number of cambial rings was counted, and the diameter of the central cylinder was measured using the CellF software (Olympus).
2.9. Statistical evaluation
Data from enzyme activity assays, carbohydrate analytics, metabolite level analyses, and phytohormone analytics for location A were analyzed for statistical significance with the unpaired Student's t test. For information about the statistical significance of differences between the 10 das data and the data obtained at later time points, the reader is referred to Datasets S1–S3.
3. RESULTS
In order to identify robust patterns of developmental regulation, sugar beet time‐course experiments were carried out under semi‐standardized greenhouse conditions. Samples were collected in three different locations, as shown in Table 1.
3.1. Biomass accumulation
The biomass data for location A (Figure 1) were obtained by weighing the taproots of 15 individual plants. Mean taproot biomass increased exponentially in all experiments throughout the period of investigation (see also Table S1; Dataset S1). Fresh weight of individual roots was rather homogeneous up to 20 das. From 30 das onwards, however, variation between individuals started to increase and was most pronounced at 60 and 80 das. Final fresh weight at 80 das was strongly dependent on the time of year the experiment was started. The spring and early summer experiments yielded the biggest beets (Figure 1a,d,e,f), whereas beets grew smaller in the experiment started later in summer (Figure 1b), and were smallest in the autumn experiment (Figure 1c).
FIGURE 1.

Biomass in developing sugar beet taproots over 80 days after sowing (main set of experiments, location A, Graz, Austria; means of 15 individuals ± SD). Beets grew exponentially throughout the period of investigation in all experiments, and fresh weight at 80 das was strongly dependent on the growing season. (a) experiment A1‐es. (b) experiment A2‐s. (c) experiment A3‐a. (d) experiment A4‐sp. (e) experiment A5‐es. (f) experiment A6‐sp
3.2. Anatomy
Transverse sections from the upper root or lower hypocotyl region of sugar beet taproots were evaluated for anatomical parameters (Figure 2; Dataset S1). At 10 das, when the taproots were approximately 1 mm in diameter, the central cylinder was about 0.2 mm in diameter. At this stage, the structure of the central cylinder corresponded to the structure observed by Artschwager (1926) in a 10‐day‐old sugar beet seedling root. The first periclinal cell divisions were visible in the parenchyma cells between primary xylem and phloem, which indicated the initiation of the primary cambium (Figure 2a). At 15 and 20 das, the primary cambium continued to develop and to expand laterally (Figure 2b,c). By 30 das, the central cylinder had reached a diameter of approximately 0.5 mm. The primary cambium had developed into a full circle of meristematic tissue and had started to give rise to secondary xylem and phloem. In addition, the development of the first supernumerary cambium and, thus, Beta‐specific secondary growth had been initiated, evident by a number of periclinal cell divisions in the phloem parenchyma (Figure 2d). At 40 das, a full cambial ring had formed around the central cylinder, which represented the first supernumerary cambium, with visible differentiation of phloem and xylem. Additionally, at this stage, the second supernumerary cambium was initiated (Figure 2e). From 40 das onwards, the peripheral layers (epidermis and cortex) of the beets started to break and to slough gradually (Figure 2f,g). At 80 das, the beets consisted of the central cylinder only, and a periderm had taken over the protective function of the cortex and epidermis even in the smallest individuals. At 60 and 80 das, variation between individuals was high concerning beet diameter and number of cambial rings (Dataset S1). At this stage, the innermost rings were differentiated most prominently. Beets at 60 das showed three to five developed supernumerary cambia, and an additional cambial ring had already been initiated (Figure 2f). At 80 das, there were four to six supernumerary cambia in the beets, and initial cell divisions for an additional cambial ring were already visible (Figure 2g).
FIGURE 2.

Anatomy (a–g) of developing sugar beet taproots at 10 (a), 15 (b), 20 (c), 30 (d), 40 (e), 60 (f), and 80 (g) days after sowing (das), and schematic representation (h) of central cylinder development up to 40 das. c, cortex; ca, cambium; cr, cambial ring (consisting of supernumerary cambium plus weakly differentiated phloem and xylem); e, endodermis; p, pericycle; pa, storage parenchyma; pe, periderm; ph, phloem; xy, xylem; arrows = initial cell divisions for new cambia; bar = 100 µm (a–e) or 500 µm (f,g)
3.3. Soluble carbohydrates, starch, and hexose phosphates
Soluble carbohydrate content was determined for five biologically independent experiments by means of HPLC analysis (Figure 3; Table S1; Dataset S1). At the earliest stages of taproot development (≤ 20 das), sugar content was generally low in all experiments. Glucose (Glc) was the dominating carbohydrate at this stage (Figure 3a,d,g,j). At 10 das, its levels were 2.5‐fold to fourfold and twofold to 9.3‐fold higher than fructose (Fru) and sucrose (Suc) levels, respectively.
FIGURE 3.

Soluble carbohydrates (Glc, Fru, Suc) and hexose‐to‐Suc ratio in developing sugar beet taproots over 80 days after sowing (main set of experiments, location A, Graz, Austria). (a–c) experiment A1‐es (means of two parallel extracts ± SD). (d–f) experiment A2‐s (means of two technical replicates ± SD). (g–i) experiment A4‐sp (values from single extract). (j–l) experiment A5‐es (values from single extract). Experiment A6‐sp is not shown (no data for Glc and Fru due to technical problems with the quantification of hexoses; for Suc data, see Dataset S1)
From 30 das onwards, sugar contents started to increase, with sucrose levels increasing particularly strongly (Figure 3b,e,h,k). Hexose‐to‐Suc ratios (Figure 3c,f,i,l) were initially high, but declined steeply as soon as Suc levels started to increase. The Suc accumulation rate continuously increased in all experiments throughout the entire period of investigation, and the average rate of Suc accumulation was similar in all experiments (Dataset S1). Sugar content at 60 and 80 das (Figure 3b,e,h,k) varied between experiments but was less dependent on the time of year when the experiment was started than beet fresh weight. Because no starch was detectable at any of the time points in experiment A1‐es (Table S1; Dataset S1), and sugar beet is known not to store considerable amounts of starch (Turesson, Andersson, Marttila, Thulin, & Hofvander, 2014), starch content was no longer analyzed in the following experiments.
The hexose phosphates Glc‐6‐phosphate (G6P), Glc‐1‐phosphate (G1P), and Fru‐6‐phosphate (F6P) represent a central pool for carbohydrate metabolism from which carbohydrates are distributed to various metabolic processes. Levels of these metabolites (Figure 4; Dataset S1) were determined for two biologically independent experiments by means of enzyme‐coupled colorimetric cycling assays. G6P content was low at 10 and 15 das, and then gradually increased to reach a plateau at 60 to 80 das (Figure 4a,d). The same developmental pattern could be observed for G1P (Figure 4b,e) and F6P (Figure 4c,f), but at levels threefold to fourfold lower than those of G6P.
FIGURE 4.

Hexose phosphates in developing sugar beet taproots over 80 days after sowing (main set of experiments, location a, Graz, Austria; means of two parallel extracts ± SD)—Glc‐6‐phosphate (G6P), Glc‐1‐phosphate (G1P), and Fru‐6‐phosphate (F6P). (a–c) experiment A4‐sp. (d–f) experiment A5‐es
3.4. In vitro activities for key enzymes of primary carbohydrate metabolism
The centerpiece of our study was the investigation of the regulation of carbohydrate metabolism during sugar beet taproot development. In vitro activities of fourteen carbohydrate‐metabolic key enzymes were determined by means of colorimetric end‐point assays (invertase isoenzymes, SPS) or enzyme‐coupled kinetic assays (all other enzymes) as previously described by Jammer et al. (2015) for six biologically independent experiments (Figures 5 and 6; Table S2; Dataset S2). The following enzymes were selected: vacuolar, cytoplasmic, and cell wall‐bound isoenzymes of invertase (vacInv, cytInv, cwInv), and sucrose synthase (SuSy) (sucrolytic enzymes); fructokinase (FK) and hexokinase (HXK) (hexose‐phosphorylating enzymes); uridine‐5’‐diphosphoglucose pyrophosphorylase (UGPase) (link between Suc breakdown via SuSy and metabolism); phosphoglucoisomerase (PGI) and phosphoglucomutase (PGM) (interconverting enzymes of the hexose phosphate pool); fructose‐1,6‐bisphosphate aldolase (Ald) and phosphofructokinase (PFK) (glycolytic key enzymes); glucose‐6‐phosphate dehydrogenase (G6PDH) (key enzyme of the oxidative pentose phosphate pathway); adenosine‐5’‐diphosphoglucose pyrophosphorylase (AGPase) (key enzyme of starch synthesis); sucrose‐phosphate synthase (SPS) (key enzyme of Suc synthesis).
FIGURE 5.

Carbohydrate‐metabolic enzyme activities in developing sugar beet taproots over 80 days after sowing (main set of experiments, location a, Graz, Austria; means of two parallel extracts ± SD). Part 1—vacuolar, cytoplasmic, and cell wall‐bound invertase isoenzymes (vacInv, cytInv, cwInv), sucrose synthase (SuSy), and hexose‐phosphorylating enzymes hexokinase (HXK) and fructokinase (FK). (a–c) experiment A1‐es. (d–f) experiment A2‐s. (g–i) experiment A3‐a. (j–l) experiment A4‐sp. (m–o) experiment A5‐es. (p–r) experiment A6‐sp
FIGURE 6.

Carbohydrate‐metabolic enzyme activities in developing sugar beet taproots over 80 days after sowing (main set of experiments, location a, Graz, Austria; means of two parallel extracts ± SD). Part 2—hexose phosphate interconverting enzymes phosphoglucose isomerase (PGI) and phosphoglucomutase (PGM), glycolytic enzymes aldolase (Ald) and phosphofructokinase (PFK), UDP‐glucose pyrophosphorylase (UGPase), and glucose‐6‐phosphate dehydrogenase (G6PDH). (a–c) experiment A1‐es. (d–f) experiment A2‐s. (g–i) experiment A3‐a. (j–l) experiment A4‐sp. (m–o) experiment A5‐es. (p–r) experiment A6‐sp
From the group of sucrolytic enzymes, the activities of the three invertase isoenzymes (Figure 5a,d,g,j,m,p) were high at 10 to 20 das. At these time points, vacInv activity was the dominating sucrolytic activity in three out of six experiments, whereas in the other experiments cwInv activity was highest. The dominating invertase isoenzyme did not depend on the time of year when the plants were grown. cytInv activity was generally lower. Invertase activities declined steeply between 30 and 60 das and were very low at 60 and 80 das. SuSy activity (Figure 5b,e,h,k,n,q) was close to the detection limit at 10 das, gradually increased over the period of investigation and reached its maximum activity at 80 das. In the autumn experiment, when taproots grew very slowly, however, SuSy activity also remained low at later time points (Figure 5h).
Among the hexose‐phosphorylating enzymes (Figure 5c,f,i,l,o,r), HXK activity was generally close to the detection limit throughout the period of investigation in all experiments. FK activity was low at the earliest stages of taproot development. In spring, early summer, and summer experiments, FK showed an increase in activity from 20 das onwards. This increase in activity was strongest between 20 and 40 das. It was transient in two out of five experiments, where activity slowly declined again from 40 or 60 das onward. In the other three experiments, FK activity continued to increase or remained high over the entire period of 80 das. In the sixth experiment, the autumn experiment, FK activity constantly remained low. The hexose phosphate interconverting enzymes PGI and PGM (Figure 6a,d,g,j,m,p) activities showed very similar patterns of developmental regulation. Activities of both enzymes were low at 10 to 20 das and increased to reach maximum activities at 80 das. The most pronounced increase in activities was observed from 40 or 60 das onwards.
Concerning the glycolytic enzymes (Figure 6b,e,h,k,n,q), Ald activities varied strongly at 10 das, but showed a consistent developmental pattern of transient increase between 15 and 60 das in five out of six experiments. Ald activity reached its maximum at 30 or 40 das, followed by a gradual decline to levels similar to, or lower than initial activities. PFK activity was low at 10 to 30 das and then continuously increased from 40 das onwards to reach maximum activities at 80 das. In the autumn experiment, however, activity remained close to the detection limit throughout the entire period of 80 das.
G6PDH activity (Figure 6c,f,i,l,o,r) was low at 10 to 20 das gradually increased from 30 or 40 das onwards in all experiments. This increase was strongest from 60 to 80 das, when G6PDH reached its maximum activity. UGPase activity (Figure 6c,f,i,l,o,r) was low at 10 das in five out of six experiments. In all experiments, UGPase activity increased throughout the period of investigation to maximum levels at 80 das. AGPase activity (Dataset S2) was below or near the detection limit throughout the entire period of investigation in experiment A1‐es. Therefore, and because of the previously reported absence of starch accumulation in sugar beet taproots (Turesson et al., 2014), AGPase activity was no longer analyzed in the following experiments. SPS activity (Dataset S2), which was first analyzed in experiment A4‐sp, remained unchanged at low levels of activity throughout the entire period of 80 das. Hence, SPS activity was not analyzed in the other experiments.
The above‐described changes in enzyme activities are summarized in Figure 7, which shows the characteristic carbohydrate‐metabolic signatures (including metabolite levels) of sugar beet taproots during primary growth (Figure 7a) and during secondary growth and sucrose storage (Figure 7b) in a metabolic context.
FIGURE 7.

Overview of carbohydrate metabolism in developing sugar beet taproots. Color intensity of boxes and thickness of lines indicate the activity levels of enzymes or the abundance of metabolites. Dashed grey lines indicate that enzyme activities of the respective pathways or levels of the respective metabolites were not analyzed in the presented study. At the prestorage stage (a), sucrose is cleaved into its hexose monomers by invertases. As metabolic enzyme activities are low, relatively low amounts of carbohydrates appear to be used for metabolic processes—hexoses and hexose phosphates are assumed to accumulate and to act as sugar signals and as an osmotic driving force for growth. At the secondary growth and sucrose storage stage (b), sucrose synthase is the main sucrolytic enzyme. High activities of various carbohydrate‐metabolic enzymes suggest that sucrose is constantly partitioned between sucrose storage and metabolism. ADPGlc, ADP‐glucose; AGPase, ADP‐glucose pyrophosphorylase; F6P, fructose‐6‐phosphate; FK, fructokinase; Fru, fructose; G1P, glucose‐1‐phosphate; G6P, glucose‐6‐phosphate; G6PDH, glucose‐6‐phosphate dehydrogenase; Glc, glucose; HXK, hexokinase; Inv, invertase isoenzymes; PFK, phosphofructokinase; PGI, phosphoglucoisomerase; PGM, phosphoglucomutase; SPS, sucrose‐phosphate synthase; Suc, sucrose; UDPGlc, UDP‐glucose; UGPase, UDP‐glucose pyrophosphorylase
3.5. Spatial distribution of enzyme activities of carbohydrate metabolism
In case of a limitation of enzyme activities to certain tissues or cell types, the activities measured in in vitro assays can be (strongly) diluted and, thus, important regulation may be overlooked. Therefore, the spatial regulation of invertase, SuSy, PGI, PGM, and G6PDH activities was determined in situ for one experiment in transverse sections of taproots by means of histochemical enzyme activity staining. Distinct patterns of developmental regulation and localization of activities could be identified for the analyzed enzymes.
Histochemical staining of invertase activity (Figure 8a–c; Figure S1) was performed in hand‐cut root segments/sections, as the cyanoacrylate glue used for stabilizing the tissue during vibrating blade microtome sectioning appeared to interfere with the staining procedure. The staining reaction did not allow a clear localization of invertase activity to certain tissues or cell types, but nevertheless confirmed in vitro activity data (Figure 5). An evenly distributed staining could be observed in root segments/sections at stages of high and medium in vitro invertase activities (10 to 40 das; Figure 8a,b), whereas there was no staining at stages of low in vitro invertase activities (60 and 80 das; Figure 8c).
FIGURE 8.

Histochemical localization of enzyme activities in developing sugar beet taproots. (a–c) acid invertases (a, 10 das; B 30 das; C, 80 das). (d–f) SuSy (d, 10 das; e, 30 das; f, 60 das). (g–i) PGI (g, 10 das; E, 30 das; I, 80 das). (j–l) PGM (j, 10 das; k, 30 das; l, 80 das). (m–o) G6PDH (m, 10 das; n, 30 das; o, 80 das). Controls without substrates were free from staining (see Figures S1–S5). Bar = 1 mm (a–c) or 100 µm (d–o)
For SuSy (Figure 8d–f; Figure S2), PGI (Figure 8g–i; Figure S3), PGM (Figure 8j–l; Figure S4), and G6PDH (Figure 8m–o; Figure S5), histochemical activity staining revealed that relatively high levels of activities were already present at 10 das, although in vitro activities were low at the initial stages of taproot development. Activities were essentially restricted to the cells of the central cylinder and the endodermis throughout the period of investigation. For SuSy, PGI, and PGM, the highest intensities of staining were observed in the phloem as well as in cambia and the adjacent areas, whereas staining was weaker in storage parenchyma cells, pericycle, and endodermis. For G6PDH, staining was almost exclusively limited to the phloem at 10 to 40 das, while at 60 and 80 das, activity staining expanded to a pattern similar to those observed for SuSy, PGI, and PGM, and could also be observed in cambia and the adjacent areas, as well as in storage parenchyma cells.
3.6. Phytohormones
Phytohormones (Figure 9; Table S3; Dataset S3) are important regulators of a wide variety of developmental and physiological processes. Therefore, the levels for a number of phytohormones were analyzed by means of UHPLC‐MS/MS as previously described by Großkinsky et al. (2014) for four biologically independent experiments: various cytokinins (trans‐isopentenyl adenine [tiP], trans‐zeatin [tZ], cis‐zeatin [cZ], trans‐zeatin [tZ], trans‐zeatin riboside [tZR], dehydrozeatin [DHZ], dehydrozeatin‐riboside [DZR], zeatin‐o‐glucoside [ZOG], zeatin‐riboside‐o‐glucoside [ZROG]), indole‐3‐acetic acid (IAA), abscisic acid (ABA), jasmonic acid (JA), and salicylic acid (SA).
FIGURE 9.
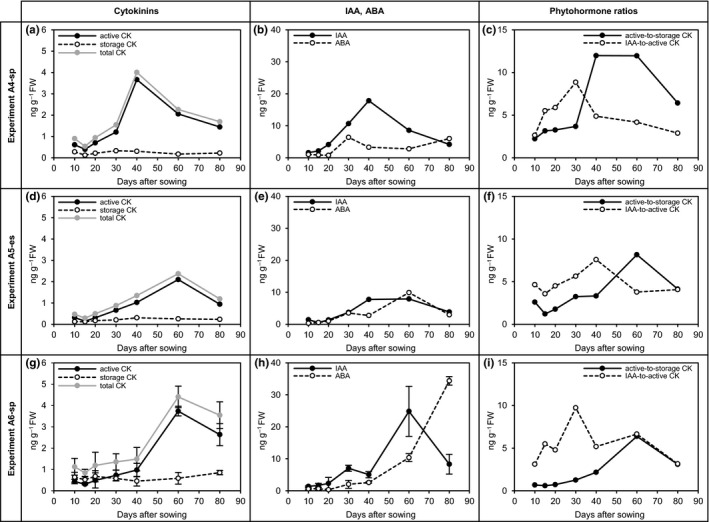
Phytohormones in developing sugar beet taproots over 80 days after sowing (main set of experiments, location A, Graz, Austria)—cytokinins (CK), indole‐acetic acid (IAA), abscisic acid (ABA), and phytohormone ratios. (a–c) experiment A4‐sp (means of two parallel extracts ± SD). (d–f) experiment A5‐es (values from single extract). (g–i) experiment A6‐sp (values from single extract). Experiment A1‐es is not shown (no data for total storage CK, total CK, and active‐to‐storage CK ratio due to technical problems with the quantification of ZOG; for the full phytohormone dataset, see Table S3 and Dataset S3)
The pool of analyzed cytokinins (Figure 9a,d,g) typically showed a trend of mainly transient upregulation, which could be observed for total cytokinins (sum of active and storage forms) as well as for total active cytokinins (sum of tZ, tZR, DHZ, DZR, and tiP). Within the group of storage cytokinins, neither for ZOG nor for ZROG, clear developmental patterns could be identified (Table S3; Dataset S3). Within the group of active cytokinins, a pattern of (mainly transient) upregulation could be observed for tZ, tZR, DHZ, and DZR, whereas levels of tiP fluctuated throughout the entire period of investigation (Table S3; Dataset S3). The ratios of active cytokinins to storage cytokinins were low at 10 to 20 das and transiently increased to reach a maximum between 30 and 60 das (Figure 9c,f,i). Values at 80 das were lower than the maxima, but about two‐ to fourfold higher than initial values. The levels of the auxin IAA (Figure 9b,e,h) transiently increased to reach a maximum at 30 to 60 das before declining to levels about two‐ to fourfold higher than initial IAA levels. The ratios of IAA to active cytokinins were low at 10 das, as well as at 60 to 80 das. They transiently increased to reach a maximum at 30 to 40 das (Figure 9c,f,i). ABA levels (Figure 9b,e,h) showed a pattern of transient increase in three out of four experiments, while in the remaining experiment ABA levels constantly increased. JA levels (Table S3; Dataset S3) continuously increased to a maximum at 80 das in two experiments, while in the other two experiments, JA levels transiently increased. SA levels (Table S3; Dataset S3) were highly variable in all experiments throughout the entire period of investigation and showed a broad range of concentrations in the investigated samples.
3.7. Experiments in additional locations
In order to assess the robustness of the enzyme activity signatures observed in the main set of six biologically independent experiments in location A (Graz, Austria), a set of enzymes showing clear developmental patterns of regulation was selected for re‐evaluation in greenhouse experiments in two additional locations (two independent experiments in location B, Tulln, Austria; three independent experiments in location C, Taastrup, Denmark). Beets accumulated biomass much faster in both of these locations, reaching fresh weights comparable to those at 80 das in the fast‐growing experiments in location A already at 60 das and 35 das in locations B and C, respectively (Tables 2 and 3; Dataset S1). Experiments were, thus, stopped after a shorter period of time in these locations. Despite the differences in growth rates between the three locations, the developmental patterns of regulation observed for vacInv, cwInv, SuSy, PGI, PGM, G6PDH, Ald, and PFK activities were in very good accordance for all of the locations, with mostly minor deviations only, and very few exceptions from the general patterns of developmental regulation (Table 3). The temporal shifts in the dynamics of the developmental patterns of enzyme activities could be observed at earlier time points in locations B and C than in location A (Dataset S2). In order to concisely summarize and compare the data from all of the experiments in all three locations, we used a system employing a table of symbols which we also used in Tables S1–S3. It allowed us to integrate the temporal dynamics (type of symbol) and the degree of change of a parameter over time (size of symbol) into a single symbol per biologically independent experiment (10 to 80 days after sowing, 6 to 7 sampling time points). According to his system, in Table 3 (and also in Table 4 in the discussion section), each symbol summarizes one independent experiment, differentiating between upregulation (▲), transient upregulation (∩), downregulation (▼), no regulation (▬), strong fluctuation (~), and “not detectable” (nd). Thus, similarities or differences between the individual experiments are clearly visible at first sight. For the numeric values underlying the symbols in tables 3 and 4, and for statistics, the reader is referred to Datasets S1, S2, and S3.
TABLE 2.
Average taproot biomass in developing sugar beet at the final time points of eleven biologically independent greenhouse experiments grown in three different locations in Europe
| Season | Location A (duration: 80 das) | Location B (duration: 60 das) | Location C (duration: 45 das) | ||||||||
|---|---|---|---|---|---|---|---|---|---|---|---|
| Spring | Early summer | Summer | Autumn | Early summer | Summer | Early summer | Summer | ||||
| A4‐sp | A6‐sp | A1‐es | A5‐es | A2‐s | A3‐a | B1‐es | B2‐s | C1‐es | C2‐s | C3‐s | |
|
g/beet (±SD) |
11.199 | 3.468 | 10.768 | 6.360 | 2.783 | 0.759 | 36.319 | 11.151 | 74.400 | 94.060 | 175.156 |
| ±4.202 | ±2.949 | ±4.937 | ±3.783 | ±1.031 | ±0.511 | ±18.867 | ±7.153 | ||||
Experiments were conducted in greenhouses in three different locations in Europe: location A = Graz, Austria (experiments A1–A6); location B = Tulln, Austria (experiments B1–B2); location C = Taastrup, Denmark (experiments C1–C3). Means of 15 individuals ± SD.
Abbreviations: a, autumn experiment; das, days after sowing; es, early summer experiment; s, summer experiment; sp, spring experiment.
TABLE 3.
Enzyme activity signatures in developing sugar beet taproots—overview of eleven biologically independent greenhouse experiments conducted in three locations in Europe

Developmental changes over 80 days after sowing in all locations (6–7 sampling time points per experiment) are summarized as one symbol per experiment and analyzed parameter. The type of symbol indicates the type of regulation of a parameter over time (▲ = upregulation; ∩ = transient upregulation; ▼, downregulation; ▬, no regulation; ~, fluctuating). The size of the symbols indicates the degree of change of a parameter over time (i.e., the temporal dynamics of the absolute values of specific enzyme activities). For numeric values and statistics, see Dataset S2.
Experiments were conducted in greenhouses in thee different locations in Europe: location A = Graz, Austria (experiments A1–A6; duration: 80 das); location B = Tulln, Austria (experiments B1–B2; duration: 60 das); location C = Taastrup, Denmark (experiments C1–C3; duration: 45 das).
Abbreviations: a, autumn experiment; Ald, aldolase; cwInv, cell wall invertase; cytInv, cytoplasmic invertase; es, early summer experiment; G6PDH, glucose‐6‐phosphate dehydrogenase; PFK, phosphofructokinase; PGI, phosphoglucoisomerase; PGM, phosphoglucomutase; s, summer experiment; sp, spring experiment; SuSy, sucrose synthase; vacInv, vacuolar invertase.
TABLE 4.
Phases of early‐stage sugar beet taproot development and their key characteristics

The table shows a summary of the developmental changes observed in eleven biologically independent experiments conducted in three locations (6–7 sampling time points per experiment) are summarized as symbols. The type of symbol indicates the type of regulation of a parameter over time (▲, upregulation; ∩, transient upregulation; ▼, downregulation; ▬, no regulation). The size of the symbols indicates the degree of change of a parameter over time (i.e., the temporal dynamics of the absolute values of the measured parameters). For numeric values and statistics, see Datasets S1–S3.
Abbreviations: ABA, abscisic acid; Ald, aldolase; CK, cytokinin; das, days after sowing; FK, fructokinase; Fru, Fructose; G6PDH, glucose‐6‐phosphate dehydrogenase; Glc, glucose; IAA, indole‐acetic acid; Inv, invertase; PFK, phosphofructokinase; PGI, phosphoglucoisomerase; PGM, phosphoglucomutase; Suc, sucrose; SuSy, sucrose synthase; UGPase, UDP‐glucose pyrophosphorylase.
4. DISCUSSION
In the presented study, a physiological characterization of early‐stage sugar beet taproot development was conducted. The combination of various methods for physiological phenotyping and anatomical analyses resulted in a detailed description of early‐stage sugar beet taproot development. Despite the variation of absolute values between the individual experiments, robust patterns of developmental regulation could be identified for many of the analyzed parameters within this holistic phenomics approach, which could also be observed when experiments were repeated for a selected set of enzymes with plants grown in different locations. An overview of enzyme activities and metabolite levels at the early and late stages of our study is shown in Figure 7.
4.1. Sugar beet growth
Independent of the season when experiments were grown, taproot fresh weight increased exponentially and growth rates increased during the entire period of investigation, which is in accordance with previous studies (Giaquinta, 1979; Godt & Roitsch, 2006; Kenter, Hoffmann, & Märländer, 2006; Klotz & Campbell, 2004; Klotz & Finger, 2001; Trebbi & McGrath, 2009). However, the variation of beet fresh weight at 60 and 80 das was very high between individual beets within experiments, as well as between experiments. Water and nutrient supply were constantly kept at sufficient levels throughout all greenhouse experiments. Therefore, this variation may be explained by technical limitations regarding temperature control and illumination. Both low and (too) high temperatures are known to slow down growth rates (Clarke, Hetschkun, Redfearn, Thomas, & Naumenko, 1995; Kenter et al., 2006; Qu, Ding, Jiang, & Zhu, 2013), which can explain differences in beet fresh weights between experiments. Additionally, differences in irradiation, mainly due to unfavorable outside light conditions and different brands of lamps in the greenhouses, may have contributed to the observed differences in growth, as low light has also been reported to slow down beet growth and dry matter accumulation (reviewed by Jaggard & Qi, 2006).
Anatomical development of the taproots corresponded to the descriptions by Artschwager (1926) and Elliott and Weston (1993). The increase in beet growth rate at around 30 das coincided with the completion of primary development and the initiation of the first supernumerary cambium. Growth rates were highest at 60 to 80 das. By then, several supernumerary rings had already been initiated and had started to simultaneously expand, which resulted in the breaking and sloughing of the cortex. As anatomical parameters were analyzed for a single experiment only, no information can be provided on seasonal differences in ring formation.
4.2. A metabolic transition occurs at a very early stage of sugar beet taproot development
Based on our multilevel analysis, the first 80 days of sugar beet taproot development can be subdivided into an early and a late stage, which are separated by a stage of metabolic transition (Table 4). The simultaneous onset of secondary growth and Suc storage, which occurs at a very early stage of sugar beet taproot development, coincides with a stage of a general carbohydrate‐metabolic transition. The three stages were not only characterized by differences in growth rates, Suc accumulation rates, and anatomical parameters, but also by clear signatures of enzyme activities, metabolite concentrations, and phytohormone levels. The developmental shifts in metabolic and enzymatic signatures were robust and could be observed in all experiments. However, the timing of the transition was season‐dependent and, thus, likely controlled by thermal time, which has been shown to play an important role for the progress of taproot development (Bergen, 1967; Durr & Boiffin, 1995; Freckleton, Watkinson, J. Webb, & Thomas, 1999 and references cited therein; Kenter et al., 2006; Bellin et al., 2007; Hoffmann & Kluge‐Severin, 2011). The stage transition was also clearly visible on the transcriptional level when genes encoding carbohydrate‐metabolic enzymes were analyzed (data not shown). We observed a surprisingly high level of correlation between developmental patterns of gene expression and the respective in vitro enzyme activities, suggesting that the changes in the activities for many of the enzymes were regulated on the transcriptional level. This was unexpected, as it is frequently reported that there is a lack of correlation between gene expression levels and enzyme activities (e.g., Bonfig et al., 2010; Dai et al., 2011).
4.3. Carbohydrate metabolism in sugar beet taproots during the prestorage stage
It has been shown for Vicia faba and Hordeum vulgare that sugar levels and activities of Suc‐degrading enzymes play an important regulatory role during seed development and are involved in the determination of seed size (reviewed by Weber, Borisjuk, & Wobus, 1997, Wobus & Weber, 1999, Wobus, Bäumlein, Conrad, Müntz, & Weber, 2000, Borisjuk et al., 2004, and Weber, Borisjuk, & Wobus, 2005). Young developmental stages are characterized by high levels of cell proliferation, high extracellular invertase (cwInv) activities and high hexose‐to‐Suc ratios. This stage is followed by a transition stage characterized by decreasing invertase activities, increasing sucrose synthase (SuSy) activity, high Suc concentrations, and cell expansion, before starch is synthesized and stored at the maturation stage (Borisjuk, Rolletschek, Wobus, & Weber, 2003; Borisjuk et al., 2002; Borisjuk, Walenta, Weber, Mueller‐Klieser, & Wobus, 1998; Weber, Borisjuk, Heim, Buchner, & Wobus, 1995; Weber, Borisjuk, & Wobus, 1996; Weschke et al., 2003). Similar patterns of inverse developmental regulation of invertases and SuSy have also been observed during the early phase of sugar beet taproot development (Giaquinta, 1979; Godt & Roitsch, 2006; Klotz & Campbell, 2004; Klotz & Finger, 2001), as well as in developing taproots of other plant species (McKee, Thomas, & Hole, 1984; Ricardo & Sovia, 1974; Sturm, 1996; Sturm et al., 1995; Usuda, Demura, Shimogawara, & Fukuda, 1999; Usuda, Rouhier, Demura, & Fukuda, 1999). Based on these previous findings, in the presented study, in vitro activities of fourteen key enzymes of carbohydrate metabolism were determined in order to gain a deeper insight into the regulation of carbohydrate metabolism during sugar beet taproot development.
At the earliest stage of sugar beet taproot development (prestorage stage), cwInv, vacInv, and cytInv activities were the dominating carbohydrate‐metabolic enzyme activities (Table 4; Figure 5), which is in accordance with published data (Giaquinta, 1979; Godt & Roitsch, 2006; Klotz & Campbell, 2004; Klotz & Finger, 2001; Wan et al., 2018). Based on their observation of high cwInv activities in sugar beet taproots at 10 and 15 das, Godt and Roitsch (2006) proposed that in young sugar beet taproots, the apoplastic pathway is the main pathway for Suc unloading from the phloem. Thus, most of the Suc that is transported to the taproot was assumed to be hydrolyzed by cwInv in the apoplast, followed by an uptake of the hydrolysis products, Glc and Fru, into the parenchyma cells. High intracellular invertase activities, which were observed in our study, as well as in previous studies (Godt & Roitsch, 2006; Klotz & Campbell, 2004; Klotz & Finger, 2001) suggest that, nevertheless, a substantial amount of Suc is unloaded via the symplastic pathway, or unloaded into the apoplast and subsequently taken up into the parenchyma cells through carrier proteins or by endocytosis‐like processes (Getz, 2000; Godt & Roitsch, 2006). Part of this Suc may be hydrolyzed by cytInv in the cytoplasm, but most of it appears to be directly transported to the vacuole, where it is hydrolyzed by vacInv.
As a consequence of high invertase activities, hexose‐to‐Suc ratios were high at the prestorage stage (Table 4; Figure 3). High hexose levels at this stage may serve as sugar signals for cell division, as it has been observed for legume seed development (Borisjuk et al., 1998, 2002, 2003; Wang & Ruan, 2013). In this context, transgenic approaches (Neubohn, Gubatz, Wobus, & Weber, 2000; Weber et al., 1998) suggested that high hexose levels, as a consequence of high invertase activities, may contribute to keeping tissues in a developmentally juvenile, mitotically active state, while differentiation and storage processes are inhibited. Additionally, when located in the vacuole subsequent to Suc breakdown by vacInv, hexoses act as osmotically active substances which drive water uptake into the vacuole and, thus, growth by cell expansion (Beauvoit et al., 2014; Koch, 2004; Ross, Davies, Burch, Viola, & McRae, 1994; Sergeeva et al., 2006; Tang, Lüscher, & Sturm, 1999; Wang et al., 2010).
The Glc and Fru released from Suc by invertase activity can be phosphorylated by HXK and FK to G6P and F6P, respectively, which represent the active hexose forms that can enter various metabolic pathways (Halford, Curtis, Muttucumaru, Postles, & Mottram, 2011; Ruan, 2014). In vitro activities of HXK and FK were very low at 10 to 20 das (Figure 5; Dataset S2). At least for HXK, very low in vitro activities appear to be a common phenomenon in extracts from different tissues and species (Appeldoorn et al., 1997; Dai et al., 2011; Kortstee, Appeldoorn, Oortwijn, & Visser, 2007; Schaffer & Petreikov, 1997). In vitro activities, however, do not necessarily reflect the importance of enzymes in planta (Beauvoit et al., 2014; Quick & Schaffer, 1996). Additionally, in vitro enzyme activity assays represent averages of the activities present in all cell types of the extracted tissue. Therefore, it needs to be considered that there may be spatial patterns of enzyme activity within an organ (Bonfig et al., 2010; Goetz et al., 2001; McLaughlin & Boyer, 2004a, 2004b; Miller & Chourey, 1992; Polit & Ciereszko, 2012; Sergeeva & Vreugdenhil, 2002) and that the above‐mentioned enzymes may be highly active in certain tissues/cell types in order to ensure metabolite flux into growth‐related processes. This idea is supported by the considerable changes in the spatiotemporal dynamics of in situ enzyme activities for a set of other enzymes (SuSy, PGI, PGM, and G6PDH; Figure 8; Figures S1–S5) that we observed throughout sugar beet taproot development. Although in vitro activities for SuSy, PGI, PGM, and G6PDH were initially low, activities could be detected in situ in the tissues of the central cylinder from the earliest developmental stage onwards. We assume that these enzyme activities may be required to higher degrees in cells that are located close to the sites of phloem unloading, and in actively growing cambia, than in highly vacuolarized cortex cells and storage parenchyma cells. The activity patterns for these enzymes may be explained by the high demand for glycolytic energy production in these areas to drive growth and transport processes, as well as by the demand for cell wall compounds in actively growing/differentiating cells, as discussed for SuSy by Stein and Granot (2019). Therefore, it is not surprising that SuSy, PGI, PGM, and G6PDH are highly active in the phloem and the cambial area from the earliest growth stages onwards.
In summary, the earliest stage of sugar beet development appears to be a phase of primary growth and cell expansion, where high invertase activities create a strong sink for Suc, which seems to be a general prerequisite for taproot development (Tang et al., 1999). Both hexoses (Figure 3) and hexose phosphates (Figure 4) were found to continuously accumulate up to 60 das. As activities of all other analyzed enzymes were initially low, it appears that only parts of the carbohydrates arriving via the phloem are channeled into glycolysis and biosynthetic processes. It seems likely that a large proportion of the incoming carbohydrate is accumulated in the vacuole in the form of hexoses to create a driving force for cell expansion.
4.4. Metabolic changes and regulatory processes at the transition stage
As soon as primary development has been completed, sugar beet taproots enter a relatively long phase of metabolic change (30 to 60 das), during which Suc levels start to increase (Figure 3) and the first supernumerary cambia are initiated (Figure 2). The most obvious change to be observed at this stage is a steep decline in invertase activities, which is paralleled by an increase in activities of SuSy, PGI, PGM, PFK, UGPase, and G6PDH (Table 4; Figures 5 and 6).
As Suc is stored in the vacuole (Leigh et al., 1979), it cannot be accumulated to high levels as long as vacInv is highly active. Thus, a phase of high vacInv activity followed by a rapid decline is a typical signature for tissues that store high levels of Suc, whereas cytInv and cwInv enzymes may still be rather active in Suc‐storing tissues (reviewed by Koch, 2004; Quick & Schaffer, 1996). In developing sugar beet taproots, not only vacInv activity is almost completely lost during the transition stage, but cytInv and cwInv activities also decrease strongly (Godt & Roitsch, 2006; Klotz & Campbell, 2004; Klotz & Finger, 2001). It has been shown in a previous study (Godt & Roitsch, 2006) that this decrease in activities is due to a strong downregulation at the transcriptional level as far as vacInv and cwInv are concerned. In the presented study, vacInv enzyme activity rapidly declined from 15 das onwards (Figure 5). As the glycosylated vacInv proteins have been reported to be very stable (Rausch & Greiner, 2004), the involvement of proteinaceous invertase inhibitors in the regulation of vacInv activity has to be taken into consideration. These inhibitor proteins are important factors for the post‐translational regulation of invertase activities, and their action results in a faster decline of invertase enzyme activities than it can be achieved when the regulation happens solely on the transcriptional level (e.g., Bonfig et al., 2010; Dai et al., 2011; Katz et al., 2011; Li et al., 2017; Privat et al., 2008; Qin et al., 2016; Tang et al., 2017; Ziliotto, Begheldo, Rasori, Bonghi, & Tonutti, 2008).
Hexose levels further increase during the metabolic transition (Figure 3). This indicates that substantial amounts of Suc are still cleaved by the remaining invertases, and, increasingly, by SuSy at this stage. Due to the onset of Suc accumulation, however, the hexose‐to‐Suc ratio rapidly decreases (Figure 3). The accumulation of hexose phosphates starts to gradually level off at around 40 das (Figure 4), which suggests an increased use of carbohydrates for catabolism and for the synthesis of macromolecules from the transition stage onwards.
HXK and FK, enzymes involved in hexose phosphorylation, have been attributed dual functions as key players in developmental sugar signaling, by—independently of their catalytic activities—acting as sugar sensors and/or regulators of gene expression, activities of other enzymes, and hormonal interactions (reviewed by Granot, David‐Schwartz, & Kelly, 2013; Granot, Kelly, Stein, & David‐Schwartz, 2014; Sheen, 2014). The significance of HXK as a Glc sensor is clearest in photosynthetically active tissues, where it acts as a negative regulator of photosynthesis when Glc is abundant, whereas the exact mechanism of its regulatory function for growth processes is still relatively unclear (reviewed by Granot et al., 2014). A potential role of HXK1 in the integration of Glc and hormonal signals for root length control has recently been suggested (Kushwah & Laxmi, 2017). Additionally, HXK has been reported to be involved in the transcriptional regulation of cwInv and SuSy during fruit development (Wang, Li, Yang, & Gong, 2014; Zhang, Zhen, Tan, Li, & Wang, 2014). We observed that the levels of two transcripts annotated as predicted HXK1 isoforms increased in developing sugar beet taproots during the transition stage, in the absence of an increased HXK enzyme activity (data not shown). Thus, it may be speculated that HXK1 might also act as a sugar sensor in developing sugar beet taproots. Concerning FK, there is no evidence as yet for its functioning as a sugar sensor in a similar manner to HXK. Certain FK isoenzymes do, however, appear to act as regulators of vascular development, either by restricting, via their catalytic properties, the amount of Suc that may be used for vascular development (reviewed by Granot et al., 2013; Granot et al., 2014; Stein & Granot, 2018), or by other mechanisms that still need to be further elucidated (Stein et al., 2016, 2017). For example, it is assumed that high levels of cytosolic FK activity prevent product inhibition of SuSy by Fru and, therefore, promote the production of UDPGlc required for the biosynthesis of vascular cell wall polymers (reviewed by Granot et al., 2013; Granot et al., 2014). A role for FK in vascular development in developing sugar beet taproots may be hypothesized, as FK activity is (often transiently) upregulated when SuSy activity starts to gradually increase at the onset of anomalous secondary growth and vascular differentiation (Table 4; Figure 5).
Ald activity was transiently upregulated during the transition stage in sugar beet taproots (Table 4; Figure 6). Roles in plant growth and development have been identified for both plastidic (Cai, Li, Liu, Bi, & Ai, 2018; Haake, Zrenner, Sonnewald, & Stitt, 1998; Uematsu, Suzuki, Iwamae, Inui, & Yukawa, 2012) and cytosolic (Lao, Azuma, & Sakamoto, 2013; Schwab, Aharoni, Raab, Pérez, & Sanz, 2001) Ald isoenzymes, as well as for overall Ald activities (Houshmandfar, Asli, & Eghdami, 2011). In developing sugar beet taproots, the upregulation of Ald activity is concomitant with an (often transient) increase in FK activity (Table 4; Figure 5) and an increase in PFK activity (Table 4; Figure 6). The concerted upregulation of these three enzymes, in combination with the flattening of the hexose phosphate curves (Figure 4), suggests a gradual increase in the use of carbohydrates for glycolysis in order to cover the increasing demand for energy caused by the onset of secondary growth.
The developmental regulation of the analyzed phytohormones predominantly occurred during the transition stage, where (mainly) transient changes could be observed in active cytokinins (CK), indole‐acetic acid (IAA), and abscisic acid (ABA), as well as in the IAA‐to‐active‐CK ratio (Table 4; Figure 9). These observations are, basically, in accordance with the data of other authors, who analyzed phytohormone levels in developing sugar beet or red beet taproots: Hosford, Lenton, Milford, Pocock, and Elliott (1984), Elliott, Hosford, Smith, and Lawrence (1986), and Ozolina, Pradedova, and Salyaev (2005) all reported high levels of cytokinins and IAA during the initiation of supernumerary cambia, which decreased in parallel with an increase in ABA levels upon the onset of Suc storage. Distinct roles have been described for CK and IAA, as well as for brassinosteroids, gibberellins, ethylene, jasmonic acid, and strigolactones, in the regulation of cambial development (reviewed by Bhalerao & Fischer, 2014, 2016; Elo, Immanen, Nieminen, & Helariutta, 2009; Fischer, Kucukoglu, Helariutta, & Bhalerao, 2019; Lucas et al., 2013; Miyashima, Sebastian, Lee, & Helariutta, 2012; Ragni & Greb, 2018; Sorce, Giovannelli, Sebastiani, & Anfodillo, 2013; Ursache, Nieminen, & Helariutta, 2013; Zhang, Elo, & Helariutta, 2011). Cytokinins were found to be a prerequisite for cambial initiation in Arabidopsis (Mähönen et al., 2006; Matsumoto‐Kitano et al., 2008; Nieminen et al., 2008) and appear to be important regulators of secondary thickening in taproots of radish (Jang et al., 2015; Randall et al., 2015) and sweet potato (Ravi, Chakrabarti, Makeshkumar, & Saravanan, 2014). Auxin gradients were identified in stems of several tree species (Immanen et al., 2016; Tuominen, Puech, Fink, & Sundberg, 1997; Uggla, Magel, Moritz, & Sundberg, 2001; Uggla, Mellerowicz, & Sundberg, 1998; Uggla, Moritz, Sandberg, & Sundberg, 1996), with maximal auxin concentrations in actively dividing cambial cells and lower levels of auxin in areas of developing xylem, where auxin is, supposedly, involved in the regulation of vessel differentiation and spatial patterning (reviewed by Fischer et al., 2019; Hacke, Spicer, Schreiber, & Plavcová, 2017; Johnson et al., 2018). Recent findings in Arabidopsis suggest that these different effects of auxin on cambial stem cells and developing xylem are due to differences in auxin response mechanisms between these cell types which allow a fine‐tuned regulation of auxin effects on cell fate (Brackmann et al., 2018). It has also been shown that CKs and gibberellins, just like auxins, are unevenly distributed throughout the cambial region of poplar trees, with maximal concentrations in developing phloem and xylem, respectively, and functional evidence has been provided for spatial patterns of phytohormones in the cambial region of hybrid aspen (Immanen et al., 2016). Thus, high CK and IAA levels both agree with the onset of anomalous secondary growth in developing sugar beet taproots, with IAA supposedly stimulating cell division in the meristematic cells of the cambia and regulating xylem development, while CKs likely promote cell differentiation in the developing phloem of the cambial rings. In contrast to CK and IAA, the role of ABA in secondary growth is less clear. ABA is generally discussed to be a stress‐related hormone (reviewed by Fujita, Fujita, Shinozaki, & Yamaguchi‐Shinozaki, 2011; Nakashima & Yamaguchi‐Shinozaki, 2013; Vishwakarma et al., 2017) but has also been shown to be involved in various plant developmental processes (reviewed by Sah, Reddy, & Li, 2016). Saftner and Wyse (1984) presented direct evidence for a potential regulatory role of ABA on Suc accumulation in sugar beet. The authors found that Suc uptake was stimulated by ABA in sugar beet taproot disks, while IAA, and the combination of IAA and CK, acted as inhibitors of ABA‐stimulated Suc accumulation. ABA has also been reported to be a negative regulator of cell division (Fukaki & Tasaka, 2009; Zhang et al., 2010). Furthermore, ABA levels have also been suggested to restrict cell proliferation under unfavorable conditions, for example, by restricting cambial activity in woody species as a consequence of drought stress (Berta, Giovannelli, Sebastiani, Camussi, & Racchi, 2010; Luisi, Giovannelli, Traversi, Anichini, & Sorce, 2014). In this context, it may be speculated that the onset of Suc accumulation causes a transient phase of internal osmotic stress in sugar beet taproots due to the osmotic activity of Suc, as was also suggested by Oikawa et al. (2015) for developing pear fruits, and that ABA may mediate a short‐term reduction in cambial cell division during the period of physiological adaptation.
In summary, the transition stage is characterized by changes in most of the analyzed parameters, many of which are transient in nature. The changes observed on the enzymatic level suggest an extensive reprogramming of carbohydrate partitioning and sugar signaling. The (mainly) transient changes in the levels of IAA, active CKs, and ABA, as well as the transient increase in the IAA‐to‐active‐CK ratio at the transition stage appear to be involved in the regulation of the onset of secondary growth from the cambial rings and might simultaneously act as a trigger for the initiation of Suc storage.
4.5. Carbohydrate metabolism in sugar beet taproots during the secondary growth and sucrose accumulation stage
While invertase‐mediated sucrolytic activity is the prevalent enzymatic activity at the prestorage stage, the stage of secondary growth and Suc storage is characterized by a broader set of carbohydrate‐metabolic enzyme activities (SuSy, PGI, PGM, G6PDH, UGPase, PFK) which concomitantly increase from the transition stage onwards (Table 4; Figures 5 and 6). This can be explained by the fact that, at this stage, incoming carbohydrates need to be coordinately distributed between catabolism, macromolecule biosynthesis, and Suc storage. As invertase activity has repeatedly been found to be almost completely absent at this stage (Giaquinta, 1979; Godt & Roitsch, 2006; Klotz & Campbell, 2004; Klotz & Finger, 2001), phloem unloading in older sugar beet taproots is likely to occur predominantly via the symplastic pathway. Additionally, Suc may still be unloaded into the apoplast and subsequently taken up into the storage parenchyma cells through carrier proteins or by endocytosis‐like processes (Getz, 2000; Godt & Roitsch, 2006).
It is known from sugar cane that futile cycling, that is, the breakdown of Suc by SuSy and its re‐synthesis by SPS prior to storage, is one mechanism of Suc accumulation (Rohwer & Botha, 2001; Uys, Botha, Hofmeyr, & Rohwer, 2007). In agreement with previous findings (Fieuw & Willenbrink, 1987; Giaquinta, 1979), SPS activities were found to be low or non‐detectable in young sugar beet taproots (Table S2). Hence, it appears that there is no considerable contribution of futile cycling to the process of Suc accumulation at the early stages of taproot development. Increasing amounts of Suc are, presumably, directly transported into the vacuole for storage. The available information is limited and contradictory on whether SPS‐mediated re‐synthesis of Suc may be of relevance at later stages of taproot development: while Giaquinta (1979) does not report any detectable SPS activity up to 100 das, the data of Fieuw and Willenbrink (1987) and a recent study (Zhang et al., 2017) suggest on the enzyme activity and on the gene expression level, respectively, that SPS, and, thus, futile cycling contributes to Suc accumulation as beets mature.
In the course of the transition stage, Suc breakdown is gradually taken over by SuSy (Giaquinta, 1979; Godt & Roitsch, 2006; Klotz & Campbell, 2004; Klotz & Finger, 2001), which cleaves Suc into UDPGlc and Fru. SuSy is generally associated with biomass accumulation (Coleman, Beamish, Reid, Park, & Mansfield, 2010; Coleman, Ellis, Gilbert, & Mansfield, 2006; Wai, Zhang, Jones, Nagai, & Ming, 2017; Xu, Brill, Llewellyn, Furbank, & Ruan, 2012), and with a more mature developmental state (reviewed by Koch, 2004). High SuSy activities have been described to be characteristic for actively filling Suc sinks (Stein & Granot, 2019; Sung, Xu, & Black, 1989), and high levels of SuSy activity or gene expression have, for example, been observed in developing seeds, fruits or tubers in various plant species (Chen et al., 2017; Miao et al., 2016; Minhas, Rai, & Saini, 2004; Mitsui et al., 2015; Ricardo & Sovia, 1974; Shuai et al., 2016; Sturm, 1996; Sturm et al., 1995; Sung et al., 1989; Tang & Sturm, 1999; Usuda, Demura, et al., 1999; Usuda, Rouhier, et al., 1999; Weber et al., 1995, 1996; Weber, Borisjuk, et al., 1996; Weber Borisjuk & Wobus, 1997; Yu et al., 2016; Zhang et al., 2012, 2017; Zhu et al., 2017; Zrenner, Salanoubat, Willmitzer, & Sonnewald, 1995). The UDPGlc resulting from SuSy activity can either be fed into the hexose phosphate pool by conversion to G1P via UGPase, or directly be used for macromolecule‐biosynthetic processes to meet the increasing demand for cell wall compounds (Granot et al., 2013, 2014; Koch, 2004; Payyavula et al., 2014; Ruan, Llewellyn, & Furbank, 2003; de Souza et al., 2018; Stein & Granot, 2019; Sturm & Tang, 1999; Verbančič, Lunn, Stitt, & Persson, 2018; Wai et al., 2017). High SuSy activities at the sites of secondary wall formation in the cambial region of scots pine (Uggla et al., 2001) and a few other studies recently reviewed by Stein and Granot (2019) provide direct evidence for an important role of this enzyme during secondary thickening.
Like for SuSy, developmental regulation in various plant species and organs has also been observed for the other enzymes that are upregulated in developing sugar beet taproots at the onset of secondary growth and sucrose storage. For some of the enzymes, roles in sink development have previously been identified. The respective information will be discussed in this paragraph. High PGI and PGM activities at 60 and 80 das suggest that a high level of interconversion takes place between the compounds of the hexose phosphate pool (G6P, G1P, and F6P). PGI and PGM have been found to be developmentally regulated in a variety of plant organs and species (Biais et al., 2014; Dai et al., 2011; Egli, Kolling, Kohler, Zeeman, & Streb, 2010; Fernie et al., 2002; Gao, Petreikov, Zamski, & Schaffer, 1999; Ghaffari et al., 2016; Li et al., 2013; Malinova et al., 2014; Schaffer & Petreikov, 1997). High PGI and PGM activities during secondary growth and sucrose storage in sugar beet might ensure the required distribution of carbohydrates between various metabolic pathways, such as glycolysis (F6P; via PFK), cell wall synthesis (G1P; via UGPase), and the oxidative pentose phosphate pathway (G6P; via G6PDH) that channels hexoses toward the biosynthetic pathways for molecules such as nucleotides, aromatic amino acids, and the reductant NADPH (Kruger & von Schaewen, 2003). G6PDH, a key enzyme of the oxidative pentose phosphate cycle, has also been found to be developmentally regulated in different organs (Biais et al., 2014; Ghaffari et al., 2016; Hawker, 1969; Kong et al., 2007). An increase in G6PDH activity in developing sugar beet taproots might be a sign of an activation of the oxidative pentose phosphate cycle for nucleotide and/or lipid production, as suggested by Biais et al. (2014). UGPase has, for example, been shown to be important for Suc synthesis (Decker & Kleczkowski, 2019; Kleczkowski, Decker, & Wilczynska, 2011) and for overall plant growth (Coleman et al., 2006, 2010; Park et al., 2010; Wang et al., 2011). In developing sugar beet taproots, high UGPase activities might indicate the channeling of carbohydrates toward biosynthesis pathways for cell wall compounds. PFK, the glycolytic bottleneck enzyme, was found to be related to metabolite composition in storage organs (Bourgis et al., 2011; Thomas, Mooney, Burrell, & Fell, 1997) and has been shown to be upregulated during fruit development (Martínez‐Esteso, Sellés‐Marchart, Lijavetzky, Pedreño, & Bru‐Martínez, 2011). However, the role of PFK regulation for plant development is still unclear. Our findings concerning the above‐discussed enzymes are in very good accordance with gene expression data from a previous study (Bellin, 2005; Bellin et al., 2007), in which genes coding for SuSy, glycolytic enzymes (Ald, PFK), and several enzymes involved in cell wall biosynthesis were found to be highly expressed at a comparable developmental stage. Four of the enzymes that showed high in vitro activities at later developmental stages (SuSy, PGI, PGM, G6PDH) were also included in our in situ activity staining approach. For these enzymes, the high in vitro activities at this stage can be explained by a presence of enzyme activity in large parts of the cross‐sections of the beets, with activities being highest in the cambial rings and conductive tissues.
Taken together, as soon as anomalous secondary thickening starts in sugar beet taproots, a large part of the incoming Suc appears to be directly transported into the vacuole for storage. The rest of the carbohydrate is, supposedly, fed into the hexose phosphate pool, from where it can be distributed between glycolysis and biosynthetic processes in order to meet the demand for cell wall macromolecules, cellular compounds, and energy for secondary growth.
4.6. Developmental signatures are robustly observable and independent of growth conditions and location
In order to assess the robustness of the information obtained in the first set of experiments in location A (Graz, Austria), the experiments were repeated in two additional locations (B, Tulln, Austria; C, Taastrup, Denmark). The differences between locations regarding biomass accumulation (Table 2) can be explained by differences in environmental conditions in the respective greenhouses that were caused by differences in the technical equipment, such as types of soils, brands of lamps used for supplemental illumination, technical limitations of temperature control, and watering routines. In addition, differences in natural day lengths due to the geographical position and the time of year when the individual experiments were grown also influenced plant growth. As both temperatures and light availability are crucial factors for plant growth, differences in these parameters will automatically lead to differences in overall growth and taproot biomass (Clarke et al., 1995; Jaggard & Qi, 2006; Kenter et al., 2006; Qu et al., 2013). Since in locations B and C only eight out of the fourteen enzymes were measured, a comparison for only those enzymes is shown in Table 3. Despite differences in growth rates and, thus, biomass accumulation, the developmental activity signatures for all eight measured enzymes were reliably reproducible in the three locations. The activities of vacInv and cwInv constantly declined, while those of SuSy, PGI, PGM, G6PDH, and PFK constantly increased, and Ald showed a transient peak. The developmental shift to secondary growth and sucrose storage occurred after a shorter period of time in locations B (30 to 40 days after sowing) and C (20 to 30 days after sowing). This can most likely be explained by the growth conditions that were more tightly controlled in these locations, which accelerated biomass accumulation. As stated by Biais et al. (2014), this high reproducibility under different growth conditions indicates that environmental conditions have surprisingly little influence on the developmental program of taproot metabolism, which can be characterized by robust physiological fingerprints, especially by distinct enzyme activity signatures.
5. CONCLUSIONS
The combination of various physiological, biochemical, and molecular methods in combination with anatomical studies resulted in a detailed physiological characterization of early‐stage sugar beet taproot development. Robust developmental patterns in enzyme activity signatures, as well as in metabolite and phytohormone levels could be observed. Independent experiments in three locations and, thus, under different growth conditions showed that, notably, the observed enzymatic signatures only differed in their temporal dynamics depending on the prevailing conditions in the greenhouses. Taken together, our comprehensive dataset allowed, based on anatomical parameters and physiological fingerprints, the identification of three distinct metabolic phases: a prestorage stage, a transition stage, and a secondary growth and sucrose accumulation stage. The prestorage stage is characterized by high invertase activities and high hexose‐to‐Suc ratios, while the secondary growth and sucrose accumulation stage is characterized by a broader set of highly active enzymes (SuSy, PGI, PGM, PFK, G6PDH, UGPase) and high sucrose levels. These two stages are connected by a transition stage that is characterized by (mainly) transient increases in FK and Ald activities and by (mainly) transient increases in the levels of active CKs, IAA, and ABA, and in the IAA‐to‐active‐CK ratio.
The physiological and anatomical datasets from this study highlight the importance of the early stages of sugar beet taproot development, which determine the ultimate sink strength and, thus, the potential for total Suc accumulation. However, large‐scale transcriptomic and metabolomic analyses, as well as mechanistic studies in transgenic sugar beet plants will be required in the future. In addition, 13C‐based metabolic flux experiments or flux modeling strategies based on the physiological data will have to be employed to gain a detailed understanding of carbohydrate partitioning in developing sugar beet taproots. A holistic picture of taproot development obtained from the combination of all this information might, eventually, allow a reliable identification of the metabolic key determinants of taproot formation and sucrose accumulation, and an elucidation of the factor(s) responsible for the negative coupling of biomass formation and sucrose storage.
Beyond academic interest, comprehensive physiological datasets like ours also provide a valuable, yet largely unexplored resource for applications in both classical breeding and biotechnological approaches for crop improvement. Despite the great progress that has been made, a knowledge gap still remains in understanding which plant physiological determinants will influence crop phenotypes, notably key agronomic traits like yield, as a consequence of the complex genotype‐environment‐management interaction. Thus, information obtained by genomics and remote sensing phenotyping will need to be complemented by deep physiological phenotyping (Großkinsky, Svensgaard, Christensen, & Roitsch, 2015; Großkinsky, Syaifullah, & Roitsch, 2018) within a holistic phenomics approach (Furbank & Tester, 2011; Tardieu, Cabrera‐Bosquet, Pridmore, & Bennett, 2017) in order to be truly functional (York, 2019). The establishment of robust physiological signatures will allow the recognition of predispositions, the establishment of predictive biomarkers for breeding and precision agriculture, and the verification of optical sensor‐based data. There are several published examples where physiological parameters, such as metabolite levels, measured at certain developmental stages could be associated with crop performance in the field (e.g., Cañas et al., 2017; Fernandez et al., 2019; Lamari et al., 2018). However, the identification of suitable physiological markers for crop improvement requires a validation of laboratory data in field studies and correlation analyses. Classical physiological assays performed at a semi‐high or high‐throughput scale, such as the enzyme activity assays used in this study, contribute to facilitating the data collection process for physiological marker‐based plant breeding.
CONFLICT OF INTEREST
The authors declare that the research was conducted in the absence of any commercial or financial relationships that could be construed as a potential conflict of interest.
AUTHOR CONTRIBUTIONS
T.R., W.K., and B.S. conceived the research plans; A.J., T.R., E.G., A.A., and H.W.P. designed the experiments; A.J. performed the experiments; T.R., A.A., and H.W.P. supervised the experiments; A.J., E.G., and F.W. analyzed the data; A.J. wrote the article with contributions from all of the authors; T.R. supervised and complemented the writing.
Supporting information
Figure S1‐S5
Table S1‐S3
Dataset S1–S3
Supplementary Material
Supplementary Material
ACKNOWLEDGMENTS
The authors would like to thank Anna Luidold, Peter Krbez, Tanja Mayer, Ursula Janschek, Klaus Remele, and Volker Wolkinger (Graz), Sara Crespo Martinez, and Zoreh Salehi‐Soghadi (Tulln), and Hanne Nielsen (Taastrup) for technical assistance.
Jammer A, Albacete A, Schulz B, et al. Early‐stage sugar beet taproot development is characterized by three distinct physiological phases. Plant Direct. 2020;4:1–29. 10.1002/pld3.221
Funding information
The research was funded by KWS Saat SE & Co. KGaA (Regulation von Biomasseaufbau und Zuckerakkumulation, Einbeck, Germany) and supported by the Ministry of Education, Youth and Sports of CR within the National Sustainability Program I (NPU I; grant number LO1415) and The Czech Science Foundation (Grantová Agentura České Republiky, GA CR; grant number 15‐17367S), Czech Republic.
Contributor Information
Alexandra Jammer, Email: alexandra.jammer@uni-graz.at.
Thomas G. Roitsch, Email: roitsch@plen.ku.dk.
REFERENCES
- Appeldoorn, N. J. G. , de Bruijn, S. M. , Koot‐Gronsveld, E. A. M. , Visser, R. G. F. , Vreugdenhil, D. , & van der Plas, L. H. W. (1997). Developmental changes of enzymes involved in conversion of sucrose to hexose‐phosphate during early tuberisation of potato. Planta, 202, 220–226. 10.1007/s004250050122 [DOI] [Google Scholar]
- Artschwager, E. (1926). Anatomy of the vegetative organs of the sugar beet. Journal of Agricultural Research, 33, 143–176. [Google Scholar]
- Artschwager, E. (1930). A study of the structure of sugar beets in relation to sugar content and type. Journal of Agricultural Research, 40, 867–915. [Google Scholar]
- Balibrea Lara, M.‐E. , Gonzalez Garcia, M. , Fatima, T. , Ehneß, R. , Lee, T. K. , Proels, R. , … Roitsch, T. (2004). Extracellular invertase is an essential component of cytokinin mediated delay of senescence. The Plant Cell, 16, 1276–1287. 10.1105/tpc.018929 [DOI] [PMC free article] [PubMed] [Google Scholar]
- Beauvoit, B. P. , Colombié, S. , Monier, A. , Andrieu, M.‐H. , Biais, B. , Bénard, C. , … Gibon, Y. (2014). Model‐assisted analysis of sugar metabolism throughout tomato fruit development reveals enzyme and carrier properties in relation to vacuole expansion. The Plant Cell, 26, 3224–3242. 10.1105/tpc.114.127761 [DOI] [PMC free article] [PubMed] [Google Scholar]
- Bell, C. I. , Milford, G. F. J. , & Leigh, R. A. (1996). Sugar beet In Schaffer A. A., & Zamski E. (Eds.), Photoassimilate distribution in plants and crops. Source‐sink relationships (pp. 691–707). New York, NY: Marcel Dekker. [Google Scholar]
- Bellin, D. (2005). Macroarray analysis of gene transcription during sucrose accumulation in sugar beet (Beta vulgaris L.) root: Identification of developmental and metabolism related candidate genes. Cologne, Germany: University of Cologne. PhD thesis. [Google Scholar]
- Bellin, D. , Schulz, B. , Soerensen, T. R. , Salamini, F. , & Schneider, K. (2007). Transcript profiles at different growth stages and tap‐root zones identify correlated developmental and metabolic pathways of sugar beet. Journal of Experimental Botany, 58, 699–715. 10.1093/jxb/erl245 [DOI] [PubMed] [Google Scholar]
- Bellin, D. , Werber, M. , Theis, T. , Schulz, B. , Weisshaar, B. , & Schneider, K. (2002). EST sequencing, annotation and macroarray transcriptome analysis identify preferentially root‐expressed genes in sugar beet. Plant Biology, 4, 700–710. 10.1055/s-2002-37405 [DOI] [Google Scholar]
- Bergen, P. (1967). Dry matter of the petiole as an index for the selection of sugar beet plants. Journal of the American Society of Sugar Beet Technologists, 14, 396–399. 10.5274/jsbr.14.5.396 [DOI] [Google Scholar]
- Berta, M. , Giovannelli, A. , Sebastiani, F. , Camussi, A. , & Racchi, M. L. (2010). Transcriptome changes in the cambial region of poplar (Populus alba L.) in response to water deficit. Plant Biology, 12, 341–354. 10.1111/j.1438-8677.2009.00320.x [DOI] [PubMed] [Google Scholar]
- Bhalerao, R. P. , & Fischer, U. (2014). Auxin gradients across wood ‐ instructive or incidental? Physiologia Plantarum, 151, 43–51. 10.1111/ppl.12134 [DOI] [PubMed] [Google Scholar]
- Bhalerao, R. P. , & Fischer, U. (2016). Environmental and hormonal control of cambial stem cell dynamics. Journal of Experimental Botany, 68, 79–87. 10.1093/jxb/erw466 [DOI] [PubMed] [Google Scholar]
- Biais, B. , Bénard, C. , Beauvoit, B. , Colombié, S. , Prodhomme, D. , Ménard, G. , … Gibon, Y. (2014). Remarkable reproducibility of enzyme activity profiles in tomato fruits grown under contrasting environments provides a roadmap for studies of fruit metabolism. Plant Physiology, 164, 1204–1221. 10.1104/pp.113.231241 [DOI] [PMC free article] [PubMed] [Google Scholar]
- Bonfig, K. B. , Gabler, A. , Simon, U. K. , Luschin‐Ebengreuth, N. , Hatz, M. , Berger, S. , … Roitsch, T. (2010). Post‐translational derepression of invertase activity in source leaves via down‐regulation of invertase inhibitor expression is part of the plant defense response. Molecular Plant, 3, 1037–1048. 10.1093/mp/ssq053 [DOI] [PubMed] [Google Scholar]
- Bonfig, K. B. , Schreiber, U. , Gabler, A. , Roitsch, T. , & Berger, S. (2006). Infection with virulent and avirulent P. syringae strains differentially affects photosynthesis and sink metabolism in Arabidopsis leaves. Planta, 225, 1–12. 10.1007/s00425-006-0303-3 [DOI] [PubMed] [Google Scholar]
- Borisjuk, L. , Rolletschek, H. , Radchuk, R. , Weschke, W. , Wobus, U. , & Weber, H. (2004). Seed development and differentiation: A role for metabolic regulation. Plant Biology, 6, 375–386. 10.1055/s-2004-817908 [DOI] [PubMed] [Google Scholar]
- Borisjuk, L. , Rolletschek, H. , Wobus, U. , & Weber, H. (2003). Differentiation of legume cotyledons as related to metabolic gradients and assimilate transport into seeds. Journal of Experimental Botany, 54, 503–512. 10.1093/jxb/erg051 [DOI] [PubMed] [Google Scholar]
- Borisjuk, L. , Walenta, S. , Rolletschek, H. , Mueller‐Klieser, W. , Wobus, U. , & Weber, H. (2002). Spatial analysis of plant metabolism: Sucrose imaging within Vicia faba cotyledons reveals specific developmental patterns. The Plant Journal, 29, 521–530. 10.1046/j.1365-313x.2002.01222.x [DOI] [PubMed] [Google Scholar]
- Borisjuk, L. , Walenta, S. , Weber, H. , Mueller‐Klieser, W. , & Wobus, U. (1998). High‐resolution histographical mapping of glucose concentrations in developing cotyledons of Vicia faba in relation to mitotic activity and storage processes: Glucose as a possible developmental trigger. The Plant Journal, 15, 583–591. 10.1046/j.1365-313X.1998.00214.x [DOI] [Google Scholar]
- Bosemark, N. O. (2006). Genetics and breeding In Draycott A. P. (Ed.), Sugar beet (pp. 50–88). Oxford, UK: Blackwell. [Google Scholar]
- Bourgis, F. , Kilaru, A. , Cao, X. , Ngando‐Ebongue, G. , Drira, N. , Ohlrogge, J. B. , & Arondel, V. (2011). Comparative transcriptome and metabolite analysis of oil palm and date palm mesocarp that differ dramatically in carbon partitioning. Proceedings of the National Academy of Sciences USA, 108, 12527–12532. 10.1073/pnas.1106502108 [DOI] [PMC free article] [PubMed] [Google Scholar]
- Brackmann, K. , Qi, J. , Gebert, M. , Jouannet, V. , Schlamp, T. , Grünwald, K. , … Greb, T. (2018). Spatial specificity of auxin responses coordinates wood formation. Nature Communications, 9, 875 10.1038/s41467-018-03256-2 [DOI] [PMC free article] [PubMed] [Google Scholar]
- Braun, D. M. , Wang, L. , & Ruan, Y. (2014). Understanding and manipulating sucrose phloem loading, unloading, metabolism, and signalling to enhance crop yield and food security. Journal of Experimental Botany, 65, 1713–1735. 10.1093/jxb/ert416 [DOI] [PubMed] [Google Scholar]
- Cai, B. , Li, Q. , Liu, F. , Bi, H. , & Ai, X. (2018). Decreasing fructose‐1,6‐bisphosphate aldolase activity reduces plant growth and tolerance to chilling stress in tomato seedlings. Physiologia Plantarum, 163, 247–258. 10.1111/ppl.12682 [DOI] [PubMed] [Google Scholar]
- Cañas, R. A. , Yesbergenova‐Cuny, Z. , Simons, M. , Chardon, F. , Armengaud, P. , Quilleré, I. , … Hirel, B. (2017). Exploiting the genetic diversity of maize using a combined metabolomic, enzyme activity profiling, and metabolic modeling approach to link leaf physiology to kernel yield. The Plant Cell, 29, 919–943. 10.1105/tpc.16.00613 [DOI] [PMC free article] [PubMed] [Google Scholar]
- Chen, C. , Yuan, Y. , Zhang, C. , Li, H. , Ma, F. , & Li, M. (2017). Sucrose phloem unloading follows an apoplastic pathway with high sucrose synthase in Actinidia fruit. Plant Science, 255, 40–50. 10.1016/j.plantsci.2016.11.011 [DOI] [PubMed] [Google Scholar]
- Clarke, N. A. , Hetschkun, H. M. , Redfearn, M. , Thomas, T. H. , & Naumenko, V. (1995). Responses and tolerance of sugar beet to stress. Proceedings from the 28th Biennial Meeting of the American Society of Sugar Beet Technologists: 189–197. [Google Scholar]
- Coleman, H. D. , Beamish, L. , Reid, A. , Park, J. , & Mansfield, S. D. (2010). Altered sucrose metabolism impacts plant biomass production and flower development. Transgenic Research, 19, 269–283. 10.1007/s11248-009-9309-5 [DOI] [PubMed] [Google Scholar]
- Coleman, H. D. , Ellis, D. D. , Gilbert, M. , & Mansfield, S. D. (2006). Up‐regulation of sucrose synthase and UDP‐glucose pyrophosphorylase impacts plant growth and metabolism. Plant Biotechnology Journal, 4, 87–101. 10.1111/j.1467-7652.2005.00160.x [DOI] [PubMed] [Google Scholar]
- Cuesta‐Seijo, J. A. , De Porcellinis, A. J. , Valente, A. H. , Striebeck, A. , Voss, C. , Marri, L. , … Braumann, I. (2019). Amylopectin chain length dynamics and activity signatures of key carbon metabolic enzymes highlight early maturation as culprit for yield reduction of barley endosperm starch after heat stress. Plant and Cell Physiology, 60, 2692–2706. 10.1093/pcp/pcz155 [DOI] [PMC free article] [PubMed] [Google Scholar]
- Dai, N. , Cohen, S. , Portnoy, V. , Tzuri, G. , Harel‐Beja, R. , Pompan‐Lotan, M. , … Schaffer, A. A. (2011). Metabolism of soluble sugars in developing melon fruit: A global transcriptional view of the metabolic transition to sucrose accumulation. Plant Molecular Biology, 76, 1–18. 10.1007/s11103-011-9757-1 [DOI] [PubMed] [Google Scholar]
- de Souza, G. A. , dos Santos Dias, D. C. F. , Pimenta, T. M. , Almeida, A. L. , de Toledo Picoli, E. A. , de Pádua, A. A. , & da Silva, J. C. F. (2018). Sugar metabolism and developmental stages of rubber tree (Hevea brasiliensis L.) seeds. Physiologia Plantarum, 162, 495–505. 10.1111/ppl.12650 [DOI] [PubMed] [Google Scholar]
- Decker, D. , & Kleczkowski, L. A. (2019). UDP‐Sugar producing pyrophosphorylases: Distinct and essential enzymes with overlapping substrate specificities, providing de novo precursors for glycosylation reactions. Frontiers in Plant Science, 9, 1822 10.3389/fpls.2018.01822 [DOI] [PMC free article] [PubMed] [Google Scholar]
- Doney, D. L. (1979). Seedling physiology and sugarbeet yield. Journal of the American Society of Sugar Beet Technologists, 20, 399–418. 10.5274/jsbr.20.4.399 [DOI] [Google Scholar]
- Doney, D. L. , Wyse, R. E. , & Theurer, J. C. (1981). The relationship between cell size, yield, and sucrose concentration of the sugar beet root. Canadian Journal of Plant Science, 61, 447–453. 10.4141/cjps81-060 [DOI] [Google Scholar]
- Durr, C. , & Boiffin, J. (1995). Sugarbeet seedling growth from germination to first leaf stage. The Journal of Agricultural Science, 124, 427–435. 10.1017/S002185960007338X [DOI] [Google Scholar]
- Egli, B. , Kolling, K. , Kohler, C. , Zeeman, S. C. , & Streb, S. (2010). Loss of cytosolic phosphoglucomutase compromises gametophyte development in Arabidopsis. Plant Physiology, 154, 1659–1671. 10.1104/pp.110.165027 [DOI] [PMC free article] [PubMed] [Google Scholar]
- Ehneß, R. , Ecker, M. , Godt, D. , & Roitsch, T. (1997). Glucose and stress independently regulate source/sink relations and defense mechanisms via signal transduction pathways involving protein phosphorylation. The Plant Cell, 9, 1825–1841. 10.1105/tpc.9.10.1825 [DOI] [PMC free article] [PubMed] [Google Scholar]
- Elliott, M. C. , Hosford, D. J. , Smith, J. I. , & Lawrence, D. K. (1986). Opportunities for regulation of sugar beet storage root growth. Biologia Plantarum, 28, 1–8. 10.1007/BF02885310 [DOI] [Google Scholar]
- Elliott, M. , & Weston, G. (1993). Biology and physiology of the sugar‐beet plant In Cooke D. A. (Ed.), The sugar beet crop. Science into practice (pp. 37–66). London, UK: Chapman & Hall. [Google Scholar]
- Elo, A. , Immanen, J. , Nieminen, K. , & Helariutta, Y. (2009). Stem cell function during plant vascular development. Seminars in Cell & Developmental Biology, 20, 1097–1106. 10.1016/j.semcdb.2009.09.009 [DOI] [PubMed] [Google Scholar]
- Etzold, H. (2002). Simultanfärbung von Pflanzenschnitten mit Fuchsin, Chrysoidin und Astrablau. Mikrokosmos, 91, 316–318. [Google Scholar]
- Fasahat, P. , Aghaeezadeh, M. , Jabbari, L. , Sadeghzadeh Hemayati, S. , & Townson, P. (2018). Sucrose accumulation in sugar beet: From fodder beet selection to genomic selection. Sugar Tech, 20, 635–644. 10.1007/s12355-018-0617-z [DOI] [Google Scholar]
- Fernandez, O. , Urrutia, M. , Berton, T. , Bernillon, S. , Deborde, C. , Jacob, D. , … Moing, A. (2019). Metabolomic characterization of sunflower leaf allows discriminating genotype groups or stress levels with a minimal set of metabolic markers. Metabolomics, 15, 56 10.1007/s11306-019-1515-4 [DOI] [PMC free article] [PubMed] [Google Scholar]
- Fernie, A. R. , Tauberger, E. , Roessner, U. , Willmitzer, L. , Trethewey, R. , & Lytovchenko, A. (2002). Antisense repression of cytosolic phosphoglucomutase in potato (Solanum tuberosum) results in severe growth retardation, reduction in tuber number and altered carbon metabolism. Planta, 214, 510–520. 10.1007/s004250100644 [DOI] [PubMed] [Google Scholar]
- Fieuw, S. , & Willenbrink, J. (1987). Sucrose synthase and sucrose phosphate synthase in sugar beet plants (Beta vulgaris L. ssp. altissima). Journal of Plant Physiology, 131, 153–162. 10.1016/S0176-1617(87)80276-6 [DOI] [Google Scholar]
- Fieuw, S. , & Willenbrink, J. (1990). Sugar transport and sugar‐metabolizing enzymes in sugar beet storage roots (Beta vulgaris ssp. altissima). Journal of Plant Physiology, 137, 216–223. 10.1016/S0176-1617(11)80084-2 [DOI] [Google Scholar]
- Fimognari, L. , Dölker, R. , Kaselyte, G. , Jensen, C. N. G. , Akhtar, S. S. , Großkinsky, D. K. , & Roitsch, T. (2020). Simple semi‐high throughput determination of activity signatures of key antioxidant enzymes for physiological phenotyping. Plant Methods, 16, 42 10.1186/s13007-020-00583-8 [DOI] [PMC free article] [PubMed] [Google Scholar]
- Fischer, U. , Kucukoglu, M. , Helariutta, Y. , & Bhalerao, R. P. (2019). The dynamics of cambial stem cell activity. Annual Review of Plant Biology, 70, 293–319. 10.1146/annurev-arplant-050718-100402 [DOI] [PubMed] [Google Scholar]
- Freckleton, R. P. , Watkinson, A. R. , J. Webb, D. , & Thomas, T. H. (1999). Yield of sugar beet in relation to weather and nutrients. Agricultural and Forest Meteorology, 93, 39–51. 10.1016/S0168-1923(98)00106-3 [DOI] [Google Scholar]
- Fujita, Y. , Fujita, M. , Shinozaki, K. , & Yamaguchi‐Shinozaki, K. (2011). ABA‐mediated transcriptional regulation in response to osmotic stress in plants. Journal of Plant Research, 124, 509–525. 10.1007/s10265-011-0412-3 [DOI] [PubMed] [Google Scholar]
- Fukaki, H. , & Tasaka, M. (2009). Hormone interactions during lateral root formation. Plant Molecular Biology, 69, 437–449. 10.1007/s11103-008-9417-2 [DOI] [PubMed] [Google Scholar]
- Furbank, R. T. , & Tester, M. (2011). Phenomics—technologies to relieve the phenotyping bottleneck. Trends in Plant Science, 16, 635–644. 10.1016/j.tplants.2011.09.005 [DOI] [PubMed] [Google Scholar]
- Gao, Z. , Petreikov, M. , Zamski, E. , & Schaffer, A. A. (1999). Carbohydrate metabolism during early fruit development of sweet melon (Cucumis melo). Physiologia Plantarum, 106, 1–8. 10.1034/j.1399-3054.1999.106101.x [DOI] [Google Scholar]
- Gasperl, A. , Morvan‐Bertrand, A. , Prud'homme, M. , van der Graaff, E. , & Roitsch, T. (2016). Exogenous classic phytohormones have limited regulatory effects on fructan and primary carbohydrate metabolism in perennial ryegrass (Lolium perenne L.). Frontiers in Plant Science, 6, 1251 10.3389/fpls.2015.01251 [DOI] [PMC free article] [PubMed] [Google Scholar]
- Getz, H. (2000). Sucrose accumulation and synthesis in sugar beets. Developments in Crop Science, 26, 55–77. 10.1016/S0378-519X(00)80004-5 [DOI] [Google Scholar]
- Ghaffari, M. R. , Shahinnia, F. , Usadel, B. , Junker, B. , Schreiber, F. , Sreenivasulu, N. , & Hajirezaei, M. R. (2016). The metabolic signature of biomass formation in barley. Plant and Cell Physiology, 57, 1943–1960. 10.1093/pcp/pcw117 [DOI] [PubMed] [Google Scholar]
- Giaquinta, R. (1979). Sucrose translocation and storage in the sugar beet. Plant Physiology, 63, 828–832. 10.1104/pp.63.5.828 [DOI] [PMC free article] [PubMed] [Google Scholar]
- Gibon, Y. , Blaesing, O. E. , Hannemann, J. , Carillo, P. , Höhne, M. , Hendriks, J. H. M. , … Stitt, M. (2004). A robot‐based platform to measure multiple enzyme activities in arabidopsis using a set of cycling assays: Comparison of changes of enzyme activities and transcript levels during diurnal cycles and in prolonged darkness. The Plant Cell, 16, 3304–3325. 10.1105/tpc.104.025973 [DOI] [PMC free article] [PubMed] [Google Scholar]
- Gibon, Y. , Vigeolas, H. , Tiessen, A. , Geigenberger, P. , & Stitt, M. (2002). Sensitive and high throughput metabolite assays for inorganic pyrophosphate, ADPGlc, nucleotide phosphates, and glycolytic intermediates based on a novel enzymic cycling system. The Plant Journal, 30, 221–235. 10.1046/j.1365-313X.2001.01278.x [DOI] [PubMed] [Google Scholar]
- Godt, D. , & Roitsch, T. (2006). The developmental and organ specific expression of sucrose cleaving enzymes in sugar beet suggests a transition between apoplasmic and symplasmic phloem unloading in the tap roots. Plant Physiology and Biochemistry, 44, 656–665. 10.1016/j.plaphy.2006.09.019 [DOI] [PubMed] [Google Scholar]
- Goetz, M. , Godt, D. , Guivarc'h, A. , Kahmann, U. , Chriqui, D. , & Roitsch, T. (2001). Induction of male sterility in plants by metabolic engineering. Proceedings of the National Academy of Sciences USA, 98, 6522–6527. 10.1073/pnas.091097998 [DOI] [PMC free article] [PubMed] [Google Scholar]
- Granot, D. , David‐Schwartz, R. , & Kelly, G. (2013). Hexose kinases and their role in sugar‐sensing and plant development. Frontiers in Plant Science, 4, 44 10.3389/fpls.2013.00044 [DOI] [PMC free article] [PubMed] [Google Scholar]
- Granot, D. , Kelly, G. , Stein, O. , & David‐Schwartz, R. (2014). Substantial roles of hexokinase and fructokinase in the effects of sugars on plant physiology and development. Journal of Experimental Botany, 65, 809–819. 10.1093/jxb/ert400 [DOI] [PubMed] [Google Scholar]
- Großkinsky, D. K. , Albacete, A. A. , Jammer, A. , Krbez, P. , van der Graaff, E. , Pfeifhofer, H. , & Roitsch, T. (2014). A rapid phytohormone and phytoalexin screening method for physiological phenotyping. Molecular Plant, 7, 1053–1056. 10.1093/mp/ssu015 [DOI] [PubMed] [Google Scholar]
- Großkinsky, D. K. , Svensgaard, J. , Christensen, S. , & Roitsch, T. (2015). Plant phenomics and the need for physiological phenotyping across scales to narrow the genotype‐to‐phenotype knowledge gap. Journal of Experimental Botany, 66, 5429–5440. 10.1093/jxb/erv345 [DOI] [PubMed] [Google Scholar]
- Großkinsky, D. K. , Syaifullah, S. J. , & Roitsch, T. (2018). Integration of multi‐omics techniques and physiological phenotyping within a holistic phenomics approach to study senescence in model and crop plants. Journal of Experimental Botany, 69, 825–844. 10.1093/jxb/erx333 [DOI] [PubMed] [Google Scholar]
- Haake, V. , Zrenner, R. , Sonnewald, U. , & Stitt, M. (1998). A moderate decrease of plastid aldolase activity inhibits photosynthesis, alters the levels of sugars and starch, and inhibits growth of potato plants. The Plant Journal, 14, 147–157. 10.1046/j.1365-313X.1998.00089.x [DOI] [PubMed] [Google Scholar]
- Hacke, U. G. , Spicer, R. , Schreiber, S. G. , & Plavcová, L. (2017). An ecophysiological and developmental perspective on variation in vessel diameter. Plant, Cell & Environment, 40, 831–845. 10.1111/pce.12777 [DOI] [PubMed] [Google Scholar]
- Halford, N. G. , Curtis, T. Y. , Muttucumaru, N. , Postles, J. , & Mottram, D. S. (2011). Sugars in crop plants. Annals of Applied Biology, 158, 1–25. 10.1111/j.1744-7348.2010.00443.x [DOI] [Google Scholar]
- Hawker, J. S. (1969). Changes in the activities of enzymes concerned with sugar metabolism during the development of grape berries. Phytochemistry, 8, 9–17. 10.1016/S0031-9422(00)85788-X [DOI] [Google Scholar]
- Herwig, R. , Schulz, B. , Weisshaar, B. , Hennig, S. , Steinfath, M. , Drungowski, M. , … Radelof, U. (2002). Construction of a 'unigene' cDNA clone set by oligonucleotide fingerprinting allows access to 25 000 potential sugar beet genes. The Plant Journal, 32, 845–857. 10.1046/j.1365-313X.2002.01457.x [DOI] [PubMed] [Google Scholar]
- Hoffmann, C. M. , Kenter, C. , & Bloch, D. (2005). Marc concentration of sugar beet (Beta vulgaris L) in relation to sucrose storage. Journal of the Science of Food and Agriculture, 85, 459–465. 10.1002/jsfa.2002 [DOI] [Google Scholar]
- Hoffmann, C. M. , & Kluge‐Severin, S. (2011). Growth analysis of autumn and spring sown sugar beet. European Journal of Agronomy, 34, 1–9. 10.1016/j.eja.2010.09.001 [DOI] [Google Scholar]
- Hosford, D. J. , Lenton, J. R. , Milford, G. F. J. , Pocock, T. O. , & Elliott, M. C. (1984). Phytohormone changes during storage root growth in Beta species. Plant Growth Regulation, 2, 371–380. 10.1007/BF00027296 [DOI] [Google Scholar]
- Houshmandfar, A. , Asli, D. E. , & Eghdami, A. (2011). Sucrose synthase, ADP‐glucose pyrophosphorylase and aldolase levels in relation to grain development of wheat. Advances in Environmental Biology, 5, 1736–1741. [Google Scholar]
- Immanen, J. , Nieminen, K. , Smolander, O. , Kojima, M. , Alonso Serra, J. , Koskinen, P. , … Helariutta, Y. (2016). Cytokinin and auxin display distinct but interconnected distribution and signaling profiles to stimulate cambial activity. Current Biology, 26, 1990–1997. 10.1016/j.cub.2016.05.053 [DOI] [PubMed] [Google Scholar]
- Jaggard, K. W. , & Qi, A. (2006). Agronomy In Draycott A. P. (Ed.), Sugar beet (pp. 134–168). Oxford, UK: Blackwell. [Google Scholar]
- Jammer, A. , Gasperl, A. , Luschin‐Ebengreuth, N. , Heyneke, E. , Chu, H. , Cantero‐Navarro, E. , … Roitsch, T. (2015). Simple and robust determination of the activity signature of key carbohydrate metabolism enzymes for physiological phenotyping in model and crop plants. Journal of Experimental Botany, 66, 5531–5542. 10.1093/jxb/erv228 [DOI] [PubMed] [Google Scholar]
- Jang, G. , Lee, J. , Rastogi, K. , Park, S. , Oh, S. , & Lee, J. (2015). Cytokinin‐dependent secondary growth determines root biomass in radish (Raphanus sativus L.). Journal of Experimental Botany, 66, 4607–4619. 10.1093/jxb/erv220 [DOI] [PMC free article] [PubMed] [Google Scholar]
- Jelitto, T. , Sonnewald, U. , Willmitzer, L. , Hajirezeai, M. , & Stitt, M. (1992). Inorganic pyrophosphate content and metabolites in potato and tobacco plants expressing E. coli pyrophosphatase in their cytosol. Planta, 188, 238–244. 10.1007/BF00216819 [DOI] [PubMed] [Google Scholar]
- Johnson, D. , Eckart, P. , Alsamadisi, N. , Noble, H. , Martin, C. , & Spicer, R. (2018). Polar auxin transport is implicated in vessel differentiation and spatial patterning during secondary growth in Populus. American Journal of Botany, 105, 186–196. 10.1002/ajb2.1035 [DOI] [PubMed] [Google Scholar]
- Katz, E. , Boo, K. H. , Kim, H. Y. , Eigenheer, R. A. , Phinney, B. S. , Shulaev, V. , … Blumwald, E. (2011). Label‐free shotgun proteomics and metabolite analysis reveal a significant metabolic shift during citrus fruit development. Journal of Experimental Botany, 62, 5367–5384. 10.1093/jxb/err197 [DOI] [PMC free article] [PubMed] [Google Scholar]
- Kenter, C. , Hoffmann, C. M. , & Märländer, B. (2006). Effects of weather variables on sugar beet yield development (Beta vulgaris L.). European Journal of Agronomy, 24, 62–69. 10.1016/j.eja.2005.05.001 [DOI] [Google Scholar]
- Kleczkowski, L. A. , Decker, D. , & Wilczynska, M. (2011). UDP‐sugar pyrophosphorylase: A new old mechanism for sugar activation. Plant Physiology, 156, 3–10. 10.1104/pp.111.174706 [DOI] [PMC free article] [PubMed] [Google Scholar]
- Klotz, K. L. , & Campbell, L. G. (2004). Sucrose catabolism in developing roots of three beta vulgaris genotypes with different yield and sucrose accumulation capacities. Journal of Sugar Beet Research, 41, 73–88. 10.5274/jsbr.41.3.73 [DOI] [Google Scholar]
- Klotz, K. L. , & Finger, F. L. (2001). Sucrose catabolism during sugarbeet root development: Changes in isoenzyme activities and carbohydrate accumulation during growth. Proceedings from the 31st Biennial Meeting of the American Society of Sugar Beet, Technologists: 189–193. [Google Scholar]
- Koch, K. (2004). Sucrose metabolism: Regulatory mechanisms and pivotal roles in sugar sensing and plant development. Current Opinion in Plant Biology, 7, 235–246. 10.1016/j.pbi.2004.03.014 [DOI] [PubMed] [Google Scholar]
- Kong, W. , Chen, J. , Hou, Z. , Wen, P. , Zhan, J. , Pan, Q. , & Huang, W. (2007). Activity and subcellular localization of glucose‐6‐phosphate dehydrogenase in peach fruits. Journal of Plant Physiology, 164, 934–944. 10.1016/j.jplph.2006.06.001 [DOI] [PubMed] [Google Scholar]
- Kortstee, A. J. , Appeldoorn, N. J. G. , Oortwijn, M. E. P. , & Visser, R. G. F. (2007). Differences in regulation of carbohydrate metabolism during early fruit development between domesticated tomato and two wild relatives. Planta, 226, 929–939. 10.1007/s00425-007-0539-6 [DOI] [PubMed] [Google Scholar]
- Kruger, N. J. , & von Schaewen, A. (2003). The oxidative pentose phosphate pathway: Structure and organisation. Current Opinion in Plant Biology, 6, 236–246. 10.1016/S1369-5266(03)00039-6 [DOI] [PubMed] [Google Scholar]
- Krumbiegel, A. (1998). Morphology and anatomy in annual taxa of Beta vulgaris s.l. (Chenopodiaceae). Nordic Journal of Botany, 18, 159–167. 10.1111/j.1756-1051.1998.tb01863.x [DOI] [Google Scholar]
- Kushwah, S. , & Laxmi, A. (2017). The interaction between glucose and cytokinin signaling in controlling Arabidopsis thaliana seedling root growth and development. Plant Signaling & Behavior, 12, e1312241 10.1080/15592324.2017.1312241 [DOI] [PMC free article] [PubMed] [Google Scholar]
- Kuska, M. K. , Behmann, J. , Grosskinsky, D. K. , Roitsch, T. , & Mahlein, A. K. (2018). Screening of barley resistance against powdery mildew by simultaneous high‐throughput enzyme activity signature profiling and multispectral imaging. Frontiers in Plant Science, 9, 1074 10.3389/fpls.2018.01074 [DOI] [PMC free article] [PubMed] [Google Scholar]
- Lamari, N. , Zhendre, V. , Urrutia, M. , Bernillon, S. , Maucourt, M. , Deborde, C. , … Moing, A. (2018). Metabotyping of 30 maize hybrids under early‐sowing conditions reveals potential marker‐metabolites for breeding. Metabolomics, 14, 132 10.1007/s11306-018-1427-8 [DOI] [PMC free article] [PubMed] [Google Scholar]
- Lao, X. , Azuma, J. , & Sakamoto, M. (2013). Two cytosolic aldolases show different expression patterns during shoot elongation in Moso bamboo, Phyllostachys pubescens Mazel. Physiologia Plantarum, 149, 422–431. 10.1111/ppl.12052 [DOI] [PubMed] [Google Scholar]
- Leigh, R. A. , Ap Rees, T. , Fuller, W. A. , & Banfield, J. (1979). The location of acid invertase activity and sucrose in the vacuoles of storage roots of beetroot (Beta vulgaris). Biochemical Journal, 178, 539–547. 10.1042/bj1780539 [DOI] [PMC free article] [PubMed] [Google Scholar]
- Li, J. , Wu, L. , Foster, R. , & Ruan, Y.‐L. (2017). Molecular regulation of sucrose catabolism and sugar transport for development, defence and phloem function. Journal of Integrative Plant Biology, 59, 322–335. 10.1111/jipb.12539 [DOI] [PubMed] [Google Scholar]
- Li, L. , Song, J. , Kalt, W. , Forney, C. , Tsao, R. , Pinto, D. , … Li, X. (2013). Quantitative proteomic investigation employing stable isotope labeling by peptide dimethylation on proteins of strawberry fruit at different ripening stages. Journal of Proteomics, 94, 219–239. 10.1016/j.jprot.2013.09.004 [DOI] [PubMed] [Google Scholar]
- Lucas, W. J. , Groover, A. , Lichtenberger, R. , Furuta, K. , Yadav, S. , Helariutta, Y. , … Kachroo, P. (2013). The plant vascular system: Evolution, development and functions. Journal of Integrative Plant Biology, 55, 294–388. 10.1111/jipb.12041 [DOI] [PubMed] [Google Scholar]
- Luisi, A. , Giovannelli, A. , Traversi, M. L. , Anichini, M. , & Sorce, C. (2014). Hormonal responses to water deficit in cambial tissues of Populus alba L. Journal of Plant Growth Regulation, 33, 489–498. 10.1007/s00344-013-9401-1 [DOI] [Google Scholar]
- Mähönen, A. P. , Higuchi, M. , Törmäkangas, K. , Miyawaki, K. , Pischke, M. S. , Sussman, M. R. , … Kakimoto, T. (2006). Cytokinins regulate a bidirectional phosphorelay network in Arabidopsis. Current Biology, 16, 1116–1122. 10.1016/j.cub.2006.04.030 [DOI] [PubMed] [Google Scholar]
- Malinova, I. , Kunz, H. , Alseekh, S. , Herbst, K. , Fernie, A. R. , Gierth, M. , … Kusano, M. (2014). Reduction of the cytosolic phosphoglucomutase in arabidopsis reveals impact on plant growth, seed and root development, and carbohydrate partitioning. PLoS ONE, 9, e112468 10.1371/journal.pone.0112468 [DOI] [PMC free article] [PubMed] [Google Scholar]
- Martínez‐Esteso, M. J. , Sellés‐Marchart, S. , Lijavetzky, D. , Pedreño, M. A. , & Bru‐Martínez, R. (2011). A DIGE‐based quantitative proteomic analysis of grape berry flesh development and ripening reveals key events in sugar and organic acid metabolism. Journal of Experimental Botany, 62, 2521–2569. 10.1093/jxb/erq434 [DOI] [PubMed] [Google Scholar]
- Matsumoto‐Kitano, M. , Kusumoto, T. , Tarkowski, P. , Kinoshita‐Tsujimura, K. , Vaclavikova, K. , Miyawaki, K. , & Kakimoto, T. (2008). Cytokinins are central regulators of cambial activity. Proceedings of the National Academy of Sciences USA, 105, 20027–20031. 10.1073/pnas.0805619105 [DOI] [PMC free article] [PubMed] [Google Scholar]
- McKee, J. M. T. , Thomas, T. H. , & Hole, C. C. (1984). Growth regulator effects on storage root development in carrot. Plant Growth Regulation, 2, 359–369. 10.1007/BF00027295 [DOI] [Google Scholar]
- McLaughlin, J. E. , & Boyer, J. S. (2004a). Glucose localization in maize ovaries when kernel number decreases at low water potential and sucrose is fed to the stems. Annals of Botany, 94, 75–86. 10.1093/aob/mch123 [DOI] [PMC free article] [PubMed] [Google Scholar]
- McLaughlin, J. E. , & Boyer, J. S. (2004b). Sugar‐responsive gene expression, invertase activity, and senescence in aborting maize ovaries at low water potentials. Annals of Botany, 94, 675–689. 10.1093/aob/mch193 [DOI] [PMC free article] [PubMed] [Google Scholar]
- Miao, Y. , Zhu, Z. , Guo, Q. , Yang, X. , Liu, L. , Sun, Y. , & Wang, C. (2016). Dynamic changes in carbohydrate metabolism and endogenous hormones during Tulipa edulis stolon development into a new bulb. Journal of Plant Biology, 59, 121–132. 10.1007/s12374-016-0456-y [DOI] [Google Scholar]
- Milford, G. F. J. (2006). Plant structure and crop physiology In Draycott A. P. (Ed.), Sugar beet (pp. 30–49). Oxford, UK: Blackwell. [Google Scholar]
- Miller, M. E. , & Chourey, P. S. (1992). The maize invertase‐deficient miniature‐1 seed mutation is associated with aberrant pedicel and endosperm development. The Plant Cell, 4, 297–305. 10.2307/3869541 [DOI] [PMC free article] [PubMed] [Google Scholar]
- Minhas, J. S. , Rai, V. K. , & Saini, H. S. (2004). Carbohydrate metabolism during tuber initiation in potato: A transient surge in invertase activity marks the stolon to tuber transition. Potato Research, 47, 113–126. 10.1007/BF02735978 [DOI] [Google Scholar]
- Mitsui, Y. , Shimomura, M. , Komatsu, K. , Namiki, N. , Shibata‐Hatta, M. , Imai, M. , … Sasaki, T. (2015). The radish genome and comprehensive gene expression profile of tuberous root formation and development. Scientific Reports, 5, 10835 10.1038/srep10835 [DOI] [PMC free article] [PubMed] [Google Scholar]
- Miyashima, S. , Sebastian, J. , Lee, J. , & Helariutta, Y. (2012). Stem cell function during plant vascular development. The EMBO Journal, 32, 178–193. 10.1038/emboj.2012.301 [DOI] [PMC free article] [PubMed] [Google Scholar]
- Nakashima, K. , & Yamaguchi‐Shinozaki, K. (2013). ABA signaling in stress‐response and seed development. Plant Cell Reports, 32, 959–970. 10.1007/s00299-013-1418-1 [DOI] [PubMed] [Google Scholar]
- Neubohn, B. , Gubatz, S. , Wobus, U. , & Weber, H. (2000). Sugar levels altered by ectopic expression of a yeast‐derived invertase affect cellular differentiation of developing cotyledons of Vicia narbonensis L. Planta, 211, 325–334. 10.1007/s004250000305 [DOI] [PubMed] [Google Scholar]
- Nieminen, K. , Immanen, J. , Laxell, M. , Kauppinen, L. , Tarkowski, P. , Dolezal, K. , … Helariutta, Y. (2008). Cytokinin signaling regulates cambial development in poplar. Proceedings of the National Academy of Sciences USA, 105, 20032–20037. 10.1073/pnas.0805617106 [DOI] [PMC free article] [PubMed] [Google Scholar]
- Oikawa, A. , Otsuka, T. , Nakabayashi, R. , Jikumaru, Y. , Isuzugawa, K. , Murayama, H. , … Osorio‐Algar, S. (2015). Metabolic profiling of developing pear fruits reveals dynamic variation in primary and secondary metabolites including plant hormones. PLoS ONE, 10, e0131408 10.1371/journal.pone.0131408 [DOI] [PMC free article] [PubMed] [Google Scholar]
- Oldemeyer, R. K. (1975). Introgressive hybridization as a breeding method in beta vulgaris. Journal of Sugarbeet Research, 18, 269–273. 10.5274/jsbr.18.3.269 [DOI] [Google Scholar]
- Ozolina, N. V. , Pradedova, E. V. , & Salyaev, R. K. (2005). The dynamics of hormonal status of developing red beet root (Beta vulgaris L.) in correlation with the dynamics of sugar accumulation. Biology Bulletin, 32, 22–26. 10.1007/s10525-005-0005-6 [DOI] [PubMed] [Google Scholar]
- Pack, D. A. (1927). Ring density of sugar beets as a character for selection. American Journal of Botany, 14, 238–245. 10.1002/j.1537-2197.1927.tb04839.x [DOI] [Google Scholar]
- Park, J. , Ishimizu, T. , Suwabe, K. , Sudo, K. , Masuko, H. , Hakozaki, H. , … Watanabe, M. (2010). UDP‐glucose pyrophosphorylase is rate limiting in vegetative and reproductive phases in Arabidopsis thaliana. Plant and Cell Physiology, 51, 981–996. 10.1093/pcp/pcq057 [DOI] [PubMed] [Google Scholar]
- Payyavula, R. S. , Tschaplinski, T. J. , Jawdy, S. S. , Sykes, R. W. , Tuskan, G. A. , & Kalluri, U. C. (2014). Metabolic profiling reveals altered sugar and secondary metabolism in response to UGPase overexpression in Populus. BMC Plant Biology, 14, 265 10.1186/s12870-014-0265-8 [DOI] [PMC free article] [PubMed] [Google Scholar]
- Polit, J. T. , & Ciereszko, I. (2012). Sucrose synthase activity and carbohydrates content in relation to phosphorylation status of Vicia faba root meristems during reactivation from sugar depletion. Journal of Plant Physiology, 169, 1597–1606. 10.1016/j.jplph.2012.04.017 [DOI] [PubMed] [Google Scholar]
- Powers, L. (1956). Identification of genetically‐superior individuals and the prediction of genetic gains in sugar beet breeding programs. Journal of the American Society of Sugar Beet Technologists, 9, 408–432. 10.5274/jsbr.9.5.408 [DOI] [Google Scholar]
- Prezelj, N. , Covington, E. , Roitsch, T. , Gruden, K. , Fragner, L. , Weckwerth, W. , … Dermastia, M. (2016). Metabolic consequences of infection of grapevine (Vitis vinifera L.) cv. ‘Modra frankinja’ with Flavescence dorée phytoplasma. Frontiers in Plant Science, 7, 711 10.3389/fpls.2016.00711 [DOI] [PMC free article] [PubMed] [Google Scholar]
- Privat, I. , Foucrier, S. , Prins, A. , Epalle, T. , Eychenne, M. , Kandalaft, L. , … Mccarthy, J. (2008). Differential regulation of grain sucrose accumulation and metabolism in Coffea arabica (Arabica) and Coffea canephora (Robusta) revealed through gene expression and enzyme activity analysis. New Phytologist, 178, 781–797. 10.1111/j.1469-8137.2008.02425.x [DOI] [PubMed] [Google Scholar]
- Qin, G. , Zhu, Z. , Wang, W. , Cai, J. , Chen, Y. , Li, L. , & Tian, S. (2016). A tomato vacuolar invertase inhibitor mediates sucrose metabolism and influences fruit ripening. Plant Physiology, 172, 1596–1611. 10.1104/pp.16.01269 [DOI] [PMC free article] [PubMed] [Google Scholar]
- Qu, A. , Ding, Y. , Jiang, Q. , & Zhu, C. (2013). Molecular mechanisms of the plant heat stress response. Biochemical and Biophysical Research Communications, 432, 203–207. 10.1016/j.bbrc.2013.01.104 [DOI] [PubMed] [Google Scholar]
- Quick, W. P. , & Schaffer, A. A. (1996). Sucrose metabolism in sources and sinks In Schaffer A. A., & Zamski E. (Eds.), Photoassimilate distribution in plants and crops. Source‐sink relationships (pp. 115–156). New York, NY: Marcel Dekker. [Google Scholar]
- Ragni, L. , & Greb, T. (2018). Secondary growth as a determinant of plant shape and form. Seminars in Cell & Developmental Biology, 79, 58–67. 10.1016/j.semcdb.2017.08.050 [DOI] [PubMed] [Google Scholar]
- Randall, R. S. , Miyashima, S. , Blomster, T. , Zhang, J. , Elo, A. , Karlberg, A. , … Murray, J. A. H. (2015). AINTEGUMENTA and the D‐type cyclin CYCD3; 1 regulate root secondary growth and respond to cytokinins. Biology Open, 4, 1229–1236. 10.1242/bio.013128 [DOI] [PMC free article] [PubMed] [Google Scholar]
- Rausch, T. , & Greiner, S. (2004). Plant protein inhibitors of invertases. Biochimica et Biophysica Acta ‐ Proteins and Proteomics, 1696, 253–261. 10.1016/j.bbapap.2003.09.017 [DOI] [PubMed] [Google Scholar]
- Ravi, V. , Chakrabarti, S. K. , Makeshkumar, T. , & Saravanan, R. (2014). Molecular regulation of storage root formation and development in sweet potato In Janick J. (Ed.), Horticultural reviews, Vol. 42 (pp. 157–207). Hoboken, NJ: Wiley‐Blackwell. [Google Scholar]
- Ricardo, C. P. P. , & Sovia, D. (1974). Development of tuberous roots and sugar accumulation as related to invertase activity and mineral nutrition. Planta, 118, 43–55. 10.1007/BF00390502 [DOI] [PubMed] [Google Scholar]
- Rohwer, J. M. , & Botha, F. C. (2001). Analysis of sucrose accumulation in the sugar cane culm on the basis of in vitro kinetic data. Biochemical Journal, 358, 437–445. 10.1042/bj3580437 [DOI] [PMC free article] [PubMed] [Google Scholar]
- Roitsch, T. , & Gonzalez, M. (2004). Function and regulation of invertases in higher plants: Sweet sensations. Trends in Plant Science, 9, 606–613. 10.1016/j.tplants.2004.10.009 [DOI] [PubMed] [Google Scholar]
- Ross, H. A. , Davies, H. V. , Burch, L. R. , Viola, R. , & McRae, D. (1994). Developmental changes in carbohydrate content and sucrose degrading enzymes in tuberising stolons of potato (Solanum tuberosum). Physiologia Plantarum, 90, 748–756. 10.1111/j.1399-3054.1994.tb02533.x [DOI] [Google Scholar]
- Ruan, Y.‐L. (2014). Sucrose metabolism: Gateway to diverse carbon use and sugar signaling. Annual Review of Plant Biology, 65, 33–67. 10.1146/annurev-arplant-050213-040251 [DOI] [PubMed] [Google Scholar]
- Ruan, Y.‐L. , Llewellyn, D. J. , & Furbank, R. T. (2003). Suppression of sucrose synthase gene expression represses cotton fiber cell initiation, elongation, and seed development. The Plant Cell, 15, 952–964. 10.1105/tpc.010108 [DOI] [PMC free article] [PubMed] [Google Scholar]
- Saftner, R. A. , & Wyse, R. E. (1984). Effect of plant hormones on sucrose uptake by sugar beet root tissue discs. Plant Physiology, 74, 951–955. 10.1104/pp.74.4.951 [DOI] [PMC free article] [PubMed] [Google Scholar]
- Sah, S. K. , Reddy, K. R. , & Li, J. (2016). Abscisic acid and abiotic stress tolerance in crop plants. Frontiers in Plant Science, 7, 571 10.3389/fpls.2016.00571 [DOI] [PMC free article] [PubMed] [Google Scholar]
- Schaffer, A. A. , & Petreikov, M. (1997). Sucrose‐to‐starch metabolism in tomato fruit undergoing transient starch accumulation. Plant Physiology, 113, 739–746. 10.1104/pp.113.3.739 [DOI] [PMC free article] [PubMed] [Google Scholar]
- Schwab, W. , Aharoni, A. , Raab, T. , Pérez, A. G. , & Sanz, C. (2001). Cytosolic aldolase is a ripening related enzyme in strawberry fruits (Fragaria × ananassa). Phytochemistry, 56, 407–415. 10.1016/S0031-9422(00)00405-2 [DOI] [PubMed] [Google Scholar]
- Sergeeva, L. I. , Keurentjes, J. J. B. , Bentsink, L. , Vonk, J. , van der Plas, L. H. W. , Koornneef, M. , & Vreugdenhil, D. (2006). Vacuolar invertase regulates elongation of Arabidopsis thaliana roots as revealed by QTL and mutant analysis. Proceedings of the National Academy of Sciences USA, 103, 2994–2999. 10.1073/pnas.0511015103 [DOI] [PMC free article] [PubMed] [Google Scholar]
- Sergeeva, L. I. , & Vreugdenhil, D. (2002). In situ staining of activities of enzymes involved in carbohydrate metabolism in plant tissues. Journal of Experimental Botany, 53, 361–370. 10.1093/jexbot/53.367.361 [DOI] [PubMed] [Google Scholar]
- Sheen, J. (2014). Master regulators in plant glucose signaling networks. Journal of Plant Biology, 57, 67–79. 10.1007/s12374-014-0902-7 [DOI] [PMC free article] [PubMed] [Google Scholar]
- Shuai, L. , Li, J. , Niu, J. J. , Qian, P. H. , Liu, W. H. , Xue, X. Q. , … Wu, Z. X. (2016). Sucrose‐metabolizing enzymes and their genes in the arils of two Dimocarpus longan cultivars. Biologia Plantarum, 60, 741–748. 10.1007/s10535-016-0602-x [DOI] [Google Scholar]
- Slewinski, T. L. , & Braun, D. M. (2010). Current perspectives on the regulation of whole‐plant carbohydrate partitioning. Plant Science, 178, 341–349. 10.1016/j.plantsci.2010.01.010 [DOI] [Google Scholar]
- Sorce, C. , Giovannelli, A. , Sebastiani, L. , & Anfodillo, T. (2013). Hormonal signals involved in the regulation of cambial activity, xylogenesis and vessel patterning in trees. Plant Cell Reports, 32, 885–898. 10.1007/s00299-013-1431-4 [DOI] [PubMed] [Google Scholar]
- Stein, O. , Avin‐Wittenberg, T. , Krahnert, I. , Zemach, H. , Bogol, V. , Daron, O. , … Granot, D. (2017). Arabidopsis fructokinases are important for seed oil accumulation and vascular development. Frontiers in Plant Science, 7, 2047 10.3389/fpls.2016.02047 [DOI] [PMC free article] [PubMed] [Google Scholar]
- Stein, O. , Damari‐Weissler, H. , Secchi, F. , Rachamilevitch, S. , German, M. A. , Yeselson, Y. , … Granot, D. (2016). The tomato plastidic fructokinase SlFRK3 plays a role in xylem development. New Phytologist, 209, 1484–1495. 10.1111/nph.13705 [DOI] [PubMed] [Google Scholar]
- Stein, O. , & Granot, D. (2018). Plant fructokinases: Evolutionary, developmental, and metabolic aspects in sink tissues. Frontiers in Plant Science, 9, 339 10.3389/fpls.2018.00339 [DOI] [PMC free article] [PubMed] [Google Scholar]
- Stein, O. , & Granot, D. (2019). An overview of sucrose synthases in plants. Frontiers in Plant Science, 10, 95 10.3389/fpls.2019.00095 [DOI] [PMC free article] [PubMed] [Google Scholar]
- Stich, B. , Piepho, H. , Schulz, B. , & Melchinger, A. E. (2008). Multi‐trait association mapping in sugar beet (Beta vulgaris L.). Theoretical and Applied Genetics, 117, 947–954. 10.1007/s00122-008-0834-z [DOI] [PubMed] [Google Scholar]
- Sturm, A. (1996). Molecular characterization and functional analysis of sucrose‐cleaving enzymes in carrot (Daucus carota L.). Journal of Experimental Botany, 47, 1187–1192. 10.1093/jxb/47.Special_Issue.1187 [DOI] [PubMed] [Google Scholar]
- Sturm, A. , Šebková, V. , Lorenz, K. , Hardegger, M. , Lienhard, S. , & Unger, C. (1995). Development‐ and organ‐specific expression of the genes for sucrose synthase and three isoenzymes of acid β‐fructofuranosidase in carrot. Planta, 195, 601–610. 10.1007/BF00195721 [DOI] [Google Scholar]
- Sturm, A. , & Tang, G. (1999). The sucrose‐cleaving enzymes of plants are crucial for development, growth and carbon partitioning. Trends in Plant Science, 4, 401–407. 10.1016/S1360-1385(99)01470-3 [DOI] [PubMed] [Google Scholar]
- Sung, S. S. , Xu, D. , & Black, C. C. (1989). Identification of actively filling sucrose sinks. Plant Physiology, 89, 1117–1121. 10.1104/pp.89.4.1117 [DOI] [PMC free article] [PubMed] [Google Scholar]
- Tang, G. , Lüscher, M. , & Sturm, A. (1999). Antisense repression of vacuolar and cell wall invertase in transgenic carrot alters early plant development and sucrose partitioning. The Plant Cell, 11, 177–190. 10.1105/tpc.11.2.177 [DOI] [PMC free article] [PubMed] [Google Scholar]
- Tang, G. , & Sturm, A. (1999). Antisense repression of sucrose synthase in carrot (Daucus carota L.) affects growth rather than sucrose partitioning. Plant Molecular Biology, 41, 465–479. 10.1023/a:1006327606696 [DOI] [PubMed] [Google Scholar]
- Tang, X. , Su, T. , Han, M. , Wei, L. , Wang, W. , Yu, Z. , … Liu, L. (2017). Suppression of extracellular invertase inhibitor gene expression improves seed weight in soybean (Glycine max). Journal of Experimental Botany, 68, 469–482. 10.1093/jxb/erw425 [DOI] [PMC free article] [PubMed] [Google Scholar]
- Tardieu, F. , Cabrera‐Bosquet, L. , Pridmore, T. , & Bennett, M. (2017). Plant phenomics, from sensors to knowledge. Current Biology, 27, R770–R783. 10.1016/j.cub.2017.05.055 [DOI] [PubMed] [Google Scholar]
- Thomas, S. , Mooney, P. J. F. , Burrell, M. M. , & Fell, D. A. (1997). Finite change analysis of glycolytic intermediates in tuber tissue of lines of transgenic potato (Solanum tuberosum) overexpressing phosphofructokinase. Biochemical Journal, 322, 111–117. 10.1042/bj3220111 [DOI] [PMC free article] [PubMed] [Google Scholar]
- Trebbi, D. , & McGrath, J. M. (2009). Functional differentiation of the sugar beet root system as indicator of developmental phase change. Physiologia Plantarum, 135, 84–97. 10.1111/j.1399-3054.2008.01169.x [DOI] [PubMed] [Google Scholar]
- Tuominen, H. , Puech, L. , Fink, S. , & Sundberg, B. (1997). A radial concentration gradient of indole‐3‐acetic acid is related to secondary xylem development in hybrid aspen. Plant Physiology, 115, 577–585. 10.1104/pp.115.2.577 [DOI] [PMC free article] [PubMed] [Google Scholar]
- Turesson, H. , Andersson, M. , Marttila, S. , Thulin, I. , & Hofvander, P. (2014). Starch biosynthetic genes and enzymes are expressed and active in the absence of starch accumulation in sugar beet tap‐root. BMC Plant Biology, 14, 104 10.1186/1471-2229-14-104 [DOI] [PMC free article] [PubMed] [Google Scholar]
- Uematsu, K. , Suzuki, N. , Iwamae, T. , Inui, M. , & Yukawa, H. (2012). Increased fructose 1,6‐bisphosphate aldolase in plastids enhances growth and photosynthesis of tobacco plants. Journal of Experimental Botany, 63, 3001–3009. 10.1093/jxb/ers004 [DOI] [PubMed] [Google Scholar]
- Uggla, C. , Magel, E. , Moritz, T. , & Sundberg, B. (2001). Function and dynamics of auxin and carbohydrates during earlywood/latewood transition in scots pine. Plant Physiology, 125, 2029–2039. 10.1104/pp.125.4.2029 [DOI] [PMC free article] [PubMed] [Google Scholar]
- Uggla, C. , Mellerowicz, E. J. , & Sundberg, B. (1998). Indole‐3‐acetic acid controls cambial growth in scots pine by positional signaling. Plant Physiology, 117, 113–121. 10.1104/pp.117.1.113 [DOI] [PMC free article] [PubMed] [Google Scholar]
- Uggla, C. , Moritz, T. , Sandberg, G. , & Sundberg, B. (1996). Auxin as a positional signal in pattern formation in plants. Proceedings of the National Academy of Sciences USA, 93, 9282–9286. 10.1073/pnas.93.17.9282 [DOI] [PMC free article] [PubMed] [Google Scholar]
- Ursache, R. , Nieminen, K. , & Helariutta, Y. (2013). Genetic and hormonal regulation of cambial development. Physiologia Plantarum, 147, 36–45. 10.1111/j.1399-3054.2012.01627.x [DOI] [PubMed] [Google Scholar]
- Usuda, H. , Demura, T. , Shimogawara, K. , & Fukuda, H. (1999). Development of sink capacity of the "Storage Root" in a radish cultivar with a high ratio of "Storage Root" to shoot. Plant and Cell Physiology, 40, 369–377. 10.1093/oxfordjournals.pcp.a029552 [DOI] [Google Scholar]
- Usuda, H. , Rouhier, H. , Demura, T. , & Fukuda, H. (1999). Development of sink capacity of the “storage root” in a radish variety with a low ratio of “storage root” to shoot. Plant & Cell Physiology, 40, 1210–1218. 10.1093/oxfordjournals.pcp.a029509 [DOI] [Google Scholar]
- Uys, L. , Botha, F. C. , Hofmeyr, J. S. , & Rohwer, J. M. (2007). Kinetic model of sucrose accumulation in maturing sugarcane culm tissue. Phytochemistry, 68, 2375–2392. 10.1016/j.phytochem.2007.04.023 [DOI] [PubMed] [Google Scholar]
- Verbančič, J. , Lunn, J. E. , Stitt, M. , & Persson, S. (2018). Carbon supply and the regulation of cell wall synthesis. Molecular Plant, 11, 75–94. 10.1016/j.molp.2017.10.004 [DOI] [PubMed] [Google Scholar]
- Vishwakarma, K. , Upadhyay, N. , Kumar, N. , Yadav, G. , Singh, J. , Mishra, R. K. , … Sharma, S. (2017). Abscisic acid signaling and abiotic stress tolerance in plants: A review on current knowledge and future prospects. Frontiers in Plant Science, 8, 161 10.3389/fpls.2017.00161 [DOI] [PMC free article] [PubMed] [Google Scholar]
- Wai, C. M. , Zhang, J. , Jones, T. C. , Nagai, C. , & Ming, R. (2017). Cell wall metabolism and hexose allocation contribute to biomass accumulation in high yielding extreme segregants of a Saccharum interspecific F2 population. BMC Genomics, 18, 773 10.1186/s12864-017-4158-8 [DOI] [PMC free article] [PubMed] [Google Scholar]
- Wan, H. , Wu, L. , Yang, Y. , Zhou, G. , & Ruan, Y.‐L. (2018). Evolution of sucrose metabolism: The dichotomy of invertases and beyond. Trends in Plant Science, 23, 163–177. 10.1016/j.tplants.2017.11.001 [DOI] [PubMed] [Google Scholar]
- Wang, L. , Li, X. , Lian, H. , Ni, D. , He, Y. , Chen, X. , & Ruan, Y. (2010). Evidence that high activity of vacuolar invertase is required for cotton fiber and arabidopsis root elongation through osmotic dependent and independent pathways, respectively. Plant Physiology, 154, 744–756. 10.1104/pp.110.162487 [DOI] [PMC free article] [PubMed] [Google Scholar]
- Wang, L. , & Ruan, Y.‐L. (2013). Regulation of cell division and expansion by sugar and auxin signaling. Frontiers in Plant Science, 4, 163 10.3389/fpls.2013.00163 [DOI] [PMC free article] [PubMed] [Google Scholar]
- Wang, L. , & Ruan, Y.‐L. (2016). Shoot‐root carbon allocation, sugar signaling and their coupling with nitrogen uptake and assimilation). Functional Plant Biology, 43, 105–113. 10.1071/FP15249 [DOI] [PubMed] [Google Scholar]
- Wang, Q. , Zhang, X. , Li, F. , Hou, Y. , Liu, X. , & Zhang, X. (2011). Identification of a UDP‐glucose pyrophosphorylase from cotton (Gossypium hirsutum L.) involved in cellulose biosynthesis in Arabidopsis thaliana. Plant Cell Reports, 30, 1303–1312. 10.1007/s00299-011-1042-x [DOI] [PubMed] [Google Scholar]
- Wang, X. Q. , Li, L. M. , Yang, P. P. , & Gong, C. L. (2014). The role of hexokinases from grape berries (Vitis vinifera L.) in regulating the expression of cell wall invertase and sucrose synthase genes. Plant Cell Reports, 33, 337–347. 10.1007/s00299-013-1533-z [DOI] [PubMed] [Google Scholar]
- Weber, H. , Borisjuk, L. , Heim, U. , Buchner, P. , & Wobus, U. (1995). Seed coat‐associated invertases of fava bean control both unloading and storage functions: Cloning of cDNAs and cell type‐specific expression. The Plant Cell, 7, 1835–1846. 10.1105/tpc.7.11.1835 [DOI] [PMC free article] [PubMed] [Google Scholar]
- Weber, H. , Borisjuk, L. , & Wobus, U. (1996). Controlling seed development and seed size in Vicia faba: A role for seed coat‐associated invertases and carbohydrate state. The Plant Journal, 10, 823–834. 10.1046/j.1365-313X.1996.10050823.x [DOI] [Google Scholar]
- Weber, H. , Borisjuk, L. , & Wobus, U. (1997). Sugar import and metabolism during seed development. Trends in Plant Science, 2, 169–174. 10.1016/S1360-1385(97)85222-3 [DOI] [Google Scholar]
- Weber, H. , Borisjuk, L. , & Wobus, U. (2005). Molecular physiology of legume seed development. Annual Review of Plant Biology, 56, 253–279. 10.1146/annurev.arplant.56.032604.144201 [DOI] [PubMed] [Google Scholar]
- Weber, H. , Buchner, P. , Borisjuk, L. , & Wobus, U. (1996). Sucrose metabolism during cotyledon development of Vicia faba L. is controlled by the concerted action of both sucrose‐phosphate synthase and sucrose synthase: Expression patterns, metabolic regulation and implications for seed development. The Plant Journal, 9, 841–850. 10.1046/j.1365-313X.1996.9060841.x [DOI] [PubMed] [Google Scholar]
- Weber, H. , Heim, U. , Golombek, S. , Borisjuk, L. , Manteuffel, R. , & Wobus, U. (1998). Expression of a yeast‐derived invertase in developing cotyledons of Vicia narbonensis alters the carbohydrate state and affects storage functions. The Plant Journal, 16, 163–172. 10.1046/j.1365-313x.1998.00282.x [DOI] [PubMed] [Google Scholar]
- Weschke, W. , Panitz, R. , Gubatz, S. , Wang, Q. , Radchuk, R. , Weber, H. , & Wobus, U. (2003). The role of invertases and hexose transporters in controlling sugar ratios in maternal and filial tissues of barley caryopses during early development. The Plant Journal, 33, 395–411. 10.1046/j.1365-313X.2003.01633.x [DOI] [PubMed] [Google Scholar]
- Wobus, U. , Bäumlein, H. , Conrad, U. , Müntz, K. , & Weber, H. (2000). Seeds of change. Trends in Plant Science, 5, 512–513. 10.1016/S1360-1385(00)01786-6 [DOI] [PubMed] [Google Scholar]
- Wobus, U. , & Weber, H. (1999). Seed maturation: Genetic programmes and control signals. Current Opinion in Plant Biology, 2, 33–38. 10.1016/S1369-5266(99)80007-7 [DOI] [PubMed] [Google Scholar]
- Wyse, R. E. (1979). Parameters controlling sucrose content and yield of sugarbeet roots. Journal of the American Society of Sugar Beet Technologists, 20, 368–385. 10.5274/jsbr.20.4.368 [DOI] [Google Scholar]
- Xu, S. , Brill, E. , Llewellyn, D. J. , Furbank, R. T. , & Ruan, Y. (2012). Overexpression of a potato sucrose synthase gene in cotton accelerates leaf expansion, reduces seed abortion, and enhances fiber production. Molecular Plant, 5, 430–441. 10.1093/mp/ssr090 [DOI] [PubMed] [Google Scholar]
- York, L. M. (2019). Functional phenomics: An emerging field integrating high‐throughput phenotyping, physiology, and bioinformatics. Journal of Experimental Botany, 70, 379–386. 10.1093/jxb/ery379 [DOI] [PubMed] [Google Scholar]
- Yu, R. , Xu, L. , Zhang, W. , Wang, Y. , Luo, X. , Wang, R. , … Liu, L. (2016). De novo taproot transcriptome sequencing and analysis of major genes involved in sucrose metabolism in radish (Raphanus sativus L.). Frontiers in Plant Science, 7, 585 10.3389/fpls.2016.00585 [DOI] [PMC free article] [PubMed] [Google Scholar]
- Yu, S. , Lo, S. , & Ho, T. D. (2015). Source‐sink communication: regulated by hormone, nutrient, and stress cross‐signaling. Trends in Plant Science, 20, 844–857. 10.1016/j.tplants.2015.10.009 [DOI] [PubMed] [Google Scholar]
- Zamski, E. (1996). Anatomical and physiological characteristics of sink cells In Schaffer A. A., & Zamski E. (Eds.), Photoassimilate distribution in plants and crops. Source‐sink relationships (pp. 283–310). New York, NY: Marcel Dekker. [Google Scholar]
- Zamski, E. , & Azenkot, A. (1981). Sugarbeet vasculature. II. Translocation of assimilates in the supernumerary phloem. Botanical Gazette, 142, 344–346. 10.1086/337233 [DOI] [Google Scholar]
- Zhang, H. , Han, W. , de Smet, I. , Talboys, P. , Loya, R. , Hassan, A. , … Wang, M. (2010). ABA promotes quiescence of the quiescent centre and suppresses stem cell differentiation in the Arabidopsis primary root meristem. The Plant Journal, 64, 764–774. 10.1111/j.1365-313X.2010.04367.x [DOI] [PubMed] [Google Scholar]
- Zhang, J. , Elo, A. , & Helariutta, Y. (2011). Arabidopsis as a model for wood formation. Current Opinion in Biotechnology, 22, 293–299. 10.1016/j.copbio.2010.11.008 [DOI] [PubMed] [Google Scholar]
- Zhang, X. , Wang, W. , Du, L. , Xie, J. , Yao, Y. , & Sun, G. (2012). Expression patterns, activities and carbohydrate‐metabolizing regulation of sucrose phosphate synthase, sucrose synthase and neutral invertase in pineapple fruit during development and ripening. International Journal of Molecular Sciences, 13, 9460–9477. 10.3390/ijms13089460 [DOI] [PMC free article] [PubMed] [Google Scholar]
- Zhang, Y. , Li, G. , Wang, X. , Sun, Y. , & Zhang, S. (2017). Transcriptomic profiling of taproot growth and sucrose accumulation in sugar beet (Beta vulgaris L.) at different developmental stages. PLoS ONE, 12, e0175454 10.1371/journal.pone.0175454 [DOI] [PMC free article] [PubMed] [Google Scholar]
- Zhang, Y. , Zhen, L. , Tan, X. , Li, L. , & Wang, X. (2014). The involvement of hexokinase in the coordinated regulation of glucose and gibberellin on cell wall invertase and sucrose synthesis in grape berry. Molecular Biology Reports, 41, 7899–7910. 10.1007/s11033-014-3683-7 [DOI] [PubMed] [Google Scholar]
- Zhu, X. , Wang, M. , Li, X. , Jiu, S. , Wang, C. , & Fang, J. (2017). Genome‐wide analysis of the sucrose synthase gene family in grape (Vitis vinifera): Structure, evolution, and expression profiles. Genes, 8, 111 10.3390/genes8040111 [DOI] [PMC free article] [PubMed] [Google Scholar]
- Ziliotto, F. , Begheldo, M. , Rasori, A. , Bonghi, C. , & Tonutti, P. (2008). Transcriptome profiling of ripening nectarine (Prunus persica L. Batsch) fruit treated with 1‐MCP. Journal of Experimental Botany, 59, 2781–2791. 10.1093/jxb/ern136 [DOI] [PMC free article] [PubMed] [Google Scholar]
- Zrenner, R. , Salanoubat, M. , Willmitzer, L. , & Sonnewald, U. (1995). Evidence of the crucial role of sucrose synthase for sink strength using transgenic potato plants (Solanum tuberosum L.). The Plant Journal, 7, 97–107. 10.1046/j.1365-313X.1995.07010097.x [DOI] [PubMed] [Google Scholar]
Associated Data
This section collects any data citations, data availability statements, or supplementary materials included in this article.
Supplementary Materials
Figure S1‐S5
Table S1‐S3
Dataset S1–S3
Supplementary Material
Supplementary Material