

Abstract
Tacrolimus, a calcineurin inhibitor, is a common immunosuppressant prescribed after organ transplantation and has notable inter- and intrapatient pharmacokinetic variability. The sources of variability have been investigated using population pharmacokinetic modeling over the last 2 decades. This article provides an updated synopsis on published nonlinear mixed-effects analyses developed for tacrolimus in transplant recipients. The objectives were to establish a detailed overview of the current data and to investigate covariate relationships determined by the models. Sixty-three published analyses were reviewed, and data regarding the study design, modeling approach, and resulting findings were extracted and summarized. Most of the studies investigated tacrolimus pharmacokinetics in adult and pediatric renal and liver transplants after administration of the immediate-release formulation. Model structures largely depended on the study sampling strategy, with ~50% of studies developing a 1-compartment model using trough concentrations and a 2-compartment model with delayed absorption from intensive sampling. The CYP3A5 genotype, as a covariate, consistently impacted tacrolimus clearance, and dosing adjustments were required to achieve similar drug exposure among patients. Numerous covariates were identified as sources of interindividual variability on tacrolimus pharmacokinetics with limited consistency across these studies, which may be the result of the study designs. Additional analyses are required to further evaluate the potential impact of these covariates and the clinical implementation of these models to guide tacrolimus dosing recommendations. This article may be useful for guiding the design of future population pharmacokinetic studies and provides recommendations for the selection of an existing optimal model to individualize tacrolimus therapy.
Keywords: covariate, interindividual variabilities, pharmacokinetics, population, tacrolimus, transplantation
The calcineurin inhibitor tacrolimus is a potent immunosuppressant used to prevent allograft rejection following organ transplantation.1,2 In most immunosuppressive regimens tacrolimus is prescribed concomitantly with azathioprine or mycophenolic acid and glucocorticoids.3 Tacrolimus maintains allograft survival by targeting T-cell activation through the inhibition of the calcineurin phosphatase, a key enzyme in T-cell receptor signaling and cytokine production.2,4 Tacrolimus exhibits considerable inter- and intrapatient pharmacokinetic variability, which has been well described.2,5 After oral administration, the drug is rapidly absorbed and extensively bound to erythrocytes in the blood circulation.6 Tacrolimus is highly metabolized in the liver and small intestine, primarily by cytochrome P450 3A5 (CYP3A5) enzymes.7 It is also a substrate for the efflux transporter P-glycoprotein, which modulates gastrointestinal absorption and cellular distribution.8,9 Tacrolimus pharmacokinetic variability has been attributed to multiple covariates including: polymorphisms of CYP3A5 enzymes and P-glycoprotein, plasma protein concentrations, hematocrit, age, sex, ethnicity, time posttransplantation, type of transplanted organ, hepatic dysfunction, diurnal variations, food, and drug-drug interactions.5,10–12
Current tacrolimus-dosing recommendations are individualized to include some patient factors to ensure the desired therapeutic response.3,13 The FDA tacrolimus-dosing recommendations are based on patient age, transplanted organ, time posttransplant, and concurrent immunosuppressive therapy.3 Dosing suggestions are also provided based on race, with black patients requiring higher doses than white patients to achieve similar concentrations.3 The recent Clinical Pharmacogenetics Implementation Consortium guidelines for CYP3A5 genotypes and tacrolimus dosing have summarized and highlighted the significant contribution of these genotype variants on to tacrolimus pharmacokinetics interindividual variability.13
Along with high interindividual variability, tacrolimus exhibits a narrow therapeutic index with troughs ranging from 3 to 15 ng/mL, which requires consistent monitoring to ensure maintenance of a functional allograft and minimize adverse effects.5,14,15 Drug underexposure increases the risk of rejection, whereas drug overexposure increases adverse effects such as nephrotoxicity, neurotoxicity, hypertension, posttransplant diabetes mellitus, or gastrointestinal disorders.5 Therapeutic drug monitoring of tacrolimus troughs is essential to maintain targeted drug exposure during patient management, evaluation of dosing regimen adjustments, and adherence assessment.16 The area under the concentration-time curve (AUC) between dosing intervals is generally considered as the best marker of drug exposure.16 However, multiple time concentrations are required to accurately determine the AUC which is inconvenient for patients, costly, and time consuming in clinical practice. Therefore, routine therapeutic drug monitoring of trough concentrations remains the standard of care.16 The transition from full dosing of calcineurin inhibitors to dose minimization has been supported by several clinical studies, including the prospective Symphony study in de novo kidney transplant recipients in which tacrolimus-targeted trough concentrations were 3-7 ng/mL.17 Despite the clinical ease of using trough-based therapeutic drug monitoring, this monitoring parameter failed to show a relationship with rejection or efficacy in a recent meta-analysis.18 Moreover, a poor correlation between tacrolimus dosage and troughs exists, requiring additional research into factors influencing drug exposure.5,9,16
Population-based pharmacokinetic modeling is commonly used to characterize drug disposition, quantify the inter- and intraindividual variabilities of estimated pharmacokinetic parameters, and identify relevant covariates. In clinical practice, this approach explains or anticipates differences in adverse drug effects and efficacy among population subgroups (eg, whites vs Chinese, adult vs pediatric, and obese vs nonobese) and can be used to guide dosing recommendations and/or individualize therapy.19 Moreover, population pharmacokinetic models can be used to perform maximum a posteriori (MAP) Bayesian forecasting analysis, such as estimating individual ALTC values based on a limited number of patient concentrations, and enable efficient therapeutic drug monitoring. However, the use of the MAP Bayesian technique relies on the accuracy and predictive performance of a population pharmacokinetic model developed for the intended patient groups.
A recent article summarizes numerous population pharmacokinetic studies that have been developed for tacrolimus postorgan transplant over the last 2 decades.20 This article also focuses on MAP Bayesian analyses and subsequent dosage predictions. Factors commonly reported to influence tacrolimus pharmacokinetic parameters include total body weight, hematocrit, time posttransplant, hepatic function, and CYP3A5*3 polymorphisms.20 Interestingly, some covariates such as patient age and race were not commonly identified as significant, although their contribution to tacrolimus interindividual variability has been described.10 As a supplement to this article, we have conducted an investigation into the different covariate relationships identified by tacrolimus population pharmacokinetic models and their potential dependence on study design.
Our article aims to provide an update and critique on the specific factors contributing to tacrolimus population pharmacokinetic models developed in transplant recipients. The first objective was to establish a clear and detailed overview of the data, study design, and modeling methods employed (eg, types of patients, organ transplanted, tacrolimus formulation, and sampling strategy) to assess current practice and address understudied sources of variability. The second objective was to evaluate covariate relationships determined by the published pharmacokinetic models. This objective evaluated covariate consistency across the population pharmacokinetic studies and compared those factors that influence tacrolimus pharmacokinetic variability.
Methods
Search Strategy and Selection Criteria
Publications analyzed were identified through a systematic search on MEDLINE (PubMed) for all population pharmacokinetic analyses of tacrolimus that were published from January 1990 until June 2017. The following keywords were used to conduct the literature search: (((nonlinear mixed effect OR population) AND pharmacokinetic*) AND tacrolimus). The search was limited to the English language and human data. Additional studies were identified from the reference list of selected papers. We included all described tacrolimus population pharmacokinetic models for all types of transplants and healthy volunteers. Articles were restricted to nonlinear mixed-effects analyses. Reviews and methodological articles were excluded.
Data Extraction
For each article, information regarding the study design, modeling methods, and the results of the population pharmacokinetic analysis were extracted. In the Methods section, the following characteristics were recorded when available: number of patients, single-or multiple-center study, site/country, population ethnicity, tacrolimus formulation, initial tacrolimus oral dosing regimen, coimmunosuppressant therapy, medication adherence, posttransplant period, sampling strategy, steady-state conditions, tacrolimus assay, investigated covariates, modeling software, and final model evaluation method. Tacrolimus formulations included the route of administration (intravenous or oral), the type of oral release (ie, immediate or prolonged), and the drug name (Prograf, Advagraf, other generics, or “tacrolimus” when not reported). The report of specific medication adherence assessment and reconciliation was verified in each article. The sampling strategy included the time points, the number of concentrations, and the different sampling occasions. The sampling strategy was summarized as “trough” if only predose concentrations were used for model analysis, “intensive sampling” defined as ≥6 serial timed concentrations, and “limited sampling” if trough concentrations were taken with additional timed concentrations. The steady-state condition was reported as “all” if all patients were stabilized on tacrolimus during the study; “partial” if steady-state was not clearly reported for all patients or when sampling strategy was reported as “measurements until stabilization”; and “not indicated” if not reported. The investigated covariates included patient demographics, clinical/laboratory analyses, drug-drug interactions, and genotypic information. The evaluation methods were divided into 3 categories according to Brendel et al21: “basic internal” (goodness-of-fit plots, uncertainty of parameters estimates), “advanced internal” (data splitting, bootstrap, cross-validation. Monte-Carlo simulations via visual predictive check or posterior predictive check), and “external” when involving a comparison with a new patient group for validation.
In the Results section, the following characteristics were recorded when available: pharmacokinetic model structure, final significant covariates, final pharmacokinetic parameter estimates, and covariate relationships. The model structure included the number of compartments to describe tacrolimus disposition, zero- or first-order absorption and/or elimination processes, and the absorption process featuring use of lag-time or transit compartments to account for a potential delay. The covariates were defined as significant if their inclusion led to a decrease of the interindividual variability and a decrease of ≥3.84 points of the objective function value (P ≤.05). Final population parameter estimates and the associated potential between-subject variability (BSV) and/or between-occasion variability (BOV) were extracted. BSV and BOV before the inclusion of covariates on pharmacokinetic parameters were indicated when available. Last, unexplained residual error estimates (additive, proportional, exponential, or mixed) were recorded.
Once the survey was completed, descriptive statistics and graphical analyses were performed with GraphPad Prism 6.04 (GraphPad Software, La Jolla, California) and R 3.1.2 software (R Foundation, Vienna, Austria).
Results
Study Design and Modeling Methods
The literature search identified a total of 63 population pharmacokinetic analyses for tacrolimus, 60 of which involved solid organ transplant, from 1995 to 2017 with 65% of reports published after 2010. All study characteristics are summarized in Supplemental Table S1.
Population Characteristics.
The majority of the studies involved liver or renal transplant recipients: 41.5% (N = 27) adult renal transplant, 6.2% (N = 2) pediatric renal transplant, 24.6% (N = 16) adult liver transplant, and 20% (N = 13) pediatric liver transplant recipients (Figure 1A). Pediatric studies included patients between 6 months and 18 years of age. The search also included 1 study on adult lung transplant, 1 study on adult hematopoietic stem cell transplant, and 2 studies with healthy volunteers. For pharmacokinetic model development, 20.6% of the studies (N = 13) used data from ≥100 patients, 39.7% (N = 25) of the studies used a population between 50 and 100 patients, and 39.7% (N = 25) of the studies involved fewer than 50 patients (Figure 1B); 66.7% of the studies were single center, and 33.3% were multicenter. The analyses were performed primarily in Europe (47.6%, N = 30) and Asia (33.4%, N = 21), as shown in Figure 1C. The specific ethnicity of transplant recipients was unequally reported across the different study sites (ie, 67% in America but only 23% in Europe and 17% in Australia). The posttransplant period varied greatly from a few days to several years after the transplant (Figure 1D). Time posttransplant can be categorized into 3 groups: immediate postoperative period (≤2 weeks), acute postoperative period (≤6 months), and chronic postoperative period (≥6 months); 84.1% of the studies (N = 53) were performed during the first year posttransplant, and half of those were performed during the first 3 months posttransplant.
Figure 1.

Population characteristics. (A) Bar graphs of studies based on organ of transplant in adult and/or pediatric population. HSCT indicates hematopoietic stem cell transplant. (B) Bar plots of studies based on the number of patients included in the analysis.Number of patients was categorized in 3 groups (above 100, below 50, and in between). Bar plots on the left indicate the number of patients used to develop the pharmacokinetic model. Bar graphs on the right indicate the total number of patients used in the analysis (model-building group and potential external validation group). (C) Bar plots from different sites (countries). Percentages of studies by areas where ethnicity of the population has been reported in the publications are indicated in the graph. (D) Frequencies of studies based on time posttransplant. Postoperative time was categorized in different periods: first 2 weeks, first 3, 6, and 12 months after transplant, after 3, 6, and 12, months posttransplant. HV, healthy volunteers; NR, not reported.
Tacrolimus Dosing Regimen.
As shown in Figure 2A, only 6 studies used data from continuous intravenous administration followed by oral administration, which is necessary to properly estimate the parameters of the absorption process.22–27 In 77% of the studies, oral tacrolimus (immediate release) twice daily was evaluated, and 7% of models investigated the prolonged-release formulation with once-a-day dosing.28–31 The initial oral tacrolimus dosing regimen was not specified in 21.3% of the studies. The most common initial dose differed across transplant types and age: adult versus pediatric (Figure 2B). For 39% of adult renal transplant studies reported, an initial dose between 0.075 and 0.1 mg/kg twice daily was used compared to 0.1 and 0.2 mg/kg twice daily in 50% of adult liver transplant studies. Medication adherence assessment or completed reconciliation were not explicitly reported in the analyses. The steady-state conditions of the patients was not provided in 50% of the population studies (Figure 2C).
Figure 2.

Study design, bioanalysis, and modeling evaluation. (A) Bar plots of studies based on tacrolimus formulation for adult and pediatric liver and renal transplants. Formulations included oral immediate-release (twice a day) or prolonged-release (once a day) and continuous intravenous administration. The black bar plots indicate the use of both continuous intravenous and oral (immediate or prolonged release) administration. The white bar plots indicate the use of oral immediate-release administration, the dashed bar plots indicate the use of prolonged-release administration, and the dotted bar plot indicates the use of both oral immediate and prolonged release administrations. (B) Bar plots of studies based on the initial tacrolimus oral dosing regimen for adult and pediatric liver and renal transplants. Initial doses were categorized based on the most common dosing regimen given (in milligrams per kilogram), above and below. “Other” includes doses given in milligrams. (C) Bar plots of studies based on steady-state conditions of the study patients. All indicates studies in which steady-state was assessed for all patients; Partial, studies in which the steady-state condition was not assessed clearly for all patients. (D) The legend for 2D should be corrected as:Pie chart of pharmacokinetic sampling strategies used in the analyses. Trough indicates studies in which only trough measurements were sampled; Intensive, studies in which 6 or more than 6 timed samples were collected for all patients; Limited, studies in which a mixed strategy was used with trough samples for some patients along with additional samples collected for some patients. (E) Bar plots of studies based on the assay method used to determine tacrolimus concentration. Assay was categorized in immunoassay methods and analytical methods. Percentages of each specific method are indicated for each category. (F) Bar plots of studies based on the evaluation method used to validate the pharmacokinetic model. Advanced internal indicates the use of methods based on simulations; Basic internal, use of precision of parameter estimates and goodness-of-fit plots; External, use of an external validation group of patients. ACMIA indicates antibody-conjugated magnetic immunoassay, Siemens (Hoffman Estates, Illinois); CMIA, chemiluminescence microparticule immunoassay performed on the Architect Analyzer (Abbott Diagnostics, Lake Forest, Illinois); EMIT, enzyme-multiplied immunoassay technique (Dada-Behring Diagnostics, Milton Keynes, UK); MEIA, microparticle enzyme immunoassay assay on the IMx analyzer (Abbott Laboratories, Abbott Park, Illinois); NR, not reported; TFC, turbulent-flow chromatography; (U/HP)LC-MS/MS, ultra/high-performance liquid chromatography-tandem mass spectrometry.
Tacrolimus Pharmacokinetic Sampling, Sample Matrix, and Assay Method.
Almost half of the studies relied on trough measurements only to develop a population pharmacokinetic model (Figure 2D). In 30% of remaining studies, an intensive sampling strategy with ≥6 sampling times was used, and 63% were conducted at several occasions posttransplant. In 19% of remaining models, a limited strategy using troughs and additional time points for selected patients was employed.
To develop these population pharmacokinetic models, tacrolimus concentrations were analyzed in ~70% of studies using immunoassays that initially consisted of microparticle enzyme immunoassay and enzyme-multiplied immunoassay technique.16,32,33 With increased use of tacrolimus minimization protocols, newer immunoassays such as chemiluminescent microparticle immunoassay (N = 10) were introduced and provided improved sensitivity to less than 1 ng/mL with enhanced specificity.34–40 In the remaining studies (~30%), the assays conducted used a liquid chromatographic method coupled with mass spectrometry, which provides lower sensitivity and improved specificity but has limited availability at many centers (Figure 2E). Assay methodology was not found to be a significant covariate. All studies reported the measurement of tacrolimus in blood with the exception of 1 study that analyzed the drug in both plasma and blood.35
Population Pharmacokinetic Modeling and Evaluation.
In the majority of the studies, the population pharmacokinetic analysis was performed with the standard software NONMEM (Icon Development Solutions, Ellicott City, Maryland). The influence of various covariates (ie, demographic, clinical/laboratory, disease-related, concomitant treatment, and genotypes) on tacrolimus pharmacokinetic parameters was investigated (Table 1). The most commonly screened covariates were total body weight, age, sex, hematocrit, liver functions (aspartate aminotransferase, alanine aminotransferase, and total bilirubin), serum creatinine, time posttransplant, coimmunosuppressant treatment, and interactive drug use. Genotypes were investigated in 54% of the studies, with the majority conducted in renal transplant patients and the remainder in liver transplant recipients. Most of the final developed models were evaluated with advanced internal and/or external methods (Figure 2F).
Table 1.
Frequencies of Investigated Covariates
| Demographic (97%) | >85% | Total body weight, age, sex |
| 10% to 25% | Race, height, body mass index, body surface area | |
| <10% | Lean body weight, donor age, ideal body weight, donor sex | |
| Clinical/laboratory (94%) | > 54% | Hematocrit, ASAT, ALAT total bilirubin, serum creatinine |
| 28% to 50% | Serum albumin, alkaline phosphatase, hemoglobin, γ-glutamyltransferase, total protein | |
| 10% to 20% | Blood/serum urea nitrogen, creatinine clearance, glomerular filtration rate, red blood cell | |
| < 10% | White blood cells, lactate dehydrogenase, C-reactive protein, INR, platelets, glucose, total cholesterol, high-density lipoprotein and low-density lipoprotein, triglycerides, factor V, hepatitis B virus, lutein dehydrogenase, B/P, E/P uric acid, creatinine kinase, bile drainage, 4β-hydroxycholesterol | |
| Disease-relateda (84%) | > 70% | Postoperative day (POD) |
| 10% to 15% | Graft origin, graft/transplant size, total daily dose | |
| < 10% | Transplant size/body weight ratio, whole/split transplant, assay method, days of tacrolimus therapy, drug formulation, hot or cold ischemic time, diabetes mellitus, dialysis before transplant, preemptive transplant, cystic fibrosis, nephropathy, time of drug intake, biliary reconstructive procedure, Child-Pugh score, number of prior transplants, enrolling center, CMV serostatus, acute rejection episodes, body temperature, population (patient vs healthy volunteers), primary diagnosis | |
| Cotreatmenta (59%) | 46% | Immunosuppressant treatments: CST (prednisone, methylprednisolone), MMF, azathioprine, cyclosporine, basiliximab, daclizumab |
| 26% | Interactive drugs: β-blockers, calcium-channel blockers (diltiazem, verapamil, nifedipine, amlodipine, felodipine), ACEi, ARB, antibiotics (rifampicin, cotrimoxazole), anticonvulsants (phenytoin, phenobarbital), antifungal (fluconazole, amphotericin B), proton-pump inhibitor (pantoprazole, omeprazole), antidiabetic (sulfonylureas), diureties, anti-CMV drug, sodium bicarbonate, vitamin D analogues, oral contraceptives, oxybutynin, growth hormone | |
| Genotypica (54%) | > 50% | CYP3A5 (rs776746) |
| 10% to 25% | CYP3A4 (rs35599367), ABCB1 (rs1128503, rs2032582, rs1045642) | |
| < 5% | CYP3A5 (rs10264272, rs41303343), CYP3A4 (rs2740574, rs2242480, rs12114000), ABCB1 (rs3213619, rs2229109), ABBC2 (rs717620, rs2273697, rs8187694, rs3740066), ABCG2 (rs2231142), PXR-hNR1I2 (rs3814055, rs1523127, rs2276706, rs1464603, rs6785049), POR*28 (rs1057868), IL10 (rs1800896), SIM1 (rs3734354), SERPING1 (rs4926), APOA5 (rs3135506), GAN (rs2608555), ABCB1, CYP3A5 and CYP3A4 mRNA expression |
ACEi indicates angiotensin-converting enzyme inhibitor; ALAT, alanine aminotransferase; ARB, angiotensin receptor blocker, ASAT, aspartate aminotransferase; B/P, blood to plasma concentration ratio; CMV, cytomegalovirus; CST, corticosteroids; E/P, erythrocyte to plasma concentration ratio; INR, international normalized ratio; MMF, mycophenolate mofetil.
Different frequencies between liver and renal transplant studies. Genotypic factors were investigated in 81% of renal transplant studies and in 21% of liver transplant studies. Disease-related factors were investigated in 77% of renal transplant studies and in 96% of liver transplant studies. Cotreatment was investigated as a covariate in 68% of renal transplant studies and in 57% of liver transplant studies.
Population Pharmacokinetic Model Structure and Final Covariates
For each study, the final pharmacokinetic model structure, the investigated covariates, the final significant covariates retained in the pharmacokinetic model, the pharmacokinetic parameter estimates, and parameter-covariate relationships are summarized in Supplemental Table S2.
Population Pharmacokinetic Model Structure.
The different structures of the final models are shown in Figure 3A. Tacrolimus time-course profiles were best described by 1- (52.4%) and 2-compartment models (44.4%) with first-order elimination. These models included an absorption rate constant ka, central clearance CL, and volume of distribution V plus peripheral clearance CLp and volume Vp in the case of a 2-compartment model. Twenty-seven percent of the studies used a lag-time TLag to account for a delay in the absorption process, and 11.1% used transit compartments (Erlang model) defined by a first-order rate constant ktr. In the majority of the studies based only on oral tacrolimus concentrations, the bioavailability was not estimated, and so apparent clearance and volume parameters (ie, CL/F, V/F, CLp/F, Vp/F) were reported. Bioavailability was estimated in 6 studies that involved concentration-time data after both continuous tacrolimus intravenous infusion and oral administration, and in 1 study in which the tacrolimus dosing regimen was unclear,41 with a mean of 13.7% (range 6.77%–19.7%). In 3 studies, bioavailability was fixed to a value reported in the literature (range 20%–23%).28,42,43 Most studies described tacrolimus whole-blood concentrations. In 1 study, whole-blood and plasma concentrations were measured to develop 2 pharmacokinetic models and explore the impact on the erythrocyte-to-plasma concentration ratio.44 In 4 studies, tacrolimus concentrations were standardized to a hematocrit value of 45% to account for the binding to erythrocytes, assuming no saturation of plasma proteins.34,35,45,46 Last, a “steady-state infusion” model was used in 2 studies (3.2%),47,48 in which the tacrolimus trough concentrations Css were calculated by dividing the dosing rate (total daily dose over 24 hours) by estimated CL/F, which in this case is a regression parameter and defined as an approximation of the actual apparent tacrolimus clearance.
Figure 3.
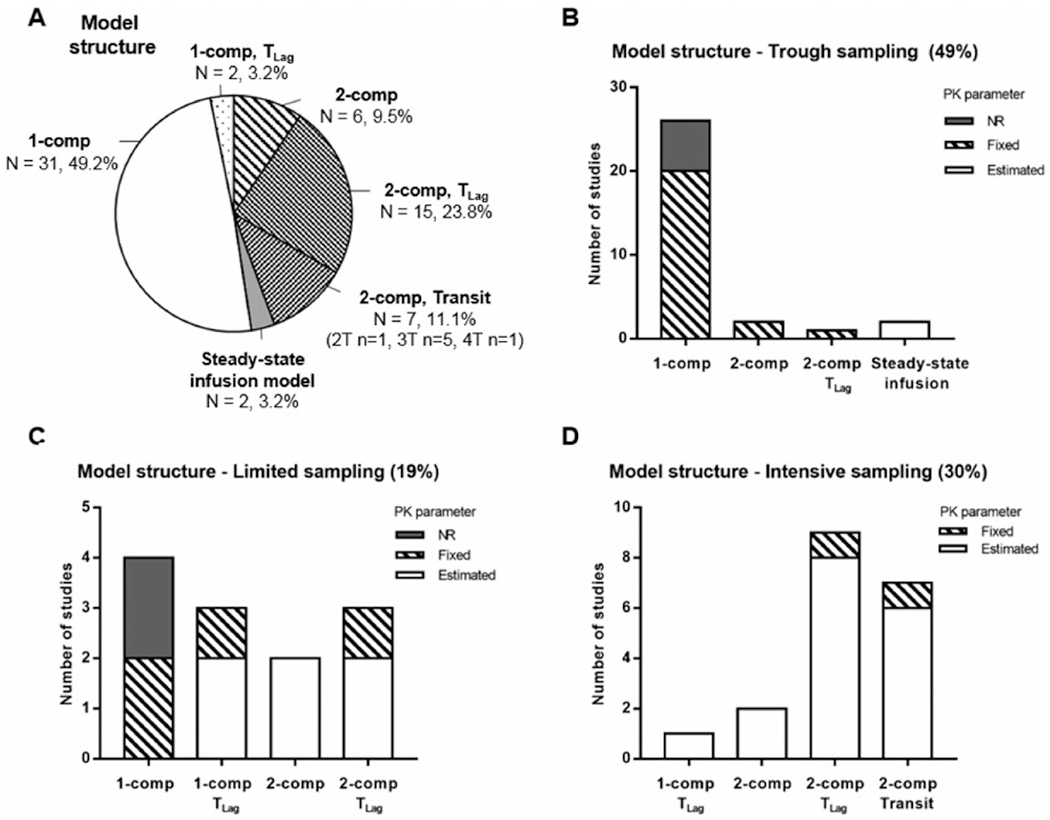
Final pharmacokinetic (PK) model structure and sampling strategy. (A) Pie chart of PK model structures used in the analyses: 1- or 2-compartment (1- or 2-comp) model with first-order elimination, with or without a lag time (TLag) or transit compartments (Transit, T) to describe the absorption process, and steady-state infusion model. (B) Bar graphs of the model structures used in the studies involving tacrolimus trough concentrations only. (C) Bar graphs of the model structures used in the studies involving tacrolimus trough concentrations for some patients and additional measurement for some other patients. (D) Bar graphs of the model structures used in the studies involving full tacrolimus concentration-time proles (intensive sampling). In B, C, and D, the different model structures account for whether PK parameters such as ka and Vp(/F) were estimated, fixed, or not reported (NR). This applied only to the following PK parameters: the absorption rate constant ka for the 1-compartment models along with the (apparent) peripheral volume of distribution Vp(/F) for the 2-compartment models.
The ultimate model structure may be related to the sampling strategy. The more timed concentrations per patient, the more complex the model. In Figures 3B–D the model structure is shown based on the sampling strategy. In the studies using tacrolimus troughs only, 81% of the models utilized a 1-compartment structure. In 74% of these studies, several parameters had to be fixed to a value derived from the literature. For comparison, in the studies using an intensive sampling strategy, the majority of the pharmacokinetic models had a 2-compartment structure with a lag-time (47%) or with transit compartments (37%), and only 2 studies reported fixed parameters.49,50
In addition to a significant decrease in the NONMEM objection function value, selection criteria for significant covariates included a decrease in BSV/BOV of associated pharmacokinetic parameters, indicating the magnitude of variability the covariate explains. Only 47% of the studies reported BSV and/or BOV parameters before and after covariate inclusion or indicated the variability explained by the covariate inclusion. The unexplained residual error was described by a proportional (35.9%), additive (26.6%), mixed proportional-additive (20%), exponential (3.1%), or mixed additive-exponential (3.1%) models, and this term was not reported in 6.3% of the studies.
Final Covariates.
Across all the studies, numerous covariates were found to be significant on different pharmacokinetic parameters (P ≤.05) and are summarized in Table 2. An average of 3 final significant covariates on 2 pharmacokinetic parameters per study was observed. A significant impact of 1 or several covariates was found on tacrolimus CL(/F) and/or V(/F) in 98.4% and 46% of the studies. For these parameters, the number of times a covariate was retained in the final pharmacokinetic model was compared to the number of times this same covariate was investigated across all studies (Figure 4). Only the main covariates reported on the pharmacokinetic parameters are discussed below.
Table 2.
Final Covariates Included in the Models
| Pharmacokinetic Parameter | Number of Studies With Significant Covariate(s) | Number of Significant Covariates | Covariate (Number of Studies Where It Was Retained as Significant) |
|---|---|---|---|
| CL(/F) | 62 | 29 | bCYP3A5*3 (n = 29), POD (n = 25),HCT (n = 18), BW (n = 16), ASAT (n = 7), Age (n = 7), tBIL (n = 6), ALB (n = 4), SCR (n = 4), DOSE (n = 4), immunosuppressant treatment (n = 4), interactive drugs use (n = 4), ALAT (n = 3),W/S (n = 3), LBW (n = 3),ALP (n = 2),GW(n = 2), tPROT (n = 2),GW/BW(n = 2), γGT (n = 2), dCYP3A4*22 (n = 1), ABCB1 mRNA (n = 1), ABCB1 haplotype (n = 2), ABCC2 haplotype (n = 1), FV (n = 1), DAY (n = 1),Population (n = 1), INR (n = 1),UREA (n = 1) |
| V(/F) | 29 | 13 | BW(n = 15), POD (n = 4), LBW (n = 2),HCT (n = 2), tPROT (n = 2),BSA (n = 1), ALAT (n = 1),Height (n = 1), E/P (n = 1), FORM (n = 2), immunosuppressant treatment (n = 1), BMI (n = 1), HB (n = 1) |
| aF | 8 | 10 | POD (n = 3), CYP3A5*3 (n = 3), Cotreatment (n = 2),DOSE (n = 2), BW (n = 1), tBIL (n = 1), FORM (n = 1), CF (n = 1), Age (n = 1), sex (n = 1) |
| Vp(/F) | 7 | 5 | BW(n = 3), LBW (n = 3), BSA (n = 1), RBC (n = 1),HCT (n = 1) |
| CLp(/F) | 6 | 3 | BW(n = 3), LBW (n = 3),HCT (n = 1) |
| ka | 4 | 3 | FORM (n = 2), Time of drug intake (n = 1), sub study (n = 1) |
| TLag | 3 | 3 | Diabetes mellitus (n = 1), POD (n = 1), substudy (n = 1) |
| Ktr | 2 | 2 | FORM (n = 1), CF (n = 1) |
ALAT indicates alanine aminotransferase; ALB, serum albumin; ALP, alkaline phosphatase; ASAT, aspartate aminotransferase; BMI, body mass index; BSA, body surface area; BW, total body weight;CF, cystic fibrosis;CL(/F), (apparent) central clearance; CLp(/F), (apparent) peripheral clearance;d-, donor (recipient otherwise); DAY, day of tacrolimus therapy; DOSE, total tacrolimus daily dose; E/P, erythrocyte to plasma ratio; F, bioavailability; FORM, tacrolimus formulation (immediate or prolonged-release); FV, factor V; γGT, γ-glutamyltransferase; GW, graft weight; HB, hemoglobin; HCT, hematocrit; INR, international normalized ratio; ka, absorption rate constant; ktr, transit compartment rate constant; LBW, lean body weight; POD, time posttransplant; Population, patient versus healthy volunteers RBC, red blood cells count; SCR, serum creatinine; tBIL, total bilirubin; TLag, absorption lag time; tPROT, total proteinemia; UREA, blood/serum urea nitrogen; V(/F), (apparent) central volume; Vp(/F), (apparent) peripheral volume; W/S, whole/split transplant.
F was estimated in 2 studies with intravenous data available, fixed to value from the literature 23% in 1 study. In 6 studies, covariates were reported on F relative to the value of 1.
CYP3A5*3 rs776746: recipient (n = 20 studies), donor (n = 2), both recipient and donor combined (n = 1) or not combined (n = 1), CYP3A5*3*6*7 genotypes (n = 1), CYP3A5*3 and CYP3A4*1G rs2242480 combined (n = 2), CY3A5*3 and CYP3A4*22 rs35599367 combined (n = 1), CYP3A5*3 and POR*28 rs1057868 combined (n = 1).
Figure 4.

Frequency of covariates on tacrolimus population pharmacokinetic studies. The number of studies that retained a covariate as significant in their final pharmacokinetic model on either tacrolimus central clearance (A) or volume of distribution (B) is compared to the number of studies in which that same covariate was investigated. These graphs aim to highlight the covariates that are the most systematically found to be significant on tacrolimus pharmacokinetics parameters. CYP3A5*3 rs776746 variant included recipient and/or donor genotype. This category also included the CYP3A5*3 combined with other genotypes (CYP3A4*22, CY3A4*1G, and POR*28) ALAT indicates alanine aminotransferase; ALB, serum albumin; ALP, alkaline phosphatase; ASAT, aspartate aminotransferase; BW, total body weight including BW inclusion through the size parameter;DAY, day of tacrolimus therapy;Dose, total daily tacrolimus dose; FV, coagulation factor V; γGT, γ-glutamyltransferase, CYP3A4*22 recipient or donor; GW, graft weight;HCT, hematocrit; iCT, interactive drugs use; imCT, immunosuppressant cotreatment; INR, international normalized ratio; LBW, lean body weight; POD, time (day) posttransplant; Population, liver transplant recipients versus healthy volunteers; SCR, serum creatinine; tBIL, total bilirubin; tPROT, total proteinemia; UREA, blood/serum urea nitrogen; W/S, whole/split transplant.
Central Clearance
CYP3A5 Genotypes.
Twenty-nine covariates were identified as significant on tacrolimus CL(/F). The most common covariate was the CYP3A5*3 (rs776746) genotype (46% of the studies, N = 29). This enzyme is responsible for the majority of tacrolimus metabolism in the liver and small intestine,51 and genetic variations in the CYP3A5 enzyme could explain 40% to 50% of the variability in tacrolimus clearance.7 The CYP3A5*3 variant alone was retained as a significant covariate on CL(/F) in 24 studies (82.9%). In 5 studies, the combination of the CYP3A5*3 variant with other genotypes was found to be significant: CYP3A5*3*6*7 (N = 1), CYP3A4*22 (N = 1), CYP3A4*1G (N = 2), and POR*28 (N = 1).48,52–55 Most of the studies only considered and/or retained the transplant recipient genotype (82.6%). However, 2 studies identified the covariate of CY3A5*3 variant from the transplant donor,38,56 and 2 studies retained both the recipient and donor CYP3A5*3 genotypes as significant covariates.28,57 Tacrolimus CL(/F) was significantly higher in CYP3A5*1 expressers (homozygous or heterozygous) compared to CYP3A5*3*3 nonexpresser. In 82.6% of all these studies, CYP3A5*3 genotype was categorized in 2 groups—CYP3A5 expressers and nonexpressers—with an average tacrolimus CL(/F) fractional change of 1.66 (range 1.15-2.5) in CYP3A5 expressers. In only 13.8% of the studies (N = 4), CYP3A5*3 variants were categorized into 3 groups: CYP3A5*1*1, *1*3, and *3*3, which were defined as extensive, intermediate, and poor metabolizers.37,47,48,58 The fractional change in the average tacrolimus clearance was 1.39 (range 1.18-1.69) for intermediate and 1.8 (range 1.25-2.0) for extensive metabolizers compared to that of poor metabolizers. Across all the studies that investigated the CYP3A5*3 variant, the frequencies of the wild-type *1*1, heterozygous *1*3, and homozygous *3*3 were not equal. On average, homozygous *3*3 variant represented 66.3% of the patients (range 9%–91.8%), whereas heterozygous *1*3 represented 27.9% of the patients (range 6.8%–76%). CYP3A5*1*1 variant was poorly represented, with an average of 6.6% (range 1.2%–23.3%), and this variant was absent in 5 studies.31,38,43,45,54 The lack of representation of the wild type *1*1 could explain the fact that no significant distinction was found between the CYP3A5*1 expressers (wild type and heterozygous) in most studies. The distribution of the CYP3A5 genotypes is highly correlated with race.7 The CYP3A5*3 allele is common among whites but less frequent in blacks, who are usually categorized as intermediate and extensive metabolizers. When included as the unique covariate on tacrolimus CL(/F), which accounted for 13% of cases, the CYP3A5*3 genotype explained on average 23.5% of interindividual variability (range 8.5%–31%). As shown in Figure 4A, 88% of the studies that investigated the CYP3A5*3 genotype had retained the variant as significant in the final model.
Time Posttransplant.
The second most common significant covariate on tacrolimus CL(/F) was the time posttransplant (39% of the studies, N = 25). The impact of time posttransplant on tacrolimus CL(/F) is controversial and tends to be related to the postoperative period under which the studies were conducted. The impact of the covariate was 2-fold greater in liver transplant recipients (N = 17) than kidney transplant recipients (N = 8). In 17 studies performed in the immediate and acute posttransplant period (average ≤2 months), tacrolimus CL(/F) was found to increase with time posttransplant, which was primarily included as a continuous covariate. Three studies used a categorical or a piecewise linear model,56,59,60 and 6 studies used a sigmoid relationship in which tacrolimus CL(/F) increased with time posttransplant until a plateau was reached after 1 month (range 20–100 days).22,38–40,61,62 The increase or recovery of tacrolimus CL(/F) immediately after surgery was explained by a regeneration of the graft (liver) leading to improvement of hepatic function as documented by increasing gastrointestinal motility and metabolic functions. In contrast, 7 studies conducted during the chronic postoperative period (≥3 or 6 months) reported a decreased tacrolimus CL(/F) with increasing time posttransplant, through continuous, categorical, or piecewise linear models. The inverse correlation between time posttransplant and tacrolimus CL(/F) after a few months is in agreement with the lower dosages recommended by the FDA prescribing information to maintain target troughs as the treatment time progresses.3 The adjustment to lower dosages can be explained by a decrease in tacrolimus clearance and/or increase in the oral bioavailability, potentially due to increased hematocrit and albumin concentration with time, dietary changes, concomitant medications, or other physiological changes that are less well characterized or not examined, such as gastrointestinal tract motility, fluid status, and lipoprotein concentrations.42,48,63–66 One study reported both positive and negative correlations with an increase of tacrolimus CL(/F) during the first 3 days after surgery and a decrease with progressive duration of therapy after 35 days.67 As shown in Figure 4A, 54% of the studies retained this covariate as significant in the final pharmacokinetic model, concurrent with another covariate. Approximately 80% of studies that included time posttransplant were conducted during the immediate or acute posttransplant period. Similar to the time posttransplant, 2 studies reported an inverse correlation between tacrolimus CL(/F) and the number of days of tacrolimus therapy.36,68
Hematocrit.
The third most common covariate reported on tacrolimus CL(/F) was the hematocrit (28.6% of all the studies). Tacrolimus is highly bound to erythrocytes.6 A low hematocrit results in an increase in free/unbound whole-blood drug concentration, which leads to an increase of the total body clearance. The hematocrit fraction is generally lower in renal transplant recipients in the immediate postoperative period and can then increase as the kidney functions recover.69 Hematocrit fractions were inversely correlated to tacrolimus CL(/F), and reported mostly as a continuous covariate. Four studies included the hematocrit fraction as a categorical covariate by defining low and normal hematocrit groups with a mean cutoff value of 32% (range 28%–35%). In 1 study, this covariate relationship was not reported clearly.45 As shown in Figure 4A, 38% of the studies that investigated this covariate retained it as significant in the final model, always with another covariate, except for 1 study in which it was the only final covariate.49
Body Weight.
The fourth most common covariate reported on tacrolimus CL(/F) was total body weight (25.4% of all the studies). Similarly, the lean body weight was reported as significant in 4 studies.34,35,45,46 These covariates influenced either only tacrolimus CL(/F) (N = 4) or all clearance and volume parameters (N = 14). As total body weight or lean body weight increases, tacrolimus CL(/F) also increases. Weights were mostly included as a power allometric model centered to the median weight. The allometric coefficient was fixed to 0.75 and estimated (range 0.21-0.87) in 67% and 11% of these studies. Two studies used a linear relationship,44,67 and 2 studies included total body weight through a size parameter.26,56 As shown in Figure 4A, only 27% of the studies that investigated this covariate retained it as significant in the final pharmacokinetic model.
Miscellaneous.
Numerous other covariates were investigated and/or found on tacrolimus CL(/F). For instance, liver function tests were retained as significant covariates, primarily in liver transplant studies that included aspartate aminotransferase in 5 liver transplant and 2 renal transplant studies, serum albumin in 4 liver transplant studies, and total bilirubin in 6 liver transplant studies. Patient age was retained as a significant covariate in 7 studies, which included 3 pediatric and 4 adult models and was investigated in 90% of all studies.25,38,47,48,52,70,71
Central Volume of Distribution
Body Weight.
Thirteen different covariates were found to have a significant impact on tacrolimus V(/F) (Table 2). The most common covariate was total body weight (23.8%). Similarly, lean body weight, body mass index, and body surface area were reported as significant on tacrolimus V(/F) in several studies.25,34,45,46 These covariates influenced only the tacrolimus V(/F) in 7 studies or were associated with all clearance and volume parameters (N = 11). Similar to tacrolimus CL(/F), weight terms were primarily included as a power model centered to the median weight. The allometric coefficient was fixed to 1 and estimated (range 0.44-0.9) in 63.2% and 15.8% of these studies. One study used another linear relationship,58 and 2 studies included total body weight through a size parameter.26,56 As shown in Figure 4B, only 25% of the studies investigated this covariate with significant retention in the final pharmacokinetic model.
Miscellaneous.
The remaining significant covariates on tacrolimus V(/F) were found in fewer than 7% of all the studies. Among them, the time posttransplant was found to significantly impact tacrolimus V(/F) in 4 studies, along with an impact on tacrolimus CL(/F) at various postoperative periods that ranged from 2 weeks to 1 year after surgery.60,66,72,73 Tacrolimus V(/F) was reported to increase with time posttransplant. One study explained this effect with a correlation between time posttransplant and an increase in the hematocrit fraction across time.66 As the patients recover from surgery, erythrocytes and plasma proteins increase, leading to greater bound tacrolimus concentrations resulting in greater volumes of distribution. The hematocrit fraction itself was retained as a significant covariate on tacrolimus V(/F) in 3 studies.44,45,74 Tacrolimus V(/F) was generally reported to increase with increasing hematocrit. However, 1 study conducted in the immediate posttransplant period reported decreased V(/F) with increasing hematocrit.44
Other Pharmacokinetic Parameters
Ten different covariates were found to have a significant impact on tacrolimus bioavailability (Table 2). Among the studies including a covariate on bioavailability, 2 studies were conducted with both oral and continuous intravenous tacrolimus data so that bioavailability was estimated25,27; 1 study fixed it to a value from literature (23%),43 and 5 studies used apparent pharmacokinetic parameters and included covariates on bioavailability relative to the value of 1.34,37,45,46,75 The most common covariates retained were the CYP3A5*3 genotypes (N = 3 studies) and the time posttransplant (N = 3 studies). The CYP3A5*3 genotypes were categorized in 2 groups in all these studies with a lower bioavailability for CYP3A5 expressers compared to CYP3A5 nonexpressers. Greater bioavailability was found in the immediate postoperative period and decreased as time progressed after surgery.27,34,46
The peripheral pharmacokinetic parameters of the 2-compartment model, Vp(/F) and CLp(/F), were not influenced by covariates in the majority of these studies. The most common covariate reported was total body weight (N = 3 studies).50,76,77 Vp(/F) and CLp(/F) were also allometrically scaled with lean body weight in 3 studies34,45,46 and with body surface area for Vp(/F).78 In fewer than 7% of the studies, a significant covariate was retained in the final pharmacokinetic model on the following absorption parameters: ka, ktr, and TLag. 30,34,37,43,45,46,71,75,79
Discussion
The determinants and mechanisms underlying the clinical pharmacokinetic variability of tacrolimus have been reported in the literature and have highlighted the critical role of CYP3A5 enzyme-transporter interplay.2,5,10 Critical review articles provide meaningful insights on tacrolimus pharmacogenetics in renal transplantation, which could improve clinical outcomes by individualizing immunosuppressive therapy.7,80–82 Population pharmacokinetic modeling aims to quantify the impact of different factors on the dose-concentration relationships and to provide dosing recommendations that may result in clinically significant shifts in the therapeutic outcome. Brooks et al. published an excellent article summarizing the available data on tacrolimus population pharmacokinetics and the use of limited sampling strategies to predict drug exposure.20 We have provided an update on tacrolimus population models and the contribution of common covariates to pharmacokinetic variability by employing a detailed literature search and study design evaluation that incorporates patient subpopulations, clinical and laboratory outcomes, and dosage formulations. This information has not been evaluated and reported in such a manner to date. Our objective was not to compare the different pharmacokinetic parameters estimated across the studies quantitatively but to confront the significant covariates that have been identified to explain tacrolimus variability and the considerations to include in their use to guide dosing individualization.
For the last 2 decades, tacrolimus pharmacokinetics has been extensively analyzed using a population-based approach in adult and pediatric renal and liver transplantation with the immediate-release formulation (Figures 1A and 2A). Only a few analyses have involved lung or non-solid-organ transplant and the extended-release formulation, which will require additional investigation. Overall, the published population analyses were assessed following the suggested guidelines.83 The model structure largely depended on the sampling strategy (Figure 3). A 2-compartment model with delayed absorption was found to best describe the full tacrolimus concentration-time profile and thus should be used to correctly characterize drug exposure (ie, AUC). However, when the analyses only involved tacrolimus trough concentrations, the pharmacokinetic parameters for these model structures could not be properly estimated. Thus, most of these analyses resulted in simple 1-compartment models with nonidentifiable parameters. A lack of correlation between trough concentrations and tacrolimus AUC has been previously reported in several studies.5,9,16 This is an important point to emphasize because nearly 50% of the population analyses were performed using trough concentrations only (Figure 3A). As a result, an inappropriate model structure may potentially lead to misleading pharmacokinetic parameters and characterization of drug exposure and could impact the interpretation of covariate relationships. This may impact the calculation of therapeutic drug exposures critical to allograft function. Therefore, the sampling strategy should be chosen carefully. The preferred matrix measured for tacrolimus concentrations is blood. Consistency and improved sensitivity in the assay method remain critical for model development and clinical applicability, especially due to the increased prescribing of tacrolimus minimization protocols.16,17 Although it is not clear whether the analytical assay affects model performance, we might wish to select a model that uses the same analytical methods and matrix as planned for individualized therapy optimization.
Another important factor that is rarely verified in these tacrolimus models is medication adherence and reconciliation assessments. The assessment of medication adherence in most transplant recipients was not explicitly reported and/or confirmed, which is essential with a narrow-therapeutic-range drug such as tacrolimus. In addition, medication nonadherence is a critical issue to verify in model development for many chronic drugs that exhibit notable adverse effects and serious clinical outcomes such as allograft rejection. If adherence is not confirmed for chronic therapies, significant bias in the population pharmacokinetic parameter estimates and potential overestimation of the interindividual variability may result.84,85 Therefore, medication reconciliation with adherence assessment becomes a critical clinical function to verify in order to ensure appropriate interpretation of results.
The main findings of this article are the considerable number of covariates found to significantly impact tacrolimus pharmacokinetics and the lack of consistency across all analyses (Figure 4). The majority of the studies identified at least 1 covariate on tacrolimus clearance; however, almost 30 different factors have been identified. The most consistent significant covariate was the CYP3A5 genotypes, specifically focused on the CYP3A5*3 variant. This covariate was systematically retained in the final models investigated (Figure 4), which supports its major role in explaining tacrolimus pharmacokinetic variability, and was incorporated in recent Clinical Pharmacogenetics Implementation Consortium dosing recommendations for tacrolimus.13 Thus, all future analyses should consider including at least the CYP3A5*3 genotype when a covariate analysis is performed for tacrolimus. This article also highlights a lack of consistency between the sources of tacrolimus variability previously described and the covariates identified by the population models.5,10 For example, the liver function tests and albumin concentrations, which are frequently investigated, were not consistently found to influence tacrolimus disposition (Figure 4). In addition, the influences of patient age and race were not reported in the majority of these studies, although these are fundamental patient demographics when dosing adjustments are necessary. This may be explained by the design and patient selection of the analyses. Tacrolimus pharmacokinetics has been studied in the pediatric population extensively; however, only 1 study has compared adult and pediatric patients simultaneously. The study by Jacobson et al suggests that elderly patients should receive lower doses of calcineurin inhibitors using a statistic model based on trough, but no population pharmacokinetic study to date has been specifically designed to analyze tacrolimus pharmacokinetics in elderly patients.86 Sex was not found to be a significant covariate on tacrolimus pharmacokinetics. However, this may be explained by the fact that the sex effect is usually embedded with the total body weight effect. No specific study was designed to investigate the impact of sex. Surprisingly, few studies involved black transplant recipients, although tacrolimus pharmacokinetic variability between black and white populations has been described and led the FDA to provide specific dosing suggestions.3,10 This variability may be explained by racial differences in frequencies of CYP3A5*1 (wild type) compared to CYP3A5*3 genotypes.7 The extensive metabolizer phenotype (ie, CYP3A5*1 wild type with 2 functional alleles) is more common among blacks than whites.7 In the models evaluating the CYP3A5*3 variant covariate, with an emphasis on European populations, this phenotype was consistently misrepresented, and the patients were primarily categorized as expressers versus nonexpressers. An appropriate distribution of the target genotypes within the population is important to accurately describe the final allele variant relationship to pharmacokinetic end points in the model. These different examples suggest the potential need for the application of a meta-analysis approach with multiple data sources to assess different types of populations. This approach could address critical gaps in correctly identifying and quantifying sources of pharmacokinetic variability. Model analyses incorporating these demographics were previously performed for furosemide and hydrochlorothiazide.87,88
Population pharmacokinetic modeling should not only seek to identify the factors influencing drug disposition but also provide subsequent dosing adjustments to ensure the best possible therapeutic response in patients. Only 17% of the studies (N = 11) investigated the covariate influence on the dosing regimen through simulations, proposed dosing adjustments, or evaluated current dosing recommendations. A lack of discussion across the studies was found regarding the clinical relevance of the final covariate analysis. There was no clear consistency regarding the magnitude of tacrolimus pharmacokinetic interindividual variability explained by the covariate from which relevant dosing adjustment recommendations should be proposed. A covariate explaining more than 30% of the variability associated with a pharmacokinetic parameter may lead to relevant dosing adjustment recommendations, but what is the significance of a covariate explaining <10% of the pharmacokinetic variability? Moreover, several studies did not report the magnitude of the variability explained by the covariate inclusion (Supplemental Table S2), which clouds the clinical utility of the respective model. Therefore, this quantitative approach should be a critical point to consider for determining and evaluating the value of the population model outcomes and their utility to guide dose individualization. Along with prior dosing recommendations, the population-based pharmacokinetic models should represent a potential tool for practical clinical application. Specifically for drugs that exhibit a narrow therapeutic window requiring close monitoring, Bayesian estimators based on population pharmacokinetic models can be developed to project the individual drug exposure from sparse feedback measurements of drug concentration and limited sampling strategies.89,90 These approaches developed for tacrolimus have been reviewed by Brooks et al.20 The authors highlighted the potential for Bayesian forecasting dosage prediction to achieve AUC targets and providing the benefits on individual outcomes compared to current therapeutic drug monitoring based on trough concentrations only. However, further research is still required to determine the most appropriate population model with relevant covariates for tacrolimus. Clinical use of population pharmacokinetic modeling and software-guided dosing has demonstrated efficiency for different drugs, such as warfarin, in which the influence of 2 genotypes, CYP2C9 and VKORCI, were incorporated in the population model to predict individual dosing.91,92 Therefore, development of Bayesian forecasting methods for tacrolimus-targeting CYP3A5 genotypes should be considered to inform and guide clinicians in achieving more individualized dosing regimens.
Conclusions and Prospectus
Numerous population pharmacokinetic models have been created for tacrolimus in various organ transplants. A considerable number of covariates have been identified as sources of interpatient variability on tacrolimus pharmacokinetics with a lack of consistency across the models evaluated. From this evaluative article, the CYP3A5 genotypes appeared to be the most consistent covariate, demonstrating a notable impact on tacrolimus clearance that results in essential dosing adjustments to achieve comparable targeted concentrations among transplant patients. We aimed to evaluate, critique, and address potential gaps in tacrolimus pharmacokinetic model development in terms of populations evaluated to quantify the impact of clinical and demographic covariates and improve approaches to personalized dosing regimens and overall exposure.
The availability of tacrolimus population pharmacokinetic models provides the opportunity to combine these models with patient characteristics and feedback measurements of drug concentrations to estimate individual pharmacokinetic parameters using sparse data. This approach enables the projection of the individual expected time course of tacrolimus exposure and provides a basis for adjusting the drug regimen. However, this article clearly documents that there is considerable heterogeneity among the population pharmacokinetic models reported for tacrolimus and further highlights some of the major concerns with the clinical application of these models. The need for CYP3A5 genotyping and the limitations of studies based on trough concentrations are now clear. So how should a clinician navigate the numerous models and contentious covariates identified in this article and by others? The authors suggest 2 pathways for proceeding. First, if a population model (a) captures essential drug disposition (eg, a 2-compartment model),(b) shows the distribution of patient covariates to be representative of the intend-to-treat population, and(c) includes well-established covariates (eg, CYP3A5 genotype), then such a model should be acceptable for personalizing tacrolimus pharmacotherapy. The impact of assay methodology as a significant covariate in model development is unclear and requires further investigation based on the increased prescription of low-dose tacrolimus regimens.17 It would be most helpful for further evaluations to be conducted in a scholarly manner, such that experiences with individualizing tacrolimus dosing regimens and therapeutic drug monitoring could be documented as immunosuppressive approaches progress in the future. A second pathway may be possible to conduct a model-based meta-analysis in an attempt to derive a more comprehensive model of tacrolimus disposition as demonstrated for hydrochlorothiazide and furosemide.87,88 However, data extraction can be a major challenge, and a consortium of clinical investigators and data sets may represent the best way forward in constructing a broader population pharmacokinetic model that incorporates essential covariates based on time posttransplant and patient demographics. Minimally, we highlight here the major model structures and critical study details that could be used to guide a model-based meta-analysis of available data. Complementary to this approach would be to couple nonlinear mixed-effects modeling with physiologically based pharmacokinetic modeling to generate a more universal tacrolimus model that combines drug- and system-specific properties to capture major sources of covariate variability across a wide range of patients. This approach may facilitate clinical decisions regarding tacrolimus dosing adjustments at the bedside. Another consideration is the need to identify pharmacodynamic covariates, which have largely eluded traditional population-based approaches. The emerging field of quantitative systems pharmacology may be useful for molecular determinants of pharmacodynamic variability. Combining quantitative systems pharmacology with population- and physiologically based pharmacokinetic modeling may improve the individualization of tacrolimus regimens and clinical outcomes.
Supplementary Material
Acknowledgments
Funding
No sources of funding were used to assist in the preparation of this article.
Footnotes
Conflict of Interest
The authors of this manuscript have no conflicts of interest or financial relationships that are relevant to the content of this article.
Supporting Information
Additional supporting information may be found online in the Supporting Information section at the end of the article.
References
- 1.Matas A, Smith J, Skeans M, et al. OPTN/SRTR 2013 Annual Data Report: Kidney. Am J Transplant. 2015;15(s2):1–34. [DOI] [PubMed] [Google Scholar]
- 2.Bowman L, Brennan D. The role of tacrolimus in renal transplantation. Expert Opin Pharmacother. 2008;9(4):635–643. [DOI] [PubMed] [Google Scholar]
- 3.Tacrolimus—FDA prescribing information, side effects and uses. https://www.drugs.com/pro/tacrolimus.html. Accessed November 12, 2017.
- 4.Dasari B, Hodson J, Nassir A, et al. Variations in practice to therapeutic monitoring of tacrolimus following primary adult liver transplantation. Int J Organ Transplant Med. 2016;7(1):1–8. [PMC free article] [PubMed] [Google Scholar]
- 5.Vanhove T, Annaert P, Kuypers D. Clinical determinants of calcineurin inhibitor disposition: a mechanistic review. Drug Metab Rev. 2016;48(1):88–112. [DOI] [PubMed] [Google Scholar]
- 6.Nagase K, Iwasaki K, Nozaki K, Noda K. Distribution and protein binding of FK506, a potent immunosuppressive macrolide lactone, in human blood and its uptake by erythrocytes. J Pharm Pharmacol. 1994;46(2):113–117. [DOI] [PubMed] [Google Scholar]
- 7.Tang J, Andrews L, van Gelder T, et al. Pharmacogenetic aspects of the use of tacrolimus in renal transplantation: recent developments and ethnic considerations. Expert Opin Drug Metab Toxicol. 2016;12(5):555–565. [DOI] [PubMed] [Google Scholar]
- 8.Capron A, Mourad M, De Meyer M, et al. CYP3A5 and ABCB1 polymorphisms influence tacrolimus concentrations in peripheral blood mononuclear cells after renal transplantation. Pharmacogenomics. 2010;11(5):703–714. [DOI] [PubMed] [Google Scholar]
- 9.Knops N, Levtchenko E, van den Heuvel B, Kuypers D. From gut to kidney: transporting and metabolizing calcineurin-inhibitors in solid organ transplantation. Int J Pharm. 2013;452(1–2):14–35. [DOI] [PubMed] [Google Scholar]
- 10.Staatz C, Tett S. Clinical pharmacokinetics and pharmacodynamics of tacrolimus in solid organ transplantation. Clin Pharmacokinet. 2004;43(10):623–653. [DOI] [PubMed] [Google Scholar]
- 11.Staatz C, Goodman L, Tett S. Effect of CYP3A and ABCB1 single nucleotide polymorphisms on the pharmacokinetics and pharmacodynamics of calcineurin inhibitors: part II. Clin Pharmacokinet. 2010;49(4):207–221. [DOI] [PubMed] [Google Scholar]
- 12.van Gelder T, van Schaik R, Hesselink D. Pharmacogenetics and immunosuppressive drugs in solid organ transplantation. Nat Rev Nephrol. 2014;10(12):725–731. [DOI] [PubMed] [Google Scholar]
- 13.Birdwell K, Decker B, Barbarino J, et al. Clinical Pharmacogenetics Implementation Consortium (CPIC) guidelines for CYP3A5 genotype and tacrolimus dosing. Clin Pharmacol Ther. 2015;98(1):19–24. [DOI] [PMC free article] [PubMed] [Google Scholar]
- 14.Shuker N, Shuker L, van Rosmalen J, et al. A high intrapatient variability in tacrolimus exposure is associated with poor long-term outcome of kidney transplantation. Transpl Int. 2016;29(11):1158–1167. [DOI] [PubMed] [Google Scholar]
- 15.de Jonge H, Naesens M, Kuypers D. New insights into the pharmacokinetics and pharmacodynamics of the calcineurin inhibitors and mycophenolic acid: possible consequences for therapeutic drug monitoring in solid organ transplantation. Ther Drug Monit. 2009;31(4):416–435. [DOI] [PubMed] [Google Scholar]
- 16.Wallemacq P, Armstrong V, Brunet M, et al. Opportunities to optimize tacrolimus therapy in solid organ transplantation: report of the European Consensus Conference. Ther Drug Monit. 2009;31(2):139–152. [DOI] [PubMed] [Google Scholar]
- 17.Ekberg H, Tedesco-Silva H, Demirbas A, et al. Reduced exposure to calcineurin inhibitors in renal transplantation. N Engl J Med. 2007;357(25):2562–2575. [DOI] [PubMed] [Google Scholar]
- 18.Bouamar R, Shuker N, Hesselink D, et al. Tacrolimus predose concentrations do not predict the risk of acute rejection after renal transplantation: a pooled analysis from three randomized-controlled clinical trials. Am J Transplant. 2013;13(5):1253–1261. [DOI] [PubMed] [Google Scholar]
- 19.Mould DR, Upton RN. Basic concepts in population modeling, simulation, and model-based drug development. CPT Pharmacometrics Syst Pharmacol. 2012;1:e6. [DOI] [PMC free article] [PubMed] [Google Scholar]
- 20.Brooks E, Tett S, Isbel N, Staatz C. Population pharmacokinetic modelling and Bayesian estimation of tacrolimus exposure: is this clinically useful for dosage prediction yet? Clin Pharmacokinet. 2016;55(11):1295–1335. [DOI] [PubMed] [Google Scholar]
- 21.Brendel K, Dartois C, Comets E, et al. Are population pharmacokinetic and/or pharmacodynamic models adequately evaluated? A survey of the literature from 2002 to 2004. Clin Pharmacokinet. 2006;46(3):221–234. [DOI] [PMC free article] [PubMed] [Google Scholar]
- 22.Antignac M, Barrou B, Farinotti R, Lechat P, Urien S. Population pharmacokinetics and bioavailability of tacrolimus in kidney transplant patients. Br J Clin Pharmacol. 2007;64(6):750–757. [DOI] [PMC free article] [PubMed] [Google Scholar]
- 23.Fukatsu S, Yano I, Igarashi T, et al. Population pharmacokinetics of tacrolimus in adult recipients receiving living-donor liver transplantation. Eur J Clin Pharmacol. 2001;57(6–7):479–484. [DOI] [PubMed] [Google Scholar]
- 24.Fukudo M, Yano I, Fukatsu S, et al. Forecasting of blood tacrolimus concentrations based on the Bayesian method in adult patients receiving living-donor liver transplantation. Clin Pharmacokinet. 2003;42(13):1161–1178. [DOI] [PubMed] [Google Scholar]
- 25.Sam W, Aw M, Quak S, et al. Population pharmacokinetics of tacrolimus in Asian paediatric liver transplant patients. Br J Clin Pharmacol. 2000;50(6):531–541. [DOI] [PMC free article] [PubMed] [Google Scholar]
- 26.Yasuhara M, Hashida T, Toraguchi M, et al. Pharmacokinetics and pharmacodynamics of FK 506 in pediatric patients receiving living-related donor liver transplantations. Transplant Proc. 1995;27(1):1108–1110. [PubMed] [Google Scholar]
- 27.Wallin J, Friberg L, Fasth A, Staatz C. Population pharmacokinetics of tacrolimus in pediatric hematopoietic stem cell transplant recipients: new initial dosage suggestions and a model-based dosage adjustment tool. Ther Drug Monit. 2009;31(4):457–466. [DOI] [PubMed] [Google Scholar]
- 28.Moes D, van der Bent S, Swen J, et al. Population pharmacokinetics and pharmacogenetics of once daily tacrolimus formulation in stable liver transplant recipients. Eur J Clin Pharmacol. 2016;72(2):163–174. [DOI] [PMC free article] [PubMed] [Google Scholar]
- 29.Benkali K, Rostaing L, Premaud A, et al. Population pharmacokinetics and Bayesian estimation of tacrolimus exposure in renal transplant recipients on a new once-daily formulation. Clin Pharmacokinet. 2010;49(10):683–692. [DOI] [PubMed] [Google Scholar]
- 30.Woillard J, de Winter B, Kamar N, Marquet P, Rostaing L, Rousseau A. Population pharmacokinetic model and Bayesian estimator for two tacrolimus formulations—twice daily Prograf and once daily Advagraf. Br J Clin Pharmacol. 2011;71(3):391–402. [DOI] [PMC free article] [PubMed] [Google Scholar]
- 31.Zhao W, Fakhoury M, Baudouin V, et al. Population pharmacokinetics and pharmacogenetics of once daily prolongedrelease formulation of tacrolimus in pediatric and adolescent kidney transplant recipients. Eur J Clin Pharmacol. 2013;69(2):189–195. [DOI] [PubMed] [Google Scholar]
- 32.Levine DM, Maine GT, Armbruster DA, et al. The need for standardization of tacrolimus assays. Clin Chem. 2011;57(12):1739–1747. [DOI] [PubMed] [Google Scholar]
- 33.Wallemacq P, Goffinet JS, O’Morchoe S, et al. Multi-site analytical evaluation of the Abbott ARCHITECT tacrolimus assay. Ther Drug Monit. 2009;31(2):198–204. [DOI] [PubMed] [Google Scholar]
- 34.Storset E, Holford N, Hennig S, et al. Improved prediction of tacrolimus concentrations early after kidney transplantation using theory-based pharmacokinetic modelling. Br J Clin Pharmacol. 2014;78(3):509–523. [DOI] [PMC free article] [PubMed] [Google Scholar]
- 35.Storset E, Hole K, Midtvedt K, Bergan S, Molden E, Asberg A. The CYP3A biomarker 4β-hydroxycholesterol does not improve tacrolimus dose predictions early after kidney transplantation. Br J Clin Pharmacol. 2017;83(7):1457–1465. [DOI] [PMC free article] [PubMed] [Google Scholar]
- 36.Vadcharavivad S, Praisuwan S, Techawathanawanna N, Treyaprasert W, Avihingsanon Y. Population pharmacokinetics of tacrolimus in Thai kidney transplant patients: comparison with similar data from other populations. J Clin Pharm Ther. 2016;41(3):310–328. [DOI] [PubMed] [Google Scholar]
- 37.Jacobo-Cabral C, Garcia-Roca P, Romero-Tejeda E, et al. Population pharmacokinetic analysis of tacrolimus in Mexican paediatric renal transplant patients: role of CYP3A5 genotype and formulation. Br J Clin Pharmacol. 2015;80(4):630–641. [DOI] [PMC free article] [PubMed] [Google Scholar]
- 38.Guy-Viterbo V, Baudet H, Elens L, et al. Influence of donor-recipient CYP3A4/5 genotypes, age and fluconazole on tacrolimus pharmacokinetics in pediatric liver transplantation: a population approach. Pharmacogenomics. 2014;15(9):1207–1221. [DOI] [PubMed] [Google Scholar]
- 39.Guy-Viterbo V, Scohy A, Verbeeck RK, Reding R, Wallemacq P, Musuamba FT. Population pharmacokinetic analysis of tacrolimus in the first year after pediatric liver transplantation. Eur J Clin Pharmacol. 2013;69(8):1533–1542. [DOI] [PubMed] [Google Scholar]
- 40.Musuamba F, Guy-Viterbo V, Reding R, Verbeeck R, W P. Population pharmacokinetic analysis of tacrolimus early after pediatric liver transplantation. Ther Drug Monit. 2014;36(1):54–61. [DOI] [PubMed] [Google Scholar]
- 41.Velickovic-Radovanovic R, Catic-Djordjevic A, Milovanovic J, Djordjevic V, Paunovic G, Jankovic S. Population pharmacokinetics of tacrolimus in kidney transplant patients. Int J Clin Pharmacol Ther. 2010;48(6):375–382. [DOI] [PubMed] [Google Scholar]
- 42.García Sánchez M, Manzanares C, Santos-Buelga D, et al. Covariate effects on the apparent clearance of tacrolimus in paediatric liver transplant patients undergoing conversion therapy. Clin Pharmacokinet. 2001;40(1):63–71. [DOI] [PubMed] [Google Scholar]
- 43.Press R, Ploeger B, den Hartigh J, et al. Explaining variability in tacrolimus pharmacokinetics to optimize early exposure in adult kidney transplant recipients. Ther Drug Monit. 2009;31(2):187–197. [DOI] [PubMed] [Google Scholar]
- 44.Sam W, Tham L, Holmes M, et al. Population pharmacokinetics of tacrolimus in whole blood and plasma in Asian liver transplant patients. Clin Pharmacokinet. 2006;45(1):59–75. [DOI] [PubMed] [Google Scholar]
- 45.Asberg A, Midtvedt K, van Guilder M, et al. Inclusion of CYP3A5 genotyping in a nonparametric population model improves dosing of tacrolimus early after transplantation. Transpl Int. 2013;26(12):1198–1207. [DOI] [PMC free article] [PubMed] [Google Scholar]
- 46.Storset E, Holford N, Midtvedt K, Bremer S, Bergan S, Asberg A. Importance of hematocrit for a tacrolimus target concentration strategy. Eur J Clin Pharmacol. 2014;70(1):65–77. [DOI] [PMC free article] [PubMed] [Google Scholar]
- 47.Passey C, Birnbaum A, Brundage R, Oetting W, Israni A, Jacobson P. Dosing equation for tacrolimus using genetic variants and clinical factors. Br J Clin Pharmacol. 2011;72(6):948–957. [DOI] [PMC free article] [PubMed] [Google Scholar]
- 48.Sanghavi K, Brundage R, Miller M, et al. Genotype-guided tacrolimus dosing in African-American kidney transplant recipients. Pharmacogenomics J. 2017;17(1):61–68. [DOI] [PMC free article] [PubMed] [Google Scholar]
- 49.Benkali K, Prémaud A, Picard N, et al. Tacrolimus population pharmacokinetic-pharmacogenetic analysis and Bayesian estimation in renal transplant recipients. Clin Pharmacokinet. 2009;48(12):805–816. [DOI] [PubMed] [Google Scholar]
- 50.Prytula A, Cransberg K, Bouts A, et al. The effect of weight and CYP3A5 genotype on the population pharmacokinetics of tacrolimus in stable paediatric renal transplant recipients. Clin Pharmacokinet. 2016;55(9):1129–1143. [DOI] [PubMed] [Google Scholar]
- 51.Iwasaki K Metabolism of tacrolimus (FK506) and recent topics in clinical pharmacokinetics. Drug Metab Pharmacokinet. 2007;22(5):328–335. [DOI] [PubMed] [Google Scholar]
- 52.Andreu F, Colom H, Elens L, et al. A new CYP3A5*3 and CYP3A4*22 cluster influencing tacrolimus target concentrations: a population approach. Clin Pharmacokinet 2017;56(8):963–975. [DOI] [PubMed] [Google Scholar]
- 53.Zuo X, Ng C, Barrett J, et al. Effects of CYP3A4 and CYP3A5 polymorphisms on tacrolimus pharmacokinetics in Chinese adult renal transplant recipients: a population pharmacokinetic analysis. Pharmacogenet Genomics. 2013;23(5):251–261. [DOI] [PubMed] [Google Scholar]
- 54.Shi X, Geng F, Jiao Z, Cui X, Qiu X, Zhong M. Association of ABCB1, CYP3A4*18B and CYP3A5*3 genotypes with the pharmacokinetics of tacrolimus in healthy Chinese subjects: a population pharmacokinetic analysis. J Clin Pharm Ther. 2011;36(5):614–624. [DOI] [PubMed] [Google Scholar]
- 55.Zhang J, Liu S, Xue L, Ding X, Zhang H, Miao L. The genetic polymorphisms of POR*28 and CYP3A5*3 significantly influence the pharmacokinetics of tacrolimus in Chinese renal transplant recipients. Int J Clin Pharmacol Ther. 2015;53(9):728–736. [DOI] [PubMed] [Google Scholar]
- 56.Fukudo M, Yano I, Masuda S, et al. Population pharmacokinetic and pharmacogenomic analysis of tacrolimus in pediatric living-donor liver transplant recipients. Clin Pharmacol Ther. 2006;80(4):331–345. [DOI] [PubMed] [Google Scholar]
- 57.Li D, Lu W, Zhu J, Gao J, Lou Y, Zhang G. Population pharmacokinetics of tacrolimus and CYP3A5, MDR1 and IL-10 polymorphisms in adult liver transplant patients. J Clin Pharm Ther. 2007;32(5):505–515. [DOI] [PubMed] [Google Scholar]
- 58.Han K, Pillai V, Venkataramanan R. Population pharmacokinetics of cyclosporine in transplant recipients. AAPS J. 2013;15(4):901–912. [DOI] [PMC free article] [PubMed] [Google Scholar]
- 59.Oteo I, Lukas J, Leal N, et al. Tacrolimus pharmacokinetics in the early post-liver transplantation period and clinical applicability via Bayesian prediction.Eur J Clin Pharmacol. 2013;69(1):65–74. [DOI] [PubMed] [Google Scholar]
- 60.Valdivieso N, Oteo I, Valdivieso A, et al. Tacrolimus dose individualization in “de novo” patients after 10 years of experience in liver transplantation: pharmacokinetic considerations and patient pathophysiology. Int J Clin Pharmacol Ther. 2013;51(7):606–614. [DOI] [PubMed] [Google Scholar]
- 61.Antignac M, Hulot J, Boleslawski E, et al. Population pharmacokinetics of tacrolimus in full liver transplant patients: modelling of the post-operative clearance. Eur J Clin Pharmacol. 2005;61(5–6):409–416. [DOI] [PubMed] [Google Scholar]
- 62.Wallin J, Bergstrand M, Wilczek H, Nydert P, Karlsson M, Staatz C. Population pharmacokinetics of tacrolimus in pediatric liver transplantation: early posttransplantation clearance. Ther Drug Monit. 2011;33(6):663–672. [DOI] [PubMed] [Google Scholar]
- 63.Han N, Ha S, Yun H, et al. Population pharmacokinetic-pharmacogenetic model of tacrolimus in the early period after kidney transplantation. Basic Clin Pharmacol Toxicol. 2014;114(5):400–406. [DOI] [PubMed] [Google Scholar]
- 64.Bergmann T, Hennig S, Barraclough K, Isbel N, Staatz C. Population pharmacokinetics of tacrolimus in adult kidney transplant patients: impact of CYP3A5 genotype on starting dose. Ther Drug Monit. 2014;36(1):62–70. [DOI] [PubMed] [Google Scholar]
- 65.Jalil MH, Hawwa AF, McKiernan PJ, Shields MD, McElnay JC. Population pharmacokinetic and pharmacogenetic analysis of tacrolimus in paediatric liver transplant patients. Br J Clin Pharmacol. 2014;77(1):130–140. [DOI] [PMC free article] [PubMed] [Google Scholar]
- 66.Zhang H, Li D, Zhu H, Fang Y, Liu T. Tacrolimus population pharmacokinetics according to CYP3A5 genotype and clinical factors in Chinese adult kidney transplant recipients. J Clin Pharm Ther. 2017;42(4):425–432. [DOI] [PubMed] [Google Scholar]
- 67.Lee J, Hahn H, Son I, et al. Factors affecting the apparent clearance of tacrolimus in Korean adult liver transplant recipients. Pharmacotherapy. 2006;26(8):1069–1077. [DOI] [PubMed] [Google Scholar]
- 68.Staatz C, Willis C, Taylor P, Tett S. Population pharmacokinetics of tacrolimus in adult kidney transplant recipients. Clin Pharmacol Ther. 2002;72(6):660–669. [DOI] [PubMed] [Google Scholar]
- 69.Han N, Yun H, Hong J, et al. Prediction of the tacrolimus population pharmacokinetic parameters according to CYP3A5 genotype and clinical factors using NONMEM in adult kidney transplant recipients. Eur J Clin Pharmacol. 2013;69(1):53–63. [DOI] [PubMed] [Google Scholar]
- 70.Staatz C, Taylor P, Lynch S, Willis C, Charles B, Tett S. Population pharmacokinetics of tacrolimus in children who receive cut-down or full liver transplants. Transplantation. 2001;72(6):1056–1061. [DOI] [PubMed] [Google Scholar]
- 71.Ogasawara K, Chitnis S, Gohh R, Christians U, Akhlaghi F. Multidrug resistance-associated protein 2 (MRP2/ABCC2) haplotypes significantly affect the pharmacokinetics of tacrolimus in kidney transplant recipients. Clin Pharmacokinet. 2013;52(9):751–762. [DOI] [PMC free article] [PubMed] [Google Scholar]
- 72.Zhu L, Yang J, Zhang Y, Jing Y, Zhang Y, Li G. Effects of CYP3A5 genotypes, ABCB1 C3435T and G2677T/A polymorphism on pharmacokinetics of tacrolimus in Chinese adult liver transplant patients. Xenobiotica. 2015;45(9):840–846. [DOI] [PubMed] [Google Scholar]
- 73.Yang JW, Liao SS, Zhu LQ, et al. Population pharmacokinetic analysis of tacrolimus early after Chinese pediatric liver transplantation. Int J Clin Pharmacol Ther. 2015;53(1):75–83. [DOI] [PubMed] [Google Scholar]
- 74.Zhang X, Wang Z, Fan J, et al. The impact of sulfonylureas on tacrolimus apparent clearance revealed by a population pharmacokinetics analysis in Chinese adult liver-transplant patients. Ther Drug Monit. 2012;34(2):126–133. [DOI] [PubMed] [Google Scholar]
- 75.Monchaud C, de Winter B, Knoop C, et al. Population pharmacokinetic modelling and design of a Bayesian estimator for therapeutic drug monitoring of tacrolimus in lung transplantation. Clin Pharmacokinet. 2012;51(3):175–186. [DOI] [PubMed] [Google Scholar]
- 76.Kassir N, Labbé L, Delaloye J, et al. Population pharmacokinetics and Bayesian estimation of tacrolimus exposure in paediatric liver transplant recipients. Br J Clin Pharmacol. 2014;77(6):1051–1063. [DOI] [PMC free article] [PubMed] [Google Scholar]
- 77.Zhao W, Elie V, Roussey G, et al. Population pharmacokinetics and pharmacogenetics of tacrolimus in de novo pediatric kidney transplant recipients. Clin Pharmacol Ther. 2009;86(6):609–618. [DOI] [PubMed] [Google Scholar]
- 78.Xue L, Zhang H, Ma S, Rui J, Miao L. Population pharmacokinetics and pharmacogenetics of tacrolimus in healthy Chinese volunteers. Pharmacology. 2011;88(5–6):288–294. [DOI] [PubMed] [Google Scholar]
- 79.Musuamba F, Mourad M, Haufroid V, Delattre I, Verbeeck R, Wallemacq P. Time of drug administration, CYP3A5 and ABCB1 genotypes, and analytical method influence tacrolimus pharmacokinetics: a population pharmacokinetic study. Ther Drug Monit. 2009;31(6):734–742. [DOI] [PubMed] [Google Scholar]
- 80.Hesselink DA, Bouamar R, Elens L, van Schaik RH, van Gelder T. The role of pharmacogenetics in the disposition of and response to tacrolimus in solid organ transplantation. Clin Pharmacokinet. 2014;53(2):123–139. [DOI] [PubMed] [Google Scholar]
- 81.Van Gelder T, Van Schaik R, Hesselink DA. Pharmacogenetics and immunosuppressive drugs in solid organ transplantation. Nat Rev Nephrol. 2014;10(12):725–721. [DOI] [PubMed] [Google Scholar]
- 82.Elens L, Bouamar R, Shuker N, Hesselink DA, van Gelder T, van Schaik RH. Clinical implementation of pharmacogenetics in kidney transplantation: calcineurin inhibitors in the starting blocks. Br J Clin Pharmacol. 2014;77(4):715–728. [DOI] [PMC free article] [PubMed] [Google Scholar]
- 83.Jamsen KM, McLeay SC, Barras MA, Green B. Reporting a population pharmacokinetic-pharmacodynamic study: a journal’s perspective. Clin Pharmacokinet 2014;53(2):111–122. [DOI] [PubMed] [Google Scholar]
- 84.Girard P, Sheiner L, Kastrissios H, Blaschke T. Do we need full compliance data for population pharmacokinetic analysis? J Pharmacokinet Biopharm. 1996;24(3):265–282. [DOI] [PubMed] [Google Scholar]
- 85.Gibiansky L, Gibiansky E, Cosson V, Frey N, Stark FS. Methods to detect non-compliance and reduce its impact on population PK parameter estimates. J Pharmacokinet Pharmacodyn. 2014;41(3):279–289. [DOI] [PubMed] [Google Scholar]
- 86.Jacobson PA, Schladt D, Oetting WS, et al. Lower calcineurin inhibitor doses in older compared to younger kidney transplant recipients yield similar troughs. Am J Transplant. 2012;12(12):3326–3336. [DOI] [PMC free article] [PubMed] [Google Scholar]
- 87.Van Wart SA, Shoaf SE, Mallikaarjun S, Mager DE. Population-based meta-analysis of hydrochlorothiazide pharmacokinetics. Biopharm Drug Dispos. 2013;34(9):527–539. [DOI] [PubMed] [Google Scholar]
- 88.Van Wart SA, Shoaf SE, Mallikaarjun S, Mager DE. Population-based meta-analysis of furosemide pharmacokinetics. Biopharm Drug Dispos. 2014;35(2):119–133. [DOI] [PubMed] [Google Scholar]
- 89.Ting L, Villeneuve E, Ensom M. Beyond cyclosporine: a systematic review of limited sampling strategies for other immunosuppressants. Ther Drug Monit 2006;28(3):419–430. [DOI] [PubMed] [Google Scholar]
- 90.van Boekel G, Donders A, Hoogtanders K, Havenith T, Hilbrands L, Aarnoutse R. Limited sampling strategy for prolonged-release tacrolimus in renal transplant patients by use of the dried blood spot technique. Eur J Clin Pharmacol. 2015;71(7):811–816. [DOI] [PMC free article] [PubMed] [Google Scholar]
- 91.Mould DR, Dubinsky MC. Dashboard systems: pharmacokinetic/ pharmacodynamic mediated dose optimization for monoclonal antibodies. J Clin Pharmacol. 2015;55(suppl 3):S51–S59. [DOI] [PubMed] [Google Scholar]
- 92.Wright DF, Duffull SB. Development of a Bayesian forecasting method for warfarin dose individualization. Pharm Res. 2011;28(5):1100–1111. [DOI] [PubMed] [Google Scholar]
Associated Data
This section collects any data citations, data availability statements, or supplementary materials included in this article.