

Abstract
Background:
Currently, FDA-approved HIV-1 viral load (VL) assays use venipuncture-derived plasma. The Hologic Panther system uses 0.7 mL for the Aptima HIV-1 Quant Assay standard (APT-Quant-std) and dilution (APT-Quant-dil) protocols. However, smaller plasma volumes from fingerstick whole blood (FSB) collected in EDTA-microtainer tubes (MCT) could provide an easier sample collection method for HIV-1 VL testing.
Objectives:
To evaluate the performance of the APT-Quant-std compared to the Roche CAP/CTM and Abbott m2000RT VL assays and an alternative APTQuant 1:7 dilution protocol, the latter using 100 μL of MCT-derived plasma from FSB.
Study Design:
Linearity was determined using commercial HIV-1 RNA plasma controls. Dilutions ranging 1.56–2.95 log10 copies/mL were prepared to determine the APT-Quant-dil Limit of Quantitation (LOQ) using Probit analysis. Specificity of APT-Quant-std was calculated using 326 HIVnegative samples. To evaluate agreement, 329 plasma specimens were tested with APT-Quant-std, CAP/CTM, and m2000RT. Forty-seven matched venipuncture and MCT-derived plasma specimens were tested with APT-Quantstd and APT-Quant-dil.
Results:
Among the RNA controls, specificity was 99.69% for APT-Quantstd. The R2 values were 0.988 (APTQuant-std/CAP/CTM), 0.980 (APT-Quantstd/m2000RT), and 0.997 (APT-Quant-std/APT-Quant-dil). The APTQuant-dil LOQ was estimated at 2.7 log10 copies/mL (500 copies/mL) (95%CI 2.62– 2.87). At 2.3 log10 copies/mL (200 copies/mL), the overall agreement was 91.0% for APT-Quant-std/CAP/CTM, 85.7% for APT-Quantstd/m2000RT, and 82.9% for APT-Quant-std/APT-Quant-dil. Quantified APT-Quant-std results were on average 0.2 log10 copies/mL higher than CAP/CTM and m2000RT and 0.14 log10 copies/mL higher than APT-Quant-dil.
Conclusion:
APT-Quant showed similar performance compared to the CAP/CTM and m2000RT assays and remains sensitive and accurate using the dilution protocol.
Keywords: viral load, Aptima HIV-1 Quant, HIV diagnosis, Microtainer preparation tubes, Self-collection
1. Background
In early 2019, Ending the HIV Epidemic: A Plan for America was announced, with the goal of >90% reduction in new HIV infections within 10 years [1]. Despite the scientific progress made in diagnostic tests and available treatment options, approximately 69% of new HIV infections in the U.S. are from individuals aware of their infection but not virally suppressed [2]. In 2015, 48.9% of the estimated 1.1 million people living with HIV (PLWH) in the U.S. did not achieve viral suppression (VS), and in 2016 there were 38,700 new HIV diagnoses [3]. Moreover, only 20% of individuals on antiretroviral therapy (ART) in low-middle income countries receive viral load (VL) testing due to limited capacity [4].
Many clinical studies have supported the concept that individuals with VS greatly reduce the risk of HIV transmission [1, 5, 6]. VL assays approved by the Food and Drug Administration (FDA) are nucleic acid tests (NAT) that quantify HIV-1 RNA levels and are important to monitor viremia in PLWH before and after initiation of ART, but they require phlebotomists to collect venous blood and the complexity and high costs prevent them from being implemented in various settings despite the high demand [7]. Providing individuals with the option for home self-collection has shown to be an effective way to obtain various types of samples for VL monitoring, and could increase monitoring of suppression, particularly when clinic access is difficult [8].
The Aptima HIV-1 Quantitative assay (APT-Quant) on the automated Panther system was approved by the FDA in 2016 for VL monitoring using plasma [9] and is approved for diagnosis outside of the U.S. The standard APT-Quant assay using 0.7 mL of plasma has previously been evaluated in early and established infections and with various HIV-1 subtypes [10–13]. Additional studies have also demonstrated the performance of APT-Quant using alternative specimen types, such as dried blood spots (DBS), cervicovaginal lavage and cerebrospinal fluid [14–16]. Although the package insert includes data for 1:3 and 1:100 dilution protocols [17], the performance of an optional 1:7 dilution protocol has not been evaluated. This dilution could be used for plasma derived from fingerstick whole blood (FSB) collected in a microtainer tube (MCT) containing ethylenediaminetetraacetic acid (EDTA) [18–20]. Modifying a fully-automated VL assay to accurately detect and quantify HIV-1 RNA in 100 μL of plasma from FSB could facilitate sample collection using MCTs outside of clinical settings and increase access to VL monitoring.
2. Objectives
To compare the performance of the standard APT-Quant assay (APT-Quant-std) with venipuncture-derived plasma to other FDA-approved VL assays, and also evaluate a 1:7 dilution VL protocol (APT-Quant-dil) for use with MCT-derived plasma.
3. Study Design
3.1. HIV-1 RNA VL assays
3.1.1. Aptima HIV-1 Quant
According to the manufacturer’s package insert, the standard protocol quantifies RNA over the linear range of 1.48 to 7 log10 copies/mL (30 to 107 copies/mL) using 0.7 mL plasma (APT-Quant-std; Hologic Inc., San Diego, CA) [17]. The reagents for part of this evaluation were provided by Hologic Inc. as part of a collaboration with CDC. We modified the standard protocol to test the performance of the APT-Quant-dil at 1:7 by mixing 100 μL of plasma with 600 μL specimen diluent provided by Hologic and placing directly onto the instrument; the results in RNA copies/mL were multiplied by 7 and transformed to log10 copies/mL values.
3.1.2. Roche COBAS AmpliPrep/Cobas TaqMan HIV-1 v2.0
The assay quantifies RNA over the linear range of 1.3 to 7 log10 copies/mL (20 to 107 copies/mL) using 1.1 mL plasma (CAP/CTM; Roche Diagnostics, Indianapolis, IN) [21].
3.1.3. Abbott RealTime HIV-1
The assay quantifies RNA over the linear range of 1.6 to 7 log10 copies/mL (40 to 107 copies/mL) using 0.8 mL of plasma (m2000RT; Abbott Molecular Inc., Des Plaines, IL) [22].
3.2. Reportable range- Linearity
The AccuSpan 10-member HIV-1 RNA Linearity Panel (LP, SeraCare, Milford, MA) and AcroMetrix Low, Mid and High HIV-1 controls (Life Technologies, Carlsbad, CA) measured by m2000RT and CAP/CTM were tested in seven replicates and in triplicate with APT-Quant-std, respectively, and in triplicate with APT-Quant-dil. Linear regression analysis to calculate R2 using the mean of the replicates was performed with GraphPad Prism8 software (San Diego, CA).
3.3. Limit of Detection (LOD) and limit of quantification (LOQ) of APT-Quant-dil
Two HIV-1 RNA controls were used to prepare dilutions of 1.56, 1.89, 2.33, 2.49, 2.56, 2.62, 2.76, and 2.93 log10 copies/mL using Basematrix HIV-negative plasma (SeraCare, Lifescience, US) and tested with APTQuant-std in triplicate and with APT-Quant-dil at 1:7 using 15 replicates. Probit analysis was performed using SAS v9.4 (SAS Institute, Cary, NC) to estimate 95% LOD and LOQ for APT-Quant-dil.
3.4. Specificity
Frozen plasma specimens collected from 278 persons seeking HIV testing at two clinics in Los Angeles, CA [23] and 48 from a multi-site study [24] that have been previously characterized as HIV-1 negative were used to evaluate APT-Quant-std specificity.
3.5. Performance in Clinical Samples
Frozen plasma specimens from two US studies characterized as established infections were used to evaluate APT-Quant-std. From the Diagnostic Evaluation to Expand Critical Testing Technologies (DETECT) study conducted at the University of Washington in collaboration with CDC, 134 plasma specimens were collected from men who have sex with men (MSM) living with HIV [25]. Of the 134 tested with APT-Quant-std and m2000RT, 110 were tested with CAP/CTM. From the Validating Supplemental Testing to Confirm Preliminary Positive Rapid HIV Tests study conducted by the CDC at nine clinical sites within the U.S., 195 of 2202 samples collected from adult PLWH not on ART for at least three months were included [24]. Of the 195, 190 were tested with APT-Quantstd and CAP/CTM and 142 were tested with APT-Quant-std and m2000RT.
The Engagement study was funded by NIH and conducted by Emory University to better understand racial disparities in HIV care and treatment during a 24-month period. Trained staff collected different types of specimens from MSM including venipuncture EDTA whole blood and one MCT containing FSB stored at ambient temperature for up to 48 hours [26]. From this study, 47 matched plasma and FSB specimens tested with APT-Quant-std and APT-Quant-dil, respectively, (Figure 1) and of those 32 samples had m2000RT results [26]. All non-commercially obtained human specimens were collected under protocols approved by local Institutional Review Boards with additional human subjects project determination approval by the CDC for the use of anonymized specimens consented for research.
Figure 1: Collection, shipment and processing of MCTs during the Engagement study from FSB and viral load testing using the 1:7 APT-Quant-dil protocol.

MCTs: Microtainer Tubes. FSB: Fingerstick whole blood.
For quantified results, agreement was analyzed with Bland-Altman plots and concordance calculated by Pearson’s R using GraphPad [27]. Accuracy of all paired results with APT-Quant-std was calculated by overall percentage agreement at the medically relevant threshold of 2.3 log10 copies/mL (200 copies/mL) for VS.
4. Results
4.1. Linearity
The R2 values were 0.9878 (APT-Quant-std/CAP/CTM) and 0.9797 (APT-Quant-std/m2000RT) (Figure 2A). The two highest concentrations quantified by CAP/CTM at 7.91 and 6.72 log10 copies/mL were both detected at >7 log10 copies/mL by APT-Quant-std and at >7 and 6.75 log10 copies/mL by m2000RT, respectively. The lowest concentration quantified with APT-Quant-std in six of seven (85.6%) replicates (mean of 1.73 log10 copies/mL) was 1.91 log10 copies/mL with CAP/CTM and 1.97 log10 copies/mL with m2000RT.
Figure 2: Linear regression analysis using commercial HIV-1 RNA controls.
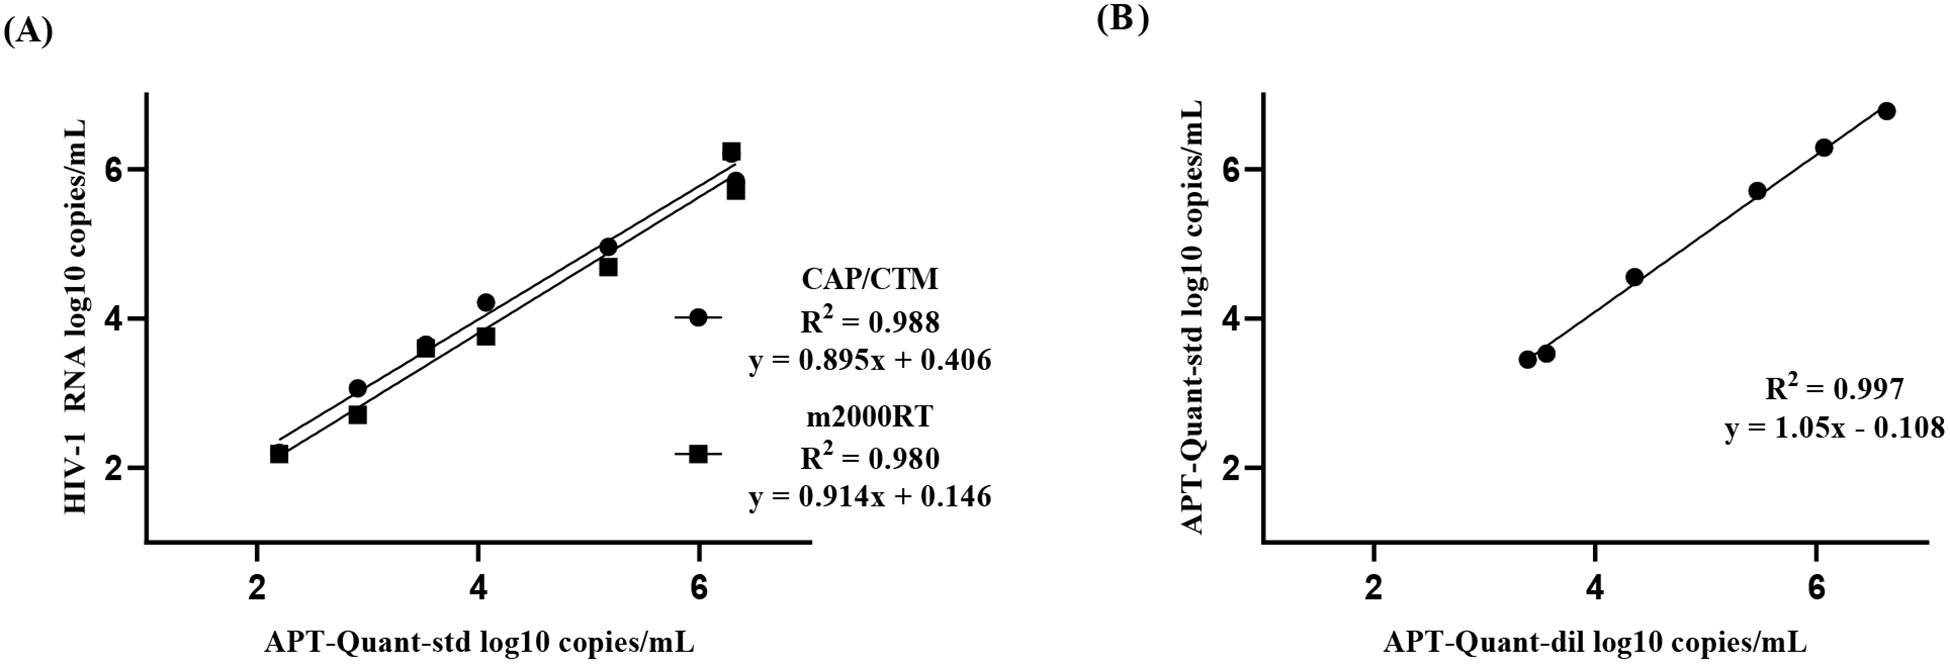
(A) Mean VL values of seven Linearity Panel (LP) replicates and triplicate AcroMetrix Low, Mid and High controls with APT-Quant-std were compared to known CAP/CTM and m2000RT assays results. (B) Mean VL of three replicates of APT-Quant-dil compared to APT-Quant-std results using LP and AcroMetrix High and Mid controls.
The R2 was 0.9969 when comparing APT-Quant-std/APT-Quant-dil (Figure 2B). The highest concentration that was quantified in all three replicates by APT-Quant-dil was >7 log10 copies/mL (mean of 7.68 log10 copies/mL), while the lowest concentration reproducibly quantified was 2.48 log10 copies/mL. This latter was quantified in two of three (66.7%) replicates by APT-Quant-dil (mean of 2.43 log10 copies/mL). The AcroMetrix low control had a APT-Quant-std mean of 2.21 log10 copies/mL and in APT-Quant-dil, all three replicates were detected at <1.47 log10 copies/mL. 4.2 LOD and LOQ of APT-Quant-dil
The estimated LOD value where 95% are detected but not quantified was 1.91 log10 copies/mL (95% CI: 1.68–4.89) and the estimated LOQ value where 95% are quantified was 2.70 log10 copies/mL (95% CI: 2.62–2.87). Table 1 shows the percentage of replicates detected and quantified by APT-Quant-dil using diluted HIV-1 RNA controls.
Table 1.
Limits of detection and quantification of the 1:7 dilution protocol in HIV-1 RNA controls
| APT-Quant-dil | ||||
|---|---|---|---|---|
| Reference Value | mean | SD | Quantified | Detected |
| (log10 cop/mL) | (log10 cop/mL) | (%) | (%) | |
| 1.56 | 0 | 0 | 0 | 80 |
| 1.89 | 0 | 0 | 0 | 93 |
| 2.33 | 2.43 | 0.1 | 33 | 100 |
| 2.49 | 2.50 | 0.12 | 60 | 100 |
| 2.56 | 2.51 | 0.12 | 67 | 100 |
| 2.62 | 2.61 | 0.11 | 93 | 100 |
| 2.76 | 2.75 | 0.18 | 100 | 100 |
| 2.93 | 2.89 | 0.12 | 100 | 100 |
Quantified results from diluted HIV-1 RNA controls tested in triplicate with APT-Quant-std to determine the reference value and tested in 15 replicates with APT-Quant-dil to determine percent quantified and detected, and the mean and standard deviation (SD).
4.3. Specificity
Of the 326 HIV-negative samples, 325 were target not detected (TND) using APT-Quant-std resulting in a specificity of 99.69% (95% CI: 98.3 to 99.9%). The remaining sample was detected <1.47 log10 copies/mL.
4.4. Performance in Clinical Samples
The Bland-Altman analysis showed a mean difference (in log10 copies/mL) of 0.22 in APT-Quantstd/CAP/CTM (Figure 3A), 0.20 in APT-Quant-std/m2000RT (Figure 3B) and 0.14 in APT-Quant-std/APT-Quantdil (Figure 3C) results. Differences of greater than 0.5 log10 copies/mL totaled 24 between APT-Quantstd/CAP/CTM (mean of 5.68 and 5.0 log10 copies/mL) and 23 between APT-Quant-std/m2000RT (mean of 5.0 and 4.32 log10 copies/mL). APT-Quant-std values were on average higher than results from CAP/CTM and m2000RT, especially above 4.6 log10 copies/mL. Two samples in Figure 3C that were below the 95% CI with mean differences of −0.51 and −0.40 were 1.94 and 2.39 log10 copies/mL in APT-Quant-std and 2.45 and 2.79 log10 copies/mL in APT-Quant-dil, respectively. The Pearson’s R values were 0.974 between APT-Quant-std/CAP/CTM, 0.970 between APT-Quant-std/m2000RT and 0.986 for APT-Quant-std/APT-Quant-dil.
Figure 3: Bland-Altman plots of quantified clinical samples.
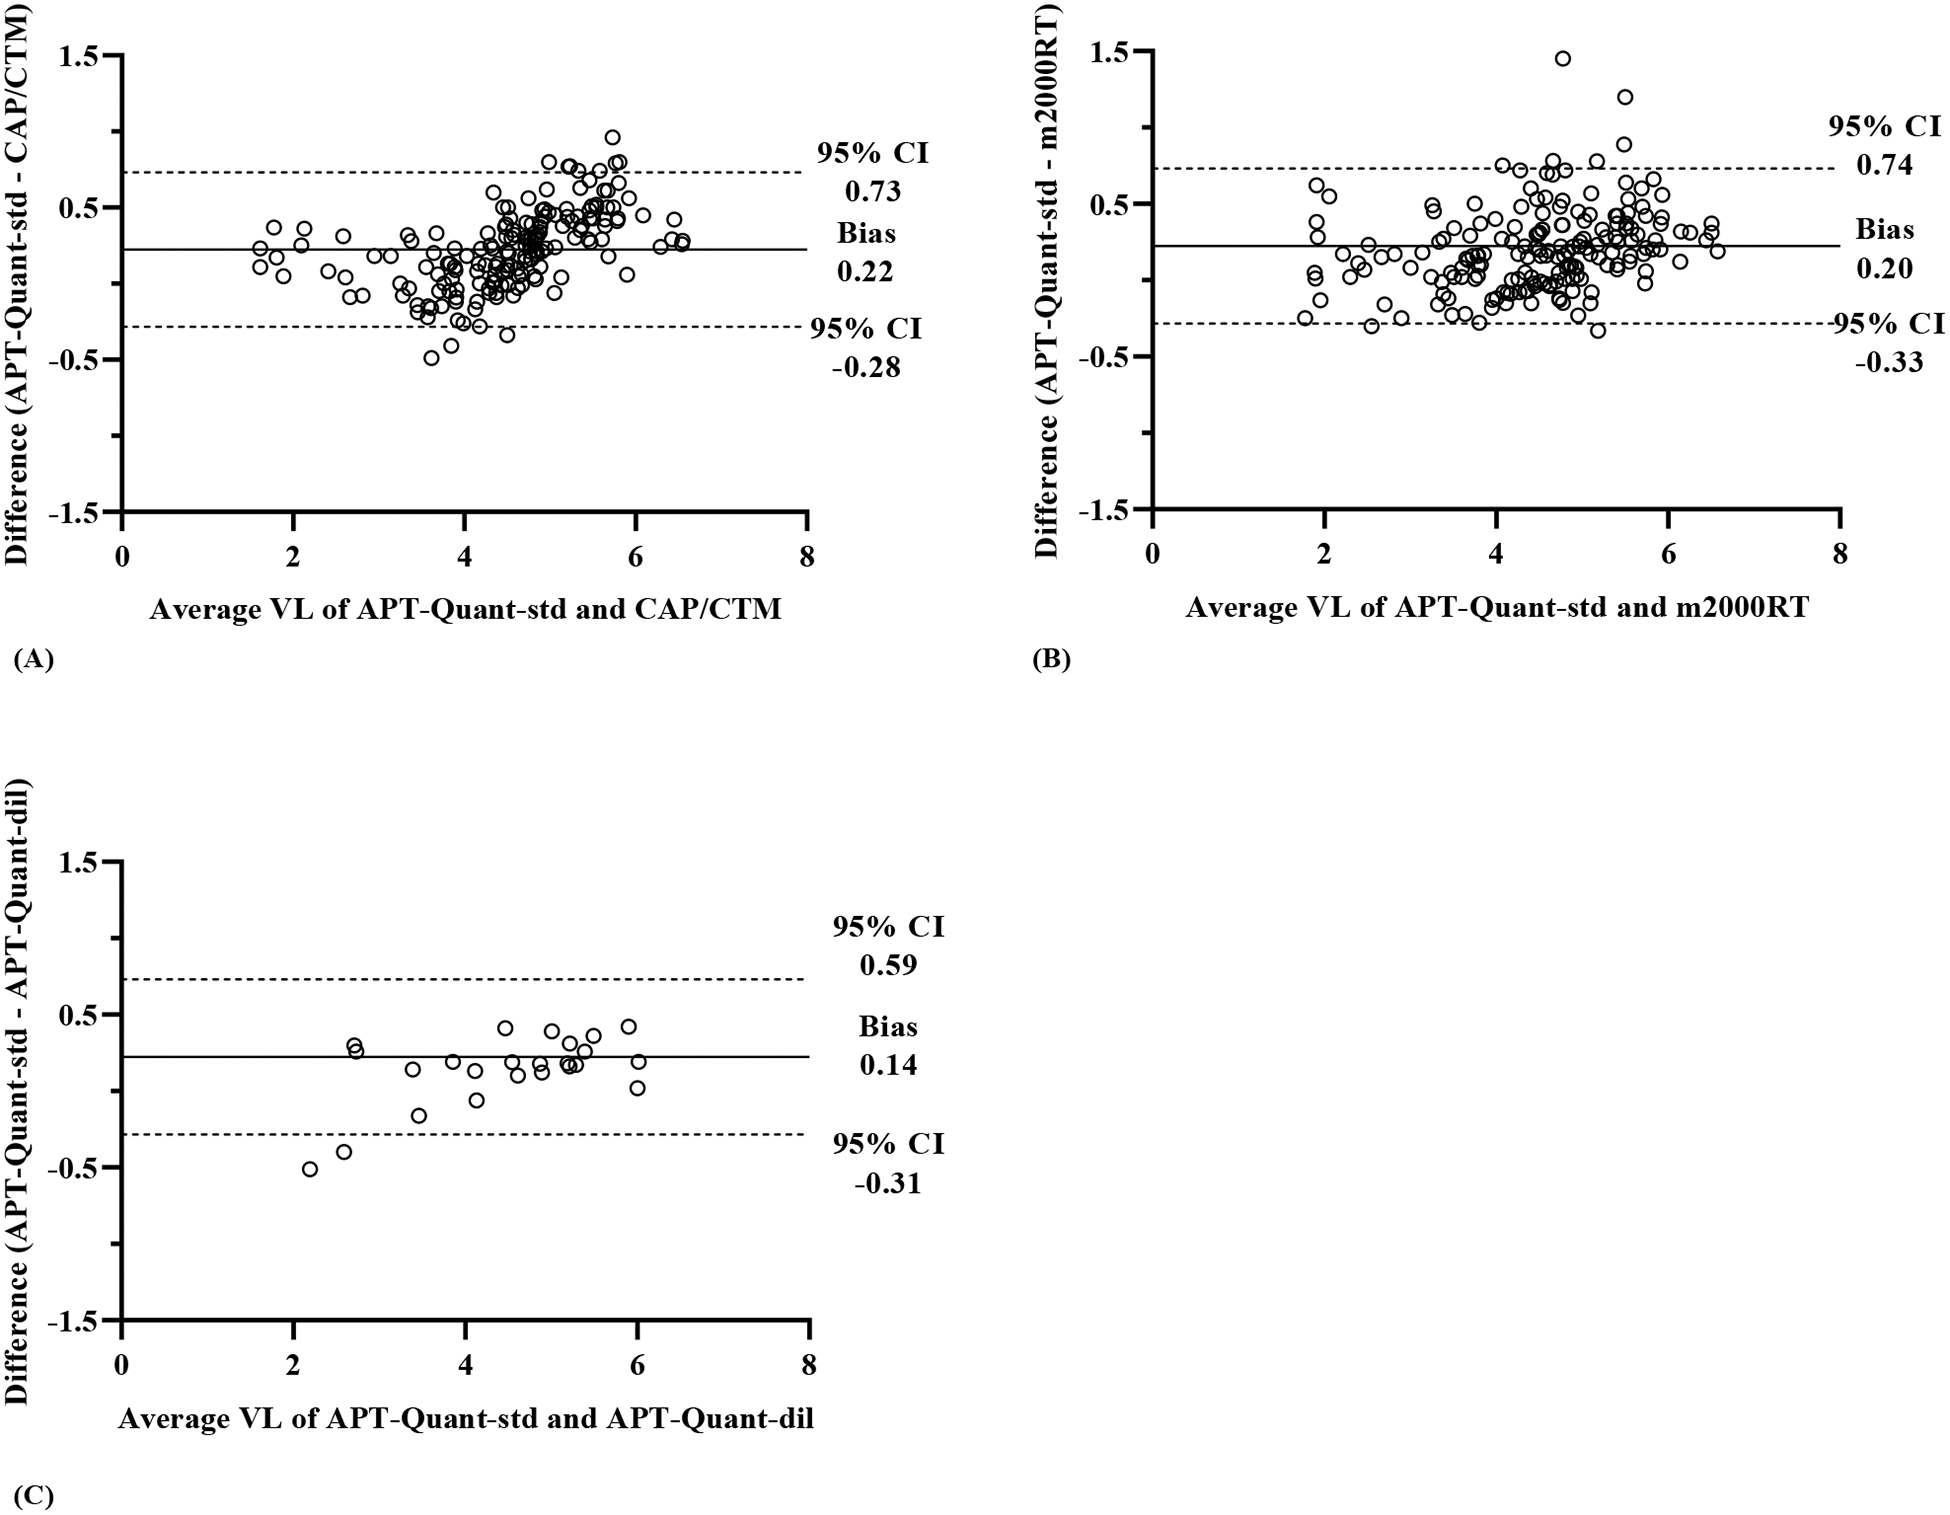
Quantified VL results (in log10 copies/mL) to show agreement from (A) APT-Quant-std and CAP/CTM (n=174), (B) APT-Quant-std and m2000RT (n=184) and (C) APT-Quant-std and APT-Quant-dil (n=24). The average VL values of paired samples are plotted on the X-axis, and the differences between the VL values are plotted on the Y-axis. The solid horizontal lines represent mean difference (bias) and the two horizontal dashed lines represent the 95% confidence intervals (CI), corresponding to the mean ± 1.96 SD.
The comparison of results at 2.3 log10 copies/mL are displayed in Table 2, with overall percentage agreement of 91% (273/300) for APT-Quant-std/CAP/CTM, 85.7% (264/308) for APT-Quant-std/m2000RT and 83% (39/47) for APT-Quant-std/APT-Quant-dil. One sample with 4.35 log10 copies/mL on CAP/CTM was detected <1.47 log10 copies/mL on APT-Quant-std and <1.6 log10 copies/mL on m2000RT. In APT-Quant-dil, four samples were TND and detected <1.47 log10 copies/mL in APT-Quant-std. One sample was TND in APTQuant-dil and 2.66 log10 copies/mL in APT-Quant-std but showed amplification of the LTR target only. Two samples with APT-Quant-std VLs of 2.32 and 2.46 log10 copies/mL were detected at <1.47 log10 copies/mL in APT-Quant-dil. One sample was 1.94 log10 copies/mL in APT-Quant-std and 2.45 log10 copies/mL in APT-Quantdil. No differences were observed in results from the nine MCT samples processed after 48 hours and 38 processed after 24 hours at ambient temperature.
Table 2:
Results from all HIV-1 positive samples collected during studies and tested with APT-Quant-std compared to CAP/CTM, m2000RT and APT-Quant-dil.
| CAP/CTM | m2000RT | APT-Quant-dil | ||||||||
|---|---|---|---|---|---|---|---|---|---|---|
| TND | <2.3 log c/mL | ≥2.3 log c/mL | TND | <2.3 log c/mL | ≥2.3 log c/mL | TND | <2.3 log c/mL | ≥2.3 log c/mL | ||
| APT-Quant-std | TND | 76 | 10 | 0 | 59 | 6 | 0 | 9 | 0 | 0 |
| <23 log c/mL | 15 | 30 | 1 | 35 | 31 | 0 | 4 | 7 | 1 | |
| ≥2.3 log c/mL | 0 | 1 | 167 | 0 | 3 | 174 | 1 | 2 | 23 | |
Displays n= for each sample comparing results from two tests for values above and below 2.3 log10 copies/mL (log c/mL). TND: Target Not Detected.
5. Discussion
This study demonstrated accurate performance of the FDA-approved APT-Quant-std assay for measuring HIV-1 VL, with results highly concordant with CAP/CTM and m2000RT reference assays. The data support a dilution protocol using 100 μL of FSB-derived plasma, which allows VL testing when sample volume is too limited for standard protocols. Matched venipuncture-derived plasma (APT-Quant-std) and FSB-derived plasma (APTQuant-dil) samples had 96.8% agreement at values above 1.7 log10 copies/mL (50 copies/mL), demonstrating that even at low VL values the agreement of results was still very high. This provides an important opportunity for self-collection of specimens when people are unwilling or unable to attend a provider for VL sample collection, expanding the potential to identify treatment failure and prevent further transmission.
Overall agreement was high between APT-Quant-std and reference VL assays using plasma samples obtained from clinical specimens although APT-Quant-std values were slightly higher compared to CAP/CTM and m2000RT. These results are similar to previous studies with agreement ranging from 83–95% and mean differences around 0.2 log10 copies/mL higher in APT-Quant-std [12, 28, 29]. Mean quantitative values in clinical samples were similar in APT-Quant-std, CAP/CTM and m2000RT, with greater VL differences seen in the range of 4–6 log10 copies/mL. Specificity was also high in APT-Quant-std with only one false-positive result out of 326 total HIV-1 RNA Qual and serology negative samples, similar to other studies [10].
The APT-Quant-dil detected 80% of samples at 1.56 log10 copies/mL (36 copies/mL). In four clinical samples with APT-Quant-std of 1.9 log10 copies/mL, three were <1.47 log10 copies/mL and one 2.45 log10 copies/mL in APT-Quant-dil. Five clinical samples quantified by m2000RT (range of 1.7–2.43 log10 copies/mL) were detected <1.47 log10 copies/mL by APT-Quant-dil, showing that even very low VL values can be detected in diluted samples. Current U.S. guidelines indicate VL levels must be below 2.3 log10 copies/mL (200 copies/mL) to be successfully virally suppressed [30]. However, due to the difficulties in accurately detecting VL at low concentrations from different specimen types, the WHO recommendation for viral suppression is at HIV levels below 3.0 log10 copies/mL (1000 copies/mL) [31]. CAP/CTM offers an automated specimen dilution protocol requiring a minimum plasma volume of 450 μL, and one study using 250 μL of plasma diluted with phosphate-buffered saline (PBS) showed high agreement with matched undiluted samples but the LOD and LOQ were not assessed [32, 33]. In this evaluation, the APT-Quant-dil only required 100 uL of plasma and performed well to detect HIV at and above clinically relevant thresholds of 2.3 log10 copies/mL. In addition, the 1:7 dilution protocol allows samples with VL above the linear range to be quantified.
Although the MCT package insert states that samples should be analyzed within four hours of collection, in this limited sample set, results showed that plasma derived from blood collected by trained personnel from FSB in MCTs, sent to the lab at ambient temperature and processed within 24–48 hours after collection did not affect VL results compared to venipuncture-derived plasma (Figure 1). This offers an easy way to collect, transport and store clinical samples without influencing the analytical aspects of the test, expanding access to NAT for individuals on ART in non-clinical settings [19]. The use of MCT-derived plasma instead of whole blood used in DBS eliminates the presence of inhibitors and proviral DNA, which have been shown to alter VL results [14, 34]. DBS processing for VL is a more laborious process involving punchers and rockers and an additional incubation step, while processing for small plasma volumes only requires the addition of diluent. The disadvantage of MCTs is shipping as biohazardous material, whereas DBS can be shipped as standard mail.
One limitation of the study was that FSB in MCTs offers a collection method for singlet testing and some results could not be confirmed with retesting. The feasibility of individuals to effectively self-collect FSB samples of 200 μL was not assessed in this study and should be considered in the future when determining the feasibility for VL monitoring. The PrEP@Home project demonstrated great success with 93% participants able to provide at least 100 μL of self-collected FSB for laboratory testing, and allowing them to obtain a prescription for HIV preexposure prophylaxis (PrEP) without having to access a clinic [35]. Although our sample size was small and many Engagement participants had reached VS, we successfully evaluated the assay performance with a dilution protocol using a minimum of 200 μL of FSB.
Ultimately, the goal in the US to increase the rates of VS and achieve the 10-year benchmark for reducing new HIV infections requires improved strategies for HIV testing and high adherence in prevention and treatment [1]. Overall access to VL testing for PLWH on ART is low due to the high costs and complexity of the test, demonstrating the high global demand for new and efficient NAT technologies [36]. FSB collected in MCTs provides an alternative approach for PLWH to self-collect samples for timely VL monitoring, removing a significant barrier for many persons on ART [37]. We demonstrated that the off-label 1:7 dilution protocol for plasma samples performs well compared to standard volumes and offers an alternative sample collection method to monitor VS using an automated commercial VL platform. While the results are encouraging, the off-label protocol with self-collected blood must be properly validated within laboratories prior to implementing this strategy.
Highlights.
A modified Aptima HIV-1 Quant protocol can quantify RNA using 100 μL of plasma.
The standard and modified protocols had high agreement above 50 copies/mL.
Using microtainers for blood collection could expand access to treatment and care.
Acknowledgements:
Thank you to the participants and staff of Emory PRISM and the DETECT study for collecting and providing samples for this analysis.
Conflict of Interest and Sources of Funding: National Institute of Allergy and Infectious Diseases (R01-AI112723). This work was supported in part by the Center for AIDS Research (P30 AI050409). Project DETECT was funded by the CDC (contract 200-2014-61285). The reagents for part of this evaluation were provided by Hologic Inc. as part of a collaboration with CDC. Hologic did not have a role in the collection, analysis and interpretation of the data or in the decision to submit the article for publication.
Footnotes
Publisher's Disclaimer: This is a PDF file of an unedited manuscript that has been accepted for publication. As a service to our customers we are providing this early version of the manuscript. The manuscript will undergo copyediting, typesetting, and review of the resulting proof before it is published in its final form. Please note that during the production process errors may be discovered which could affect the content, and all legal disclaimers that apply to the journal pertain.
Publisher's Disclaimer: Disclaimer: The views expressed in this article are those of the authors and do not reflect the official position of the CDC. The use of trade names is for information purposes only and does not constitute endorsement by the CDC. This research was supported in part by an appointment to the Research Participation Program at the Centers for Disease Control and Prevention administered by the Oak Ridge Institute for Science and Education through an interagency agreement between the U.S. Department of Energy and CDC.
References
- [1].Fauci AS, Redfield RR, Sigounas G, Weahkee MD, Giroir BP. Ending the HIV Epidemic: A Plan for the United StatesEnding the HIV EpidemicEditorial. JAMA. 2019;321:844–5. [DOI] [PubMed] [Google Scholar]
- [2].Frieden TR, Foti KE, Mermin J. Applying Public Health Principles to the HIV Epidemic — How Are We Doing? New England Journal of Medicine. 2015;373:2281–7. [DOI] [PubMed] [Google Scholar]
- [3].Zihao L, Purcell DW, Sansom SL, Hayes D, Hall HI. Vital signs : HIV transmission along the continuum of care — United States, 2016. MMWR Morbidity Mortality Weekly Report. 2019;68:267–72. [DOI] [PMC free article] [PubMed] [Google Scholar]
- [4].Agutu CA, Ngetsa CJ, Price MA, Rinke de Wit TF, Omosa-Manyonyi G, Sanders EJ, et al. Systematic review of the performance and clinical utility of point of care HIV-1 RNA testing for diagnosis and care. PLOS ONE. 2019;14:e0218369. [DOI] [PMC free article] [PubMed] [Google Scholar]
- [5].Eisinger RW, Dieffenbach CW, Fauci AS. HIV Viral Load and Transmissibility of HIV Infection: Undetectable Equals Untransmittable. JAMA. 2019;321:451–2. [DOI] [PubMed] [Google Scholar]
- [6].Centers for Disease Control and Prevention. HIV Treatment as Prevention. 2020.
- [7].Hurt CB, Nelson JAE, Hightow-Weidman LB, Miller WC. Selecting an HIV Test: A Narrative Review for Clinicians and Researchers. Sexually transmitted diseases. 2017;44:739–46. [DOI] [PMC free article] [PubMed] [Google Scholar]
- [8].Sullivan PS, Mena L, Elopre L, Siegler A. Implementation Strategies to Increase PrEP Uptake in the South. Curr HIV/AIDS Rep. 2019;16:259–69. [DOI] [PMC free article] [PubMed] [Google Scholar]
- [9].Nair SV, Kim HC, Fortunko J, Foote T, Peling T, Tran C, et al. Aptima HIV-1 Quant Dx--A fully automated assay for both diagnosis and quantification of HIV-1. Journal of clinical virology : the official publication of the Pan American Society for Clinical Virology. 2016;77:46–54. [DOI] [PubMed] [Google Scholar]
- [10].Hatzakis A, Papachristou H, Nair SJ, Fortunko J, Foote T, Kim H, et al. Analytical characteristics and comparative evaluation of Aptima HIV-1 Quant Dx assay with Ampliprep/COBAS TaqMan HIV-1 test v2.0. Virol J. 2016;13:176. [DOI] [PMC free article] [PubMed] [Google Scholar]
- [11].Manak MM, Hack HR, Nair SV, Worlock A, Malia JA, Peel SA, et al. Evaluation of Hologic Aptima HIV-1 Quant Dx Assay on the Panther System on HIV Subtypes. J Clin Microbiol. 2016;54:2575–81 [DOI] [PMC free article] [PubMed] [Google Scholar]
- [12].Schonning K, Johansen K, Landt B, Benfield T, Westh H. Comparison of the Hologic Aptima HIV-1 Quant Dx Assay to the Roche COBAS Ampliprep/COBAS TaqMan HIV-1 Test v2.0 for the quantification of HIV-1 RNA in plasma samples. Journal of clinical virology : the official publication of the Pan American Society for Clinical 81. Virology. 2017;92:14–9. [DOI] [PubMed] [Google Scholar]
- [13].Saune K, Raymond S, Boineau J, Pasquier C, Izopet J. Detection and quantification of HIV-1 RNA with a fully automated transcription-mediated-amplification assay. Journal of clinical virology : the official publication of the Pan American Society for Clinical Virology. 2016;84:70–3. [DOI] [PubMed] [Google Scholar]
- [14].Yek C, Massanella M, Peling T, Lednovich K, Nair SV, Worlock A, et al. Evaluation of the Aptima HIV-1 Quant Dx Assay for HIV-1 RNA Quantitation in Different Biological Specimen Types. J Clin Microbiol. 2017;55:2544–53. [DOI] [PMC free article] [PubMed] [Google Scholar]
- [15].Sahoo MK, Varghese V, White E, Winslow M, Katzenstein DA, Shafer RW, et al. Evaluation of the Aptima HIV-1 Quant Dx Assay Using Plasma and Dried Blood Spots. J Clin Microbiol. 2016;54:2597–601. [DOI] [PMC free article] [PubMed] [Google Scholar]
- [16].Sam SS, Kurpewski JR, Cu-Uvin S, Caliendo AM. Evaluation of Performance Characteristics of the Aptima HIV-1 Quant Dx Assay for Detection and Quantitation of Human Immunodeficiency Virus Type 1 in Plasma and Cervicovaginal Lavage Samples. J Clin Microbiol. 2016;54:1036–41. [DOI] [PMC free article] [PubMed] [Google Scholar]
- [17].Hologic. Aptima HIV-1 Quant assay [package insert].
- [18].Sutcliffe CG, Palamountain KM, Maunga S, Searle KM, Thuma PE, Moss WJ, et al. The feasibility of fingerstick blood collection for point-of-care HIV-1 viral load monitoring in rural Zambia. Global health innovation. 2018;1. [DOI] [PMC free article] [PubMed] [Google Scholar]
- [19].Maiers TJ, Gous N, Nduna M, McFall SM, Kelso DM, Fisher MJ, et al. An investigation of fingerstick blood collection for point-of-care HIV-1 viral load monitoring in South Africa. S Afr Med J. 2015;105:228–31. [DOI] [PubMed] [Google Scholar]
- [20].Fidler S, Lewis H, Meyerowitz J, Kuldanek K, Thornhill J, Muir D, et al. A pilot evaluation of whole blood finger-prick sampling for point-of-care HIV viral load measurement: the UNICORN study. Sci Rep. 2017;7:13658. [DOI] [PMC free article] [PubMed] [Google Scholar]
- [21].Roche Molecular Diagnostics. COBAS® ampliprep/COBAS® TaqMan® HIV-1 test v2.0 [package insert].
- [22].Abbott Molecular. RealTime HIV-1 [package insert].
- [23].Delaney KP, Branson BM, Uniyal A, Phillips S, Candal D, Owen SM, et al. Evaluation of the Performance Characteristics of 6 Rapid HIV Antibody Tests. Clinical Infectious Diseases. 2011;52:257–63. [DOI] [PubMed] [Google Scholar]
- [24].Wesolowski LG, Delaney KP, Hart C, Dawson C, Owen SM, Candal D, et al. Performance of an alternative laboratory-based algorithm for diagnosis of HIV infection utilizing a third generation immunoassay, a rapid HIV-1/HIV-2 differentiation test and a DNA or RNA-based nucleic acid amplification test in persons with established HIV-1 infection and blood donors. Journal of clinical virology : the official publication of the Pan American Society for Clinical Virology. 2011;52 Suppl 1:S45–9. [DOI] [PubMed] [Google Scholar]
- [25].Stekler J, Violette L, Clark H, McDougal S, Niemann L, Katz D, et al. Prospective Evaluation of HIV Testing Technologies in a Clinical Setting: Protocol for Project DETECT (Preprint) 2019. [DOI] [PMC free article] [PubMed] [Google Scholar]
- [26].Jones J, Taussig J, Guest J, Kelley C, Sullivan P. Predictors of Loss of Viral Load Suppression among MSM in Atlanta, Georgia. CROI: Seattle, Washingon; 2019. [Google Scholar]
- [27].Giavarina D Understanding Bland Altman analysis. Biochem Med (Zagreb). 2015;25:141–51. [DOI] [PMC free article] [PubMed] [Google Scholar]
- [28].Mor O, Gozlan Y, Wax M, Mileguir F, Rakovsky A, Noy B, et al. Evaluation of the RealTime HIV-1, Xpert HIV-1, and Aptima HIV-1 Quant Dx Assays in Comparison to the NucliSens EasyQ HIV-1 v2.0 Assay for Quantification of HIV-1 Viral Load. J Clin Microbiol. 2015;53:3458–65. [DOI] [PMC free article] [PubMed] [Google Scholar]
- [29].Longo S, Bon I, Musumeci G, Bertoldi A, D’Urbano V, Calza L, et al. Comparison of the Aptima HIV-1 Quant Dx assay with the COBAS AmpliPrep/COBAS TaqMan HIV-1 v2.0 Test for HIV-1 viral load quantification in plasma samples from HIV-1–infected patients. Health Science Reports. 2018;1:e31. [DOI] [PMC free article] [PubMed] [Google Scholar]
- [30].Panel on Antiretroviral Guidelines for Adults and Adolescents. Guidelines for the Use of Antiretroviral Agents in Adults and Adolescents with HIV. Available at http://aidsinfo.nih.gov/contentfiles/lvguidelines/AdultandAdolescentGL.pdf: Department of Health and Human Services; 2019. [Google Scholar]
- [31].World Health Organization. Consolidated guidelines on the use of antiretroviral drugs for treating and preventing HIV infection: recommendations for a public health approach: World Health Organization; 2016. [PubMed]
- [32].Roche Molecular Diagnostics. COBAS AmpliPrep/COBAS TaqMan HIV-1 Test, version 2.0, Dilution Protocol for RUO [package insert]. 2015.
- [33].Mine M, Nkoane T, Sebetso G, Sakyi B, Makhaola K, Gaolathe T. Validation of dilution of plasma samples with phosphate buffered saline to eliminate the problem of small volumes associated with children infected with HIV-1 for viral load testing using Cobas AmpliPrep/COBAS TaqMan HIV-1 test, version 2.0 (CAP CTM HIV v2.0). J Virol Methods. 2013;194:217–21. [DOI] [PubMed] [Google Scholar]
- [34].Rutstein SE, Kamwendo D, Lugali L, Thengolose I, Tegha G, Fiscus SA, et al. Measures of viral load using Abbott RealTime HIV-1 Assay on venous and fingerstick dried blood spots from provider-collected specimens in Malawian District Hospitals. Journal of clinical virology : the official publication of the Pan American Society for Clinical Virology. 2014;60:392–8. [DOI] [PMC free article] [PubMed] [Google Scholar]
- [35].Siegler AJ, Mayer KH, Liu AY, Patel RR, Ahlschlager LM, Kraft CS, et al. Developing and Assessing the Feasibility of a Home-based Preexposure Prophylaxis Monitoring and Support Program. Clin Infect Dis. 2019;68:501–4. [DOI] [PMC free article] [PubMed] [Google Scholar]
- [36].Ssekalembe G, Isfandiari MA, Suprianto H. Current Status Towards 90-90-90 UNAIDS Target and Factors Associated with HIV Viral Load Suppression in Kediri City, Indonesia. HIV AIDS (Auckl). 2020;12:47–57. [DOI] [PMC free article] [PubMed] [Google Scholar]
- [37].Harris NS JA, Huang YA, Kern D, Fulton P, Smith DK, Valleroy LA, Hall HI. Vital Signs: Status of Human Immunodeficiency Virus Testing, Viral Suppression, and HIV Preexposure Prophylaxis — United States, 2013–2018. . MMWR Morb Mortal Wkly Rep. 2019;68:1117–23. [DOI] [PMC free article] [PubMed] [Google Scholar]