

Abstract
We investigated three unsymmetrical Ru-complexes, namely [Ru(bpy)2(phen-ITC)]2+. [Ru(bpy)2(dcbpy)] and [Ru(bpy)2(mcbpy)]+ for use as probes for rotational diffusion and in immunoassays of high-molecular-weight antigens. For this purpose we synthesized reactive forms of these metal-ligand complexes and conjugated them to human serum albumin (HSA). The maximal anisotropies (r0) for the HSA-bound forms in frozen solution are 0.23, 0.17 and 0.14 for the (dcbpy), (mcbpy) and (phen-ITC) derivatives, respectively. The activated Ru metal–ligand complexes have either one or two NHS-esters or an isothiocyanate group as the reactive moiety. The usefulness of these complexes in immunoassays was determined by titration of the labeled HSA with polyclonal anti-HSA. The highest steady state anisotropy (r) values (0.190) were observed for the [Ru(bpy)2(dcbpy)]-labeled HSA on titration with polyclonal antibody. However, a relative increase in the steady state anisotropy (r/r0) on titration with polyclonal antibody was found for the phen-ITC probe (96%), as compared to the dcbpy (83%) or mcbpy (79%) derivatives. These findings were confirmed by time-resolved frequency-domain measurements. In particular the higher mean correlation times calculated for the phen-ITC derivative suggests reduced local probe motion for this probe when bound to HSA as compared to the (mcbpy) and (dcbpy) conjugates.
Keywords: Anisotropy probes, High-molecular-weight antigens, Immunoassays, Protein hydrodynamics, Ru-complexes
1. Introduction
Measurements of fluorescence anisotropy or polarization are widely used in the biophysical and biomedical sciences. The usefulness of the fluorescence anisotropy measurements is derived from its dependence on the extent of rotational diffusion during the lifetime of the excited state. Fluorescence polarization immunoassays (FPIs) take advantage of this dependence to provide a diagnostic tool for antigens such as drugs and related biomolecules [1-3]. In a typical immune reaction based on fluorescence polarization [4-6], labeled and unlabeled antigens compete for the binding sites on the antibody. The anisotropy of the labeled antigen depends on the amount of labeled antigen free in solution or bound to the antibody, which depends on the amount of unlabeled antigen in the sample. Changes in anisotropy are caused by changes in the rotational correlation time of the labeled antigens which occur on binding or release from the antibody. The light emitted by the free tracer antigen should be depolarized in order to obtain good dynamic range in anisotropy due to binding to a specific antibody. This will occur if the rotational correlation time of the labeled antigen is shorter than the lifetime of the fluorescent label. Since the lifetimes of typical fluorophores are near 10 ns, anisotropy measurements are usually limited to studies of substances with molecular weights below 50000 Daltons. The short lifetime (about 4 ns) of the fluorophores commonly used as labels in FPIs (fluorescein or rhodamine) limits the FPI assays to antigens with molecular weights less than a few thousand Daltons. While attempts have been made to enable the measurement of high-molecular-weight antigens with such short lived fluorophores (τ < 20 ns) [7-10], FPIs are routinely limited to low molecular weight antigens such as drugs or antibiotics.
We recently described the use of long-lived metal–ligand complexes as a means to circumvent the low molecular weight limits of the anisotropy measurements [11]. We found that unsymmetrical Ru-ligand complexes such as [Ru(dcbpy)(bpy)2] display high anisotropy values in viscous solution or when bound to the proteins [11]. The long lifetime of this probe near 450 ns allowed measurement of rotational correlation times up to 1 μs. Recently, there was another report about the high anisotropy of such unsymmetrical ruthenium complexes [12]. We have already demonstrated an immunoassay for high-molecular-weight antigens (e.g. human serum albumin, HSA) based on unsymmetrical Ru–ligands using fluorescence polarization or excitation energy transfer [13,14]. In the present report, we describe the fluorescent spectral properties of three conjugatable metal–ligand complexes (Scheme 1) and evaluate their usefulness as probes for protein hydrodynamics and immunoassays.
Scheme I.
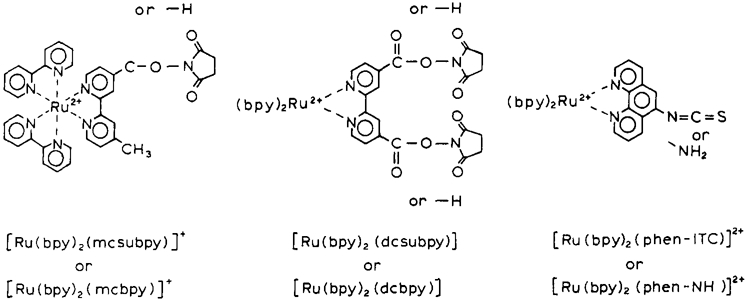
Chemical structures of the Ru metal–ligand probes.
2. Theory
2.1. Steady-state anisotropy
The anisotropy of a labeled macromolecule is related to the rotational correlation time (ΘR) by
| (1) |
where r0 is the value observed in the absence of rotational diffusion, and τ is the fluorescence life-time. The effect of the molecular weight MW of the protein on the anisotropy can be seen by
| (2) |
where R is the ideal gas constant, is the specific volume of the protein and h is the hydration, typically 0.2 g H2O per g of proteins, k is the Boltzmann constant, T is the absolute temperature (K), η is the viscosity and V is the molecular volume [15]. The molecular volume of the protein (V) links the molecular weight (MW) with the rotational correlation time (ΘR) of the protein. Generally, the observed correlation times are about twice as long as those calculated for an anhydrous sphere (Eq. (2) with h = 0), owing to the effects of hydration and the non-spherical shapes of most proteins. Hence, in aqueous solution at 20°C (η = 1 cP) one can expect a protein such as HSA (MW = 65 000, with ) to display a rotational correlation time near 50 ns.
2.2. Intensity and anisotropy decays
The fluorescence intensity decay with vertically polarized excitation can be described by a sum of exponential components:
| (3) |
| (4) |
where I(t), I∥(t), and I⊥ (t) are the decays of the total, vertical, and horizontal components of the emission, respectively, αi are the pre-exponential factors and τi are the decay times.
The polarized components of the intensity decay are related to the anisotropy decay by
| (5) |
| (6) |
Owing to rotational diffusion, the vertically oriented, excited molecules rotate out of the vertical orientation. Therefore, the parallel component (I∥(t)) decays faster than that of the total (I(t)). In contrast, the horizontal component (I⊥(t)) exhibits longer decay because this component is populated in part by rotational diffusion.
The anisotropy decay can also be expressed as a sum of exponentials:
| (7) |
where ΘRi are the rotational correlation times, gi are the fractional amplitudes for each component in the anisotropy decay (Σgi = 1.0), and r0 is the total anisotropy observed at t = 0. In those cases where the instrumental time resolution is adequate to detect the fastest component in the anisotropy decay, r0 is equal to the anisotropy observed in the absence of rotational motion, i.e. the value observed in vitrified solution.
The anisotropy decay r(t) is determined by measurements of the polarized components I∥(t) and I⊥(t):
| (8) |
This method is used in time-domain measurements. In the FD measurements, anisotropy decay is commonly determined from direct measurements of the phase angle difference (Δ) between the polarized components of the emission and the ratio of AC signals (Λ):
| (9) |
The phase angle difference Δ, and ratio Λ, are complex functions of the intensity decay parameters (αi and τi) and anisotropy decay (r0, gi, and ΘRi) [16-18]. The intensity decay parameters (Eq. (3)) are determined from separate measurements of phase angles and modulation of the total emission, relative to the modulated excitation, using magic angle polarization conditions.
To recover the multi-exponential intensity and anisotropy decays, the phase angles and modulations need to be measured using a multi-frequency fluorometer. The measurement of the ratio AC signals for each modulation frequency Λω is comparable to that of the intensity ratio of the polarized steady-state intensities and can be described as modulated anisotropy [19]:
| (10) |
The modulated anisotropy rω has properties of both the steady-state anisotropy (r) and the fundamental anisotropy (r0). At low modulation frequencies, as compared to the correlation time(s), rω approaches the value of r, and at high modulation frequencies rω approaches the value of r0. A large number of anisotropy decay models are possible. The anisotropy decay is most commonly described as a multi-exponential process (Eq. (7)). In this model, the value of r0 can be given, in which case gi are variable parameters. Alternatively, r0 can be a variable, in which case the (r0gi = ri) values are variables [18]. It is also possible that a fluorophore is in two different environments such as protein-bound and free, in which case each will exhibit a characteristic intensity or anisotropy decay, or the sample can contain two or more different fluorophores. The latter cases are called associated anisotropy decays because each intensity decay is associated with an anisotropy decay specific to each fluorophore [20-22]. The meanings of the associated anisotropy decay parameters are different in Eq. (7) for associated and non-associated anisotropy decays [22]. It is known that the observed anisotropy from a mixture is the intensity-weighted average of the anisotropies of the species [23,24]. This is true at all times and for two species can be written as
| (11) |
where ri(t) are the individual anisotropy decays (see Eq. (7)) and fi(t) are the time-dependent fractional intensities given by
| (12) |
Under certain conditions the frequency-domain and time-domain data with associated anisotropy decays can display unique and unexpected features [22].
3. Materials and methods
Polyclonal IgG specific to HSA (anti-HSA) from chicken was purchased from O.M.E. Concepts. Human IgG and HSA were purchased from Sigma, and used without further purification. 9-Aminophenanthroline was obtained from Polyscience. All other chemicals were purchased from Aldrich and used without further purification. Scheme 2 gives the synthetic pathway for the reactive Rumetal–ligand complexes as well as their chemical structures. The syntheses of Ru(bpy)2(dcbpy) [11] and Ru(bpy)2(mcbpy) [25] complexes have already been reported.
Scheme 2.
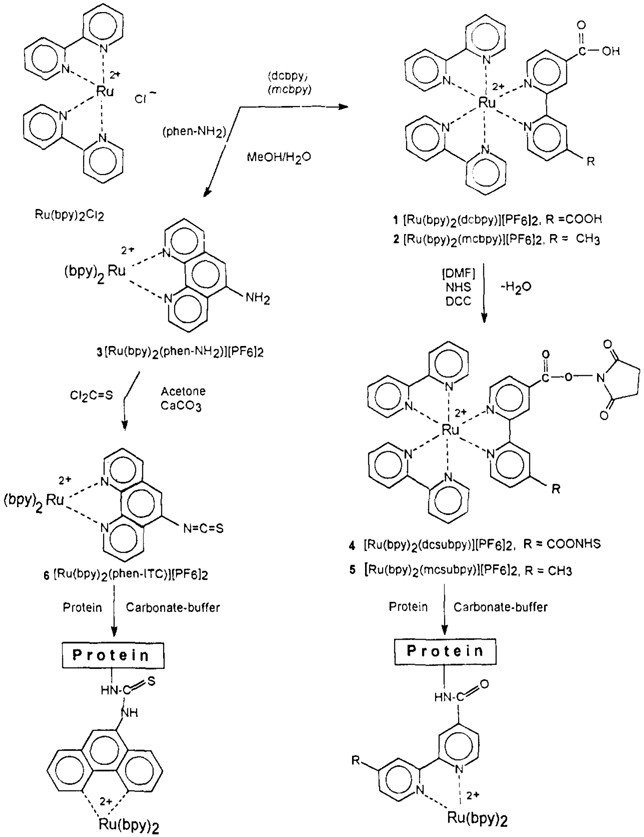
Synthetic pathway, structures and abbreviations for the reactive Ru-complexes 4–6.
3.1. Synthesis of [Ru(bpy)2(phen-NH2)2 +
0.97 (2 mmol) Ru(bpy)2Cl2 and 0.4 g 9-amino-1,10-phenanthroline were refluxed in 30 ml methanol/water for several hours. After cooling to room temperature, the methanol was removed by rotary evaporation and the complex was precipitated by adding an excess of NH4PF6 to the remaining water solution. A 100% yield was obtained. The precipitate was collected and purified by column chromatography on alumina using toluene:acetonitrile (1:2, v/v) as the eluent. The first band was collected, giving a yield of 1.46 g (81%).
3.2. Synthesis of [Ru(bpy)2(phen-ITC)]2 +
0.224 g (0.25 mmol) of Ru(bpy)2(phen-NH2) [PF6] was dissolved in dry acetone (3 ml). Finely crushed CaCO3 powder (0.09 g, 0.9 mmol) and 22 μl (0.14 mmol) thiophosgene were added to this solution, and the mixture was first stirred for 1 h at room temperature followed by 2.5 h of heating under reflux. After cooling to room temperature, the CaCO3 was filtered off and the acetone was removed under reduced pressure. The yield was 205 mg (87%).
3.3. Labeling of HSA with reactive Ru-complexes
HSA was labeled by adding 1–3 mg of the reactive Ru-complex to a stirred solution of 7–9 mg HSA in 750 μ1 NaHCO3 (500 mM, pH 9.2, 0.85% NaCl) followed by a 3–5 h incubation at room temperature. The reaction was stopped by adding 150 μl of NH2OH.HCl dissolved in 0.5 M NaHCO3 containing 0.85% NaCl. Free dye was separated from the labeled HSA by gel filtration chromatography on Sephadex G-25, using 10 mM MOPS, 0.85% NaCl, pH 7.4. The dye/protein ratio of the Ru–HSA conjugate was estimated by measuring the absorbance of the Ru-conjugates at their long wavelength absorption maxima and separately determining the protein concentration with a commercial protein assay (Modified Lowry assay, Pierce, Rockford, IL). The dye/protein ratios and the protein concentration of the Ru–HSA conjugates, as well as the extinction coefficients ϵ and absorption maxima values for their long wavelength absorption bands, are given in Table 1.
Table 1.
Spectroscopic properties of Ru(bpy)2 L conjugated to HSA
| L | Absorption |
Emission | Anisotropy a |
Dye/protein ratio | ||
|---|---|---|---|---|---|---|
| ϵmax (M−1 cm−1) | λmax (nm) | λmax (nm) | r0 | λexe b | ||
| dcbpy | 12000 | 467 | 655 | 0.23 | 493 | 4.2 |
| mcbpy | 11900 | 456 | 643 | 0.17 | 490 | 4.9 |
| phen-ITC | 15000 | 452 | 610 | 0.14 | 480 | 4.0 |
Maximum anisotropy observed in glycerol–water (6:4, v/v) at −55°C.
Excitation wavelength for maximum anisotropy.
3.4. Performance of immunoassays
Aliquots of polyclonal antibody (anti-HSA, c = 1 mg ml−1) were added to 100 nM concentrations of the labeled Ru–HSA conjugates up to a 8:1 molar excess, and the mixtures were incubated for 30 min at room temperature prior to measurement. The samples were measured against blanks containing the same amount of antibody and unlabeled HSA in MOPS buffer, pH 7.3, at 20°C. The anisotropies were determined by measuring the vertically and horizontally polarized components of the emission with vertically polarized excitation. The correction factors (G-factors) were measured with horizontally polarized excitation. Each sample was measured 20 times (including the G-factor) and the anisotropy values were averaged.
3.5. Fluorescence measurements
Fluorescence emission spectra and steady-state anisotropy measurements were performed with an Aminco Bowman 2 spectrofluorometer from SLM. The excitation and emission bandpass for the measurements were 4 nm and 16 nm, respectively, unless otherwise stated. For the anisotropy measurements we used a 580 nm cutoff filter to isolate the emission. Fluorescence intensity and anisotropy decays were measured using frequency-domain instrumentation (ISS). The excitation light source was CW air cooled argon ion laser (543-AP, Omnichrome). We used 488 nm as the excitation wavelength, which was amplitude modulated by the electro-optical low frequency modulator (K2.LF from ISS).
4. Results
4.1. Spectral properties
Absorption and emission spectra of the three Ru-complexes when conjugated to the HSA are shown in Fig. 1. The long wavelength absorption maxima (above 400 nm) and emission maxima follow the order (dcbpy) > (mcbpy) > (phen-ITC) (Table 1). The differences observed for the absorption bands of the three complexes are smaller (15 nm) than observed for the emission maxima (45 nm).
Fig. 1.
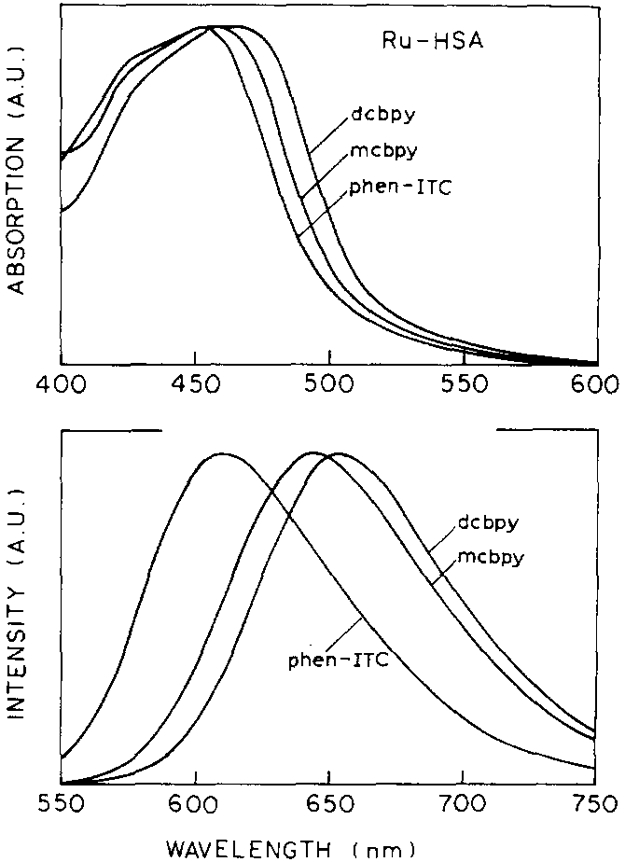
Absorption and emission spectra of [Ru(bpy)2(dcbpy)], [Ru(bpy)2(mcbpy)]+, and [Ru(bpy)2 phen-ITC]2+ conjugated to HSA. Excitation wavelength 460 nm, at 20°C, in MOPS buffer (10 mM, pH 7.3).
The excitation polarization spectra for the protein-conjugated probes in vitrified solution (glycerol:water = 6:4, −55°C) are shown in Fig. 2. The highest value for the initial anisotropy (r0 = 0.23) was observed for the (dcbpy)–HSA conjugate, followed by the (mcbpy) and (phen-ITC) derivatives with r0 values of 0.17 and 0.14, respectively.
Fig. 2.
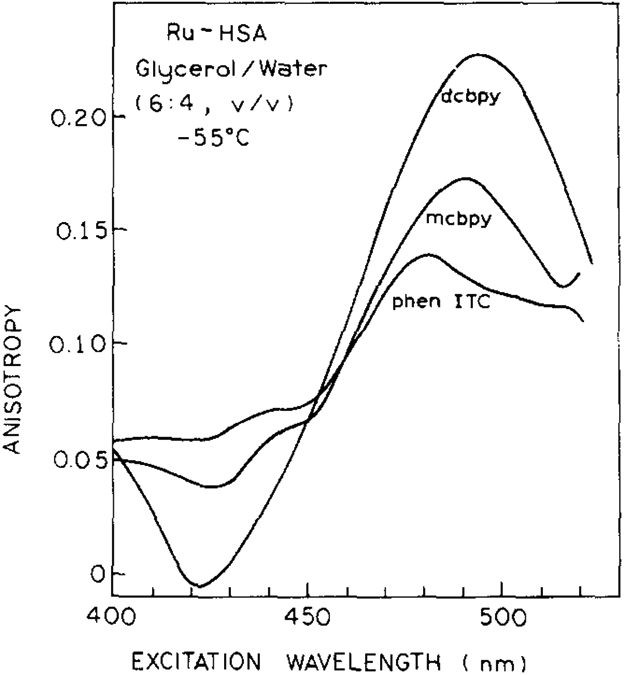
Excitation anisotropy spectra of [Ru(phen-ITC)(bpy)2]2 +, [Ru(dcbpy)(bpy)2] and [Ru(mcbpy)(bpy)2]+ conjugated to HSA. The emission wavelength was 650 nm for dcbpy and mcbpy, and 605 nm for phen-ITC with a bandpass of 16 nm. Excitation wavelength bandpass was 4 nm.
A basic, but not sufficient, requirement for obtaining a higher value of r0 for a metal-ligand complex like Me(L)3 (L = bpy, phen) is that one of the three ligands has to be non-identical. If one of the ligands can exist in a lower energy metal–ligand charge transfer (MLCT) state, then the excited state can be localized between metal and ligand(s) with the lowest energy. A high anisotropy (r0) is expected if there is only one non-identical ligand with the lowest MLCT energy. This has been already supported by anisotropy measurements of [Ru(bpy)3]2+ and [Ru(bpy)2(dcbpy)] [11,12]. Randomization of the energy among the ligands appear to be the reason why [Ru(bpy)3]2+ exhibits a lower r0 value (0.15) than [Ru(bpy)2(dcbpy)] (0.23) [11]. MLCT states are the energetically lowest states in the metal-ligand complexes [12,26] derived from mixing metal d-orbitals with ligand π * - orbitals [12,26]. Therefore, the value of r0 is strongly dependent on the properties of the non-identical ligand relative to the others [12]. The MLCT state energies of bpy and phen are sensitive to the substitution patterns on the ring systems and introduction of heteroatoms into their ring system. Electron-donating substituents (methyl, amino and alkylamino groups) in the 4 and 4′ positions of the bipyridine ring system were observed to increase the MLCT energy; electron-withdrawing groups such as COOH, COOEt and SO3H are expected to lower the MLCT energy. The lower value of r0 observed for the phen-ITC probe may be explained by similar MLCT energies of the phen-ITC and the bpy MLCT states [12].
The maximum emission wavelength of the three complexes increases in the order phen-NH2, mcbpy, and dcbpy; the maximum anisotropies increase in the same order. This suggests that the principles of MLCT state energy can be used to predict which metal–ligand probes will display the highest anisotropy and thus be useful in FPIs.
By this reasoning, charge transfer to the non-identical ligand in [Ru(bpy)2(phen-NH2)]2+ (or in the reactive form, phen-ITC) derivative should not be preferred over charge transfer to the other two (bpy)-ligands. The higher energy of the (phen-NH2) MLCT state should rather lead to a lesser likelihood of photoselection of this ligand. Therefore, the value of r0 for this complex is expected to be comparable to that for the symmetrical [Ru(bpy)3]2+ complex, which has been observed in our measurements (r0 = 0.14 for [Ru(phen-NH2)(bpy)2]2+ and r0 = 0.15 for [Ru(bpy)3]2+ [11]. In contrast, we expected a higher r0 value for the [Ru(mcbpy)(bpy)2]1 + derivative than 0.17. This value is markedly lower than that for dcbpy (0.23). This result is somewhat unexpected since the emission spectrum of mcbpy is much closer to that of dcbpy than the (bpy)3 complex. Evidently, the presence of two electron-withdrawing carboxyl groups results in higher localization of the MLCT state than a single carboxyl group.
Recent reports of time-resolved resonance Raman experiments (TR3) on asymmetrical Ru-complexes such as [Ru(bpy)2(pypz)] or [Ru(bpy)(mpypy)]1 + gave evidence of preferential localization of the charge transfer on one side of asymmetrical ligands such as pyridyl-pyrazyl (pypz) or methylpyridylpyridyl (mpypy) [27-29]. According to these reports [27-29], the MLCT state energies of the methylpyridine unit should be higher than that of the carboxypyridine unit, and thus charge transfer should be preferred in the carboxypyridine moiety. This is the reason we decided to synthesize and evaluate the compound [Ru(mcbpy)(bpy)2]+ 1, where the structural symmetry of the complex is further reduced relative to dcbpy, with higher r0 values being expected than for dcbpy. However, the maximal anisotropy of [Ru(bpy)2(mcbpy)]+ 1 is less than that of [Ru(bpy)2(dcpby)]. One possible explanation for our data could be an overlapping of the absorption bands of the methylpyridyl and carboxypyridyl subunits, which could have different polarizations [12].
Another interesting observation is the strong dependence of r0 on excitation wavelength. The maximum values are observed in the steepest part of absorption spectra in the range 480–495 nm, whereas at the absorption maxima (450–460 nm) the anisotropies are significantly lower (e.g. for dcbpy only about one third of its maximum value). Explanation of the decreasing values of r0 on the long wavelength side of the absorption requires further investigation. Nonetheless, the wavelength range of 480–495 nm can be readily obtained from argon ion lasers (488 nm) in order to take full advantage of the anisotropic properties of the Ru-complexes for future immunoassays.
4.2. Immunoassays
We tested the three Ru-complexes to see which was most suitable for immunoassays of high-molecular-weight analytes. The changes in the anisotropies of Ru-complexes labelled HSA are shown in Fig. 3 for addition of up to eight times the molar concentration of polyclonal antibody (pAb). dcbpy displays the highest absolute increase in anisotropy with a saturation value near 0.190. The (mcbpy) and (phen- ITC) derivatives show saturation anisotropy values near 0.135. Control experiments of non-specific antibody and (dcbpy)–HSA derivatives have been performed in earlier experiments, showing no effect on the anisotropy values of labelled HSA [13]. An interesting result is revealed by the relative increases in anisotropy (r/r0) for the three Ru-conjugates. While the relative increases in anisotropy for the mcbpy and dcbpy are about 80%, the Ru(phen-ITC) conjugate shows a relative increase of 96% in anisotropy on titration with pAb, which indicates higher immobilization of the probe when conjugated to the HSA. This behaviour was confirmed by time-resolved anisotropy measurements (see Section 4.4). Hence, contradictory to intuition, the best complex for measurements of rotational diffusion and immunoassays appears to be [Ru(bpy)2(phe-ITC)]2 + , in spite of its lower r0 value.
Fig. 3.
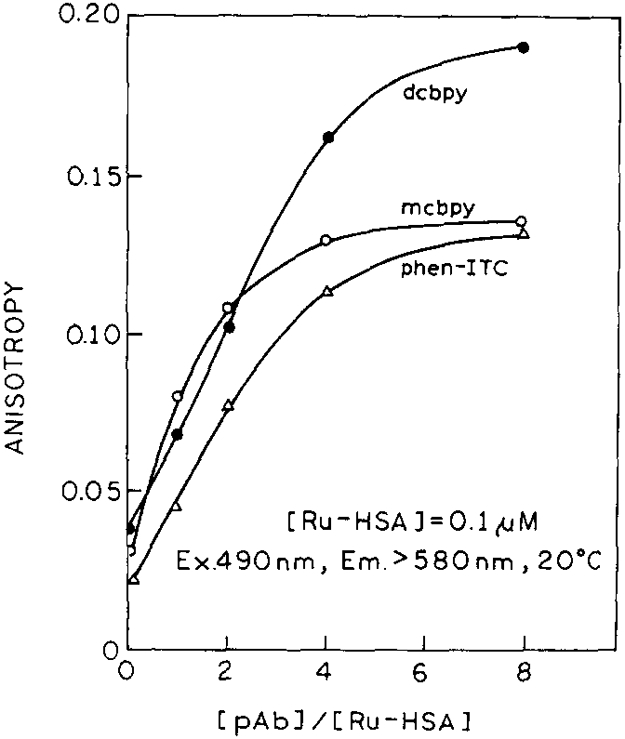
Steady-state anisotropies of Ru–HSA at various concentrations of pAb (anti-HSA). The excitation wavelength was 485 nm with a bandpass of 4 nm. For the emission we used a 580 nm cutoff filter.
4.3. Intensity decays
A long lifetime for the fluorophore is one of the most important parameters for FPIs of high-molecular-weight antigens [11,13]. It is known that the luminescence of ruthenium complexes is often quenched by molecular oxygen and that they are sensitive to the chemical microenvironment [30-32]. Hence, we measured the intensity decays of free dyes, conjugated to the HSA in the absence (argon) and presence of oxygen (air equilibrated). Results of the intensity decay analyses are summarized in Table 2. The representative intensity decays using the frequency-domain method are shown in Fig. 4. All other intensity decays (Table 2) can be represented by the similar frequency responses somewhere between those in Fig. 4. These two intensity decays illustrate the capability of low frequency instrumentation for resolving heterogeneous intensity decay measurements. The data were fitted to the multi-exponential model (Eq. (3)) and mean lifetimes were then calculated using
| (13) |
Table 2.
Luminescence mean lifetimes a of Ru(bpy)2L complexes under various conditions
| L | Free dye | Conjugated to HSA b |
Ratio [pAB]/[Ru–HSA] c | ||||
|---|---|---|---|---|---|---|---|
| 0 | 1 | 2 | 4 | 8 | |||
| dcbpy | 366 (499)c | 434 (487)d | 468 | 478 | 502 | 495 | 485 |
| mcbpy | 390 (527) | 507 (551) | 514 | 500 | 501 | 513 | 534 |
| phen-ITC | – | 794 (1105) | 618 | 687 | 681 | 775 | – |
| phen-NH2 | 433 (650) | – | – | – | – | – | – |
Mean lifetime from Eq. 13.
[Ru–HSA] concentration 1 μM; lifetime uncertainty about 5%.
[Ru–HSA] concentration 0.1 μM; lifetime uncertainty about 7% for dcbpy and mcbpy, and about 10% for phen-ITC.
Values in brackets are in the absence of oxygen (argon equilibrated). Excitation 488 nm, emission above 580 nm, magic angle polarizer condition.
Fig. 4.
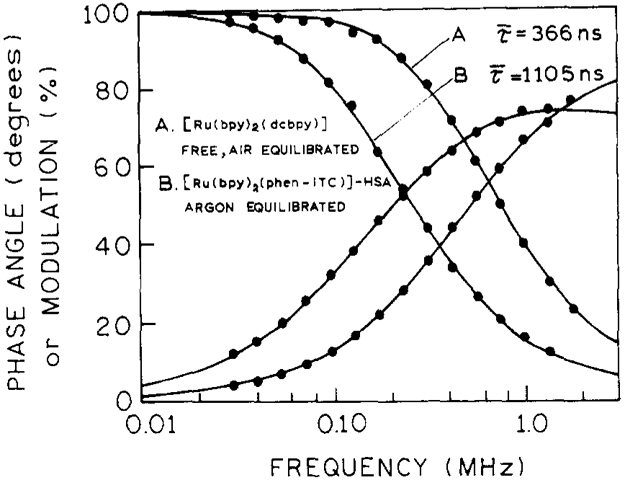
Frequency-domain intensity decay of [Ru(bpy)2(dcbpy)] free probe in air equilibrium (the shortest mean lifetime) and [Ru(bpy)2(phen-ITC)]–HSA in the absence of oxygen (the longest mean lifetime).
The free complexes (not conjugated to HSA) display single-exponential intensity decays. Their lifetimes decrease similarly in the presence of oxygen (air equilibrated) in the range from 26 to 33%. The single-exponential intensity decays can also be regarded as an indication of the purity of the synthesized Ru-complexes.
Heterogeneous intensity decays were observed for Ru-complexes conjugated to the HSA. Acceptable fits were obtained using the two-exponential decay model for dcbpy and mcbpy, and the three-exponential model for phen-ITC. The increased mean lifetime of HSA-conjugated dcbpy and mcbpy can be explained by reduced oxygen quenching (reduced access to the conjugated probe) compared with free probes. In the absence of oxygen, the mean lifetimes of dcbpy and mcbpy conjugated to HSA are very similar to those of free probes (Table 2). The lifetime of phen-ITC shows a strong dependence on binding to the HSA. In the absence of oxygen, the mean lifetime for phen-ITC increased from 650 ns for the free probe (phen-NH2) to 1105 ns (phen-ITC conjugated to HSA). This significant increase (about 41%) indicates some environmental sensitivity of this probe. The data for dcbpy were published previously [11, 13]. The shorter mean lifetime for the dcbpy–HSA conjugate reported earlier [11] was due to the limited time scale (300 ns) used in previous time-domain measurements, which made it impossible to resolve two components in these intensity decays.
We also measured the intensity decays of dcbpy, mcbpy and phen-ITC conjugated to HSA in the presence of various amounts of antibody. To facilitate the polarization immunoassay, the concentration of Ru-complexes was low comparable with the antibody concentration (see Fig. 3). We used 0.1 μM concentrations of Ru–HSA complexes, which was 10-fold lower than the concentrations of HSA complexes without antibody (Table 2, first two columns). In the presence of anti-HSA and a low concentration of Ru–HSA, we may expect scattered light and/or fluorescence from anti-HSA impurities to affect the measured Ru–HSA intensity decay. However, the mean lifetimes of dcbpy and mcbpy changed only slightly and did not depend on the ratio of [pAb]/[Ru–HSA] (Table 2). The mean lifetimes of phen-ITC are shorter in the presence of pAb than those obtained at higher probe concentration (Table 2). It is likely that this is within experimental error, since the intensity decay of phen-ITC is strongly heterogeneous.
4.4. Anisotropy decays
In the present system, the anisotropy decay of the Ru-complex in the presence of antibody should be described by an associated anisotropy decay. There are at least two species in solution, Ru–HSA and (Ru–HSA)–pAb, with their characteristic correlation times. Since the intensity decays of Ru–HSA and (Ru–HSA)–pAb do not differ significantly, and the value of r0 should be the same, the associated anisotropy decay (Eq. (11)) cannot be distinguished from non-associated decay (Eq. (7)). Therefore, the factors gi can be interpreted as the fractional populations of Ru–HSA and (Ru–HS A)–pAb. Fig. 5 shows frequency responses for dcbpy at various amounts of pAb. The differential phase angles decreased (Fig. 5. top) and modulated anisotropies increased (Fig. 5, bottom) upon immunoreaction. Similar results were obtained for mcbpy and phen-ITC.
Fig. 5.
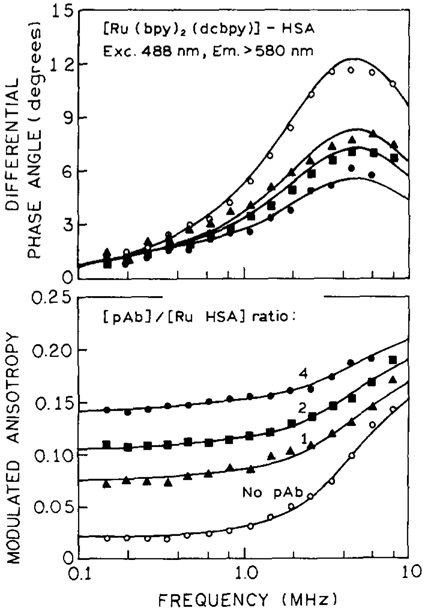
Differential polarized phase angle of [Ru(bpy)2(dcbpy)]–HSA (upper), and modulated anisotropies (lower) in the absence and presence of pAb.
To improve the accuracy in calculating the rotational correlation times we used the global analysis method [33], with the assumption that the rotational correlation times (ΘR i) are expected to be the same for each data set of [pAb]/[Ru–HSA], and that the amplitudes (r0 gi) vary. The global analysis revealed correlated changes in amplitude with increasing amount of pAb. The anisotropy decay analyses are summarized in Table 3. A fit to a single-correlation time model was not acceptable. The frequency-do main experimental data were fit to two correlation times. In each case, a short (ΘR1) and long (ΘR2) correlation time were recovered. The short correlation time is expected to be associated with Ru–HSA and the second much longer correlation time with (pAb–(Ru–HSA))n. The subscript n indicates that with polyclonal antibodies we expect aggregates due to multiple binding sites on the pAb to be present on HSA. The long rotational correlation time (longer than 2300 ns) indicates that this has occurred. A increasing degree of immunoreaction resulted in a larger value of r0 g2 and a simultaneous decrease in r0g1 (Table 3). The total values of the initial anisotropies (at t = 0) correspond well to the r0 values obtained for rigid solutions presented in Fig. 2. This is an important observation since it indicates that our data are adequate for recovering the entire anisotropy decay. The conclusion is less clear if the recovered r0 is less than the low temperature value, which indicates a missing component in the recovered anisotropy decay [12,34].
Table 3.
Global anisotropy decay analysis of [Ru(bpy)2(Lx)] conjugated to HSA in the presence of various amounts of antibody a
| Ratio Ab/Ag | Ru(bpy)2(dcbpy)–HSA ΘR1 = 36 ns; ΘR2 = 5115 ns |
Ru(bpy)2(mcbpy)–HSA ΘR1 = 29 ns; ΘR2 = 3810 ns |
Ru(bpy)2(phen-ITC)–HSA ΘR1 = 68 ns; ΘR2 = 7023 ns |
||||||
|---|---|---|---|---|---|---|---|---|---|
| g1r0 | g2r0 | Σgir0 | g1r0 | g2r0 | Σgir0 | g1r0 | g2r0 | Σgir0 | |
| 0 | 0.173 | 0.008 | 0.181 | 0.144 | 0.011 | 0.155 | 0.102 | 0.0006 | 0.103 |
| 0.5 | – | – | – | 0.113 | 0.032 | 0.145 | – | – | – |
| 1.0 | 0.117 | 0.072 | 0.189 | 0.119 | 0.046 | 0.165 | 0.096 | 0.030 | 0.126 |
| 2.0 | 0.103 | 0.105 | 0.208 | – | – | – | 0.052 | 0.069 | 0.121 |
| 4.0 | 0.078 | 0.145 | 0.223 | 0.126 | 0.070 | 0.196 | 0.044 | 0.086 | 0.130 |
| 8.0 | 0.086 | 0.140 | 0.226 | 0.120 | 0.090 | 0.210 | – | – | – |
Excitation of 488 nm, emission above 580 nm, temperature 24°C.
In Table 3, it can be seen that the anisotropy decays retain a short component from 36 to 68 ns, even in the presence of excess antibody. This component could be due to free motions of the HSA when bound to antibody, segmental motion of the probe on the protein, or the presence of Ru-labelled HSA which is not bound to antibody. The latter could occur if labelling with the Ru-complex decreases the affinity of HSA for the antibody. Further experimentation is required to clarify this point.
We questioned the certainty of the rotational correlation times determined from the FD data. This is an important consideration, because the recovered rotational correlation components were several times longer than the respective mean lifetimes. We examined the dependence of the goodness-of-fit parameter [35] for each rotational correlation time. In the (chi-squared), surface analyses the value of one correlation time was fixed and remaining parameters were floating until a minimum value of chi-squared was obtained using a set of data (various ratios of [pAb]/[Ru–HSA]) for each Ru-complex. The chi-squared surfaces are shown in Fig. 6. From these analyses we have the following information: (i) the short components were well resolved based on high sensitivity of chi-squared to correlation time, (ii) the short component for phen-ITC is markedly longer than for dcbpy and mcbpy, (iii) resolution of long components is poor, and (iv) the resolved lower limit for long components is about 2300 ns. For dcbpy and mcbpy conjugates, the short components are somewhat shorter than expected for HSA (40–50 ns), indicating some degree of free rotation of the probe when conjugated to HSA. These apparent rotational correlation times are thus an average of those for free probe motion on the protein and for protein rotation. The short correlation time for phen-ITC (67 ns) slightly exceeds the expected value for HSA, indicating the absence of free probe rotation when conjugated to the HSA. These observations also explain the steady-state anisotropies presented in Fig. 3. about 80–85% of r0 for dcbpy and mcbpy, and nearly 100% of r0 for phen-ITC (for [pAb]/[Ru–HSA] ratios higher than 8). The uncertainties of the determined correlation times are related to the values of r0, following phen-ITC > mcbpy > dcbpy. However, accurate determination of the long correlation time probes with longer lifetimes (2000–5000 ns) is necessary with initial anisotropies higher than 0.15.
Fig. 6.
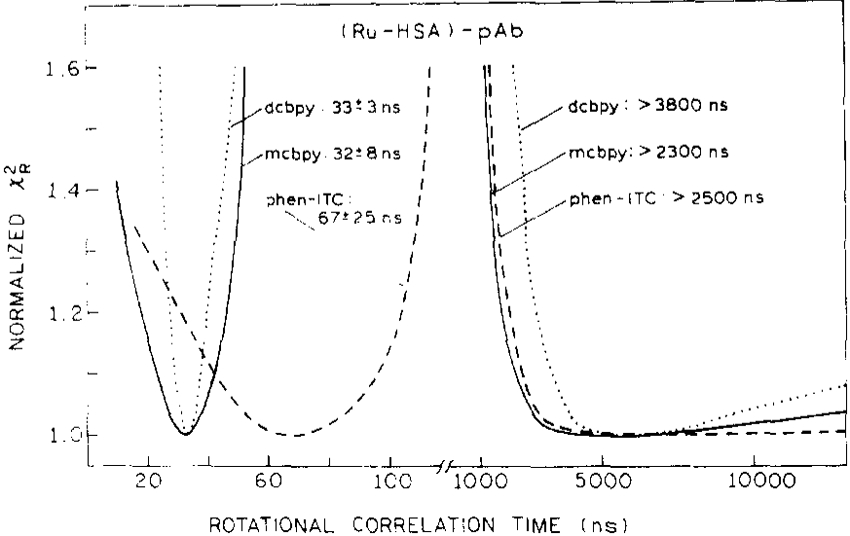
Normalized -surfaces for the fitting of the rotational correlation times to a global analysis model for Ru(bpy)2(dcbpy) (⋯), Ru(bpy)2(mcbpy) (——) and the Ru(bpy)2(phen-ITC–HSA conjugate (– – –) in the presence of pAb.
5. Conclusions
In the previous sections we described the emission, decay time and anisotropy properties of three metal–ligand complexes. All of these compounds were found to display useful anisotropy in the absence of rotational motion, making them useful as anisotropy probes for slow rotational motions of large macromolecules. The comparison of these three probes suggested that one can predict which types of metal–ligand complexes will display the highest anisotropy, based on the selection of ligands which result in a localized MLCT state. An additional factor in considering a metal–ligand probe is the extent to which the probe displays depolarization due to segmental motions on the macromolecules as well as depolarization due to overall macromolecular molecular diffusion. Based on these considerations, the phen-ITC complex appears to be the most strongly immobilized when covalently linked to human serum albumin. This probe also displayed the longest decay time, which in principle should make it sensitive to the smallest rotational motions. However, we also realize that the resolution of an association reaction or an anisotropy decay is strongly dependent on the fundamental anisotropy (r0), of which the dcbpy complex displays the highest value. In summary, metal–ligand complexes in general seem to be valuable probes for macromolecular hydrodynamics.
Acknowledgements
This work was supported by a grant from the National Institutes of Health, (RR-08119), with additional support for instrumentation, NIH (RR-07510-01). JRL also expresses appreciation for support from the Medical Biotechnology Center at the University of Maryland.
Abbreviations:
- bpy
2.2′-bipyridine
- dcbpy
4,4′-dicarboxyl-2.2’-bipyridine
- FD
frequency domain
- FPI
fluorescence polarization immunoassay
- HSA
human serum albumin
- IgG
immunoglobulin G. human
- MLC
metal–ligand complex
- mcbpy
4-methyl-4′-carboxyl-2,2′-bipyridine
- pAb
polyclonal antibody for HSA
- phen-NH2
9-amino-1.10-phenanthroline
- phen-ITC
1,10-phenanthroline-9-isothiocyanate
References
- [1].Ichinose N, Schwedt G, Schnepel FM and Adachi K, (Eds.), Fluorometric Analysis in Biomedical Chemistry, Wiley, New York, 1987. [Google Scholar]
- [2].Van Dyke K and Van Dyke R (Eds.), Luminescence Immunoassay and Molecular Applications, CRC Press, Boca Raton, FL, 1990. [Google Scholar]
- [3].Ozinskas AJ, in Lakowicz JR (Ed.), (1994) Topics in Fluorescence Spectroscopy, Vol. 4, Probe Design and Chemical Sensing, Plenum, New York, 1994, pp. 449–496. [Google Scholar]
- [4].Levison SA, in Chen RF and Edelhoch H (Eds.), Biochemical Fluorescence: Concepts, Vol. 1, Marcel Dekker, New York, 1975, pp. 375–408. [Google Scholar]
- [5].Haber E and Bennett JC, Proc. Natl. Acad. Sci. USA, 48 (1962) 1935–1942. [DOI] [PMC free article] [PubMed] [Google Scholar]
- [6].Spencer RD, Toledo FB, Williams BT and Yoss NL, Clin. Chern, 19 (1973) 838–844. [PubMed] [Google Scholar]
- [7].Tsuruoka M, Tamiya E and Karube I, Biosens. Bioelectron, 6 (1991) 501–505. [DOI] [PubMed] [Google Scholar]
- [8].Grossman SH, (1984) J. Clin. Immunoassay, 7(1) (1984) 96–100. [Google Scholar]
- [9].Urios P and Cittanova N, Anal. Biochem, 185 (1990) 308–312. [DOI] [PubMed] [Google Scholar]
- [10].Wei AP and Herron JN, Anal. Chem, 65 (1993) 3372–3377. [DOI] [PubMed] [Google Scholar]
- [11].Terpetschnig E, Szmacinski H, Malak H and Lakowicz JR, Biophys. J, 68 (1994) 342–350. [DOI] [PMC free article] [PubMed] [Google Scholar]
- [12].DeGraff BA and Demas JN, J. Phys. Chem, 98 (1994) 12478–12480. [Google Scholar]
- [13].Terpetschnig E, Szmacinski H and Lakowicz JR, Anal. Biochem, 227 (1995) 140–147. [DOI] [PMC free article] [PubMed] [Google Scholar]
- [14].Youn HJ, Terpetschnig E, Szmacinski H and Lakowicz JR, Anal. Biochem, 232 (1995) 24–30. [DOI] [PMC free article] [PubMed] [Google Scholar]
- [15].Weber G, in Hercules DM (Ed.), Fluorescence and Phosphorescence Analysis Principles and Applications, Wiley-Interscience, New York, 1966, pp. 217–240. [Google Scholar]
- [16].Merkelo H, Hammond JH, Hartman SR and Derzko JI, J. Lumin, 1(2) (1970) 502–512. [Google Scholar]
- [17].Weber G, J. Chem. Phys., 66 (1977) 4081–4091. [Google Scholar]
- [18].Lakowicz JR, Cherek H, Kusba J, Grysczynski I and Johnson ML, J. Fluorescence, 3(2) (1993) 103–116. [DOI] [PubMed] [Google Scholar]
- [19].Maliwal BP and Lakowicz JR, Biochim. Biophys. Acta, 873 (1986) 173–181. [DOI] [PubMed] [Google Scholar]
- [20].Knutson JR, Davenport L and Brand L, Biochemistry, 25 (1986) 1805–1810. [DOI] [PubMed] [Google Scholar]
- [21].Davenport L, Knutson JR and Brand L, Biochemistry, 25 (1986) 1811–1816. [DOI] [PubMed] [Google Scholar]
- [22].Szmacinski H, Jayaweera R, Cherek H and Lakowicz JR, Biophys. Chem, 27 (1987) 233–241. [DOI] [PubMed] [Google Scholar]
- [23].Weber G, Biochem. J, 51 (1952) 145–167. [DOI] [PMC free article] [PubMed] [Google Scholar]
- [24].Jablonski A, Bull. Acad. Pol. Sci, 8 (1960) 259–264. [Google Scholar]
- [25].Peek BM, Ross GT, Edwards SW, Meyer GJ, Meyer TJ and Erikson BW, Int. J. Peptide Protein Res, 38 (1991) 114–123. [DOI] [PubMed] [Google Scholar]
- [26].Sykora M and Kincaid JR, Inorg. Chem, 34 (1995) 5852–5856. [Google Scholar]
- [27].McClanahan SF, Dallinger RF, Holler FJ and Kincaid JR, JACS, 107 (1985) 4853–4860. [Google Scholar]
- [28].Treffert-Ziemelis SM, Golus J, Strommen DP and Kincaid JR, Inorg. Chem, 32 (1993) 3890–3894. [Google Scholar]
- [29].Danzer GD, Golus JA and Kincaid JR, JACS, 115 (1993) 8643–8648. [Google Scholar]
- [30].Demas JN, Harris EW and McBride RP, JACS, 99 (1977) 3547–3551. [Google Scholar]
- [31].Demas JN and DeGraff BA, J. Micromol. Sci. Chem. A, 25(10/11) (1988) 1189–1214. [Google Scholar]
- [32].Carraway ER, Demas JN, DeGraff BA and Bacon JR, Anal. Chem, 59 (1991) 2780–2785. [Google Scholar]
- [33].Beechem JM, Gratton E, Ameloot M, Knutson JR and Brand L, in Lakowicz JR (Ed.), Topics in Fluorescence Spectroscopy, Vol. 2, Principles, Plenum, New York, 1991, pp. 241–305. [Google Scholar]
- [34].Myrick ML, Blackley RL, DeArmond MK and Arthur ML, J. Am. Chem. Soc, 110 (1988) 1325–1336. [Google Scholar]
- [35].Lakowicz JR, Laczko G, Cherek H, Gratton E and Limkeman M, Biophys. J, 46 (1984) 463–477. [DOI] [PMC free article] [PubMed] [Google Scholar]