Abstract
Purpose
To compare frequently used classification systems for age-related macular degeneration (AMD) in their abilty to predict late AMD.
Methods
In total, 9066 participants from the population-based Rotterdam Study were followed up for progression of AMD during a study period up to 30 years. AMD lesions were graded on color fundus photographs after confirmation on other image modalities and grouped at baseline according to six classification systems. Late AMD was defined as geographic atrophy or choroidal neovascularization. Incidence rate (IR) and cumulative incidence (CuI) of late AMD were calculated, and Kaplan-Meier plots and area under the operating characteristics curves (AUCs) were constructed.
Results
A total of 186 persons developed incident late AMD during a mean follow-up time of 8.7 years. The AREDS simplified scale showed the highest IR for late AMD at 104 cases/1000 py for ages <75 years. The Rotterdam classification showed the highest IR at 89 cases/1000 py >75 years. The 3-Continent harmonization classification provided the most stable progression. Drusen area >10% ETDRS grid (hazard ratio 30.05, 95% confidence interval [CI] 19.25–46.91) was most prognostic of progression. The highest AUC of late AMD (0.8372, 95% CI: 0.8070-0.8673) was achieved when all AMD features present at baseline were included.
Conclusions
Highest turnover rates from intermediate to late AMD were provided by the AREDS simplified scale and the Rotterdam classification. The 3-Continent harmonization classification showed the most stable progression. All features, especially drusen area, contribute to late AMD prediction.
Translational Relevance
Findings will help stakeholders select appropriate classification systems for screening, deep learning algorithms, or trials.
Keywords: AMD, classification systems, screening, artificial intelligence, clinical trials
Introduction
Late age-related macular degeneration (AMD) causes blindness in approximately 11 million people worldwide. This number is expected to increase to 19 million by 2040.1,2 With growing numbers and substantial social and economic burden, the disease remains a major public health problem. Several developments aimed at improvement of clinical management of AMD are ongoing. New drugs are under investigation, of which many have reached phase 3: 136 clinical trials investigating new interventions for AMD are currently registered (clinicaltrial.gov).3 Another important development particularly for screening is the automated grading of retinal images using deep learning algorithms.4–6 Both developments require accurate classification systems: trials need clear criteria for inclusion with relatively high rates of outcome events, whereas automated algorithms need validation by a “ground truth.”
During the past three decades, several classification systems have been developed for clinical and epidemiologic purposes. Most characterize geographic atrophy (GA) and subretinal choroidal neovascularization (CNV) as the end stages.7,8 Drusen and pigmentary abnormalities are generally considered early stages, but severity classes of these features differ markedly between studies.9 Until now, it remained unclear how well the classification systems perform in terms of prognosis and progression to end stage AMD, and it is undetermined which system works best for what purpose.
In the prospective population-based Rotterdam Study, we compared frequently used AMD classification systems and their ability to predict the occurrence of late AMD. We subsequently evaluated the use of the systems for various applications, such as screening and clinical trials. We quantified all AMD features at baseline, categorized patients according to frequently used classification systems, and calculated incidence of late AMD per stratum in middle-aged and elderly subjects.
Methods
Ethics Statement
The Rotterdam Study was approved by the medical ethics committee of the Population Study Act, and was conducted according to the tenets of the Declaration of Helsinki. Written informed consent was obtained from each participant.
Study Design and Subjects
The study population was derived from the prospective, population-based cohort the Rotterdam study (RS), which has been described in detail elsewhere.10 This study was set up to assess determinants of age-related diseases in the general population, and consisted of three subsequent cohorts within Ommoord, a well-defined district in the city of Rotterdam, the Netherlands. The initial cohort, RS-1, which started in 1989, consisted of 7983 participants, aged 55 years and older. The second cohort, RS-2, started in 2000 and consisted of 3011 new participants, aged 55 years and older. A final cohort, RS-3, was added in 2006, which consisted of 3932 participants, aged 45 years and older. A total of 14,926 participants were included in the RS, of which 11,571 (78%) participants had eye examinations and a baseline age of 55 years and older. Reexaminations took place every 3 to 4 years, with a total of five visits available for RS-1, three visits available for RS-2, and two visits for RS-3. For the current analyses, we excluded 29 participants with nongradable fundus photographs at baseline, and 141 participants with prevalent late AMD. Further exclusion of participants with less than 1 follow-up visit resulted in a final cohort of 9066 persons at risk for incident late AMD (Supplemental Figure S1).
Ascertainment, Grading, and Classification
At the eye examinations, color fundus photographs were taken with Topcon TRV-50VT (Topcon Optical Company, Tokyo, Japan) for the first three visits and withTopcon TRC 50EX and the Sony DXC-950P digital camera (0.44 megapixel) for the remaining visits. OCT images were taken with SD-OCT (Topcon Corp., Tokyo, Japan) since 2007. Fundus autofluorescence and near infrared images were taken with Heidelberg Retina Angiograph 2 (Heidelberg Engineering, Heidelberg, Germany). Two experienced graders from the Eye-NED Reading Center graded AMD lesions on color fundus photographs after visual confirmation of the lesions on the other image modalities. Criteria for lesions were according to a modified version of the Wisconsin Age-related Maculopathy Grading System.11 AMD gradings at baseline were categorized per eye according to six classification systems (Table 2). Individuals received the grade of the worse eye. The AREDS simplified scale gives individuals a point for presence of large drusen or pigment changes in each eye, with a maximum score of 4 for both lesions present in each eye.12 The scale was analyzed as such, but also in a modified version for worse eye analysis to correspond with the other studies. Then, the maximum score was 2 for presence of both lesions.
Table 2.
Baseline AMD features per classification system
| Drusen | Pigment Changes | Late Changes | |||||||||
|---|---|---|---|---|---|---|---|---|---|---|---|
| Year | Classification System | Type | Size | Area | Hyper-pigmentation | RPE Degeneration | GA | GA sub* | CNV | Mixed | |
| 2001 | Rotterdam16 | ✓ | ✓ | x | ✓ | ✓ | ✓ | x | ✓ | ✓ | |
| 2001 | AREDS17 | x | ✓ | ✓ | ✓ | ✓ | ✓ | ✓ | ✓ | ✓ | |
| 2005 | AREDS 9-step18 | x | x | ✓ | ✓ | ✓ | x | ✓ | x | x | |
| 2005 | AREDS simplified12 | x | ✓ | x | ✓ | ✓ | x | x | x | x | |
| 2013 | Beckman19 | x | ✓ | x | ✓ | ✓ | ✓ | x | ✓ | ✓ | |
| 2014 | 3-Continent harmonization20 | x | ✓ | ✓ | ✓ | ✓ | ✓ | x | ✓ | ✓ | |
GA subspecified: classification system subspecified GA into central and noncentral GA.
Abbreviations: CNV, choroidal neovascularization; GA, geographic atrophy; mixed, mixed phenotype of both GA and CNV.
GA was considered present when a sharply delineated round or oval area of RPE atrophy (≥0.024 mm2) with apparant choroidal vessels was visible on color fundus photo, and when an additional region of hypertransmission and disappearance of RPE was visible on OCT.13,14 Choroidal neovascularization (CNV) was considered present when a subretinal or sub-RPE neovascular membrane was visible, or retinal scarring, subretinal hemorrhage, serous RPE detachment in combination with drusen and/or hard exudates were visible on color fundus photo and OCT.13
Statistical Analysis
All statistical analyses were carried out using R, version 3.5.3 (R Core Team, 2016), and SPSS Statistics, version 24.0.0.1 (IBM, Armonk, NY). Differences in baseline characteristics adjusted for age and sex were evaluated using logistic regression analysis. Incidence analyses were performed for two age strata: younger than 75 years and 75+ years at baseline. Incidence rates (IR) of late AMD were calculated as the number of incident cases per 1000 person years (py). The event of incident late AMD was assumed to have occurred halfway during the interval between two subsequent visits; this was the same for lost-to-follow-up. IR of late AMD were calculated per category of each classification system, as well as per lesion at baseline (i.e., drusen type, drusen area, hyperpigmentation, and RPE-degeneration). Cumulative incidences (CuI) of late AMD were calculated from the incidence rates with the formula CI = 1 - e(-IR x T).
To evaluate performance, receiver operating curves with area under the curve (AUC) and positive predictive values (PPV) of late AMD were computed per category of each classification system. AUCs could range from 0.5 (no prediction) to 1 (perfect prediction). The sum of AUCs from all categories within a classification system represented the overall discriminative ability for the occurrence of late AMD for that system.
Univariate Cox proportional hazards models were used to evaluate the association between baseline drusen type, drusen area, hyperpigmentation, RPE-degeneration, and incident late AMD. Hazard ratios were graphically represented by plotting log-minuslog survival function over time for age groups <75 and 75+ years. Varying logistic regression models of late AMD were used to construct AUCs. Model 1 was the simplest model, which contained age and sex as variables. Model 2 included age, sex, and presence of a drusen area of >10% within the ETDRS grid. Model 3 included age, sex, and presence of pigment changes. Model 4 included age, sex, and presence of drusen ≥ 125 µm. Model 5 included all features. We used the bootstrap method to find bootstrap optimism-corrected AUCs.
Results
Characteristics of the study population are shown in Table 1. Subjects who developed incident late AMD significantly differed from other eligibles by age, smoking status, and baseline AMD features after adjustment for age and sex. Differences for baseline characteristics between subjects in-analysis and not-in-analysis are shown in Supplemental Table S1.
Table 1.
Baseline characteristics of subjects at risk of incident late AMD
| Subjects in Analysis* (n = 9066) | |||
|---|---|---|---|
| Characteristics | Non-cases (n = 8880) | Incident Cases† (n = 186) | P |
| Age, years, mean (SD) | 65.4 (7.7) | 70.3 (7.7) | <0.0001 |
| Age, years (%) | |||
| 55-65 | 58.0 | 26.9 | <0.0001 |
| 65-75 | 28.4 | 45.1 | |
| 75-85 | 11.9 | 24.2 | |
| 85+ | 1.7 | 3.8 | |
| Gender (% male)§ | 42.4 | 41.4 | 0.740 |
| Ethnicity (%)§ | n = 7,897 | n = 173 | |
| Caucasian | 98.3 | 99.4 | 0.303 |
| Body mass index, mean (SD)§ | 26.8 | 26.4 | 0.235 |
| Hypertension (%)§ | n = 8,791 | n = 184 | |
| Present | 59.1 | 59.2 | 0.054 |
| Smoking (%)§ | n = 8,802 | n = 181 | |
| Present | 22.1 | 24.1 | 0.033 |
| Features at baseline (%)§ | |||
| Drusen ≥63 µm | 58.5 | 43.0 | <0.0001 |
| Drusen ≥125 µm | 7.7 | 48.9 | |
| Drusen area in grid >10% | 0.9 | 22.0 | |
| Hyperpigmentation | 7.4 | 31.8 | |
| RPE degeneration | 7.8 | 28.5 | |
Subjects >55 years of age, with eye examinations, gradable fundus photos, no prevalent late AMD, and at least one follow-up visit.
Subjects with incident late AMD.
Sdjusted for age and sex.
The specific AMD features included in the classification systems are shown in Table 2. Total drusen area as a feature was not included in the Rotterdam classification, the AREDS simplified scale, or the Beckman classification. Classification of drusen type was only included in the Rotterdam classification. Noncentral GA as a feature for late changes was only used in the AREDS classification and the AREDS 9-step scale.
Overall Incidence Rate of Late AMD
During a mean follow-up of 8.7 (standard deviation [SD] 5.0) years, 186 persons developed incident late AMD; 73 (39%) were diagnosed as GA, 83 (45%) as CNV, and 30 (16%) as mixed late AMD. Mean age of onset of late AMD was 77.9 (SD 7.3). RS-1 provided 145 cases (78%) of incident late AMD during mean follow-up of 9.6 (SD 5.9) years. RS-2 and RS-3 provided 28 (15%) and 13 (7%) cases during a mean follow-up of 8.6 (SD 3.0) and 5.6 (SD 0.5), respectively (Supplemental Table S2).
Given a total of 89548 py in RS1-3 and age 45+ years, the overall incidence rate of late AMD was 2.1/1000py. The 2-, 5-, and 10-year cumulative incidences were 0.4%, 1.0%, and 2.1%, respectively.
Incidence Rates of Late AMD Per Classification System
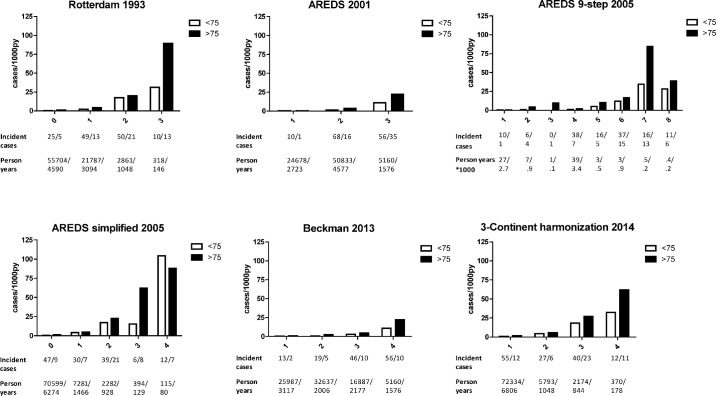
In the younger age group, incidence rates ranged from 0.4/1000 py in the lowest category to 104 cases/1000 py in the highest category. In the older age group, incidence rates similarly increased from 0.4/1000 py to 89/1000 py for the age group 75+ years. Rates increased with higher severity levels in all classifications (Fig. 1). The AREDS simplified scale showed the highest incidence rate, category 4 had a rate of 104 cases/1000 py for participants aged <75 years. The Rotterdam classification showed the highest incidence rate at category 3 with 89 cases/1000 py for participants aged 75+ years. The 3-Continent harmonization classification showed the most stable progression between categories for both age groups. Because the AREDS simplified scale uses fellow eyes, we also examined incidence rates of a modified version for single eyes (Supplemental Figure S2).
Figure 1.
Incidence rates plotted per category in various AMD classification systems. Numbers of incident cases and person years per subclass are shown below the incidence rate plots, with numbers for ages >75 years post-slash.
Cumulative Incidences of Late AMD Per Classification System
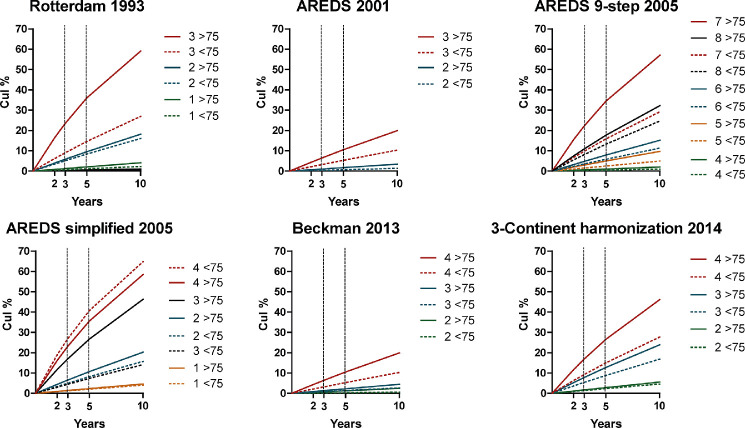
Cumulative incidences of late AMD per system are shown in Figure 2. The risk of late AMD ranged from 0.1% in the lowest category to 65% in the highest for the age group <75 years, and from 0.1% to 58% for the age group 75+ years. Rates generally increased with higher severity levels. Cumulative incidences of a modified worse-eye AREDS simplified scale are shown in Supplemental Figure S2.
Figure 2.
Cumulative incidences of late AMD per subclass and classification system at 2, 3, 5, and 10 years. Different colors represent different subclasses within a system. Subjects aged <75 years old are depicted with a dotted line.
Overall Performance Per Classification System
Systems showed similar overall ability in discriminating late AMD, with AUCs ranging from 0.759 to 0.817 (Supplemental Figure S3). The Rotterdam classification showed the highest AUC of 0.817 (95% CI: 0.781-0.852) PPV per system increased with higher category, in correspondance with results from incidence analyses (Supplemental Figure S4). The AREDS simplified scale scored the highest PPV with in the highest category 19 of 38 individuals (50%) who developed late AMD over time.
Incidence Rates and Cumulative Incidences Per Baseline AMD Feature
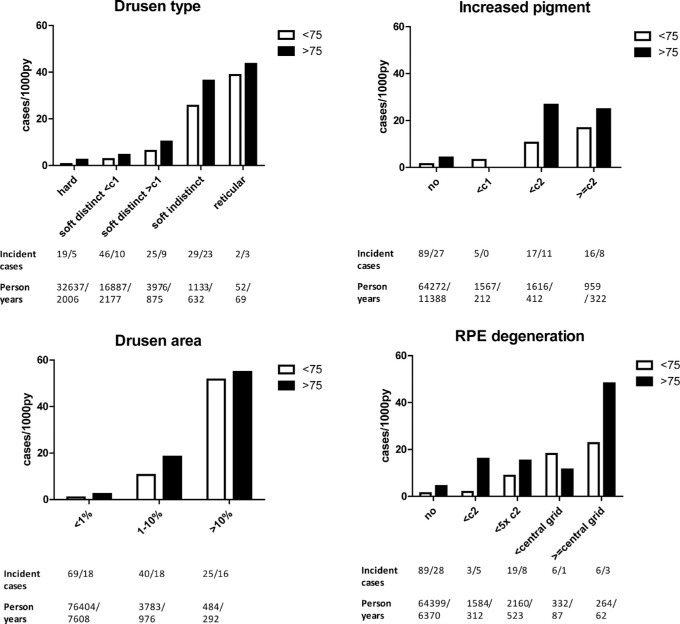
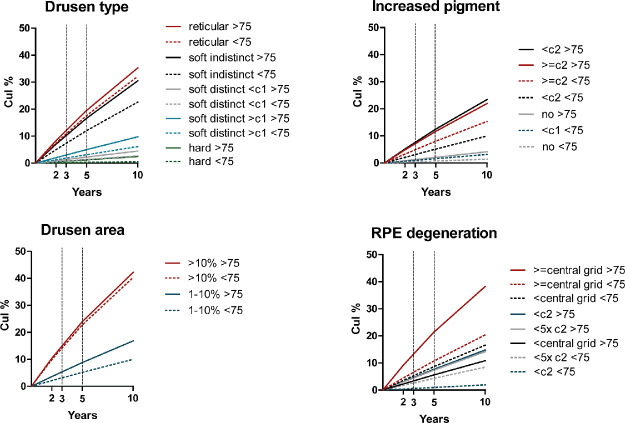
Incidence of late AMD per feature determined at baseline increased with age and with severity or size of features (Fig. 3). The highest incidence rate of late AMD, for both age groups, was found in participants with drusen areas of >10% within the ETDRS grid at baseline (incidence rate: 51.6 - 54.9 cases/1000 py). Cumulative incidences at 2, 3, 5, and 10 years are shown in Figure 4.
Figure 3.
Incidence rates of late AMD per feature. Incident cases and person years are shown below the plots, ages >75 post-slash.
Figure 4.
Cumulative incidence of late AMD per feature determined at baseline. Subjects aged <75 years old are depicted with a dotted line.
Survival Analysis
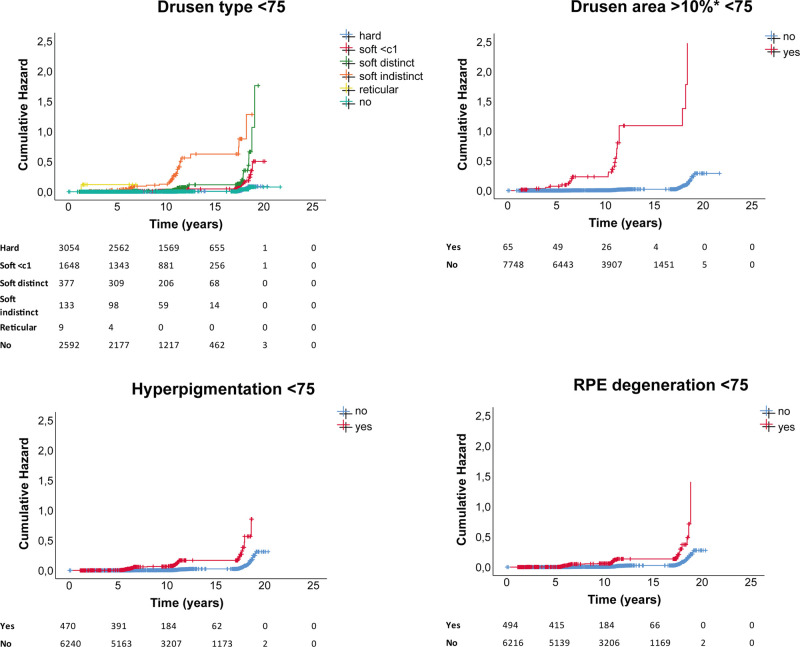
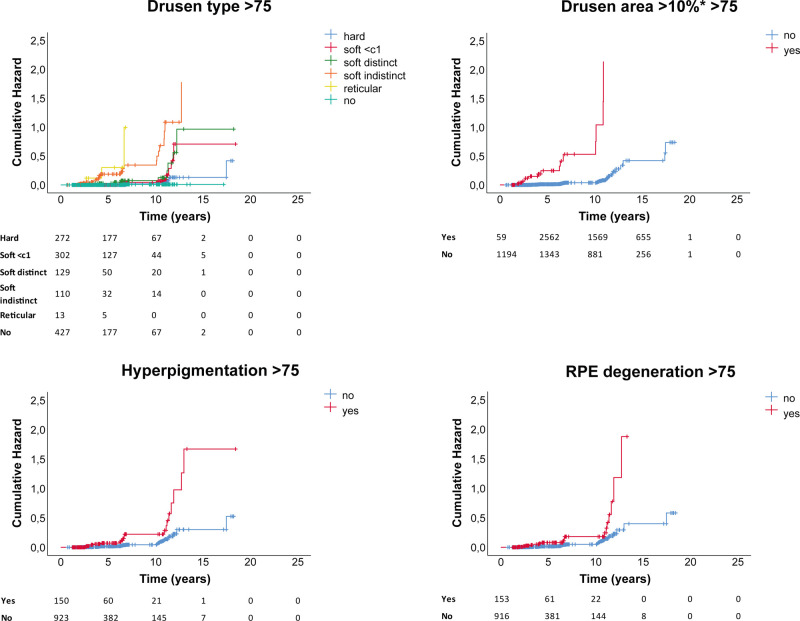
Drusen type, drusen area ≥10% in ETDRS grid, hyperpigmentation, and RPE degeneration all showed a significantly increased hazard for late AMD, independent of age group. Presence of drusen area ≥10% in ETDRS grid showed the highest cumulative hazard (hazard ratio [HR] 30.05, 95% confidence interval [CI]) 19.25–46.91; P < 2e-16). HRs for all baseline features are shown in Supplemental Table S3. Corresponding cumulative hazard plots for ages <75 are shown in Figure 5, for ages group >75 in Figure 6.
Figure 5.
Cumulative hazard plots per AMD baseline feature for ages <75 years, with number at risk per group shown below plots.
Figure 6.
Cumulative hazard plots per AMD baseline feature for ages >75 years, with number at risk per group shown below plots.
Discriminative Ability
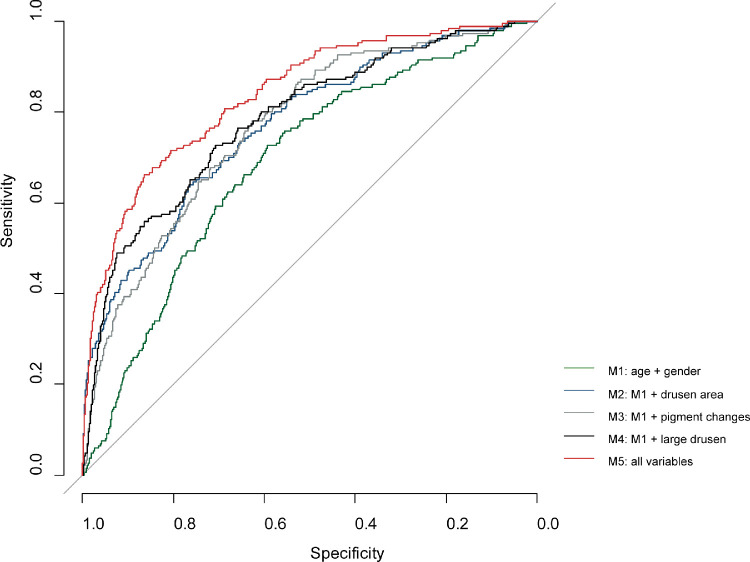
Discriminative ability for incident late AMD increased from AUC 0.6866 (95% CI: 0.6500 – 0.7232) for the simplest model (model 1), which included only age and sex, to AUC 0.8372 (95% CI: 0.8070-0.8673) for model 5, which included age, sex, drusen area ≥10% in the ETDRS grid, pigment changes, and drusen ≥ 125µm (Fig. 7). Other models that included age, sex, and either drusen area/pigment changes/large drusen showed comparable, but lower discriminative ability. AUCs and corresponding CIs are shown in Supplemental Table S4.
Figure 7.
ROC curve of various prediction models of incident late AMD. M1 = age + sex; M2 = age + sex + drusen area ≥10% in the ETDRS grid; M3 = age + sex + pigment changes; M4 = age + sex + drusen size ≥ 125 µm; M5 = age + sex + drusen area ≥10% in the ETDRS grid + pigment changes + drusen ≥ 125 µm.
Discussion
We compared the prediction of late AMD by several frequently used classification systems in the large, longrunning, prospective population-based Rotterdam Study. Here, 186 of 9066 (2.1%) individuals aged 55+ years developed late AMD with a mean age of onset of 77.9 years. Risk of late AMD increased with higher categories and age in most systems. The AREDS simplified classification and the Rotterdam classification both had high-risk categories that predicted a high turnover from intermediate to late AMD, whereas the 3-Continent harmonization classification showed the most stable progression across all its categories. We confirmed that features such as drusen area and pigment changes increase disease progression, and show that prediction of late AMD is improved by combining all early and intermediate AMD features.
Various classification systems for AMD lesions have been published during the past 30 years. In the early 1990s, the Wisconsin age-related maculopathy grading system set the tone for the diagnostic criteria of individual AMD lesions in a macular grid with subfields and standard circles to assess size and area. This was followed by an international consensus on AMD lesions by the International Age-Related Maculopathy Epidemiological Study Group.13,15 As these systems lacked a severity scale, a classification system addressing this was established by the Rotterdam Study Group in 2001.16 The AREDS Study proposed multiple classication systems, of which the first system was published in 2001, classifying referable patients for AREDS supplements. Several years later, two systems were added by this study group for clinical and research purposes (i.e., a simplified scale and a 9-step severity scale, respectively).12,17,18 More recently, a clinical classification was published by the Beckman initiative group in 2013, and an AMD severity scale quantifying lesions by the 3CC study in 2014, which harmonized grading of the Rotterdam Study, the Beaver Dam Eye Study, the Los Angeles Latino Eye study, and the Blue Mountain Eye Study.19,20
Our results point out the potential advantages and disadvantages of these classification systems. Although all systems are based on color fundus photographs, they vary in their stratification of graded features. As purposes for classifiying disease may differ between potential stakeholders (i.e., ophthalmologists, optometrists, researchers, and engineers), we evaluated classification systems according to possible goals of screening, automated grading, and clinical trials (i.e., ability to find high event rates as well as stable progression rates of late AMD; Supplemental Table S5). For screening and referals, systems should be quick and easy to interpret. The AREDS simplified scale seems appropriate in this regard with limited and easily identifiable features (i.e., presence of large drusen and pigment changes). The Beckman classification is similar, but also classifies drusen according to size in small, intermediate, and large drusen, which may still be feasible for screening. This system, however, did not reveal high progression rates in any of the categories. For intervention studies focusing on early and intermediate AMD, systems should include categories with a high turnover rate to late AMD. Both the AREDS simplified scale and the Rotterdam Study had such categories.
More elaborate analyses of risk prediction require detailed phenotyping and systems that are able to find a stable progression rate between categories. The AREDS 9-step scale has great detail in grading of drusen areas and RPE-degeneration, allowing for many categories. Category 7, however, produced an event rate that was substantially higher than subsequent levels. This contrasts earlier findings, which showed stable progression and a rising incidence of late AMD.18 The 3-Continent harmonization, which quantifies drusen area, was the only system in which progression was consistent with a continuous increasing risk of late AMD.
Artificial intelligence systems for classification of AMD generally need a well-defined “ground truth” or reference standard to demonstrate their performance. Algorithms can be made using any of the classification systems, and the choice depends on the needs of the user. Nevertheless, we show here that all features of early and intermediate AMD, type of drusen, drusen area, and presence of pigmentary changes contribute to late AMD prediction. Algorithms that detect and quantify all individual lesions are more likely to be useful for a wide variety of purposes, and be more precise in risk-analyses of future events. Currently available automated grading systems mostly focus on classification of disease or on a referral stage, making these systems inflexible. Hence, more in-depth development of lesion level algorithms is needed.
This study has strengths and limitations. Our study period was lengthy, but as AMD develops in older persons, the mean total follow-up time was less than a decade because of mortality. Another point of discussion is that while we graded individual lesions after viewing all image modalities, the classification systems were based on color fundus photographs only; multimodal classification systems have not been published yet. Except for age, effects of other known demographic, environmental, and genetic risk factors were not included in the analyses as this was outside the scope of this study. However, incorporation of these factors would increase prediction of late AMD. To date, only one earlier study addressed performance of classification systems, and also showed higher prevalences of early and intermediate AMD in the 3-harmonization classification as compared to the Beckman clinical classification.21 This study underlined the need to clarify the use and purpose of the different systems.
In summary, we compared incidence of late AMD in various classification systems and propagate that each has its advantages and disadvantages. Our results will help researchers and clinicians select appropriate classification systems for applications such as screening or intervention studies.
Supplementary Material
Acknowledgments
The authors thank the members of the EyeNED Reading Center, in particular Ada Hooghart and Corina Brussee, for their efforts in data collection and grading of images. We additionally thank Timo Verzijden for his efforts in data organization and storage. The authors are grateful to the study participants, the staff from the Rotterdam Study, and the participating general practitioners and pharmacists.
The Rotterdam Study is funded by Erasmus Medical Center and Erasmus University, Rotterdam, Netherlands Organization for the Health Research and Development (ZonMw), the Research Institute for Diseases in the Elderly (RIDE), the Ministry of Education, Culture and Science, the Ministry for Health, Welfare and Sports, the European Commission (DG XII), and the Municipality of Rotterdam. Additionally, the ophthalmic research within the Rotterdam Study was supported by the following foundations: MaculaFonds, Oogfonds, and Landelijkse Stichting voor Blinden en Slechtzienden that contributed through Uitzicht (grant 2018-34), Royal Dutch Academy of Sciences (Ammodo Award to C.C.W. Klaver), and the European Union's Horizon 2020 research and innovation programme (grant no.:634479; EYE-RISK).
Disclosure: E.F. Thee, None; M.A. Meester-Smoor, None; D.T. Luttikhuizen, None; J.M. Colijn, None; C.A. Enthoven, None; A.E.G. Haarman, None; D. Rizopoulos, None; C.C.W. Klaver, Théa Pharma (C, R), Bayer (F, C)
Appendix
EyeNED Reading Center
Corina Brussee1,2, Johanna Colijn1,2, Amal Hamimida1,2, Ada Hooghart1,2, Caroline Klaver1,2,4, Bart Liefers3, Daniel Luttikhuizen1, Magda Meester1,2, Clarisa Sanchez3, Eric Thee1,2, Timo Verzijden1,2, Harm van Zeeland3
1Department of Ophthalmology, Erasmus University Medical Center, Rotterdam, The Netherlands
2Department of Epidemiology, Erasmus University Medical Center, Rotterdam, The Netherlands
3Department of Radiology and Nuclear Medicine, Radboudumc, Nijmegen, The Netherlands
4Department of Ophthalmology, Donders Institute for Brain, Cognition and Behaviour, Radboud University Medical Center, Nijmegen, The Netherlands
References
- 1. Bourne RR, Jonas JB, Flaxman SR, et al.. Prevalence and causes of vision loss in high-income countries and in Eastern and Central Europe: 1990-2010. Br J Ophthalmol. 2014; 98: 629–638. [DOI] [PubMed] [Google Scholar]
- 2. Wong WL, Su X, Li X, et al.. Global prevalence of age-related macular degeneration and disease burden projection for 2020 and 2040: a systematic review and meta-analysis. Lancet Glob Health. 2014; 2: e106–116. [DOI] [PubMed] [Google Scholar]
- 3. Group CR, Martin DF, Maguire MG, et al.. Ranibizumab and bevacizumab for neovascular age-related macular degeneration. N Engl J Med. 2011; 364: 1897–1908. [DOI] [PMC free article] [PubMed] [Google Scholar]
- 4. Schmidt-Erfurth U, Sadeghipour A, Gerendas BS, Waldstein SM, Bogunovic H. Artificial intelligence in retina. Prog Retin Eye Res. 2018; 67: 1–29. [DOI] [PubMed] [Google Scholar]
- 5. Kapoor R, Walters SP, Al-Aswad LA. The current state of artificial intelligence in ophthalmology. Surv Ophthalmol. 2019; 64: 233–240. [DOI] [PubMed] [Google Scholar]
- 6. Ting DSW, Peng L, Varadarajan AV, et al.. Deep learning in ophthalmology: the technical and clinical considerations. Prog Retin Eye Res. 2019; 72: 100759. [DOI] [PubMed] [Google Scholar]
- 7. de Jong PT. Age-related macular degeneration. N Engl J Med. 2006; 355: 1474–1485. [DOI] [PubMed] [Google Scholar]
- 8. Campochiaro PA, Soloway P, Ryan SJ, Miller JW. The pathogenesis of choroidal neovascularization in patients with age-related macular degeneration. Mol Vis. 1999; 5: 34. [PubMed] [Google Scholar]
- 9. Khan KN, Mahroo OA, Khan RS, et al.. Differentiating drusen: Drusen and drusen-like appearances associated with ageing, age-related macular degeneration, inherited eye disease and other pathological processes. Prog Retin Eye Res. 2016; 53: 70–106. [DOI] [PubMed] [Google Scholar]
- 10. Ikram MA, Brusselle GGO, Murad SD, et al.. The Rotterdam Study: 2018 update on objectives, design and main results. Eur J Epidemiol. 2017; 32: 807–850. [DOI] [PMC free article] [PubMed] [Google Scholar]
- 11. Gattoussi S, Buitendijk GHS, Peto T, et al.. The European Eye Epidemiology spectral-domain optical coherence tomography classification of macular diseases for epidemiological studies. Acta Ophthalmol. 2019; 97: 364–371. [DOI] [PubMed] [Google Scholar]
- 12. Ferris FL, Davis MD, Clemons TE, et al.. A simplified severity scale for age-related macular degeneration: AREDS Report No. 18. Arch Ophthalmol. 2005; 123: 1570–1574. [DOI] [PMC free article] [PubMed] [Google Scholar]
- 13. Bird AC, Bressler NM, Bressler SB, et al.. An International Classification and Grading System for age-related maculopathy and age-related macular degeneration. SurvOphthalmol. 1995; 39: 367–374. [DOI] [PubMed] [Google Scholar]
- 14. Sadda SR, Guymer R, Holz FG, et al.. Consensus definition for atrophy associated with age-related macular degeneration on OCT: classification of Atrophy Report 3. Ophthalmology. 2018; 125: 537–548. [DOI] [PMC free article] [PubMed] [Google Scholar]
- 15. Klein R, Davis MD, Magli YL, Segal P, Klein BE, Hubbard L. The Wisconsin age-related maculopathy grading system. Ophthalmology. 1991; 98: 1128–1134. [DOI] [PubMed] [Google Scholar]
- 16. Klaver CC, Assink JJ, van Leeuwen R, et al.. Incidence and progression rates of age-related maculopathy: the Rotterdam Study. Invest Ophthalmol Vis Sci. 2001; 42: 2237–2241. [PubMed] [Google Scholar]
- 17. Age-Related Eye Disease Study Research G. The Age-Related Eye Disease Study system for classifying age-related macular degeneration from stereoscopic color fundus photographs: the Age-Related Eye Disease Study Report Number 6. Am J Ophthalmol. 2001; 132: 668–681. [DOI] [PubMed] [Google Scholar]
- 18. Davis MD, Gangnon RE, Lee LY, et al.. The Age-Related Eye Disease Study severity scale for age-related macular degeneration: AREDS Report No. 17. Arch Ophthalmol. 2005; 123: 1484–1498. [DOI] [PMC free article] [PubMed] [Google Scholar]
- 19. Ferris FL 3rd Wilkinson CP, Bird A, et al.. Clinical classification of age-related macular degeneration. Ophthalmology. 2013; 120: 844–851. [DOI] [PMC free article] [PubMed] [Google Scholar]
- 20. Klein R, Meuer SM, Myers CE, et al.. Harmonizing the classification of age-related macular degeneration in the three-continent AMD consortium. Ophthalmic Epidemiol. 2014; 21: 14–23. [DOI] [PMC free article] [PubMed] [Google Scholar]
- 21. Brandl C, Zimmermann ME, Gunther F, et al.. On the impact of different approaches to classify age-related macular degeneration: results from the German AugUR study. Sci Rep. 2018; 8: 8675. [DOI] [PMC free article] [PubMed] [Google Scholar]
Associated Data
This section collects any data citations, data availability statements, or supplementary materials included in this article.


