

Abstract
Purpose
To build and validate artificial intelligence (AI)-based models for AMD screening and for predicting late dry and wet AMD progression within 1 and 2 years.
Methods
The dataset of the Age-related Eye Disease Study (AREDS) was used to train and validate our prediction model. External validation was performed on the Nutritional AMD Treatment-2 (NAT-2) study.
First Step
An ensemble of deep learning screening methods was trained and validated on 116,875 color fundus photos from 4139 participants in the AREDS study to classify them as no, early, intermediate, or advanced AMD and further stratified them along the AREDS 12 level severity scale. Second step: the resulting AMD scores were combined with sociodemographic clinical data and other automatically extracted imaging data by a logistic model tree machine learning technique to predict risk for progression to late AMD within 1 or 2 years, with training and validation performed on 923 AREDS participants who progressed within 2 years, 901 who progressed within 1 year, and 2840 who did not progress within 2 years. For those found at risk of progression to late AMD, we further predicted the type (dry or wet) of the progression of late AMD.
Results
For identification of early/none vs. intermediate/late (i.e., referral level) AMD, we achieved 99.2% accuracy. The prediction model for a 2-year incident late AMD (any) achieved 86.36% accuracy, with 66.88% for late dry and 67.15% for late wet AMD. For the NAT-2 dataset, the 2-year late AMD prediction accuracy was 84%.
Conclusions
Validated color fundus photo-based models for AMD screening and risk prediction for late AMD are now ready for clinical testing and potential telemedical deployment.
Translational Relevance
Noninvasive, highly accurate, and fast AI methods to screen for referral level AMD and to predict late AMD progression offer significant potential improvements in our care of this prevalent blinding disease.
Keywords: deep learning, AMD prediction, dry AMD, wet AMD
Introduction
Age-related macular degeneration (AMD) is the leading cause of vision loss in those older than age 50 years in the developed world.1–5 The number of people with AMD is expected to increase 1.5-fold over 10 years because of our aging population, hypertension, and other causes.6,7 At present, there is no treatment for late dry AMD (geographic atrophy).8,9 Although treatment with antivascular endothelial growth factor is often effective in maintaining or improving vision in the neovascular form of advanced AMD (i.e., wet AMD), it does not provide a cure. It is also often too late to mediate the issue by the time a person visits an ophthalmologist as the treatment cannot regenerate the vision.10,11 Further, such treatments are costly (typically costs about $9000–$65,000 for one eye, depending on which drug is used, for a 2-year course of treatment 12) and may be associated with significant cardiovascular risks 13 or even development of GA.14 Although the total (direct and indirect) cost of AMD is $225 billion per year15 and is expected to increase (AMD cases will be increased2), the indirect cost is even greater due to injury, depression, and social dependency resulting from blindness.16
The Age-Related Eye Disease Study (AREDS), the largest AMD study, showed that specific antioxidants and vitamin supplementation (called AREDS supplements) reduce the risk of progression from intermediate-stage AMD to late AMD that can allow for preventive strategies.17 Approximately 7.6% of the United States population over the age of 60 is estimated to have advanced or intermediate AMD.18 Recent publications looking at the 10-year experiences of appropriately selected patients taking the AREDS formulation demonstrates that it is effective at slowing disease and improving visual acuity in approximately 25% of patients.19 For this reason, identification of people at risk for late AMD is very important because it could enable timely treatment such as photobiomodulation20 and laser intervention21) and AREDS supplements. Recent studies21 showed that sub-threshold laser (or sub-threshold nanosecond laser) reduces the progression of intermediate AMD except in the case of reticular pseudo-drusen (RPD), in which case it worsens.
Motivated by this need, we reviewed the early screening of AMD and the prediction of AMD progression, which are a necessity to prevent late AMD. We found that:
-
•
Systems have been built from existing datasets for automatic AMD screening/prediction, but none are ready for clinical deployment
-
•
No method includes RPD.22 RPD double the risk of progression to advanced wet AMD over soft drusen alone.22,23
-
•
No method has been proposed for telemedicine-based automated AMD screening in remote/underserved areas.
Our review found prediction models24,25 based on manual evaluations of drusen and pigment abnormalities that achieved 75.6% accuracy for 10-year-time (in contrast, our fully automated prediction model herein achieved 86.36% accuracy). AREDS report 826 showed on a population basis that for subjects aged 55 to 80 years followed 6.3 years, treatment with antioxidants plus zinc yielded a significant odds reduction for the development of advanced AMD compared with placebo. Genetic, ocular variables (manual analysis of fundus image), and sociodemographic parameter-based prediction of late AMD is reported in,27,28 and recently improved with additional genetic modeling. A number of AMD screening methods have been reported elsewhere,29–32 which can only determine the disease status, not predict late AMD. For example, Grassmann et al.31 reported an ensemble deep learning-based classifier of 12 different AREDS categories based on pathology, but not a predictor. We have first proposed a fully automated late AMD prediction model, which was presented at ARVO 2018.33 Recently, Burlina et al. proposed a deep learning (DL)-based model34 for 5-year late AMD progression but did not demonstrate the late dry and late wet AMD prediction. However, in Burlina et al., one DL model essentially performs image classification by the AREDS nine-step severity scale, as in Grassman et al., and then relies on the published AREDS probabilities for progression at 5 years, rather than AI, to calculate progression risks. An alternate DL model, with regression directly from the image to risk prediction, as we propose here, had poorer overall performance than those that rely on the AREDS statistics. Our model is more complex and finely tuned than any of those, exploiting both DL for classification and machine learning for prediction as well as other retinal and demographic factors. In addition, we include in our training data abrupt transitions (early to late AMD in 1–2 years), and also predict late dry and wet AMD, which is unique.
Here, we propose the first color fundus photo-based noninvasive screening and prediction model for late AMD for the 1- or 2-year incident with dry and wet form categorization. It is novel in many respects: different input sizes for neural network architectures for learning scale variant and invariant image features; a logistic model tree35 for building a final classifier after assembling different deep learning models, which is a new approach in retinal image classification also proposed by Grassmann et al; a single value risk of conversion produced from the 12-point AMD severity scale36 utilizing deep convolution neural networks.
The proposed noninvasive technology will identify higher volumes of at-risk patients and determine whether an individual, including early AMD subjects, will develop late AMD in 1 to 2 years and should be referred to an ophthalmologist (Schematic for the overall screening and prediction of late AMD, Figure 1). AREDS Report 1737 mentioned, and we confirmed, that in AREDS, 36 subjects converted from early to late AMD within a year, and 50 within 2 years. Using the prediction score, the ophthalmologist can perform further testing and/or have higher confidence about immediate treatment (e.g., photobiomodulation20 or laser intervention 21) or advise more frequent follow-up visits.
Figure 1.
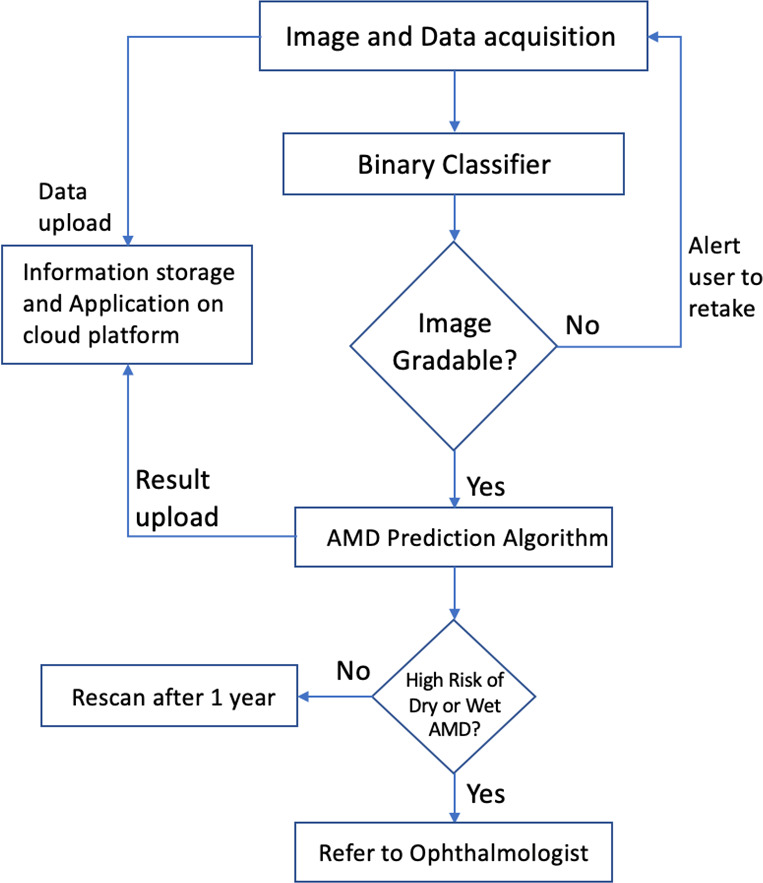
High-level flow chart for the overall screening and prediction of late AMD.
Methods
The model works in two steps. The first step is the screening or early diagnostic step (screening module). The second step is for predicting the individual's progression from intermediate to late AMD (prediction module).
The Datasets
AREDS is a major clinical trial sponsored by the National Eye Institute. AREDS participants were 55 to 80 years old at enrollment, and they had to be free of any illness or condition that would make a long-term follow-up or compliance with study medications unlikely. Based on fundus photographs graded by a central reading center, the best-corrected visual acuity, and ophthalmologic evaluations, 4753 participants were enrolled in one of several AMD categories, including persons with no AMD. Subjects were randomly assigned to the vitamins and mineral supplements and placebo groups. A complete description of the AREDS dataset can be found in.1 Table 1 and Supplementary Table S14 show the number of subjects in each category and demographic group and the distribution of baseline characteristics.
Table 1.
AREDS Data Distribution Within the Significant Parameters
| N | % | ||
|---|---|---|---|
| Age-related macular degeneration (AMD) category | 1 (no-AMD) | 1116 | 23.5 |
| 2 (early AMD) | 1060 | 22.3 | |
| 3 (intermediate AMD) | 1620 | 34.1 | |
| 4 (late AMD) | 957 | 20.1 | |
| Age | <65 | 1000 | 21 |
| 65–69 | 1577 | 33.2 | |
| ≥70 | 2176 | 45.8 | |
| Sex | Female | 2655 | 55.9 |
| Male | 2098 | 44.1 | |
| Education | High school or less | 1705 | 35.9 |
| Some college | 1409 | 29.7 | |
| College graduate | 1636 | 34.4 | |
| Race | Non-white | 207 | 4.4 |
| White | 4546 | 95.6 | |
| Smoking status | Never | 2105 | 44.3 |
| Former | 2273 | 47.8 | |
| Current | 375 | 7.9 | |
| Body mass index | <24.9 | 1550 | 32.6 |
| 25-29.9 | 1984 | 41.8 | |
| ≥30 | 1216 | 25.6 | |
| Hypertension | Normal | 2869 | 60.4 |
| Controlled | 1177 | 24.8 | |
| Uncontrolled and treated | 346 | 7.3 | |
| Uncontrolled and untreated | 361 | 7.6 | |
| Diabetes | No | 4357 | 91.7 |
| Yes | 396 | 8.3 |
AREDS participants were assigned to four categories38 based on the size and extent of drusen and other AMD lesions: normal, early, intermediate, and advanced or late AMD. These assignments were made for the left and right eyes individually.
Deidentified AREDS data was used in this study and was approved by the National Eye Institute Data Access Committee, National Institute of Health.
The NAT-2 study4 was a randomized, placebo-controlled, double-blind, parallel, comparative study of 263 patients with early lesions of age-related maculopathy and visual acuity better than 0.4 LogMAR units in the study eye and neovascular AMD in the fellow eye. Patients were randomly assigned to receive either 840 mg/day DHA and 270 mg/day eicosapentaenoic acid from fish oil capsules or the placebo (olive oil capsules) for 3 years. Study evaluations included periodic color fundus photos and other retinal imaging. The NAT-2 dataset was used with the permission of the sponsor (Bausch and Lomb) and the principal investigator (Dr. Souied). These data were used for external evaluation only after the AI models were built and validated on the AREDS data.
For screening, 116,875 color fundus images belonging to 4139 subjects classified as gradable in AREDS were selected. Each patient was assigned either to the training set (80% of the patients), validation set (12% of the patients), or testing set (8% of the patients), and all fundus images from each patient were included in the respective dataset. Thus, the training, validation, and testing data sets consisted of 93,380, 14,020, and 9475 fundus images, respectively. Because the training, validation, and testing groups were first separated by patient, this ensured that there was no mixing of photographs from the same patient between the photographic datasets.
For prediction, we formed the dataset with images and demographic data from 901 subjects with incident late AMD in 1 year from baseline; 923 subjects with incident late AMD in 2 years from baseline and 2840 subjects without incident late AMD over the entire study.
Training and validation data for the 2-year model consisted of 2634 subjects, 1988 nonconverted and 646 converted at 2 years; test data consisted of the other 852 nonconverted, and the other 277 converted at 2 years, a total of 1129 subjects. This gave a ratio of approximately 70:30 for training/validation to test data. We chose this ratio, higher than the usual 80:20, to provide an adequate size test set from the smaller number of converters. The fundus photos for each dataset consisted of all baseline photos for the subjects in each group.
Training and validation data for the 1-year model consisted of 2619 subjects, 1988 nonconverted and 631 converted at 1 year. Test data consisted of the other 852 nonconverted and the other 270 converted at 1 year, a total of 1122 subjects, likewise also an approximate ratio of 70:30 for training/validation to test data. (Table 2).
Table 2.
AREDS Dataset Organization for Late AMD Prediction in Module 2
| Prediction | Type of Late | No. of Subjects | No. of Subjects | Total |
|---|---|---|---|---|
| Model | AMD Incident | for Training | for Testing | Subjects |
| 1-Year | Any | 631 | 270 | 901 |
| Wet | 328 | 140 | 468 | |
| Dry | 248 | 107 | 355 | |
| Nonconverted | 1988 | 852 | 2840 | |
| 2-Year | Any | 646 | 277 | 923 |
| Wet | 329 | 140 | 469 | |
| Dry | 249 | 107 | 356 | |
| Nonconverted | 1988 | 852 | 2840 |
Our proposed late AMD prediction model works in two core modules: (A) the screening module and (2) the prediction module, which are summarized here.
The Screening Module and AMD 12-Category Classification
Initially, the color channel transformation from RGB to CIE L*a*b is applied to generate perceptually uniform color space. The first module, preceded by a deep learning-based binary classifier that verifies image gradeability, is an ensemble, or combination, of deep learning AMD classifiers to define the exact stage of AMD present (no AMD, early AMD, intermediate AMD, and late AMD), which we developed earlier.30,32 This model is an ensemble of five networks of different input sizes of “Inception-V3” proposed by Szegedy et al.,39 “Inception-Resnet-V2” proposed by Szegedy et al.,40 and “Xception” proposed by Chollet 41 as described in our paper. We use this categorical information as an input to the prediction model.
There is also an AREDS 12-class severity scale-based classifier, of which the first 9 classes are early to intermediate AMD, and the last three are late AMD. The first nine classes 36 confer a validated risk of AMD progression, ranging from about 2% for level 1 to about 50% for level 9 in 5 years, but in practice, it is too cumbersome for routine manual grading. Thus, our ensemble deep learning classifier now additionally assigns probabilities that an image falls within each of these 12 classes,36 and specifically for images without advanced AMD, the probabilities of where the image falls within the first nine classes36 are used in the prediction model. This system consists of an ensemble of six neural networks, each differing from the other with respect to the combination of input image size and the network architecture. The six networks are: Xception network with input size 499 × 499, Inception-Resnet-V2 network with size 399 × 399, Xception network with size 299 × 299, Inception-V3 network with input size 599 × 599, Inception-V3 with input size 399 × 399, and NasNet network (proposed by Zoph et al.42) with input size 399 × 399. Each network is trained to classify fundus images into 12 classes, giving an array of 12 probabilities, one for each class. These 12 classes are an amalgamation of 9-point AREDS-defined AMD severity levels and the three late AMD classes, dry, wet, and combined dry and wet AMD. This results in 72 probability values from six networks (6 × 12) that are used as the input to the prediction module. Supplementary Table S1 (online supplement) shows the number of color fundus photos with AREDS 12-class severity cases employed to train and validate this ensemble deep convolution neural network and logistic model tree with the approach described in.32
The Prediction Module: A Logistic Model Tree
The second module is a machine learning algorithm that predicts if an individual with early or intermediate AMD will progress to late AMD within 1 or 2 years, based on the output of the first module and other imaging and demographic factors, In AREDS, 36 subjects with “early AMD” converted to late AMD within a year, and 50 more within 2 years. Therefore, we also used these early-stage AMD to build the prediction model. We built this model on images of individuals who did (923 for 2 years, 901 for 1 year), or did not (2840), convert (severity class 10, 11, and 12) in the next 1 or 2 years. Figure 3 shows fundus images of three subjects affected by intermediate AMD at baseline and who later converted to late AMD at an incident visit. Figure 3 also shows heatmaps of the retina of both visits generated by our classifier for the probability of AMD. The most active part of the image for the deep learning decision is mapped, and a schematic diagram is produced. The procedure of heatmap generation can be obtained elsewhere.43
Figure 3.
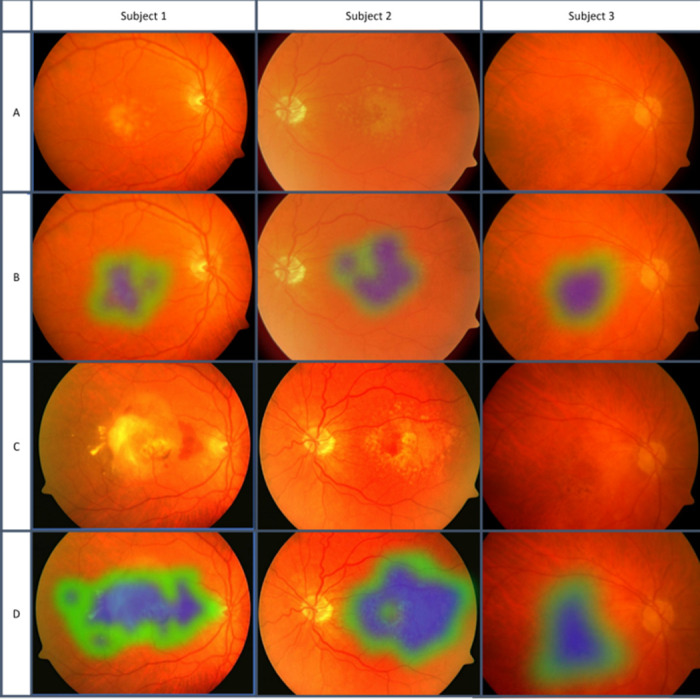
Fundus images of three subjects at baseline and late AMD incident visits, with heatmaps of AMD signs. Blue color, strong signs of AMD detected by our classifier. Green color, weaker signs of AMD. No signs of AMD were detected in the non-mapped portion of the images. Row A, baseline visit fundus photos. Row B, baseline heatmaps showing signs of early AMD. Row C, incident visit fundus photos showing late AMD. Row D, incident heatmaps showing much larger areas and signs of late AMD.
On developing the prediction model, we tested the Bayesian model,44 Support Vector Machines, decision tree, Random Forest,45 and Logistic Model Tree (LMT) for prediction accuracy, and found that the LMT 35 performed best. A logistic model tree is a classification model with an associated supervised training algorithm that combines logistic regression and decision tree learning.35 Logistic model trees are based on the earlier idea of a model tree: a decision tree that has linear regression models at its leaves to provide a piecewise linear regression model. The LMT was then augmented with other inputs.
Drusen Quantification and RPD Inputs
We also separately and automatically quantified total drusen area and number larger than 125 µ as inputs to build the prediction model. The method, described elsewhere,46 showed 73% sensitivity and 99% specificity compared with three expert clinician manual segmentations. We applied the same ensemble model for categorizing RPD as none, questionable, or present, in and out of the 6000-µ circle, as defined by the International Classification and Grading System for AMD.47 Compared with image gradings by the AREDS study group, we achieved 96% accuracy in these RPD categorizations. We used this information along with the nine-class probability score generated based on the AREDS dataset to the final prediction model.
AMD Category and Demographic Input
In addition to AREDS scale from the ensemble method32 and drusen information, we also included AMD category: none, early, intermediate, or late from our early DL classifier, and demographic factors such as age, race, sex, diabetes, body mass index, visual acuity, and sunlight exposure. A Cox proportional hazards model48 was used to obtain the importance of the sociodemographic parameters on the whole training set, and beta coefficients were taken for each parameter to select the nine significant ones: gender, age, smoking status, diabetes, body mass index, blood pressure, sunlight exposure, visual acuity, and AMD in the other eye.
In summary, an ensemble of six deep convolution neural network models were each applied to generate 12-step AMD severity level probabilities (72 parameters). To these were added the drusen inputs, AMD category (four stages) and the nine significant demographic factors just reviewed. A three-class LMT model was built from these data to predict the conversion to late AMD in 1 or 2 years, or no conversion. 1Figure 23 shows the flow chart for late AMD prediction.
Figure 2.
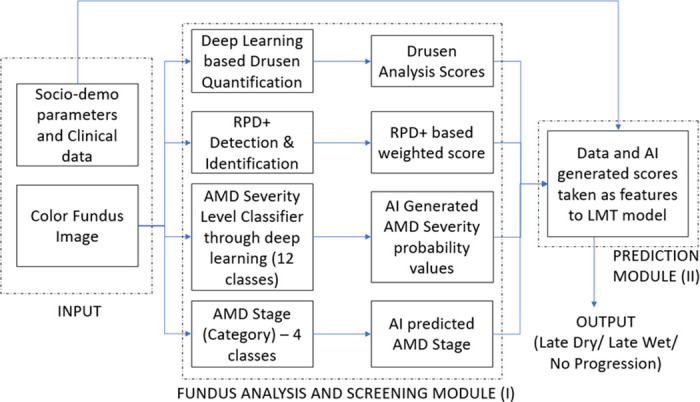
Flow chart for the late AMD prediction system. Input: The input parameters; module I: screening module (center) through several deep learning steps for none, early, and intermediate AMD; Module II: predict the progression to late AMD as well as late dry AMD or late wet AMD or no progression (in 1 or 2 years).
The subjects’ treatment categories were also used to build the prediction models. In the AREDS study, there are four treatment categories: placebo, zinc, antioxidants, and zinc + antioxidants.38 We considered this information to categorize the subjects for the development and validation of the models.
Ten-fold cross-validation method49 was applied for training the model, which is a standard method for the machine learning technique. Including RPD presence/absence did not yield any improvement in the prediction score, perhaps because there were only 27 subjects with RPD in our AREDS dataset, 20 subjects who progressed vs. seven who did not.
Once we determine that someone is at risk of progressing to late AMD, the next step is to specify the probability of progression to late dry or wet AMD (Figure 4).
Figure 4.
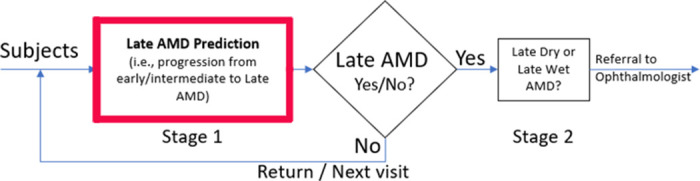
Extension of module II in Figure 2: the AMD prediction problem tackled as a two-stage problem, first establishing the risk of general late AMD and second the type of AMD progression.
Dry and Wet AMD Prediction
Prediction of progression to dry or wet AMD at 1 or 2 years required two additional models, one for each time period. Thus, once AMD progression (any type) was predicted by the first LMT at 1 or 2 years, an additional two-class logistic model tree was built for each time period, to predict dry or wet AMD, To build these models, we restricted the data to the known converters, both dry and wet, at 1 and 2 years. Converters who demonstrated both dry and wet advanced AMD at the point of conversion were omitted. For the 1-year model, we had 328 incident late wet AMD and 248 incident late dry AMD subjects for training and 140 incident late wet AMD and 107 incident late dry AMD for testing the model. For the 2-year model, we had 329 incident late wet AMD and 249 incident late dry AMD subjects for training and 140 incident late wet AMD and 107 incident late dry AMD for testing the model. Table 2 shows the details. The models for 1-year and 2-year converters were trained on exactly the same imaging and demographic input data as the main LMT, but now to identify risk for the two specific AMD types. This method of tackling the prediction problem in two stages is shown in Figure 4, wherein, the risks of converting to either form (dry or wet) of late AMD are separated in the second stage.
We also modeled 5- and 10-year late AMD progression with 871 and 916 late AMD converters, respectively, and tested the models on 185 incident and 189 incident late AMD converters, respectively. We did not separate dry and wet cases. The datasets for each of the late AMD prediction models are organized as Table 2.
For the prediction of late wet and dry AMD, we also experimented with deep learning models’ performance alone if we did not provide specific retinal features such as drusen area from the other modules to combine with DL output as input to the machine learning prediction. We used the same subjects with incident late AMD of both types in the training and testing as we used for the full prediction models.
The 2-year progression model was then validated without further training on the NAT-2 external dataset. We used only patients in the placebo category to remove the effect of supplements in developing late-stage AMD.26 A total of 88 study eyes were taken for validation, of which 30 advanced to late AMD within 3 years (mean, 2.5 years) and 58 did not.
Results
The initial results on DL screening were reported elsewhere.32 We have improved the accuracy significantly with the ensemble deep learning method, presented here. For binary screening of AMD stage, our algorithm achieved 99.2% (95% confidence interval [CI], 99.02–99.39) accuracy in distinguishing normal/early from intermediate/late AMD (sensitivity of 98.9% [95% CI, 98.64–99.66] and specificity of 99.5% [95% CI, 98.85–99.80]). To our knowledge, this is the best screening accuracy among such existing models (confusion matrices, Supplementary Tables S2 and S3, online supplement). The area under the curve for the model screening for intermediate and advanced AMD is 0.99 (95% CI, 0.989–0.991). AREDS published an inter-observer agreement on the human gradings of the severity of none, early, intermediate, and late, with a kappa value of 0.77.50 We have taken as ground truth the final AREDS gradings for these AMD stages, and our method showed agreement with these gradings at the kappa value 0.95 (Supplementary Table S3).
The kappa score for the screening model is 0.983. A comparison with other published methods in accuracy, sensitivity, specificity, and kappa metrics is found in Table 3.
Table 3.
Comparison of Accuracy, Sensitivity, Specificity, Kappa, and AUC of Existing vs. our AMD Screening Model Based on Referable/Nonreferable AMD Classification (2-class) and 4-class Accuracy of AMD Stage Classification (Normal, Early, Intermediate, and Advanced)
| Metric | Our Result | Agurto et. al. 3 | Phan et al. 5 | Burlina et al. 29 |
|---|---|---|---|---|
| Accuracy | 99.2% (99.02–99.39) | Not provided | 75.6% (279 images) | 91.6% |
| Sensitivity | 98.9% (98.24–99.66) | 94% | NA | 88.40% |
| Specificity | 99.5% (98.55–99.80) | 50% | NA | 94.10% |
| Kappa | 98.3% (98.1–98.9) | 84% | NA | 82.90% |
| AUC | 99% (98.6–99.3) | NA | 89% | 96% |
| 4-class accuracy | 96.1% (95.4–96.62) | NA | 62% | Not reported |
For the incidence of late AMD in 2 years, we achieved 86.36% (95% CI, 84.22–88.31) accuracy, 92.42% (88.64–95.25) sensitivity, and 84.39% (81.78–86.76) specificity. For 1-year incidence of late AMD, we achieved 86.19% (84.03–88.15) prediction accuracy with 90.74% (86.64–93.92) sensitivity and 84.74% (82.15–87.09) specificity (confusion matrix in Supplementary Table S4, Supplementary Table S5, online supplement).
For the prediction of late dry and wet AMD, we separated the test subjects based on the incident type. We achieved 66.88% (95% CI, 64.01–69.66) accuracy with 69.16% (59.50–77.73) sensitivity and 66.63% (63.60–69.56) specificity for the 2-year incidence of late dry AMD. We achieved 67.15% (64.29–69.93) accuracy with 71.43% (63.19–78.74) sensitivity, and 66.53% (63.44–69.51) specificity for 2-year incidence of late wet AMD (Supplementary Table S6 and Supplementary Table S7, online supplement).
Table 4 shows the performance outcomes for all models.
Table 4.
The Accuracy, Sensitivity, Specificity, and Precision of Dry and Wet AMD Prediction Models for the Prediction 1- and 2-Year Risk of Developing AMD
| Accuracy | Sensitivity/Recall | Specificity | Precision | |
|---|---|---|---|---|
| Metrics | (95% CI) | (95% CI) | (95% CI) | (95% CI) |
| Any AMD (2-year) | 86.36% (84.22–88.31) | 92.42% (88.64–95.25) | 84.39% (81.78–86.76) | 65.81% (62.13–69.31) |
| Dry AMD (2-year) | 66.88% (64.01–69.66%) | 69.16% (59.50–77.73) | 66.63% (63.60–69.56) | 18.27% (16.08–20.69) |
| Wet AMD (2-year) | 67.15% (64.29–69.93%) | 71.43% (63.19–78.74) | 66.53% (63.44–69.51) | 23.75% (21.35–26.33) |
| Any AMD (1-year) | 86.19% (84.03–88.15%) | 90.74% (86.64–93.92) | 84.74% (82.15–87.09) | 65.33% (61.56–68.92) |
| Dry AMD (1-year) | 66.79% (63.92–69.57%) | 70.09% (60.48–78.56) | 66.43% (63.40–69.37) | 18.38% (16.22–20.77) |
| Wet AMD (1-year) | 68.15% (65.31–70.90%) | 73.57% (65.46–80.66) | 67.36% (64.29–70.32) | 24.76% (22.34–27.35) |
We achieved 66.79% (95% CI, 63.92–69.57) accuracy with 70.09% (60.48–78.5%) sensitivity, and 66.43% (63.40–69.37) specificity for the 1-year incidence of late dry AMD and 68.15% (65.31–70.90) accuracy with 73.57% (65.46–80.66) sensitivity, and 67.36% (64.29–70.32) specificity for the 1-year incidence of late wet AMD (confusion matrices, Supplementary Tables S8 and S9).
We tested the results without the sociodemographic parameters. The proposed AMD prediction system with retinal and sociodemographic data outperformed all models based on retinal parameters only. The 2-year model, with only retinal parameters, performed worse in terms of sensitivity achieving 88.79% compared with 92.42% achieved by the proposed model (Supplementary Table S10).
Deep learning models alone, without specific retinal imaging parameters, also resulted in poorer predictive performance compared with the elaborate multi-parametric approach this paper presents as inputs to the machine learning models. For late dry AMD, the sensitivity was 63% for 1 year and 65% for 2 years; the specificity was 69% for 1 year and 69% for 2 years. For late wet AMD, sensitivity was 59% for 1 year and 60% for 2 years; the specificity was 68% for 1 year and 70% for 2 years. (Supplementary Table S15, online supplement).
We have measured the area under the curve for all six complete models for 1- and 2-year risk prediction of late AMD (any, dry, or wet) stratified by age, gender, and smoking status. All models performed better on females and nonsmokers. When stratified by age, the 1-year models all performed worse on subjects less than 60 compared with groups 60 to 70 and over 70, whereas the performance of the 2-year models on all three age groups was similar. Refer to Supplementary Figures S1–S6 for the receiver operating characteristic curves and explicit performance.
The 5-year late AMD prediction, the model achieved 64.6% accuracy with 65.1% sensitivity and 64.1% specificity. The 10-year model achieved 62.03% accuracy with 62.9% sensitivity, and 60.8% specificity. The AREDS supplements and placebo categories had no effect on the accuracy of our prediction models of 1-, 2-, and 5-year incidence. We observed a slight improvement of approximately 1.33% in the accuracy (62.03% vs. 60.7%) in the 10-year prediction model by separating the treatment categories.
Our 2-year late AMD model when further validated on NAT-2 data, produced an accuracy of 84% (95% CI, 74.75–91.02) with a sensitivity of 90% (95% CI, 73.47–97.89) and a specificity of 81% (95% CI, 68.59–90.13), the details of which are shown in Table 5 and Supplementary Table S11. The information in the NAT2 dataset is based on the incidence of late AMD 3 years between the first and the last visit.
Table 5.
Sensitivity, Specificity, Accuracy, and Precision of the Prediction 2-Year Risk of Developing Late AMD (Dry or Wet) Validated on NAT-2 Dataset
| Metric | Values (95% CI) |
|---|---|
| Sensitivity | 90% (73–98) |
| Specificity | 81% (69–90) |
| Accuracy | 84% (75–91) |
| Precision | 71% (59–81) |
We also considered the NAT-2 dataset for late dry and late AMD prediction in 2 years. For late dry AMD, the number of subjects was six and for late wet AMD, 26, including two in common (details in Supplementary Table S12). For the prediction of incident late wet AMD in 2 years, we achieved 70.4% (95% CI, 52.21–88.43) sensitivity and 61.3% (95% CI, 48.07–73.40) specificity. The confusion matrix is shown in Supplementary Table S13. We did not have enough dry AMD subjects for validation in this NAT-2 dataset.
Discussion and Conclusions
We have combined deep learning and machine learning, as well as AMD-specific image parameter generating algorithms, in a complex pipeline to create a portfolio of six automated color fundus photograph-based AMD prediction models. For each time period of 1 or 2 years, there are three models for prediction of late AMD: any, dry, or wet, respectively. To our knowledge, these are the first such models to predict conversion to late AMD successfully at either one or two years, with late dry and wet form categorization (the initial results 33 on late AMD prediction were presented at ARVO 2018). In addition to the general power of AI, we believe this success is also attributable to the careful selection of image preprocessing techniques and neural networks to ensure robustness to retina image and dataset variations, and the capability of learning features on such wide scales as tiny drusen or large areas of geographic atrophy. The first part of the pipeline is a DL image classifier, previously published and improved in this paper, which can discriminate none/early-stage from intermediate/late-stage AMD with an accuracy of 98%, to our knowledge the highest accuracy among reported methods. This is a critical component of the prediction model, but it clearly has independent value in identifying AMD in the general population for appropriate referral. This DL classifier has been refined here further with six algorithms, each providing probabilities of an image falling into any one of the 12 more detailed AREDS scales The outputs of these DL classifiers are then passed to the machine learning prediction model, together with AMD-specific image parameters and demographic factors, for finding individuals at risk of progression from intermediate to late AMD, who may require closer surveillance, better attention to modifiable risk factors, and who perhaps may wish to be considered for advanced therapies.
The 2-year model has also been validated on the external dataset NAT-2 with results consistent with those from the AREDS training data. This suggests the potential for future portability to other imaging environments. We also experimented with the DL models’ performance alone if we did not provide specific retinal features such as drusen area from the other modules to combine with DL output as input to the machine learning prediction. Although this method proved to be inferior, it was useful to show the parametric importance of the specific severity and categories of AMD information in the image. This finding may be instructive in general with regard to methods that rely on DL exclusively.
Stratification of subjects by gender, smoking status, and age yielded Interesting results. All six models performed better on females and nonsmokers. When stratified by age, the three one-year models all performed worse on subjects less than 60 compared with groups 60-70 and older than 70, whereas the performance of the three two-year models on all three age groups was similar. It would be of interest to AMD research to determine why certain groups’ outcomes were more predictable than others (e.g., why females were more predictable than males).
The study has several limitations. With respect to deploying the models in the community or primary care clinics, other pathologies such as diabetic retinopathy besides AMD will be coexisting and confounding to algorithms tuned only to AMD, requiring further large investments in AI development before deployment. To our knowledge, all detection algorithms published so far are disease-specific, that is, trained on and therefore effective only on, data from a specific disease (e.g., diabetics to search for DR). Furthermore, instead of images from studies acquired by expert photographers on expensive fundus cameras, image acquisition platforms in the community will need to be inexpensive, almost completely automatic, and capable of adequate image quality for evaluation by AI. Although such systems are now becoming available, the proof of principle remains to be tested prospectively in large studies, with human validation, and with cost and reimbursement issues to be solved in a business model. These challenges, although beyond the scope of the present paper, must be acknowledged, and although difficult, will no doubt be surmountable by the ophthalmic and AI communities.
Even high-quality photographs in eye specialists’ offices will be acquired on a range of devices, so that the transfer of our AMD prediction model built on AREDS photos is not a given. The same may be said for myriad other studies such as OCT studies of AMD and glaucoma performed on specific devices; there is likewise no guarantee that those findings transfer to other devices without extensive validation. Along this line, however, encouraging confirmation was obtained when our prediction algorithms performed well on the external, independent dataset from the NAT-2 study, with images acquired on other cameras. If similar success can be found in appropriate community-based trials, with the identification of subjects with AMD, then widespread adoption should soon follow.
Finally, the prediction accuracy was significantly lower when we stratified the predictions to choroidal neovascularization (CNV) and geographic atrophy (GA). This may reflect a large number of nonincident cases compared to a very small number of pure dry and wet AMD cases for building the machine learning models. It will be of interest in future research to determine if these accuracies can be improved by access to larger datasets or other approaches.
Strengths of the study include the immediate applicability of these techniques as an adjunct to AMD studies that employ color photography, where they could obviate major burdens of human effort for image classification. With the expected solution of the challenges to wider deployment just noted, a longer term and much broader benefit would be in the public health arena, where automated screening for AMD via telemedicine could bring needed care to millions before they were otherwise identified. Here AMD prediction would bring added value to patient management.
In conclusion, both the screening and prediction models may prove to be public health assets through telemedicine. The prediction model could also be used in ophthalmology clinics to identify patients who require closer surveillance and better attention to modifiable risk factors, and who perhaps may wish to be considered for advanced therapies. Further validation in prospective trials will help determine the optimal utilization of these models for the prevention of blindness from AMD.
The Software Tool ‘iPredict-AMD’: An online version of the prediction system is available at https://www.ihealthscreen.org/ipredict-amd/ (the user name is “ipredict-amd” and the password is “ipredict#test2019”).
Supplementary Material
Acknowledgments
This project is funded by NIH SBIR project number R43EY026841.
Disclosure: A. Bhuiyan, Image-Based Screening System for Prediction of Individual at Risk of Late-Age-Related Macular Degeneration (AMD) (P); T.Y. Wong, None; D.S.W. Ting, None; A. Govindaiah, None; E.H. Souied, None; R.T. Smith, None
References
- 1. Age-Related-Eye-Disease-Study-Research-Group The Age-Related Eye Disease Study (AREDS): design implications. AREDS report no. 1. Control Clin Trials. 1999; 20: 573–600. [DOI] [PMC free article] [PubMed] [Google Scholar]
- 2. AMD-Defined Age-related macular degeneration (AMD). Projections for AMD (2010-2030-2050), National Eye Institute (NEI) Available at: https://nei.nih.gov/eyedata/amd/. Accessed on Aug 03, 2018. [Google Scholar]
- 3. Agurto C, Barriga E, Murray V, et al.. Automatic detection of diabetic retinopathy and age-related macular degeneration in digital fundus images. Retina. 2011; 52: 5862–5871. [DOI] [PMC free article] [PubMed] [Google Scholar]
- 4. Bartlett H, Eperjesi F.. Use of fundus imaging in quantification of age-related macular change. Survey Ophthalmol. 2007; 52: 655–671. [DOI] [PubMed] [Google Scholar]
- 5. Phan TV, Seoud L, Chakor H, Cheriet F. Automatic screening and grading of age-related macular degeneration from texture analysis of fundus images. J Ophthalmol. 2016;5893601. doi: 10.1155/2016/5893601 [Epub Apr 14, 2016] [DOI] [PMC free article] [PubMed] [Google Scholar]
- 6. Wong TY, Liew G, Mitchell P. Clinical update: new treatments for age-related macular degeneration. Lancet. 2007; 370: 194–206. [DOI] [PubMed] [Google Scholar]
- 7. WT Y., RS L.. Age related macular degeneration: time for a randomized controlled trial. Am J Ophthalmol. 2007; 144: 117–119. [DOI] [PubMed] [Google Scholar]
- 8. Lim LS, Mitchell P, Seddon JM, Holz FG, Wong TY. Age-related macular degeneration. Lancet. 2012; 379: 1728–1738. [DOI] [PubMed] [Google Scholar]
- 9. Ahlers C, Goetzinger E, Pircher M, et al.. Imaging of the retinal pigment epithelium in age-related macular degeneration using polarization sensitive optical coherence tomography. Invest Ophthalmol Visual Sci. 2010; 51: 2149–2157. [DOI] [PMC free article] [PubMed] [Google Scholar]
- 10. AMD.Org – Macular Degeneration Partnership. Available at: http://www.amd.org/what-is-macular-degeneration/dry-amd/. Accessed August 25, 2015.
- 11. Kanagasingam Y, Bhuiyan A, Abràmoff M, Smith R, Goldschmidt L, Wong T. Progress on retinal image analysis for age related macular degeneration. Prog Retin Eye Res. 2014; 38: 20–42. [DOI] [PubMed] [Google Scholar]
- 12. costHelper. Macular degeneration treatment cost. How much does macular degeneration treatment cost? Available at: https://healthcosthelpercom/macular-degenerationhtml. Accessed August 10, 2018.
- 13. Wong TY. Age-related macular degeneration and cardiovascular disease in the era of anti–vascular endothelial growth factor therapies. Am J Ophthalmol. 2009; 148: 327–329. [DOI] [PubMed] [Google Scholar]
- 14. Anti-VEGF treatment and dry AMD: finding the balance. 2015. Bright Focus Foundation. Available at: http://www.brightfocus.org/facts-data. Accessed August 25, 2015.
- 15. Malik U. Age Related Macular Degeneration Factsheet. Available at: https://irisvision.com/agerelated-macular-degeneration-factsheet-interestingamd-facts/. Accessed August 10, 2018.
- 16. Schmier JK, Jones ML, Halpern MT. The burden of age-related macular degeneration. Pharmacoeconomics. 2006; 24: 319–334. [DOI] [PubMed] [Google Scholar]
- 17. Age-Related Eye Disease Study Research Group. The relationship of dietary carotenoid and vitamin A, E, and C intake with age-related macular degeneration in a case-control study: AREDS Report No. 22. Arch Ophthalmol. 2007; 125: 1225–1232. [DOI] [PubMed] [Google Scholar]
- 18. National-Eye-Institute. Prevalence of blindness data. Available at: http://www.nei.nih.gov/eyedata/pbd_tables.asp. Accessed May 30, 2013.
- 19. Chew EY, SanGiovanni JP, AREDS2-Research-Group. Lutein/zeaxanthin for the treatment of age-related cataractAREDS2 randomized trial report no. 4. JAMA Ophthalmol. 2013; 131: 843–850. [DOI] [PMC free article] [PubMed] [Google Scholar]
- 20. Geneva I. Photobiomodulation for the treatment of retinal diseases: a review. Int J Ophthalmol. 2016; 9: 145–152. [DOI] [PMC free article] [PubMed] [Google Scholar]
- 21. Lek JJ, Brassington KH, Luu CD, et al.. Subthreshold nanosecond laser intervention in intermediate age-related macular degeneration – study design and baseline characteristics of the laser in early stages of age-related macular degeneration study (Report Number 1). Ophthalmology. 2017; 1: 227–239. [DOI] [PubMed] [Google Scholar]
- 22. Smith RT, Sohrab MA, Busuioc M, Barile G. Reticular macular disease. Am J Ophthalmol. 2009; 148: 733–743. [DOI] [PMC free article] [PubMed] [Google Scholar]
- 23. Strahlman E, Fine S, Hillis A. The second eye of patients with senile macular degeneration. Arch Ophthalmol. 1983; 101: 1191–1193. [DOI] [PubMed] [Google Scholar]
- 24. Chiu C, Mitchell P, Klein R, et al.. A risk score for the prediction of advanced age-related macular degeneration: development and validation in 2 prospective cohorts. Ophthalmology. 2014; 121: 1421–1427. [DOI] [PMC free article] [PubMed] [Google Scholar]
- 25. Joachim N, Mitchell P, Burlutsky G, Kifley A, Wang JJ. The incidence and progression of age-related macular degeneration over 15 years: the Blue Mountains Eye Study. Ophthalmology. 2015; 122: 2482–2489. [DOI] [PubMed] [Google Scholar]
- 26. Group A-REDSR. A randomized, placebo-controlled, clinical trial of high-dose supplementation with vitamins C and E, beta carotene, and zinc for age-related macular degeneration and vision loss: AREDS report no. 8. Arch Ophthalmol. 2001; 119: 1417. [DOI] [PMC free article] [PubMed] [Google Scholar]
- 27. JoM Seddon, R Reynolds, Yu Y, Daly MJ, Rosner B. Prediction risk modeling for progression to advanced age-related macular degeneration using baseline demographic, environmental, genetic and ocular variables. Invest Ophthalmol Visual Sci. 2011; 52: 5235. [DOI] [PMC free article] [PubMed] [Google Scholar]
- 28. Buitendijk GHS, Rochtchina E, Myers C, et al. Prediction of age-related macular degeneration in the general population: the Three Continent AMD Consortium. Ophthalmology. 2013; 120: 2644–2655 [DOI] [PMC free article] [PubMed] [Google Scholar]
- 29. Burlina P, Pacheco KD, Joshi N, Freund DE, Bressler NM. Comparing humans and deep learning performance for grading AMD: A study in using universal deep features and transfer learning for automated AMD analysis. Computers Biol Med. 2017; 82: 80–86. [DOI] [PMC free article] [PubMed] [Google Scholar]
- 30. Govindaiah A, Hussain A, Smith R, Bhuiyan A. Deep Convolutional Neural Network-Based Screening and Assessment of Age-Related Macular Degeneration from Fundus Images. In the Proceedings of IEEE International Symposium on Biomedical Imaging. 2017; 10.1109/ISBI.2018.8363863: 1525–1528. [DOI]
- 31. Grassmann F, kamp JM, Brandl C, et al.. A deep learning algorithm for prediction of age-related eye disease study severity scale for age-related macular degeneration from color fundus photography. Ophthalmology. 2018; 125: 1410–1420. [DOI] [PubMed] [Google Scholar]
- 32. Govindaiah A, Smith T, Bhuiyan A. A new and improved method for automated screening of age-related macular degeneration using ensemble deep neural networks. Proc IEEE EMBC 2018. 2018: 702–705. [DOI] [PubMed]
- 33. Bhuiyan A, Govindaiah A, Smith RT. A prediction model for risk of progression to late age-related macular degeneration (AMD). Invest Ophthalmol Visual Sci. 2018; 59: 3214–3214. [Google Scholar]
- 34. Burlina PM, Joshi N, Pacheco KD, Freund DE, Kong J, Bressler NM. Use of deep learning for detailed severity characterization and estimation of 5-year risk among patients with age-related macular degeneration. JAMA Ophthalmol. 2018; 136: 1359–1366. [DOI] [PMC free article] [PubMed] [Google Scholar]
- 35. Landwehr N, Hall M, Frank E. Logistic model trees. Machine Learning. 2005; 95: 161–205 [Google Scholar]
- 36. Age-Related-Eye-Disease-Study-Research-Group. A Simplified severity scale for age-related macular degeneration, AREDS Report No. 18. Arch Ophthalmol. 2005; 123(11): 1570–1574. [DOI] [PMC free article] [PubMed] [Google Scholar]
- 37. AREDS-Report-17. Age-Related Eye Disease Study Research Group. The age-related eye disease study severity scale for age-related macular degeneration: AREDS Report No. 17. Arch Ophthalmol. 2005; 123: 1484–1498. [DOI] [PMC free article] [PubMed] [Google Scholar]
- 38. Age-Related-Eye-Disease-Study-Research-Group. A randomized, placebo-controlled, clinical trial of high-dose supplementation with vitamins C and E, beta carotene, and zinc for age-related macular degeneration and vision loss: AREDS report no. 8. Arch Ophthalmol. 2001; 119: 1417. [DOI] [PMC free article] [PubMed] [Google Scholar]
- 39. Szegedy C, Vanhoucke V, Ioffe S, Shlens J, Wojna Z. Rethinking the inception architecture for computer vision. Paper presented at: Proceedings of the IEEE conference on computer vision and pattern recognition2016.
- 40. Szegedy C, Ioffe S, Vanhoucke V, Alemi AA. Inception-v4, inception-resnet and the impact of residual connections on learning. Paper presented at: In the Proceedings of Thirty-First AAAI Conference on Artificial Intelligence; 2017.
- 41. Chollet F. Xception: Deep learning with depthwise separable convolutions. Paper presented at: Proceedings of the IEEE conference on computer vision and pattern recognition; 2017.
- 42. Zoph B, Vasudevan V, Shlens J, Le VQ. Learning transferable architectures for scalable image recognition. In IEEE Conference on Computer Vision and Pattern Recognition. Available at: https://arxivorg/abs/170707012. Accessed August 1, 2018.
- 43. Class activation maps in Keras for visualizing where deep learning networks pay attention. Jacob's Computer Vision and Machine Learning blog. Available at: https://jacobgilgithubio/deeplearning/class-activation-maps. Accessed September 25, 2019). [Google Scholar]
- 44. Hoeting JA, Madigan D, Raftery AE, Volinsky CT. Bayesian model averaging: a tutorial. Stat Sci. 1999; 14(4): 382–401. [Google Scholar]
- 45. Caruana R, Niculescu-Mizil A.. An empirical comparison of supervised learning algorithms using different performance metrics. Proc ICML’06. Available at: http://wwwcscornelledu/∼alexn/papers/comparisontrpdf . Accessed July 1, 2018. [Google Scholar]
- 46. Hussain A, Govindaiah A, Souied E, Smith T, Bhuiyan A. Automated tracking and change detection of retinal pathology for age-related macular degeneration progression using fundus imaging. Proc IEEE ICIEV. 2018: 1–5.
- 47. Bird AEC, Bressler NM, Bressler SB. International classification of grading system for age-related maculopathy and age-related macular degeneration. Surv Ophthalmol. 1995; 39: 367–374. [DOI] [PubMed] [Google Scholar]
- 48. Fox J. Cox proportional-hazards regression for survival data. An R and S-PLUS Companion to Applied Regression. Thousand Oaks, CA, Sage Publications Inc; 2002;2002. [Google Scholar]
- 49. Bishop CM. Pattern Recognition and Machine Learning. Vol ISBN 978-0387310732: New York, NY: Springer; 2011. [Google Scholar]
- 50. Age-Related Eye Disease Study Research Group. The Age-Related Eye Disease Study system for classifying age-related macular degeneration from stereoscopic color fundus photographs: the Age-Related Eye Disease Study Report Number 6. Am J Ophthalmol, 2001; 132: 668–681. [DOI] [PubMed] [Google Scholar]
Associated Data
This section collects any data citations, data availability statements, or supplementary materials included in this article.