

Abstract
Purpose
To determine the extent of remnant cone structure within early foveal ellipsoid zone (EZ) lesions in macular telangiectasia type 2 longitudinally using both confocal and split detector adaptive optics scanning light ophthalmoscopy (AOSLO).
Methods
Spectral domain optical coherence tomography (SDOCT), confocal and split detector AOSLO were acquired from seven patients (10 eyes) with small (early) EZ lesions on SDOCT secondary to macular telangiectasia type 2 at baseline, 6 months, and 12 months. The presence of cone structure on AOSLO in areas of EZ loss as well as cones at 1° eccentricity, and their change over time were quantified.
Results
By split detector AOSLO, remnant cone structure was identified within and on the borders of all foveal EZ lesions. Within the extent of these lesions, cone spacing ranged from 4.97 to 9.95 µm at baseline, 5.30 to 6.10 µm at 6 months, and 4.99 to 7.12 µm at 12 months. Four eyes with significantly smaller EZ lesions showed evidence of recovery of EZ reflectivity on SDOCT B-scans. Remnant cone structure was identified in some areas where EZ reflectivity recovered at the following time point. Eyes that showed recovery of EZ reflectivity had a continuous external limiting membrane.
Conclusions
Remnant cone structure can persist within small SDOCT-defined EZ lesions, which can wax and wane in appearance over time. AOSLO can help to inform the interpretation of SDOCT imaging.
Translational Relevance
The absence of EZ in early macular telangiectasia type 2 and other retinal conditions needs careful interpretation because it does not always indicate an absence of underlying cone structure. The integrity of the external limiting membrane may better predict the presence of remnant cone structure and recovery of EZ reflectivity.
Keywords: macular telangiectasia, adaptive optics scanning light ophthalmoscopy, cones, ellipsoid zone
Introduction
Macular telangiectasia type 2 (MacTel) is a bilateral progressive degenerative disorder of the macula of unclear etiology. Since its initial description as a retinovascular condition more than 30 years ago,1 our understanding of the disease has evolved with advances in imaging technology, from results of recent histologic studies,2–4 and with genetic and metabolomics analyses.5 It is now thought to represent a primary neuroglial disorder of the macula with localized Müller cell and photoreceptor dysfunction and loss.6 Patients with MacTel have characteristic hyporeflective inner retinal and outer retinal cavities, as well as ellipsoid zone (EZ) disruptions (EZ lesions) on spectral domain optical coherence tomography (SDOCT) that are considered to be degenerative and progressive in nature. These EZ disruptions have been shown to correlate with visual function on microperimetry and electrophysiology, and are suggested to be a better indicator of disease progression in MacTel than changes in visual acuity alone.7,8
Evidence is emerging that an EZ lesion may not necessarily represent an absence of cone structure.4,7–10 For example, adaptive optics scanning light ophthalmoscopy (AOSLO) imaging has demonstrated remnant cone inner segment structure in areas of EZ damage across a range of retinal diseases, including one case of MacTel.11,12 Furthermore, EZ lesions can change in appearance, sometimes spontaneously. Full or partial recovery of EZ lesions has been observed in some patients with popper-induced maculopathy,13,14 laser-induced injury,15,16 and MacTel.8–10 In addition, in a recent study of MacTel,9 spontaneous recovery of EZ reflectivity on SDOCT was accompanied by recovery in the visibility of the cone mosaic using confocal AOSLO in two of three eyes assessed on follow-up imaging. Furthermore, testing using AOSLO microperimetry demonstrated some residual function within these EZ lesions, despite the absence of visible cones.9 The authors hypothesized that these dark regions may contain abnormal cone outer segments, which would lack the normal reflectivity expected on confocal AOSLO imaging.9 Together, these studies demonstrate the need for better characterization of remnant cone structure within EZ lesions in MacTel, as well as a better understanding of the nature of cone photoreceptor recovery in these patients.
Here we used split detector and confocal AOSLO to provide a longitudinal assessment of cone photoreceptor structure in patients with MacTel to evaluate the natural history and detailed structure within the very earliest stages in the development of these SDOCT EZ lesions. These results demonstrate how AOSLO can help to inform the interpretation of SDOCT imaging.
Methods
Participants
This prospective, observational study included patients with MacTel who were participants in the international MacTel Natural History Observation Registry at Moorfields Eye Hospital.17 All patients underwent SDOCT imaging as a part of their enrollment in the registry. The diagnosis of MacTel was confirmed by the Moorfields Eye Hospital Reading Centre (London, UK). The study was approved by the local institutional review board and all research procedures followed the principles of the Declaration of Helsinki. Written informed consent was obtained from all participants. Patients were followed up with longitudinal assessments of visual acuity, funduscopic examination, and multimodal imaging performed at baseline, 6 months and 12 months. Best-corrected visual acuity (BCVA) was performed using Early Treatment Diabetic Retinopathy Study charts18,19 and was converted to logarithm of the minimum angle of resolution using standardized conversion charts. No eyes received any treatment or surgery during the course of the study.
Inclusion Criteria
Patients from the MacTel registry at Moorfields Eye Hospital were recruited for this study based on the presence of small EZ lesions on SDOCT. An early EZ lesion was defined as the absence of EZ reflectivity measuring up to approximately 500 microns on at least two contiguous B-scans within a volume scan with normal reflectivity (subjectively determined) on either side of the lesion.
Exclusion Criteria
Patients were excluded from this study based on the presence of any opacification of the ocular media or poor fixation stability, which may preclude reliable retinal imaging. Eyes were also excluded if they had late stage complications of MacTel, as defined by the presence of pigment plaques on color fundus imagery, subretinal neovascularization, or any concomitant retinal pathology.
Imaging Protocol and Analysis
Optical Coherence Tomography
Patients were imaged by SDOCT (HRA OCT+Spectralis S3300-IFP with Heyex image acquisition software version 6.3.1; Heidelberg Engineering, Heidelberg, Germany) using the standard 30° objective lens. Pupils were dilated before each imaging session with 1% tropicamide and 2.5% phenylephrine eye drops. At all visits, SDOCT volume scans to locate foveal EZ lesions for AOSLO imaging were acquired. At baseline, the distance between B-scans ranged from 11 to 121 µm. Follow-up mode was used where the baseline and 6-month visit scans had 11 µm distance between B-scans (see Supplementary Table S1 for SDOCT parameters). En face (transverse) images for each SDOCT volume were generated using the 3D View Transverse View option in Heidelberg Eye Explorer (version 1.9.10.0) by maximum intensity projection of segmented EZ (photoreceptor 1 segmentation). Foveal EZ lesion area was identified by outlining hyporeflective regions in en face images within Heidelberg Eye Explorer as described previously.8 The EZ was also segmented from the SDOCT volumes by using custom software11 (e.g., Supplementary Fig. S1) to avoid interpolation introduced by the Spectralis and compare EZ reflectivity between visits and to AOSLO images.
Adaptive Optics Scanning Light Ophthalmoscopy
After SDOCT imaging, patients were imaged using a custom-built AOSLO at Moorfields Eye Hospital, as previously described.20,21 In brief, a 790-nm light source was used for imaging and an 850-nm light source was used for wavefront sensing. The power of these light sources measured at the cornea was 70 and 17 µW, respectively.22 Each patient was stabilized by using a dental impression on a bite bar. Simultaneous confocal and nonconfocal split detector AOSLO images focused on the photoreceptor mosaic were acquired in absolute spatial and temporal co-registration.22 Although confocal AOSLO is thought to reflect the waveguiding behavior of intact cone photoreceptors, split detector AOSLO relies on multiply scattered light to visualize the cone inner segment structure.22 Image sequences consisting of 150 frames with an acquisition rate of 16.6 frames per second were recorded at different locations across the central fovea and parafovea using a fixation target. Images using a 1° x 1° field of view were acquired around and throughout the foveal EZ lesion based on its extent as guided by SDOCT imaging, and 1° x 1° and 1.5° x 1.5° field of view images were acquired up to 5° superior from the fovea and to a large vessel for alignment to other imaging modalities.
After AOSLO image acquisition, the raw frames from the image sequences were corrected for sinusoidal distortions and strip registered to a reference frame, as previously described.23,24 This process resulted in both a confocal and a split detector .tif image from each retinal location imaged. For each eye, the confocal and split detector AOSLO images were montaged simultaneously and semiautomatically using a multimodal montaging algorithm.25 Montages were reviewed by K.M.L. and the position of overlapping images manually adjusted as necessary using Adobe Photoshop CS6 (Adobe Systems, Inc., San Jose, CA).
Axial length was measured using a Zeiss IOL Master (Carl Zeiss Meditec, Jena, Germany) and used to scale AOSLO images as previously described.26 AOSLO montages were manually aligned using Adobe Photoshop CS6 to infrared reflectance and en face SDOCT images using retinal vasculature. For intrapatient comparisons between visits, AOSLO montages were transformed to the same scale (µm/pixel).
Regions of interest (ROIs) (55 × 55 µm) from the split detector AOSLO montages were selected manually at 1° eccentricity. An additional ROI was selected within the EZ lesion, subjectively positioned at a location with clearly retained cone structure. Not all eyes were able to be used for this analysis owing to variability in image quality. For each ROI, cones were manually identified using custom software (Translational Imaging Innovations, Inc., Hickory, NC).27 From these cone coordinates, cone density and cone spacing (intercell distance) were estimated for ROIs at 1° eccentricity, whereas only cone spacing (intercell distance) was estimated for the ROIs within EZ lesions (owing to the patchy appearance of the remnant cones). The intercell distance was calculated as the average distance between a cell and all of its immediate neighbors.27 Only cones with their corresponding Voronoi cell fully contained within the ROIs were included in the cone density and spacing estimates.27
Statistical Analysis
Statistical analyses for cone density and EZ lesion area were done using GraphPad Prism (version 7.04). Data were tested for normality using the Shapiro-Wilk test. To test the null hypothesis that there is no change in perilesional cone density (1° eccentricity), a linear mixed model with random eye effect was used. Significance for all tests was defined as P < 0.05.
Results
From a total of 119 patients on the MacTel registry at Moorfields Eye Hospital, 13 patients met our inclusion criteria for small EZ lesions and were invited to participate in this study. The majority of patients on the registry were not eligible owing to the EZ break being too large or poorly defined on SDOCT or late-stage MacTel. Ten eyes from seven patients were enrolled in this study with a mean (± standard deviation) age of 57.4 ± 10.5 years. All eyes had nonproliferative MacTel (See Supplementary Fig. S2 for color fundus photographs).28 Patient characteristics including best-corrected visual acuity and EZ lesion area are summarized in Table 1. Five of the seven patients (six of 10 eyes) completed the 12-month follow-up, with two patients not returning for the 12-month visit because they were unavailable during the scheduled imaging period.
Table 1.
Patient Characteristics and Visual Acuity Over Time
| Patient | Sex | Baseline Age (y) | Eye | Axial Length (mm) | Baseline BCVA (LogMAR) | 12-Month BCVA (LogMAR) | Baseline EZ Lesion Area (mm2) |
|---|---|---|---|---|---|---|---|
| 1 | M | 56 | OD | 23.14 | 0.2 | 0.2 | 0.02 |
| OS | 23.09 | 0.2 | 0.2 | 0.65 | |||
| 2 | F | 54 | OD | 20.63 | 0.3 | 0.3 | 0.03 |
| OS | 20.41 | 0.3 | 0.3 | 0.11 | |||
| 3 | F | 52 | OD | 22.36 | 0.1 | 0.1 | 0.01 |
| OS | 22.48 | 0.2 | 0.2 | 0.19 | |||
| 4 | M | 46 | OD | 21.96 | 0.4 | 0.2 | 0.1 |
| 5 | M | 59 | OD | 23.61 | 0.4 | 0.6* | 0.2 |
| 6 | M | 54 | OD | 23.02 | 0.65 | 0.6* | 2.22 |
| 7 | F | 79 | OS | 22.53 | 0.2 | 0.48† | 0.03 |
BCVA, best-corrected visual acuity; F, female; logMAR, logarithm of the minimum angle of resolution; M, male,
Last follow-up at 6 months.
At the 9-month follow-up .
As assessed with location-matched SDOCT B-scans, four of nine eyes with 6-,12-, or 6- and 12-month follow-up imaging showed recovery of EZ reflectivity (both eyes of patient 2, right eye of patient 3, and right eye of patient 4). Patient 2 showed reduced EZ reflectivity in the left eye at 6 months followed by partial recovery of EZ reflectivity at the same location at 12 months (Figs. 1A–1C, vertical arrows). In addition, we observed recovery of EZ reflectivity (i.e., lesion resolution) after 12 months in the right eye of patient 4 (Figs. 1D–1F). Similar recovery of EZ reflectivity at 12 months was seen in the right eye of patient 2 and the right eye of patient 3 (data not shown). All four eyes that showed recovery of EZ reflectivity had a continuous external limiting membrane (ELM) overlying the lesion at baseline; however, the ELM appeared to be thicker with increased reflectivity compared with areas adjacent to the lesion (e.g., Fig. 1D, arrow). In some of the cases with recovery of EZ reflectivity, the increased reflectivity extended into the outer nuclear layer, although this was not always visible in cases with inner retinal hyporeflective spaces at the fovea. The ELM was present in five of seven eyes at the 12-month follow-up visit (Table 2). Although the ELM was present in some cases overlying EZ lesions, in other cases the ELM was ambiguous in appearance or absent (e.g., Supplementary Fig. S3 and Supplementary Figs. S4A–S4D).
Figure 1.
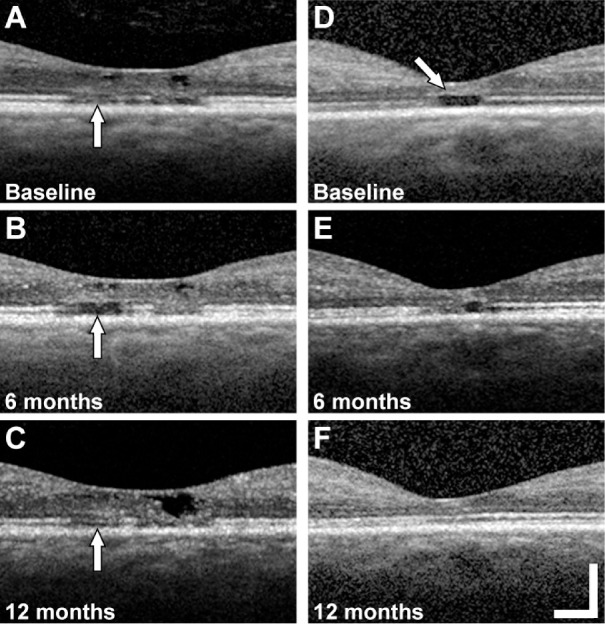
Examples of EZ lesion recovery on follow-up. Location matched SDOCT B-scans at the fovea of the left eye of patient 2 with a foveal EZ lesion (vertical arrow) at baseline (A), 6 months (B), and 12 months (C). SDOCT B-scans at the fovea of the right eye of patient 4 with a foveal EZ lesion at baseline (arrow, increased reflectivity and thickness of the ELM) (D), 6 months (E), and 12 months (E). Scale bar = 200 µm.
Table 2.
Summary of Features Visible by Multimodal Imaging
| Patient | Eye | EZ/ELM/Confocal AOSLO/Split Detector AOSLO at Baseline | EZ/ELM/Confocal AOSLO/Split Detector AOSLO at 6 Months | EZ/ELM/Confocal AOSLO/Split Detector AOSLO at 12 Months |
|---|---|---|---|---|
| 1 | OD | – / – / – / + | 0 / 0 / 0 / 0 | – / + / + / + |
| OS | – / – / – / + | 0 / 0 / 0 / 0 | 0 / 0 / 0 / 0 | |
| 2 | OD | – / + / – / + | – / + / – / + | + / + / + / + |
| OS | – / + / – / + | – / + / – / + | + / + / – / + | |
| 3 | OD | – / + / + / + | 0 / 0 / 0 / 0 | + / + / + / + |
| OS | – / – / – / + | 0 / 0 / 0 / 0 | – / – / – / + | |
| 4 | OD | – / + / – / + | – / + / + / + | + / + / – / + |
| 5 | OD | – / + / – / + | – / + / – / + | 0 / 0 / 0 / 0 |
| 6 | OD | – / – / – / + | – / – / – / + | 0 / 0 / 0 / 0 |
| 7 | OS | – / + / – / + | 0 / 0 / 0 / 0 | – / + / 0 / 0* |
+, visible; –, not visible; 0, image not available.
At the 9-month follow-up.
Using en face SDOCT images, the mean ± standard deviation EZ lesion area at baseline across all eyes was 0.39 ± 0.58 mm2 (median, 0.11 mm2; range, 0.01–2.22 mm2), which is comparable with previous reports.8,29,30 The median baseline EZ lesion area of the four eyes that showed recovery of EZ reflectivity in one or more location-matched SDOCT B-scans on follow-up was 0.07 mm2 (interquartile range, 0.02–0.11 mm2). We next sought to examine more subtle changes to cone structure within and around the lesions using AOSLO.
To facilitate comparison of SDOCT and AOSLO images, en face SDOCT images were manually aligned with AOSLO montages and corresponding AOSLO images using blood vessel patterns (see Methods). Across all eyes imaged, we identified remnant cone inner segments within the EZ lesions (as defined by en face SDOCT) in all eyes imaged (e.g., Fig. 2D and Fig. 3). The extent of this remnant cone structure ranged from a small number of cones near the lesion boundary to cones being present throughout the lesion area. Within the lesion in the patient shown in Figure 2, we observed ambiguous hyper-reflective structure on confocal AOSLO (Fig. 2C). Using split detector AOSLO, we identified remnant cone structure within the EZ lesion (Fig. 2D). This cone structure aligned with low reflectivity areas of the confocal image, as opposed to the hyper-reflective structures (Figs. 2C, D). This finding suggests that such hyper-reflectivity within the lesion boundary seen on confocal AOSLO is not photoreceptor in origin, and may originate from the retinal pigment epithelium, as is seen in other inherited retinal degenerations.31 Although we could not track individual cones across follow-up visits, we quantified the spacing of cones within the extent of the foveal EZ lesions at baseline and all follow-up visits for six patients (nine eyes). Cone spacing ranged from 4.97 to 9.95 µm at baseline, 5.30 to 6.10 µm at 6 months, and 4.99 to 7.12 µm at 12 months. These values are well outside the normal range reported for similar eccentricities (3.15 to 4.54 µm for 0 to 300 µm eccentricity).27,32
Figure 2.

Remnant cones are present at borders and within EZ lesions. Images are from the right eye of patient 1. SDOCT B-scan with fovea EZ lesion (arrow) (A) at level of the dashed line on infrared reflectance and en face images (B). Alignment of multimodal imaging revealed hyporeflective areas containing ambiguous reflectivity in locations of EZ lesions by confocal AOSLO (C), and remnant cone structure (white arrows) within or on the borders of the EZ lesions by split detector AOSLO (dotted outlines show approximate extent of lesion) (D). The white line on SDOCT corresponds with the lateral extent of the AOSLO images. Asterisk, fovea. Scale bars = 200 µm (A–B), and 100 µm (C–D).
Figure 3.
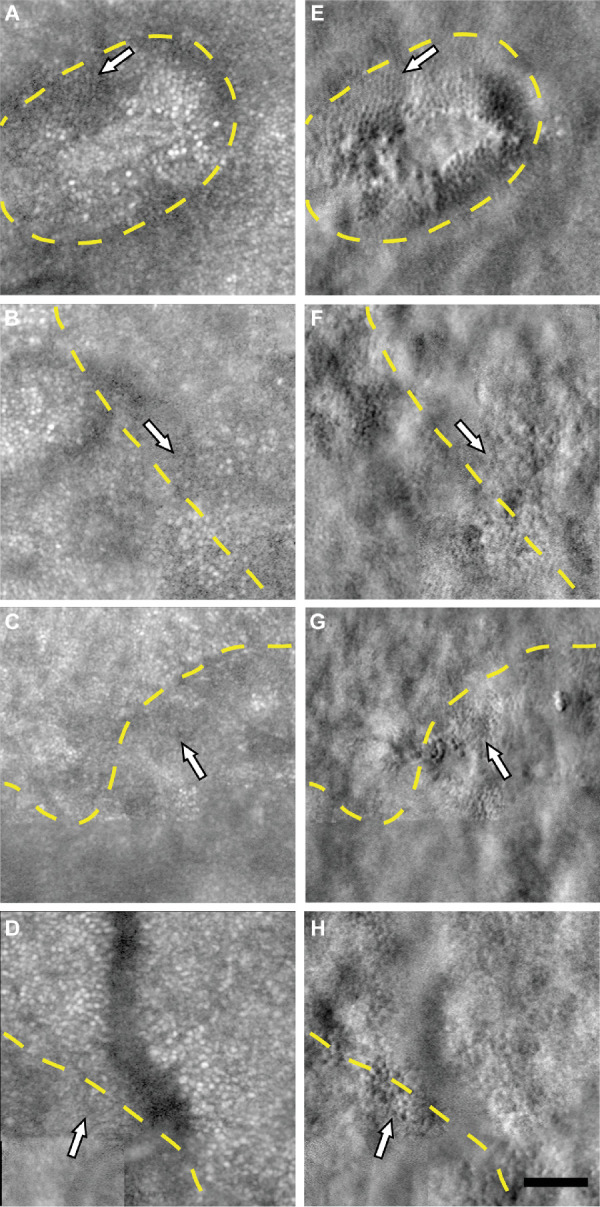
Remnant cone structure within and on borders of foveal EZ lesions. Remnant cones (white arrows) within the extent of the foveal EZ lesions (yellow dashed line) are visible on split detector AOSLO images (E–H) and not visible on logarithmically transformed confocal images (A–D) in the right eye of patient 3 at 117 µm eccentricity (A, E), left eye of patient 1 at 440 µm eccentricity (B, F), left eye of patient 2 at 166 µm eccentricity (C, G), and right eye of patient 6 at 737 µm eccentricity (D, H). Scale bar = 50 µm.
The changes observed on SDOCT over time were generally consistent with the changes in cone reflectance on confocal AOSLO. For example, in those eyes that showed evidence of recovery of EZ reflectivity on SDOCT B-scans (four eyes), cone reflectance reemerged on confocal AOSLO in regions that had previously been dark in appearance. Figure 4 shows images from a patient who had multilobular foveal EZ lesion, where one of the lesions demonstrated recovery of EZ reflectivity by SDOCT B-scans and the other remained relatively stable. In areas where the EZ reflectivity recovered, the cone mosaic reemerged on confocal AOSLO after only being visible on split detector AOSLO at baseline (Figs. 4B, 4E, and 4H, arrow). Another example is shown in Figure 5, where the lesion had a discrete hyporeflective border visible on SDOCT and confocal AOSLO at baseline and 6 months (Figs. 5B and 5E), whereas at 12 months the lesion became more poorly defined (Fig. 5H). Just nasal to the lesion, the cone mosaic became newly visible at 6 months (Fig. 5E, arrowhead), but then disappeared at the 12-month visit (Fig. 5H, arrowhead). Cones became visible at 12 months in an area temporal to the fovea that was immediately adjacent to the EZ lesion, but in an area that had decreased reflectivity at 6 months (Fig. 5, arrow). In examining the lesions that showed recovery of EZ reflectivity and recovery of cone reflectance on confocal AOSLO, we occasionally identified remnant cone structure in areas where cone reflectivity recovered at the following time point (Fig. 4F and Fig. 5F, arrow). However, because all lesions had some degree of remnant cone structure on split detector AOSLO, but only some lesions showed recovery during our 12-month follow-up, we cannot conclude that remnant cone structure is predictive of recovery of cone reflectivity on confocal AOSLO. Table 2 shows a summary of the visibility of the features (EZ, ELM, and cones) by multimodal imaging. Last, despite the dynamic appearance of the cone mosaic on AOSLO near the EZ lesions, cone density and cone spacing at 1° eccentricity outside the EZ lesion areas overlapped with previously reported normative values (Supplementary Table S2).27,32 Despite this finding, there was a significant decrease in density during follow-up (P = 0.021, linear mixed model with random eye effect) (Fig. 6).
Figure 4.

Example of EZ lesion recovery and nonrecovery in multilobular lesion. Multimodal aligned images (SDOCT B-scans, top row; confocal AOSLO, middle row; split detector AOSLO, bottom row) of foveal EZ lesions at baseline (A–C), 6 months (D–F), and 12 months (G–I) from the right eye of patient 2. The white line in (A), (D), and (G) corresponds with the lateral extent of the AOSLO images. The dashed line is at the level of SDOCT B-scans in the top row. Asterisk, foveal center. Arrows, location matched pointing to changes in lesion and change in cone structure (see text for description) with a larger view in the inset. Scale bars = 200 µm (SDOCT images), 100 µm (AOSLO images), and 25 µm (insets).
Figure 5.

EZ lesion recovery. Multimodal aligned images (SDOCT B-scans, top row; confocal AOSLO, middle row; split detector AOSLO, bottom row) of a resolving foveal EZ lesion over time from the right eye of patient 4 (Fig. 1) at baseline (A–C), 6 months (D–F), and 12 months (G–I). The white line in (A), (D), and (G) corresponds with the lateral extent of the AOSLO images. The dashed line is at the level of the SDOCT B-scans in the top row. Asterisk, foveal center. Arrows, location matched pointing to changes in lesion and change in cone structure (see text for description) with a larger view of the area surrounding the arrow in the inset. Scale bars = 200 µm (SDOCT images), 100 µm (AOSLO images), and 25 µm (inset).
Figure 6.
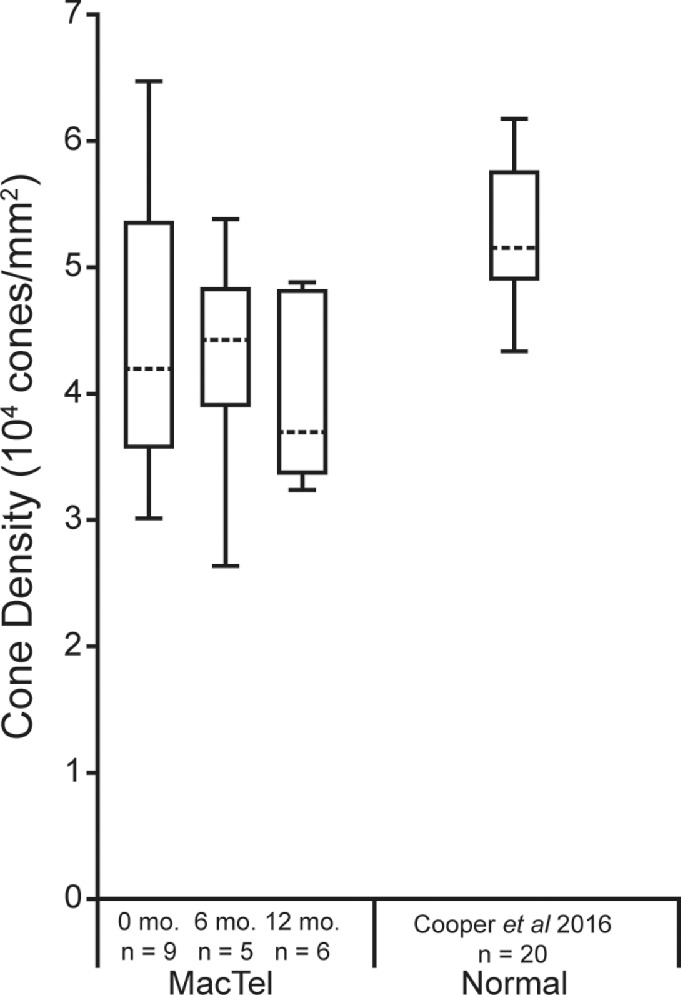
Cone density outside MacTel lesions assessed over time. Shown are the median cone densities (dashed horizontal lines) for each time point (0, 6, and 12 months) at 1° eccentricity for MacTel. The ends of the boxes are the 25th and 75th percentiles, and the whiskers span the range of data. There was statistical change in cone density over time (P = 0.021, linear mixed model with random eye effect). Sample size is listed below each time point. Median normal cone density at 300 µm from Cooper et al.27 are also plotted for comparison.
Discussion
In this study, we identified remnant cone inner segment structure within foveal EZ lesions using split detector AOSLO, despite the absence of identifiable structures on SDOCT or confocal AOSLO. These results are consistent with previous postmortem histologic reports identifying cones in an area of absent EZ reflectivity on SDOCT in an eye with MacTel.4 Wang et al.9 also observed a decrease in the size of EZ lesions on SDOCT corresponding with the presence of contiguous cone arrays on confocal AOSLO in two patients with MacTel, and Heeren et al.8 observed one eye with a regression of EZ lesion of 0.04 mm2 per year.
Aside from recovery in EZ reflectivity, our results provide further evidence for the presence of remnant cone structure that is not visible on standard ophthalmic imaging. In all eyes at baseline, remnant cone structure was identified within or at the border of at least one EZ lesion on split detector but not on confocal AOSLO. The spacing of the remnant cone structure identified within these EZ lesions was larger than normal.27 Split detector AOSLO has been used previously to image remnant cone structure at the borders of atrophic lesions, where cone structure abruptly terminates, in choroideremia.33 In our study, clusters of cones became visible at follow-up examinations on confocal AOSLO in areas previously identified as intralesional on SDOCT. These changes on confocal AOSLO have been reported previously,9 but the mechanism for this change remains unclear. It is possible, but improbable, that new cones are forming in these locations. Another possibility is that cones could migrate from the perilesional region. The cone density in surrounding areas was similar to normal cone density at 1° eccentricity,34 yet significantly decreased over follow-up. Similarly, cone spacing at these locations overlapped with previously reported values in similar locations.27,32 Therefore, despite our small sample size, we cannot rule out migration of nearby cones toward the lesion boundary or actual loss of cells owing to disease progression. The most likely mechanism for this phenomenon may be that the cones are dysflective; that is, cones are present but lose reflectivity on standard confocal AOSLO imaging owing to inherent structural or functional abnormalities or changes in the local microenvironment.7 Because we did not measure cone function, this might not be the case for all cones within the EZ lesions, however, and warrants direct functional testing such as that done by Wang et al.,9 combined with split detector AOSLO. In many cases, these clusters of cones were visible on split detector AOSLO at previous visits. Reappearing cones on confocal AOSLO had a corresponding recovery of EZ (see Fig. 4), but an intact EZ was not always associated with the appearance of cones on confocal AOSLO (see Fig. 5). As we observed, cone structure on split detector AOSLO does not always correspond with an intact EZ as evident in EZ lesions, but are present in areas of recovered EZ. Because the visibility of these purported dysflective cones on different modalities is altered as compared with normal cones, this finding suggests that the environment surrounding the cones may be undergoing dynamic changes, possibly from intraretinal fluid from inner retinal cavitations,35 vascular abnormalities,6 subretinal debris,36 or Müller cell dysfunction,3,4 causing an alteration in the optical properties of cones in those locations. Such changes may also affect the directionality of cones within the EZ lesion, which may be visible through the use of directional OCT,37 which was not used in this study. Additionally, such alterations may affect the waveguiding of cones and their visibility on confocal AOSLO.38 It is also important to note that the resolution limit of split detector AOSLO imaging may affect the visibility of normal cones in the fovea where they are tightly packed.22 Cones adjacent to small foveal EZ lesions may not be easily visible by split detector AOSLO, yet visible by confocal AOSLO.
Although this study was not designed to assess EZ lesion size, longitudinal assessment over 12 months using multimodal imaging suggested recovery of EZ reflectivity in four of the six eyes imaged at follow-up. Although the baseline size of the EZ lesions in our study is within the range reported for MacTel, it was on the smaller end of the spectrum reported in the MacTel registry.29,39 It is also important to note that recovery of EZ reflectivity was only observed in EZ lesions smaller than 0.16 mm2, which is the lower inclusion limit in the current treatment trials. Small lesions are more prone to imaging variability (e.g., minor displacements of B-scans, resulting in imprecise spacing) than larger lesions. Thus, some of the observed recovery of the EZ lesions might be artefactual, although the concomitant recovery of AOSLO reflectivity in some cases argues against this notion. It seems likely, however, that this waxing and waning phenomenon is a feature of smaller EZ lesions. Natural history studies that examine EZ lesion appearance at shorter time intervals, with more dense OCT sampling patterns, and review of clinical trial baseline groups may help to elucidate this phenomenon further.
Because only patients from the MacTel registry with small discrete EZ lesions were targeted for this study, our findings may not be generalizable to all patients with MacTel, particularly those with large and/or irregular EZ lesions. It is likely that this small subgroup of patients is not representative of all possible phenotypes of MacTel (thereby introducing selection bias). Although it is now possible to identify remnant cone structure on multimodal imaging, it is unclear where this recovery in EZ reflectivity lies on the disease trajectory. It may be akin to a slow flickering light bulb before it dies, but whether future EZ losses recur in the same location is unknown. It is possible that a genetically or metabolically distinct subgroup has more potential for cone recovery than others. Furthermore, the function of individual cones within the small EZ lesions in the patients in our study remains to be determined. Previous studies have demonstrated that visual acuity is not a good indicator of disease progression in MacTel, because the foveal center might not always be contained in a scotoma.40 In our study, the only patient with improved best-corrected visual acuity and recovery of EZ reflectivity (patient 4) had a lesion that included the anatomic fovea. Further studies using AOSLO microperimetry in eyes with EZ recovery such as Wang et al.,9 which has already demonstrated visual sensitivity in areas with varying degrees of cone reflectivity on confocal AOSLO, and no visual sensitivity in areas without ELM will help to map out the extent of visual function in these dysflective cone regions.7
An absence of the EZ, as observed in this study, and in other retinal conditions,11,12,41 needs careful interpretation because it does not always indicate an absence of underlying cone structure. For example, in achromatopsia, the EZ is not a good indicator of underlying remnant cone structure, especially in cases with a hyporeflective zone or absent EZ at the fovea, where remnant cone structure is present on split detector AOSLO.12 In some conditions, the integrity of the ELM may help to predict the presence of remnant cones on SDOCT. Previous studies have shown that, in idiopathic macular holes, the presence of the ELM was necessary for restoration of the EZ after macular hole repair surgery.42–44 In our study, the ELM overlying EZ lesions was continuous in all eyes with recovery of EZ reflectivity, although not all lesions with an intact ELM proceeded to have cone recovery at 12 months. This finding suggests that an intact ELM only increases the probability of EZ recovery at 12 months. Longer studies may be necessary to show whether an intact ELM predicts cone recovery after 12 months. In MacTel, areas of absent EZ have been correlated with rod loss in postmortem histology.4 Because our study only focused on EZ lesions at the fovea, it remains to be determined if EZ lesions outside of the fovea in locations with higher rod density show evidence of recovery of reflectivity as well. Importantly, our findings relate not only to diseases like MacTel, but may also translate to other degenerative retinal diseases (e.g., retinitis pigmentosa, hydroxychloroquine toxicity, Stargardt disease, and age-related macular degeneration), which rely on SDOCT biomarkers, such as retained EZ width,45–48 as evidence of disease progression and surrogate markers of visual function.
Supplementary Material
Acknowledgments
The authors thank Sergey Tarmia for helpful contributions to the statistical analysis.
Supported by the Lowy Medical Research Institute (LMRI) and the Wellcome Trust [099173/Z/12/Z]. Research reported in this publication was supported by the National Eye Institute of the National Institutes of Health under award numbers R01EY017607, P30EY001931, and UL1TR001436. The content is solely the responsibility of the authors and does not necessarily represent the official views of the National Institutes of Health. CE, MM, AK, NS, TK, and MK are supported by the NIHR Biomedical Research Centre at Moorfields Eye Hospital NHS Foundation Trust and UCL Institute of Ophthalmology and the NIHR Moorfields Clinical Research Facility. The views expressed are those of the author(s) and not necessarily those of the NHS, the NIHR, the Department of Health, or LMRI.
Presented at the Lowy Medical Research Institute annual meeting, New York, NY, 2017 and 2018, and ARVO annual meeting, Baltimore, MD, 2017 and Honolulu, HI, 2018.
Disclosure: K.M. Litts, None; M. Okada, Allergan, Bayer; T.F.C. Heeren, Heidelberg Engineering (S); A. Kalitzeos, None; V. Rocco, None; R.R. Mastey, None; N. Singh, None; T. Kane, None; M. Kasilian, None; M. Fruttiger, None; M. Michaelides, None; J. Carroll, None; C. Egan, Heidelberg Engineering (R), Novartis (F), Haag-Streit (R)
References
- 1. Gass JD, Oyakawa RT. Idiopathic juxtafoveolar retinal telangiectasis. Arch Ophthalmol. 1982; 100: 769–780. [DOI] [PubMed] [Google Scholar]
- 2. Charbel Issa P, Berendschot TT, Staurenghi G, Holz FG, Scholl HP. Confocal blue reflectance imaging in type 2 idiopathic macular telangiectasia. Invest Ophthalmol Vis Sci. 2008; 49: 1172–1177. [DOI] [PubMed] [Google Scholar]
- 3. Powner MB, Gillies MC, Tretiach M, et al.. Perifoveal muller cell depletion in a case of macular telangiectasia type 2. Ophthalmology. 2010; 117: 2407–2416. [DOI] [PMC free article] [PubMed] [Google Scholar]
- 4. Powner MB, Gillies MC, Zhu M, Vevis K, Hunyor AP, Fruttiger M. Loss of Muller's cells and photoreceptors in macular telangiectasia type 2. Ophthalmology. 2013; 120: 2344–2352. [DOI] [PubMed] [Google Scholar]
- 5. Scerri TS, Quaglieri A, Cai C, et al.. Genome-wide analyses identify common variants associated with macular telangiectasia type 2. Nat Genet. 2017; 49: 559–567. [DOI] [PubMed] [Google Scholar]
- 6. Charbel Issa P, Gillies MC, Chew EY, et al.. Macular telangiectasia type 2. Prog Retin Eye Res. 2013; 34: 49–77. [DOI] [PMC free article] [PubMed] [Google Scholar]
- 7. Tu JH, Foote KG, Lujan BJ, et al.. Dysflective cones: visual function and cone reflectivity in long-term follow-up of acute bilateral foveolitis. Am J Ophthalmol Case Rep. 2017; 7: 14–19. [DOI] [PMC free article] [PubMed] [Google Scholar]
- 8. Heeren TFC, Kitka D, Florea D, et al.. Longitudinal correlation of ellipsoid zone loss and functional loss in macular telangiectasia type 2. Retina. 2018; 38(Suppl 1): S20–S26. [DOI] [PMC free article] [PubMed] [Google Scholar]
- 9. Wang Q, Tuten WS, Lujan BJ, et al.. Adaptive optics microperimetry and OCT images show preserved function and recovery of cone visibility in macular telangiectasia type 2 retinal lesions. Invest Ophthalmol Vis Sci. 2015; 56: 778–786. [DOI] [PMC free article] [PubMed] [Google Scholar]
- 10. Kupitz EH, Heeren TF, Holz FG, Charbel Issa P. Poor long-term outcome of anti-vascular endothelial growth factor therapy in nonproliferative macular telangiectasia type 2. Retina. 2015; 35: 2619–2626. [DOI] [PubMed] [Google Scholar]
- 11. Scoles D, Flatter JA, Cooper RF, et al.. Assessing photoreceptor structure associated with ellipsoid zone disruptions visualized with optical coherence tomography. Retina. 2016; 36: 91–103. [DOI] [PMC free article] [PubMed] [Google Scholar]
- 12. Langlo CS, Patterson EJ, Higgins BP, et al.. Residual foveal cone structure in CNGB3-associated achromatopsia. Invest Ophthalmol Vis Sci. 2016; 57: 3984–3995. [DOI] [PMC free article] [PubMed] [Google Scholar]
- 13. Rewbury R, Hughes E, Purbrick R, Prior S, Baron M. Poppers: legal highs with questionable contents? A case series of poppers maculopathy. Br J Ophthalmol. 2017; 101: 1530–1534. [DOI] [PubMed] [Google Scholar]
- 14. Pahlitzsch M, Mai C, Joussen AM, Bergholz R. Poppers maculopathy: complete restitution of macular changes in oct after drug abstinence. Semin Ophthalmol. 2016; 31: 479–484. [DOI] [PubMed] [Google Scholar]
- 15. Zhang L, Zheng A, Nie H, et al.. Laser-induced photic injury phenocopies macular dystrophy. Ophthalmic Genet. 2016; 37: 59–67. [DOI] [PMC free article] [PubMed] [Google Scholar]
- 16. Hossein M, Bonyadi J, Soheilian R, Soheilian M, Peyman GA. SD-OCT features of laser pointer maculopathy before and after systemic corticosteroid therapy. Ophthalmic Surg Lasers Imaging Retina. 2011; 42: e135–e138. [DOI] [PubMed] [Google Scholar]
- 17. Clemons TE, Gillies MC, Chew EY, et al.. Baseline characteristics of participants in the natural history study of macular telangiectasia (MacTel) MacTel Project Report No. 2. Ophthalmic Epidemiol. 2010; 17: 66–73. [DOI] [PMC free article] [PubMed] [Google Scholar]
- 18. Early Treatment Diabetic Retinopathy Study Research Group. Photocoagulation for diabetic macular edema. Early Treatment Diabetic Retinopathy Study report number 1. Arch Ophthalmol. 1985; 103: 1796–1806. [PubMed] [Google Scholar]
- 19. Early Treatment Diabetic Retinopathy Study Research Group. Treatment techniques and clinical guidelines for photocoagulation of diabetic macular edema. Early Treatment Diabetic Retinopathy Study Report Number 2. Ophthalmology. 1987; 94: 761–774. [DOI] [PubMed] [Google Scholar]
- 20. Dubra A, Sulai Y. Reflective afocal broadband adaptive optics scanning ophthalmoscope. Biomed Opt Express. 2011; 2: 1757–1768. [DOI] [PMC free article] [PubMed] [Google Scholar]
- 21. Tanna P, Kasilian M, Strauss R, et al.. Reliability and repeatability of cone density measurements in patients with Stargardt disease and RPGR-associated retinopathy. Invest Ophthalmol Vis Sci. 2017; 58: 3608–3615. [DOI] [PMC free article] [PubMed] [Google Scholar]
- 22. Scoles D, Sulai YN, Langlo CS, et al.. In vivo imaging of human cone photoreceptor inner segments. Invest Ophthalmol Vis Sci. 2014; 55: 4244–4251. [DOI] [PMC free article] [PubMed] [Google Scholar]
- 23. Dubra A, Harvey Z. Registration of 2D images from fast scanning ophthalmic instruments. In: Fischer B, Dawant B, Lorenz C, eds. Biomedical Image Registration. Berlin: Springer-Verlag; 2010: 60–71. [Google Scholar]
- 24. Salmon AE, Cooper RF, Langlo CS, Baghaie A, Dubra A, Carroll J. An automated reference frame selection (ARFS) algorithm for cone imaging with adaptive optics scanning light ophthalmoscopy. Transl Vis Sci Technol. 2017; 6: 9. [DOI] [PMC free article] [PubMed] [Google Scholar]
- 25. Chen M, Cooper RF, Han GK, Gee J, Brainard DH, Morgan JI. Multi-modal automatic montaging of adaptive optics retinal images. Biomed Opt Express. 2016; 7: 4899–4918. [DOI] [PMC free article] [PubMed] [Google Scholar]
- 26. Litts KM, Georgiou M, Langlo CS, et al. Interocular symmetry of foveal cone topography in congenital achromatopsia. Curr Eye Res. 2020: 1–8. [DOI] [PMC free article] [PubMed] [Google Scholar]
- 27. Cooper RF, Wilk MA, Tarima S, Carroll J. Evaluating descriptive metrics of the human cone mosaic. Invest Ophthalmol Vis Sci. 2016; 57: 2992–3001. [DOI] [PMC free article] [PubMed] [Google Scholar]
- 28. Yannuzzi LA, Bardal AM, Freund KB, Chen KJ, Eandi CM, Blodi B. Idiopathic macular telangiectasia. Arch Ophthalmol. 2006; 124: 450–460. [DOI] [PubMed] [Google Scholar]
- 29. Sallo FB, Peto T, Egan C, et al.. The IS/OS junction layer in the natural history of type 2 idiopathic macular telangiectasia. Invest Ophthalmol Vis Sci. 2012; 53: 7889–7895. [DOI] [PMC free article] [PubMed] [Google Scholar]
- 30. Sallo FB, Peto T, Egan C, et al.. “En face” OCT imaging of the IS/OS junction line in type 2 idiopathic macular telangiestasia. Invest Ophthalmol Vis Sci. 2012; 53: 6145–6152. [DOI] [PMC free article] [PubMed] [Google Scholar]
- 31. Roorda A, Zhang Y, Duncan JL. High-resolution in vivo imaging of the RPE mosaic in eyes with retinal disease. Invest Ophthalmol Vis Sci. 2007; 48: 2297–2303. [DOI] [PubMed] [Google Scholar]
- 32. Zayit-Soudry S, Sippl-Swezey N, Porco T, et al.. Repeatability of cone spacing measures in eye with inherited retinal degenerations. Invest Ophthalmol Vis Sci. 2015; 56: 6179–6189. [DOI] [PubMed] [Google Scholar]
- 33. Sun LW, Johnson RD, Williams V, et al.. Multimodal imaging of photoreceptor structure in choroideremia. PLoS One. 2016; 11: e0167526. [DOI] [PMC free article] [PubMed] [Google Scholar]
- 34. Curcio CA, Sloan KR, Kalina RE, Hendrickson AE. Human photoreceptor topography. J Comp Neurol. 1990; 292: 497–523. [DOI] [PubMed] [Google Scholar]
- 35. Spaide RF, Suzuki M, Yannuzzi LA, Matet A, Behar-Cohen F. Volume-rendered angiographic and structural optical coherence tomography angiography of macular telangiectasia type 2. Retina. 2017; 37: 424–435. [DOI] [PubMed] [Google Scholar]
- 36. Powner MB, Woods SM, Zhu M, et al.. Fundus-wide subretinal and pigment epithelial abnormalities in macular telangiectasia type 2. Retina. 2018; 38 Suppl 1: S105–S113. [DOI] [PubMed] [Google Scholar]
- 37. Lujan BJ, Roorda A, Knighton RW, Carroll J. Revealing Henle's fiber layer using spectral domain optical coherence tomography. Invest Ophthalmol Vis Sci. 2011; 52: 1486–1492. [DOI] [PMC free article] [PubMed] [Google Scholar]
- 38. Roorda A, Williams DR. Optical fiber properties of individual human cones. J Vis. 2002; 2: 404–412. [DOI] [PubMed] [Google Scholar]
- 39. Heeren TF, Holz FG, Charbel Issa P. First symptoms and their age of onset in macular telangiectasia type 2. Retina. 2014; 34: 916–919. [DOI] [PubMed] [Google Scholar]
- 40. Heeren TF, Clemons T, Scholl HP, Bird AC, Holz FG, Charbel Issa P. Progression of vision loss in macular telangiectasia type 2. Invest Ophthalmol Vis Sci. 2015; 56: 3905–3912. [DOI] [PubMed] [Google Scholar]
- 41. Sun LW, Johnson RD, Langlo CS, et al.. Assessing photoreceptor structure in retinitis pigmentosa and Usher syndrome. Invest Ophthalmol Vis Sci. 2016; 57: 2428–2442. [DOI] [PMC free article] [PubMed] [Google Scholar]
- 42. Ooka E, Mitamura Y, Baba T, Kitahashi M, Oshitari T, Yamamoto S. Foveal microstructure on spectral-domain optical coherence tomographic images and visual function after macular hole surgery. Am J Ophthalmol. 2011; 152: 283–290. [DOI] [PubMed] [Google Scholar]
- 43. Mitamura Y, Mitamura-Aizawa S, Katome T, et al.. Photoreceptor impairment and restoration on optical coherence tomographic image. J Ophthalmol. 2013; 2013:ePub. [DOI] [PMC free article] [PubMed] [Google Scholar]
- 44. Houly JR, Veloso CE, Passos E, Nehemy MB. Quantitative analysis of external limiting membrane, ellipsoid zone and interdigitation zone defects in patients with macular holes. Graefes Arch Clin Exp Ophthalmol. 2017; 255: 1297–1306. [DOI] [PubMed] [Google Scholar]
- 45. Cai CX, Locke KG, Ramachandran R, Birch DG, Hood DC. A comparison of progressive loss of the ellipsoid zone (EZ) band in autosomal dominant and X-linked retinitis pigmentosa. Invest Ophthalmol Vis Sci. 2014; 55: 7417–7422. [DOI] [PMC free article] [PubMed] [Google Scholar]
- 46. Ahn SJ, Joung J, Lee BR. En face optical coherence tomography imaging of the photoreceptor layers in hydroxychloroquine retinopathy. Am J Ophthalmol. 2018; 199: 71–81. [DOI] [PubMed] [Google Scholar]
- 47. Tee JJL, Carroll J, Webster AR, Michaelides M. Quantitative analysis of retinal structure using spectral domain optical coherence tomography in RPGR-associated retinopathy. Am J Ophthalmol. 2017; 178: 18–26. [DOI] [PMC free article] [PubMed] [Google Scholar]
- 48. Aizawa S, Mitamura Y, Baba T, Hagiwara A, Ogata K, Yamamoto S. Correlation between visual function and photoreceptor inner/outer segment junction in patients with retinitis pigmentosa. Eye (Lond). 2009; 23: 304–308. [DOI] [PubMed] [Google Scholar]
Associated Data
This section collects any data citations, data availability statements, or supplementary materials included in this article.