Abstract
Understanding metabolism is indispensable to unraveling the mechanistic basis of many physiological and pathological processes. However, in situ metabolic imaging tools are still lacking. Herein we introduce a framework for mid-infrared (MIR) metabolic imaging by coupling the emerging high-information-throughput MIR microscopy with specifically designed IR-active vibrational probes. Three categories of small vibrational tags including azide bond, 13C-edited carbonyl bond and deuterium-labeled probes are presented to interrogate various metabolic activities in cells, small organisms and mice. Two MIR imaging platforms are implemented including broadband Fourier transform infrared (FTIR) microscopy and discrete frequency infrared (DFIR) microscopy with a newly incorporated spectral region (2000–2300 cm−1). Our technique is uniquely suited for metabolic imaging with high-information-throughput. In particular, we performed single-cell metabolic profiling including heterogeneity characterization, and large-area metabolic imaging at tissue/organ level with rich spectral information.
Editor’s summary
Small vibrational tags (azide, 13C-edited carbonyl, and deuterium-labeled probes) were introduced as metabolic probes for mid-infrared imaging. The tags allow unprecedented in situ visualization of metabolism in cells and animals with high information-throughput.
Genetics and metabolism are two defining characteristics of life. Indeed, understanding metabolism is indispensable to unraveling mechanistic basis of many biological processes, such as development, homeostasis and response to stimuli1–3. After all, it is the synthesis, transformation and degradation of biomolecules (i.e. metabolism) inside each cell that carry out the genetic blueprint. Besides physiology, metabolism also plays a key role in many diseases, including neurodegenerative diseases4, diabetes5 and cancer6.
Despite the importance of metabolism, imaging tools to map in situ metabolic activities are relatively limited. Magnetic resonance spectroscopy and positron emission tomography lack sufficient spatial resolution to obtain cellular information7. Fluorescence microscopy offers subcellular resolution but requires bulky fluorophore labeling, which is often perturbative to metabolite functions in vivo. Mass spectrometry imaging is destructive and requires long analysis time8. Raman microscopy, especially the emerging Stimulated Raman Scattering (SRS), coupled with Raman-active probes has opened up a broad range of applications of metabolic imaging9–16. Unfortunately, Raman-based metabolic imaging is limited by the extremely small Raman cross section at the level of 10−30 ~10−28 cm2. As a result, the achievable information throughput of Raman technique is still far from ideal, because of either slow imaging speed or limited spectral coverage.
Herein we offer an alternative approach to metabolic imaging by performing mid-infrared (MIR) microscopy coupled with IR-active probes. A key premise is that IR absorption cross sections are about 1010 times larger than their Raman couterparts17–19. More importantly, driven by two major technologies, MIR microscopy has undergone a rapid revolution in instrumentation towards high information throughput. On the detector side, multi-pixel detectors known as Focal-Plane-Array (FPA) have revolutionized the use of Fourier transform infrared (FTIR) imaging20. On the light source side, high-power quantum cascade lasers (QCL) render a new paradigm called discrete frequency mid-infrared (DFIR) imaging with video-rate acquisition speed21,22. However, the prevailing paradigm in MIR microscopy is label-free imaging. Very few attempts were reported under low-throughput modality with deuterated fatty acids23,24 or metal carbonyls25. Leveraging the high-information-throughput MIR microscopy, we introduced a set of specifically designed probes to demonstrate applications along single-cell metabolic profiling and large-scale tissue metabolic imaging. Beyond FTIR and DFIR, our framework can be readily translated to other MIR imaging schemes.
Design of IR-active probes for metabolic imaging in cells, small organisms and mice
Several IR-active moieties such as metal carbonyl and nitriles have been studied as vibrational probes with IR spectroscopy18,26,27. They are particularly useful as reporters of local environment such as the electric field inside biomolecules19. Although the concept of IR probes has been around in the spectroscopy literature, they are rarely explored for metabolic imaging especially to study animal physiology. Herein, we propose three categories of small vibrational tags for metabolic tracking of various pathways including azide bond, 13C isotope-edited carbonyl bond and deuterium-labeled probes.
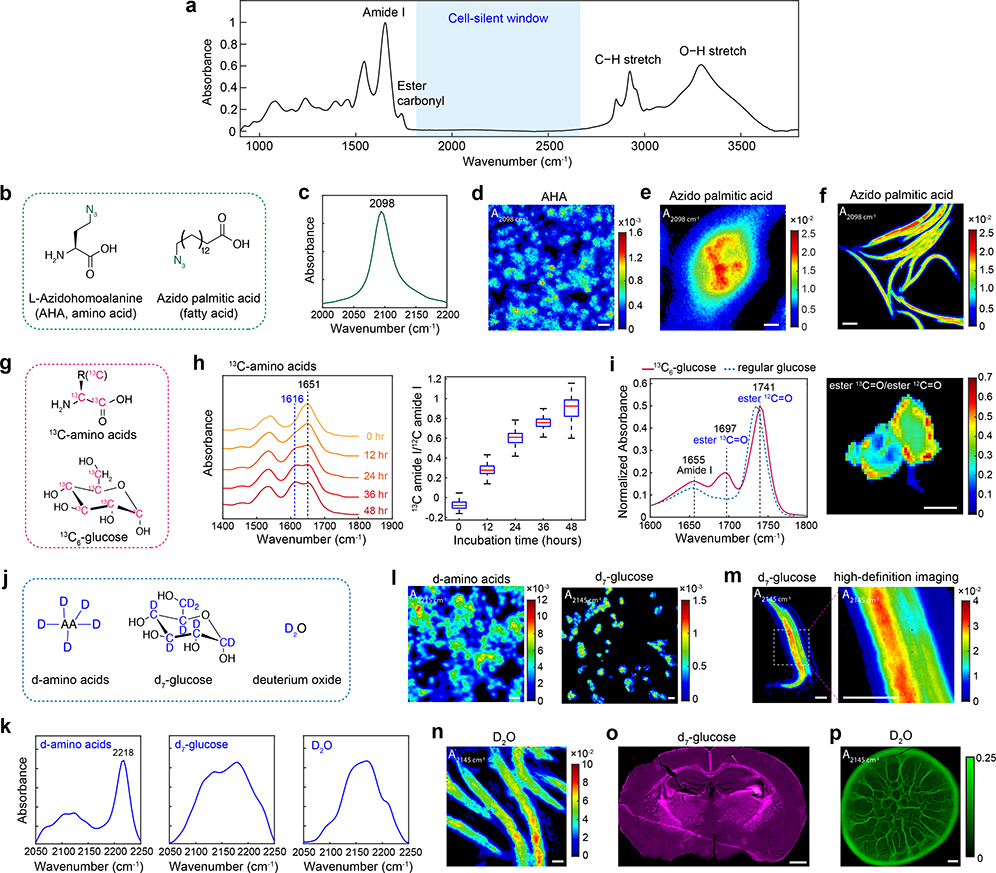
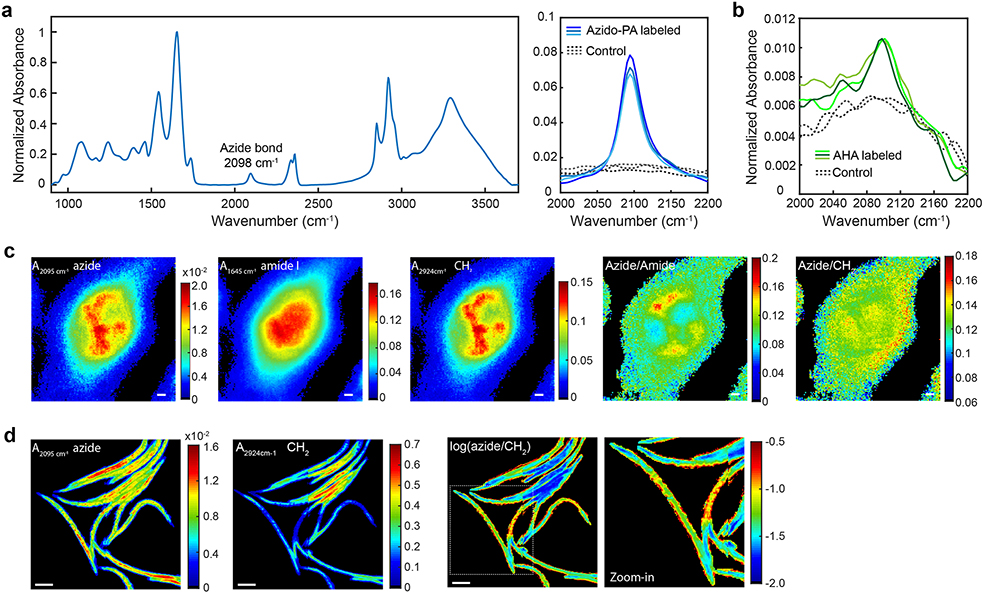
The azide bond is a desirable IR tag for a specific metabolite. It exhibits a single, narrow and strong IR band in the cell-silent window (Fig. 1a). Its large molar extinction coefficient (ε) about 400 M−1cm−1 18 corresponds to a cross section of 1.5×10⁻¹⁸ cm2, which is 10 orders higher than the Raman scattering cross section of alkyne bonds. Moreover, azide is chemically inert and nearly absent inside cells, hence the bioorthogonality. Indeed, many azide-labeled precursors have been established for bioorthogonal chemistry, in which alkyne-fused probes can react with the azide functional group, proving their minimal toxicity and high biocompatibility in vivo28. Here we demonstrate the utility of the azide tag for MIR metabolic imaging, for the first time to our knowledge, by using an azide-tagged methionine analog, azidohomoalanine (AHA), and an azide-labeled palmitic acid as two examples (Fig. 1b). By incubating the azide probe with cells, a single peak emerges at 2098 cm−1 (Fig. 1c and Extended Data Fig. 1a–b). The cellular distribution of newly synthesized proteome can be visualized by using a single type of amino acid with AHA (Fig. 1d). High-definition imaging can also be achieved for azido-palmitic acid with a ~3-μm diffraction-limited resolution. (Fig. 1e and Extended Data Fig. 1c). At the whole-organism level, active incorporation of the azido-palmitic acid into lipids in Caenorhabditits elegans can also be visualized (Fig. 1f and Extended Data Fig. 1d).
Fig. 1 |. Design of MIR probes for metabolic imaging in cells, small organisms and mice.
a, A typical IR absorption spectrum of biological samples. Cell-silent window: 1800–2700 cm−1, where no peak exists from endogenous biomolecules. b, Metabolic precursors with azide probe. c, A single narrow azide peak in the cell-silent window. d, Imaging of newly synthesized protein in macrophage Raw264.7 cells with AHA. e, High-definition imaging of fatty acid uptake in a single Raw264.7 cell with azido-palmitic acid. f, Imaging of fatty acid incorporation into C. elegans with azido-palmitic acid. g, Precursors with 13C substitution for forming metabolism-induced 13C carbonyl probe. h, Visualization on protein synthesis rate with 13C-amino acids in MDA-MB-468 cells. (Right panel) The ratio of two peaks were analyzed among pixels. i, Visualization of de novo lipogenesis in differentiated 3T3-L1 adipocytes with 13C-glucose. A 13C ester peak appears at 1741 cm−1 when 13C6-glucose was added. Lipogenesis rate can be calculated by the ratio map of ester 13C=O over ester 12C=O. j, Metabolic precursors with carbon-deuterium probe. k, Spectral characterization of incorporated CD probes. d-amino acids were imaged inside mammalian cells. d7-glucose and D2O were acquired by anabolic activity of E. coli bacteria. l, Imaging of d-amino acids and d7-glucose in MDA-MB-468 cells. m, High definition imaging of d7-glucose anabolic activity in C. elegans. n, Imaging of D2O-derived biosynthesis in C. elegans. o, Imaging glucose anabolic activity in whole brain with d7-glucose. The image was generated by integrating the CD band as 2060–2220 cm−1. p, Imaging metabolic activity of a 4-day old Pseudomonas aeruginosa colony biofilm labeled with D2O and imaged with a 4x objective (20.2 μm pixel size). Scale bars: 40 μm in d, i, l-n; 10 μm in e; 100 μm in f; 1 mm in o, p.
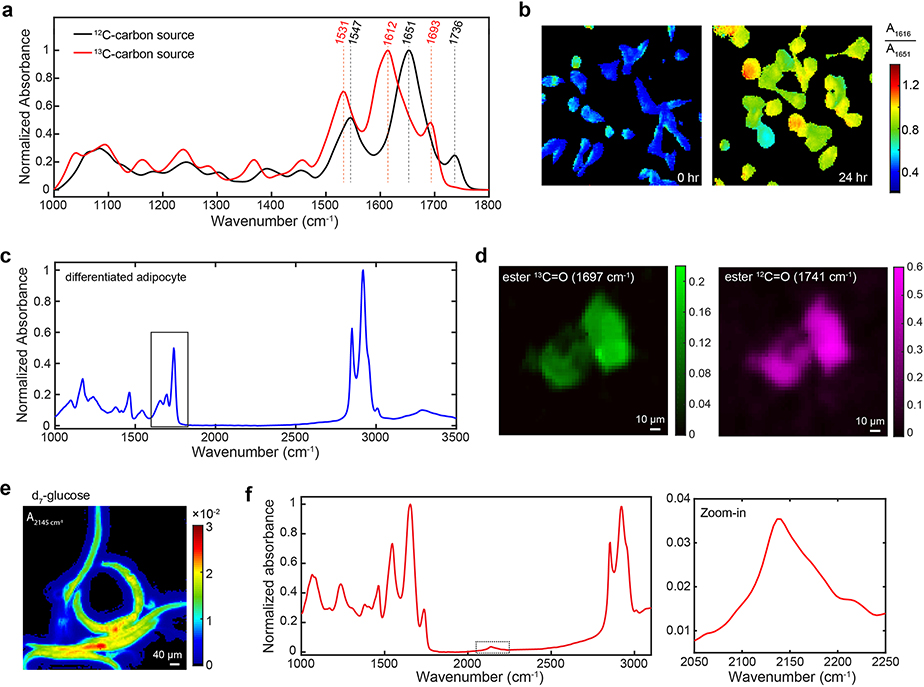
There are two design considerations behind 13C-edited carbonyl bond. First, the carbonyl bond is arguably the strongest IR mode in biomolecules. Indeed, amide I and ester carbonyl exhibit high ε around 800 M−1cm−1 and 290 M−1cm−1, respectively29. Second, carbonyl bonds in newly synthesized biomolecules can be shifted away from endogenous components by 30–40 cm−1 if 13C-substituted essential metabolites are administrated30, thereby reporting metabolic activities. Here we employ 13C-amino acids (13C-AA) and 13C-glucose as two metabolism-mediated vibrational probes (Fig. 1g). We first characterized the spectral shift in bacteria when 13C6-glucose was supplied as the only carbon source. As expected, the amide I band redshifted to 1616 cm−1 from 1651 cm−1 and the lipid ester band redshifted to 1693 cm−1 from 1736 cm−1 (Extended Data Fig. 2a). When 13C-AA is supplied to cultured mammalian cells, the original 12C amide drops whereas the new 13C amide peak rises with incubation time, with their ratio reflecting the protein turnover rate (Fig. 1h and Extended Data Fig. 2b). Moreover, we imaged glucose-derived de novo lipogenesis in 3T3-L1 differentiated adipocytes by monitoring the redshift of the ester carbonyl band during anabolism of 13C-glucose (Fig. 1i and Extended Data Fig. 2c–d).
While the IR ε is relatively low (~10 M−1cm−1) for C–D bonds18, deuterium-labeled probes are effective for economical delivery and labeling for animal experiments. Recent SRS work has reported exciting animal physiology applications by using heavy water (D2O) and d7-glucose15,16. We realize that these Raman probes also possess IR activity. For MIR metabolic imaging, we measured the FTIR spectra of incorporated C–D bonds from metabolic precursors including deuterated amino acids (d-AA), d7-glucose and D2O (Fig. 1j–k). With these deuterium-labeled probes, FTIR imaging is capable to track in situ metabolic activities with subcellular resolution in cells and multicellular organisms (Fig. 1l–n and Extended Data Fig. 2e). Importantly, metabolism of complex samples can be interrogated. For example, by administrating d7-glucose to the drinking water for lactating mice, glucose anabolism can be detected with FTIR in the brains of pup mice during embryonic and postnatal development (Fig. 1o and Extended Data Fig. 2f). For another example, D2O labeling allows for the quantification of global biosynthetic activity during Pseudomonas aeruginosa colony biofilm growth (Fig. 1p).
MIR microscopy as a complementary platform to Raman for high-information-throughput imaging
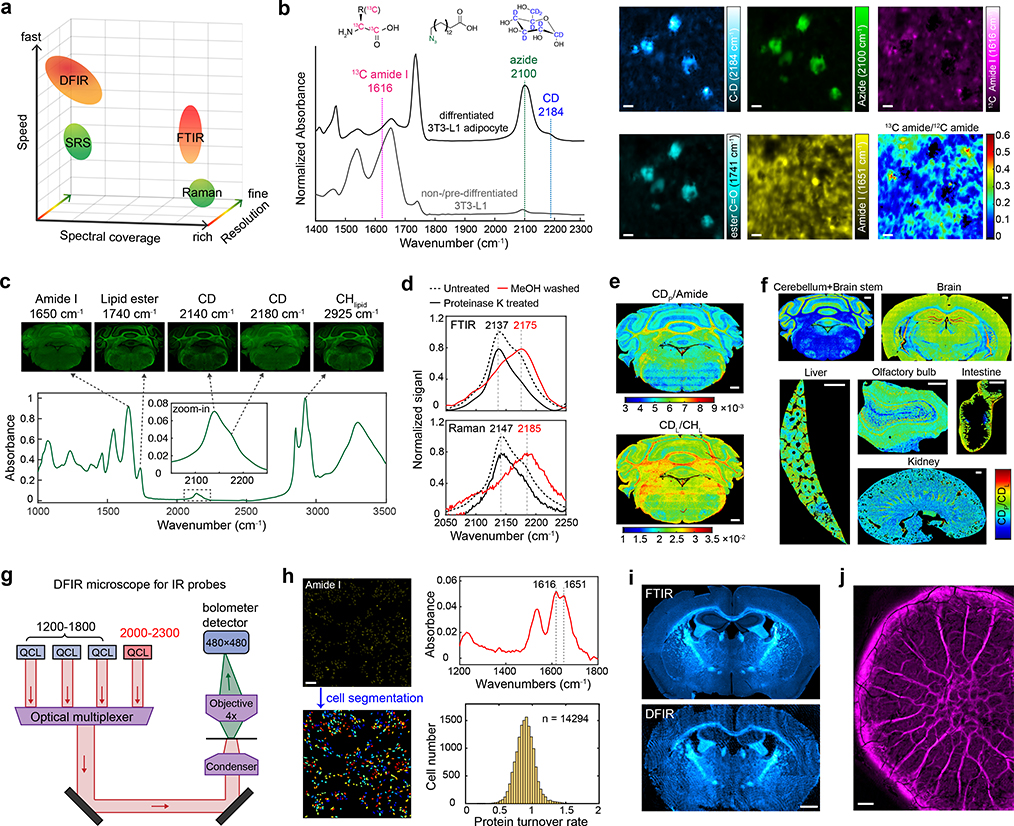
Raman microscopy is hindered by low information throughput, because of either limited spectral coverage or slow imaging speed (Fig. 2a). Spontaneous Raman captures broadband spectral information but suffers from intrinsically slow imaging speed. SRS microscopy boosts the image acquisition speed via stimulated vibrational excitation by 1000-fold31. As a trade-off, however, the spectral coverage is relatively narrow even with hyperspectral acquisition12. Moreover, as a nonlinear process, SRS requires tight laser focusing and point scanning, which is generally slow for large-area imaging. In comparison, MIR imaging can offer substantially higher information throughput (Fig. 2a), thanks to 1010 times larger IR absorption cross sections and FPA-enabled wide-field detection scheme. Similar to spontaneous Raman, FTIR microscopy is able to acquire a full vibrational spectrum but with faster speed. Analogues to SRS, high-power QCL allows selective excitation with 100~1000 acceleration per frequency over FTIR21,32.
Fig. 2 |. MIR metabolic imaging with high information throughput.
a, Comparison of MIR imaging techniques (FTIR and DFIR) with Raman imaging techniques (SRS and spontaneous Raman) in terms of imaging speed, spectral coverage and spatial resolution. While MIR techniques have poorer resolutions than Raman, they generally exhibit faster imaging speed or broader spectral coverage. b, Three-color metabolic probe imaging in differentiated 3T3-L1 adipocytes with 13C-amino acid (13C-AA), azido-palmitic acid (azido-PA) and d7-glucose. Spectral features of three probes are highlighted. c, Multiplexed imaging of macromolecules synthesis activity in cerebellum of D2O-labeled mouse. d, IR absorption and Raman spectra of cerebellum tissue treated with methanol wash (D-labeled protein signal in red) and proteinase K digestion (D-labeled lipid signal in solid black). e, Protein and lipid synthesis rate can be visualized by CDP/Amide and CDL/CHL on cerebellum tissue. CDP and CDL are CD band absorbance after spectral unmixing, Amide is absorbance of amide I peak at 1650 cm−1 and CHL is absorbance of CH2 peak at 2924 cm−1. f, FTIR coupled with D2O labeling enables tracking of in vivo protein and lipid synthesis on varied organs (cerebellum, brain stem, brain, liver, olfactory bulb, intestine and kidney). g, DFIR microscope customized for excitation of vibrational probes. h, DFIR imaging with 13C-AA for single-cell protein synthesis activity profiling. MD-MA-468 cells were cultured in 13C-AA medium for 24 hrs. i, Comparison on imaging CD probe in D2O-labeled brain tissue with FTIR and DFIR. Image was generated as absorbance at 2140 cm−1 with baseline corrected. j, DFIR imaging on D2O-labeled biofilm. The signal was generated as absorbance at 2150 cm−1 with baseline corrected. Scale bars, 40 μm in b; 500 μm in e and f; 200 μm in h; 1 mm in i and j.
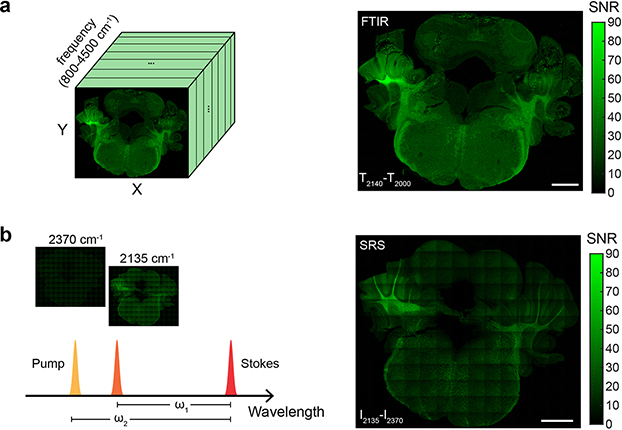
It is helpful to experimentally benchmark the imaging speed (defined as area imaged per unit time) between broadband (i.e., full spectral acquisition) FTIR and single-frequency SRS, especially in the context of metabolic imaging. D2O-labeled mouse tissue is used as the common sample, as C–D bond is both Raman and IR active. After adjusting imaging parameters of two techniques to achieve similar signal-to-noise ratio from the same tissue region, broadband FTIR with ~3.3 μm pixel size offers comparable imaging speed to single-frequency SRS with ~1 μm pixel size (Extended Data Fig. 3). This comparison is based on standard instruments, and more discussions on high-speed versions can be found in the literature12,33. Briefly, while the spatial resolution of SRS is expectedly finer, FTIR could be more advantageous to accommodate the full spectral coverage in a single scan (Fig. 2a).
Technical demonstration of multiplexed FTIR metabolic imaging with vibrational probes
Leveraging the full spectral coverage of FTIR, we demonstrate multiplexed metabolic imaging with dynamic information. It is important that the three categories of vibrational probes that we introduced can be spectrally captured by FTIR simultaneously. As a proof-of-concept demonstration, we achieved three-color imaging on protein, lipid and carbohydrate metabolism. By culturing the differentiated adipocytes with a medium containing 13C-AA, azido-palmitic acid and d7-glucose, nascent protein synthesis, lipid scavenging and glucose anabolism can be monitored all at once at 1616 cm−1, 2100 cm−1 and 2180 cm−1 (Fig. 2b). Compared to pre-adipocytes, differentiated adipocytes are highly active both in glucose-derived de novo lipogenesis and in lipid scavenging through azido-palmitic acid. For protein synthesis, an opposite trend in pre-adipocytes than adipocytes was observed based on the ratio map of 13C amide/12C amide (Fig. 2b). Our results collectively suggest adipocytes are metabolically specialized cells that utilize large amounts of glucose and fatty acids rather than amino acids for biomass production34.
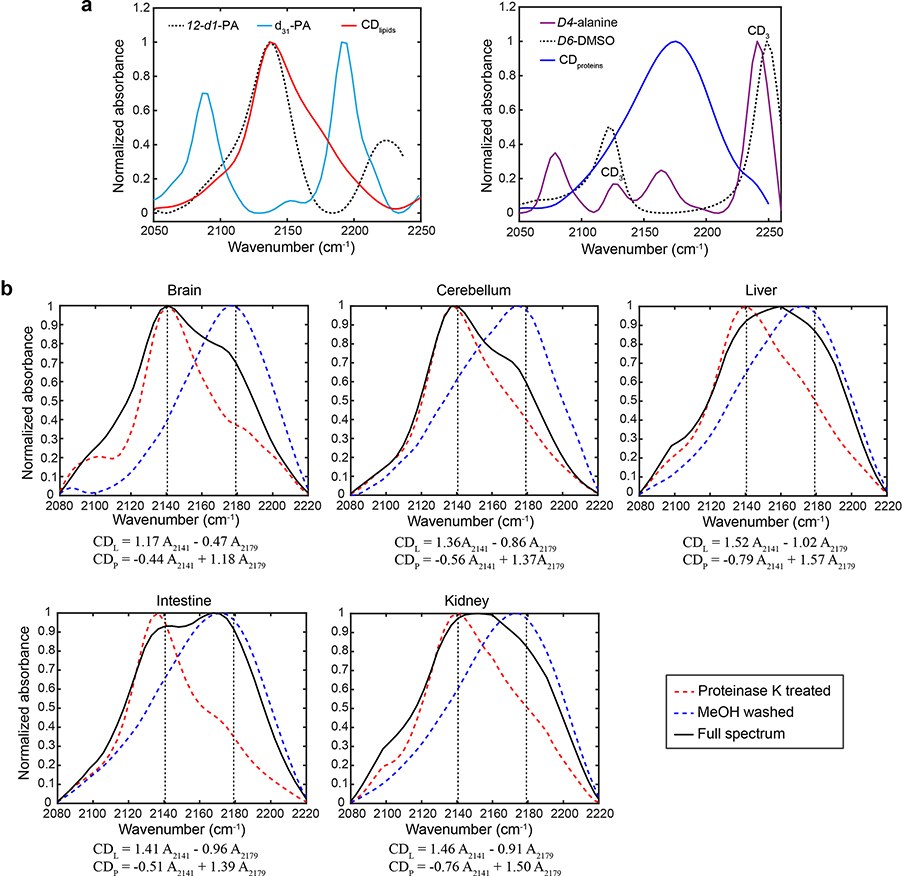
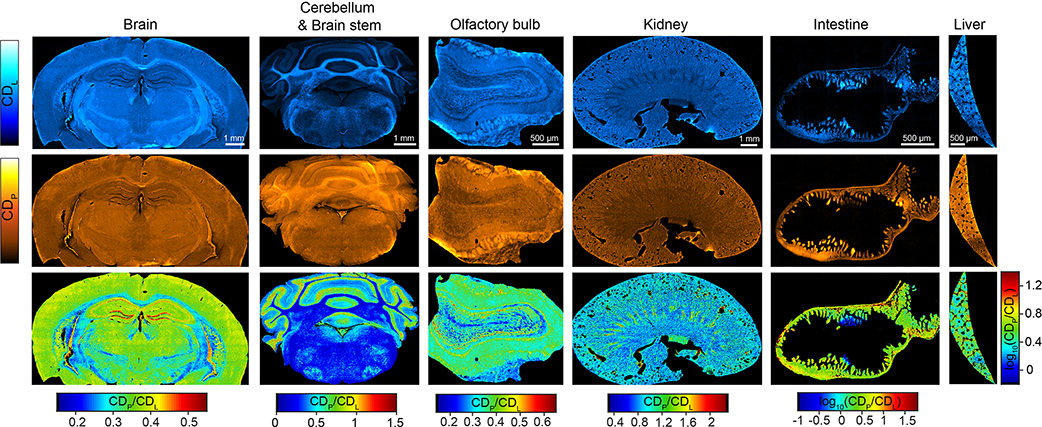
Multiplexed imaging on macromolecule biosynthesis in mice can be accomplished with D2O probing. D2O is a universal metabolic probe participating in synthesis of a variety of C–D bond containing macromolecules. By feeding mice with 25% D2O in drinking water (a tested safe level35,36), we can monitor CD signal accumulation in different organs. Fig. 2c presents the FTIR spectrum and images from the cerebellum tissue of D2O-labeled mice. A broad peak appears around 2140 cm−1, together with a shoulder peak at 2175 cm−1 with distinct image patterns. We reasoned the two peaks are from different macromolecules. To verify the chemical origin, we digested the protein with proteinase K or dissolved lipids with methanol, and then acquired the spectra of the resulting tissues and compared to solution standard (Extended Data Fig. 4a). Consequently, the 2140 cm−1 and 2175 cm−1 peaks are attributed to lipids and protein respectively, in agreement with Raman characterization (Fig. 2d). A linear unmixing algorithm (Extended Data Fig. 4b) was used to retrieve the D2O-dereived protein synthesis signal (CDP) and de novo lipid synthesis signal (CDL). As a result, protein and lipid synthesis activities can be visualized in situ by ratio maps as CDP/Amide and CDL/CHL, respectively (Fig. 2e). Furthermore, we generated a tissue-atlas of macromolecule synthesis (Fig. 2f, Extended Data Fig. 5).
Technical demonstration of DFIR metabolic imaging with vibrational probes
The superb acquisition speed of DFIR originates from two aspects. First, the tunable QCL can collect images at single frequencies. Second, the unprecedented light intensity of QCL renders it compatible with larger-area bolometer detector. DFIR has been recently commercialized with four QCL modules covering the fingerprint region of 900–1800 cm−1. To detect our vibrational probes in the cell-silent window, modified laser modules ranging from 1200–1800 cm−1 and 2000–2300 cm−1 were utilized with a 4× objective (pixel size=4.25 μm) optimized for the new spectral regions (Fig. 2g).
To showcase DFIR microscopy in the context of vibrational probes, we first demonstrate single-cell profiling of nascent protein synthesis by giving cells 13C-AA. Single-cell segmentation can be readily achieved under such resolution (Fig. 2h). A new 13C amide I peak appears at 1616 cm−1 (Fig. 2h), in consistent with FTIR measurement (Fig. 1h). The protein turnover rate of 14,000 segmented cells can be analyzed by DFIR in 2–3 minutes (Fig. 2h, from 1500–1800 cm−1), representing an unprecedented throughput for chemical analysis of single cells.
Fast metabolic imaging of large-area tissues is another utility of DFIR microscopy. We compared the DFIR imaging result with the FTIR on probing D2O-labeled mouse brain tissue. The image pattern from DFIR matches well with the FTIR result (Fig. 2i). Regarding acquisition speed, it only takes DFIR less than 10 seconds to image the whole brain tissue with an area of 6×10-mm2 at a single frequency and about 3 min for the 2000–2300 cm−1 range, which will require ~50 min for broadband FTIR (8 co-scans of signal). This remarkable imaging speed enables efficient large-scale imaging as demonstrated by mapping the heterogeneous CD pattern from D2O-labeled P. aeruginosa biofilms (Fig. 2j). We note the DFIR images have some speckle patterns under the widefield configuration. This can be potentially mitigated by spatial noise dephasing21,37 or point scanning system33,38.
Application of single-cell metabolic profiling
Single-cell analysis can visualize hidden information beyond population average. We showcase the applications of our technique in single-cell metabolic profiling. MIR microscopy has intrinsic advantage in single-cell quantification, as it can readily yield single-cell spectra by integrating the entire cell volume naturally in the transmission mode with suitable cell-level resolution. Besides, vibrational probes reveal valuable metabolic information. Moreover, its high throughput capability is imperative for unveiling cellular heterogeneity which intrinsically requires analysis on a large cell population.
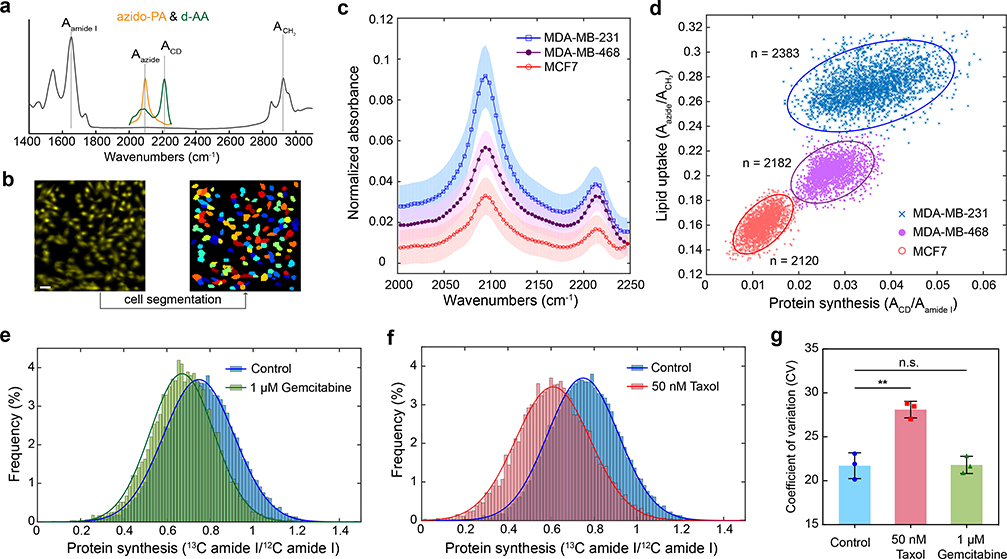
We demonstrate cell subtyping by probing metabolism. Breast cancer has multiple subtypes primarily classified by three receptors as estrogen receptor (ER), progesterone receptor (PR), and human epithelial growth receptor 2 (HER2). Three different breast cancer cell lines as MCF-7 (ER+, PR+, HER2−), MDA-MB-468 (ER−, PR−, HER2−) and MDA-MB-231 (ER−, PR−, HER2−) were cultured with a medium containing d-AA and 100 μM azido-palmitic acid (Fig. 3a). After cell segmentation (Fig. 3b), single-cell spectra were generated by summing up all pixels inside (Fig. 3c). Remarkably, a two-dimensional scatter plot based on the lipid uptake and protein synthesis of individual cells present three clearly separable clusters (Fig. 3d), indicating distinct metabolic profiles between these three cell subtypes. The revealed order of metabolic activities agrees with the characterized aggressiveness: MCF-7 is non-invasive, MDA-MB-468 is metastatic, and MDA-MB-231 is highly metastatic39. Moreover, the most aggressive MDA-MB-231 appears most heterogeneous (i.e., wider spread of the cluster) especially on the protein synthesis rate (Fig. 3d).
Fig. 3 |. Single-cell metabolic profiling with FTIR and DFIR imaging.
a, Spectrum for azido-PA and d-AA probes, allowing simultaneous two-color profiling. b, Example of single-cell segmentation for FTIR imaging with pixel size of 3.3 μm. Scale bar, 40 μm. c, Single-cell FTIR spectra on the probe region (normalize to amide I intensity) for three subtypes of human breast cancer cells. Shaded area indicates the s.d. of FTIR spectrum from different single cells (n=45 cells for each subtype). d, Two-dimensional scatter plot on single-cell metabolic activity of three cell subtypes. X-axis is the protein synthesis rate calculated as ACD/Aamide I and y-axis is the lipid uptake rate calculated as Aazide/ACH2. Each dot represents single-cell information. Cells were cultured in CD-DMEM medium with 100 μM azido-PA for 24 hours. Solid lines are error ellipses with 99% confidence. Cell numbers for MCF-7 is 2,120, for MDA-MB-468 is 2,182, for MDA-MB-231 is 2,383. e,f, Histogram of protein synthesis rate (calculated as 13C amide I/12C amide I) for MDA-MB-231 cells, collected by DFIR imaging, labeled with 13C-AA for 24 hours under conditions of no treatment and 1 μM gemcitabine for 24 hours (e) and no treatment and 50 nM Taxol for 24 hours (f). The solid curves were fitted with normal distribution. For control, μ=0.748, σ=0.164; for gemcitabine, μ=0.670, σ=0.148; for Taxol, μ=0.609, σ=0.173. g, CV values (means±s.d., n=3 cell cultures) of the single-cell protein synthesis rate distributions under control, 50-nM Taxol 24 hours and 1-μM gemcitabine 24 hours. Heterogeneity was elevated under 50 nM Taxol 24 hours (**P =0.0054) but not changed under 1 μM gemcitabine 24 hours (n.s., P=0.9359). P-values were calculated from two-tailed Welch’s t-test. Cell numbers for each control group is 4,651, 7,756 and 6,671; for taxol treatment is 3,023, 6,195 and 6,018; for gemcitabine treatment is 3,414, 4,146 and 4,483.
We then harness high-speed DFIR to characterize metabolic heterogeneity during chemotherapeutic drug treatment (Taxol, a microtubule inhibitor; and gemcitabine, a deoxycytidine analog). We have shown that DFIR can collect selective spectrum over 10,000 cells in several minutes (Fig. 2h). For this drug study, MDA-MB-231 cells were exposed to Taxol or gemcitabine together with 13C-AA labeling for 24 hours. Low drug concentrations were used to assure cell viability. As expected, the protein synthesis activity was inhibited under both drug treatments (Fig. 3e–f). Additionally, the cellular metabolic heterogeneity can be evaluated by the coefficient of variation (CV, the ratio between standard deviation to the mean) (Fig. 3g). For instance, higher metabolic heterogeneity (larger CV) was observed under Taxol treatment. The high throughput of DFIR is essential to this finding of heterogeneity.
Application of metabolic imaging on brain development and tumor progression
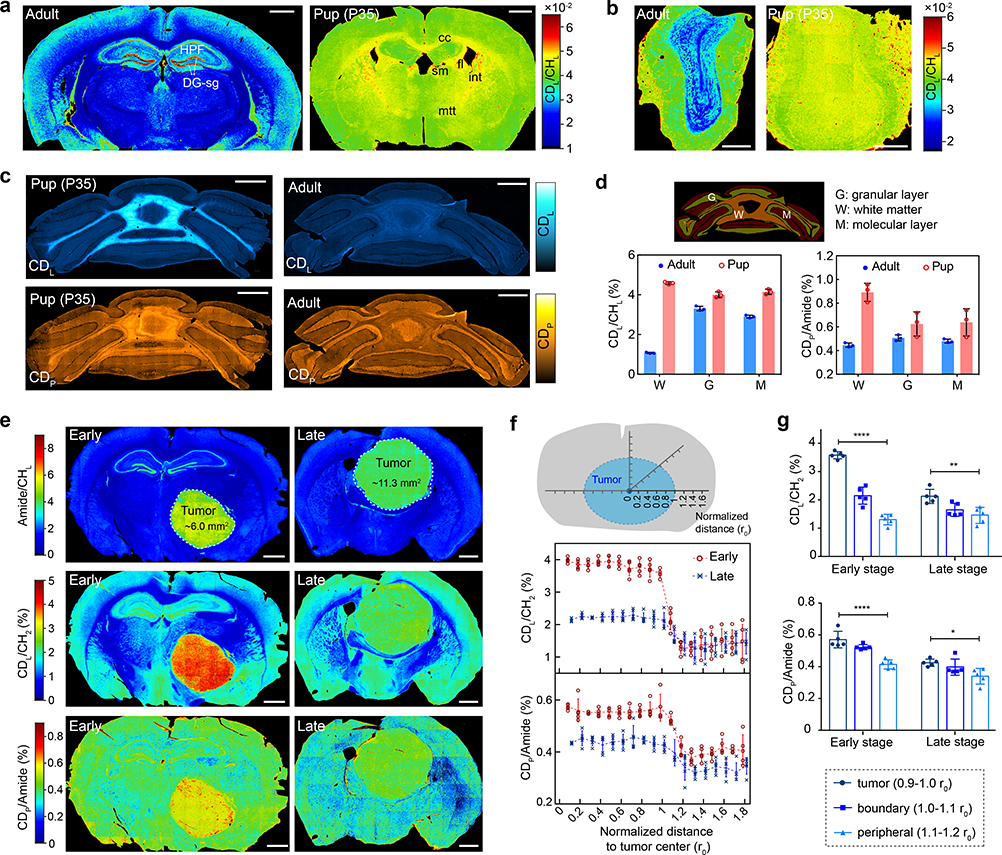
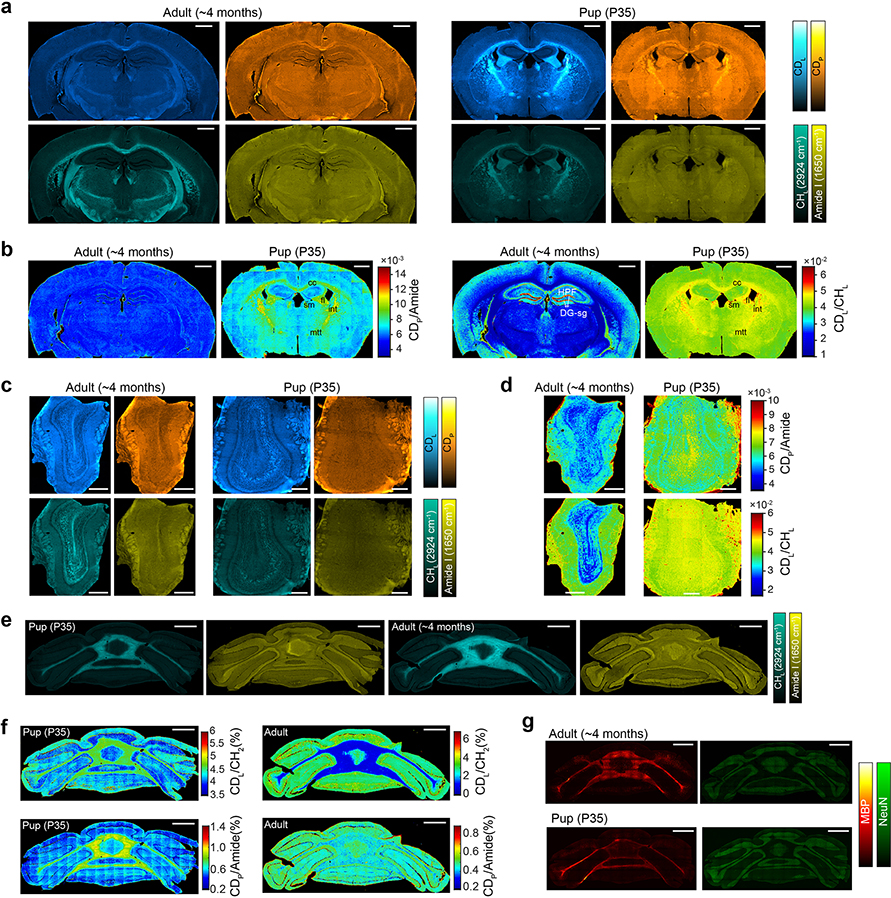
Metabolic activities are tightly linked to regulation of brain development. We obtained FTIR images from different brain regions of juvenile and adult mice, which were administered with 25% D2O in drinking water for the same duration. The full spectral coverage of FTIR allows us to calculate the ratio maps as CDL/CHL and CDP/Amide, which readily generate metabolic activities of the whole brain tissue (Fig. 4a–d and Extended Data Fig. 6). Regional alterations were found for the juvenile mouse compared with the adult mouse (Fig. 4a and Extended Data Fig. 6a–b). Interestingly, the granule cell layer of dentate gyrus (DG-sg) of hippocampus (HPF), a main neurogenic area of adult brain, has substantially elevated lipid synthesis in adult mouse (Fig. 4a and Extended Data Fig. 6b). This finding is consistent with previous report that lipogenesis plays a critical role for proliferating neural stem and progenitor cells participating in adult neurogenesis40. Moreover, multi-layer structure from the surface to the center of olfactory bulb can be visualized by lipid channels (Fig. 4b and Extended Data Fig. 6c–d).
Fig. 4 |. Application of MIR metabolic imaging on brain development and tumor progression.
a-c, FTIR imaging of metabolic activity in mouse brain (a), olfactory bulb (b) and cerebellum (c) from P35 (35 days postnatal, 25% D2O in drinking water for P1-P35) and adults (~4 months old, 25% D2O in drinking water labeled for 35 days). a, the juvenile’s brain has higher protein and lipid activities compared with the adult mouse especially in corpus callosum (cc), fimbria (fi), stria medullaris (sm), internal capsule (int) and mammilothalmic tract (mtt). d, Means±s.d. of lipid (CDL/CHL) and protein (CDP/Amide) synthesis activity at different regions of cerebellum (n=3 tissue samples). e, FTIR imaging of lipid and protein synthesis at two stages of glioblastoma tumor progression. Left column is the early stage and right column is the late stage. Margins of the tumors are marked in the first row with calculated solid tumor area size inside. f, Means±s.d. of lipid (CDL/CHL) and protein (CDP/Amide) synthesis activity with the normalized distance to the tumor center (n=5 selected directions). CDL/CHL and CDP/Amide at each distance r were averaged among (r−0.1 r0) to r region. r0 is the radius of solid tumor along this direction. g, test on lipid and protein synthesis rate at the tumor region (0.9–1.0 r0), boundary region (1.0–1.1 r0) and peripheral brain region (1.1–1.2 r0). One-way analysis of variance: CDL/CHL of the early stage: ****P=4.84×10⁻⁹, F=140; CDL/CHL of the late stage: **P=0.00373, F=9.24; CDP/Amide of the early stage: ****P=5.80×10⁻⁵, F=24.5; CDP/Amide of the late stage: *P=0.0262, F=5.01. Scale bars, 1 mm.
Myelination is an important developmental process whose timing is tightly regulated41. As an optimal model to study myelination, cerebellum has orderly and relatively simple architecture. Striking difference can be readily observed by comparing the CDP and CDL between juvenile and adult mouse (Fig. 4c): high synthesis activity during myelination development in juvenile mouse cerebellum while little turnover in adult mouse. In contrast, the distributions of label-free channels are not much different (Extended Data Fig. 6e). Zooming into different regions inside cerebellum, myelination is not only restricted on the thick fibers but also expanded to the granular and even molecular layer on the parallel fibers during this P1-P35 window (Fig. 4d and Supplementary Fig. 1). This agrees with the literature that smallest axons become myelinated after P20 41. Interestingly, protein synthesis is also more active during myelination especially in white matter, which may due to the required local synthesis of specialized protein such as myelin basic protein (Fig. 4d and Extended Data Fig. 6f–g).
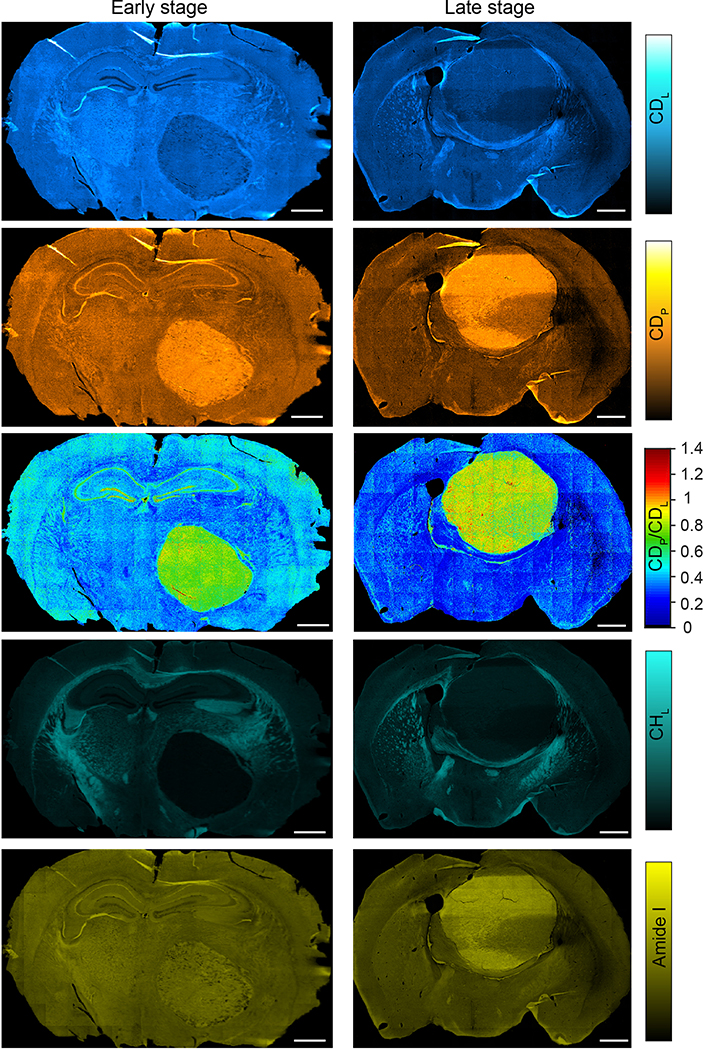
Tumor progression and metastasis is a principal cause of cancer mortality. Glioblastoma multiforme (GBM) is one of the most aggressive tumors with unparalleled infiltration capability into normal brain tissue. The tumor margin of GBM has been visualized by label-free vibrational imaging based on lipid and protein compositional difference between tumor and normal cells42. Rather than measuring the static chemical compositions, we reason the anabolic activity could be a unique marker to visualize tumor progression. In order to probe different stages of tumor progression, 25% D2O was given to the GBM-bearing mice for 15 days starting at different days of post injection of U-87 human glioma cells. The tumor core can be clearly identified by Amide/CHL (Fig. 4e and Extended Data Fig. 7). Lipid and protein synthesis rates are evaluated by the ratio images as CDL/CHL and CDP/Amide, respectively (Fig. 4e). Quantitatively, metabolic activity curves were plotted with normalized distance to the tumor center for different tumor stages (Fig. 4f). At the early stage, both lipid and protein turnover exhibit step-like decrease going from tumor center to normal brain tissues (Fig. 4f–g). As the size of tumor core increases, metabolic difference between tumor and peripheral tissue starts to decrease, and the tumor margin becomes blurred (Fig. 4f–g). This observation is consistent with prior work that lipogenesis43 and increased protein synthesis44 have been suggested during carcinogenesis.
Discussion
Label-free imaging has been the prevalent paradigm of MIR microscopy. Albeit powerful, they offer limited information about metabolic dynamics of specific pathways. Here we introduced a set of small vibrational probes, enabling new functional capabilities to image metabolic activity in situ. Two high-information-throughput MIR platforms of FTIR and DFIR are demonstrated. Although the current resolution (~3 μm) is poorer than Raman-based techniques, MIR methods are superior in spectral coverage and imaging speed (Fig. 2). Importantly, FTIR microscopes are commercially available and our DFIR is a custom-modified commercial system, rendering readily accessible to biologists. It should be straightforward to translate our probes to other high-resolution schemes such as mid-infrared photothermal45, mid-infrared photoacoustic46 and atomic force microscopy infrared-spectroscopy47, enabling submicron to nanoscale metabolic imaging. Additionally, MIR imaging is also able to image live cells and small organisms22,48. Other new detection schemes like photoacoustic46,49 and field-resolved infrared spectroscopy50, which are noninvasive and water-background free, could be rather promising for in vivo applications in large animals.
Probe-wise, azide bond, 13C-edited carbonyl bond and 2H-labeled probes are complementary with different utilities (Fig. 1). First, spectrally resolvable probes allow multiplexed metabolic imaging. Second, multifaceted functional purposes can be probed. For example, while an azide probe allows for the tracking of the metabolism of a specific metabolite (including methionine and palmitic acid demonstrated here, as well as many other targets such as chemical drugs), 13C-carbonyl bond of amide I and ester carbonyl derived from 13C-AA and 13C-glucose can map global proteome and lipid synthesis activities. For another example, d7-glucose and 13C-glucose track hydrogen flow and carbon flow of glucose metabolism, respectively. Third, for metabolism-mediated probes (such as 13C-AA, 13C glucose and D2O), the targeted IR modes only appear after metabolism of labeled precursors, which is meaningful in monitoring particular biosynthetic pathways. Fourth, the in vivo delivery and bio-distribution are different for different probes. For instance, although the resulting MIR signal is less pronounced than azide or carbonyl bonds in cultured cells, D2O and d7-glucose are particularly effective for studying animal physiology.
Application-wise, MIR-based metabolic imaging is uniquely suited for studies in which fast speed or rich spectral information is essential whereas submicron resolution is not necessary. This could open up a broad range of applications. For example, metabolic activity profiling could be performed at the single-cell level. The high-content, high-throughput capability is imperative to cell type classification and heterogeneity characterization (Fig. 3). In addition, tissue-level metabolic imaging can be carried out on a large area that is compatible to the whole organ level (Fig. 4), which can facilitate comprehensive and holistic biological understanding.
Methods
Cell lines and materials
All cell lines were purchased from ATCC including HeLa (ATCC CCL-2), Raw264.7 (ATCC TIB-71), MDA-MB-231 (ATCC HTB-26), MDA-MB-468(ATCC HTB-132), MCF7 (ATCC HTB-22), 3T3-L1 MBX (ATCC CRL-3242), U-87 MG (ATCC HTB-14). Azido-palmitic acid (1346) and L-Azidohomoalanine (1066) were purchased from Click chemistry tools. D-glucose (1,2,3,4,5,6,6-D7, 97–98%, DLM-2062), algal amino acid mixture (U-13C, 97–99%, CLM-1548), 2-deoxy-D-glucose (U-13C6, 99%, CLM-10466) were purchased from Cambridge isotope laboratories. Deuterium oxide (151882), Taxol (T7402) and Gemcitabine (G6423) were purchased from Sigma-Aldrich. DMEM medium (11965), FBS (10082), penicillin/streptomycin (1514), DMEM medium without L-methionine, L-cysteine and L-glutamine (21013), DMEM without glucose (11966) and proteinase K (EO0491) were purchased from ThermoFisher Scientific. CaF2 substrates (CAFP25–1, CAFP13–1 and CAFP-76–26-1U) were purchased from Crystran.
FTIR and DFIR microscopy, image acquisition and data pre-processing
Agilent Cary 620 Imaging FTIR equipped with an Agilent 670-IR spectrometer and 128×128-pixels Focal Plane Array (FPA) HgCdTe (mercury cadmium telluride, MCT) detector was used in the transmission mode. A background spectrum was collected on a clean CaF2 substrate using 128–256 scans at 8 cm−1 spectral resolution. Sample spectra were recorded using 64–128 scans for cells and 8–32 scans for tissues at 8 cm−1 spectral resolution. 25× IR objective (pixel size=3.3 μm, 0.81 numerical aperture (NA)) and 15× IR objective (pixel size=5.5 μm, 0.62 NA) were used for cell and tissue imaging. 4× IR objective (pixel size=20.2 μm) was used for P. aeruginosa biofilm imaging. High-definition FTIR imaging was collected at pixel size of 0.66 μm with 25× IR objective under high-magnification mode achieved through second magnification with intermediate optics. For probes around 2100 cm−1, the resolution can be estimated as . Data pre-processing was carried out using commercial software Cytospec with following steps: 1) de-noise the spectra with PCA noise reduction; 2) quality test based on full spectral integration; 3) rubber-band baseline correction or polynomial baseline correction was applied for spectral correction.
For DFIR imaging, a custom-modified Spero-QT microscope (Daylight Solutions, Inc.) is equipped with 4 quantum cascade laser modules with spectral coverage from 1200–1800 cm−1 and 2000–2300 cm−1. The microscope is constantly purged with dry nitrogen and a plastic box was implemented to cover the sample compartment. A 4× IR objective (pixel size=4.25 μm, 0.3 NA) and a non-N2-liquid cooled microbolometer FPA with 480×480 pixels were applied for all data collection on the transmission mode. For spectral sweeping, data was collected with 4 cm−1 spectral resolution. As for data pre-processing, cell spectra were corrected by subtracting the off-resonance signal as the absorbance at 1800 cm−1. For tissue imaging with D2O probing, a linear baseline correction was applied for the 2000–2300 cm−1 region. The fringe patterns from the coherent QCL source were further de-noised by minimum noise fraction (MNF) transform with stripe noise pattern using commercial software Epina ImageLab.
Stimulated Raman scattering (SRS) microscopy
Synchronized pump (tunable from 720–990 nm) and Stokes (fixed at 1064.2 nm) beams with both 6-ps pulse width and 80-MHz repetition rate are provided by a picoEmerald system from APE (Applied Physics & Electronic, Inc.). The intensity of the 1,064 nm Stokes beam was modulated sinusoidally by a built-in electro-optic modulator (EOM) at 8 MHz with a modulation depth of more than 95%. Spatially and temporally-overlapped pump and Stokes beams were coupled into an inverted laser-scanning microscope (FV1200MPE, Olympus). A 25× water objective (XLPlan N, 1.05 NA, MP, Olympus) was used. The forward-going pump and Stokes beams after passing through the samples were collected in transmission with a condenser (oil immersion, 1.4 NA, Olympus). A large-area (10 mm ×10 mm) Si photodiode (FDS1010, Thorlabs) was used for pump intensity detection after filtering the Stokes beam completely with two high-optical-density bandpass filter (890/220 CARS, Chroma Technology). The output current of the photodiode was then sent to a fast lock-in amplifier (HF2LI, Zurich Instruments) for signal demodulation.
Probe preparation and media recipe for cell labeling
Palmitic acid-BSA solution
couple azido-palmitic acid with BSA to prepare a 2-mM stock solution. Prepare 20 mM sodium palmitic acid (PA) solution by dissolving PA in NaOH solution with the following recipe: azido-PA (5.5 mg) + 1.0 mL dd-H2O + 35 μL 1 M NaOH. Mix and incubate the solution in 70°C water baths till no oil droplets are visible. Then slowly add the sodium PA solution into 2.7 mL 20% BSA under R.T. water baths. Quickly add 6.3 mL DMEM culture medium and filter the solution with a 0.22-μm sterile filter.
Azidohomoalanine (AHA) labeling medium
DMEM medium without L-methionine, L-cysteine and L-glutamine (Invitrogen, 21013) was supplemented with 5 mM AHA, 0.2 mM L-cystine, 4 mM L-glutamine, 10% FBS (10082, Invitrogen) and 1% penicillin/streptomycin (15140, Invitrogen).
13C-AA DMEM
4 mg/mL algae 13C amino acids mix (CLM-1548, Cambridge isotope) was dissolved in dd-H2O with 10% FBS and 1% penicillin/streptomycin. Other components (vitamin, inorganic salts and glucose) are exactly the same as in the regular DMEM medium (11965, Invitrogen).
Deuterated amino acids medium (CD-DMEM)
this medium was prepared in the same way to the D-AA medium for HeLa cells as previously described51.
d7-glucose and 13C6-glucose labeling medium
DMEM without glucose (11966, Invitrogen) was supplemented with 4.5 mg/mL d7-glucose or 13C6-glucose, 10% FBS and 1% penicillin/streptomycin.
For cell labeling experiments, cells were first seeded onto clean CaF2 substrates and cultured with their regular culture media for 24 hours. To introduce the IR probes, replace the culture media with required labeling media for described labeling time. Cells were then fixed with 4% formaldehyde for 20 min, washed three times with HBSS and three times with dd-H2O52. The samples were air-dried under R.T. before imaging.
3T3-L1 differentiation
Low passage of 3T3-L1 MBX fibroblasts (early than passage 10) were seeded onto clean CaF2 substrate (25-mm dia) in a 6-well plate with a density of 3 × 10⁴ cells/well in growth medium (DMEM (11965, Invitrogen) supplemented with 10% FBS (10082, Invitrogen) and 1× penicillin/streptomycin (15140, Invitrogen) and were gown to confluence for 6 days, with changing growth medium every 2 days. Differentiation was induced by incubating the cells in differentiation medium (growth medium supplemented with 3.5 μg/mL bovine insulin (Sigma I0516), 500 μM methylisobutylxanthine (IBMX, Sigma I5879) and 250 nM dexamethasone (Sigma D1756) for 72 hours. After 72 hours, replace with maintenance medium (growth medium with 3.5 μg/mL bovine insulin) for 7 days, with medium replaced every 2 days, for fully differentiation.
3-color imaging on differentiated 3T3-L1 cells
Fully differentiated 3T3-L1 MBX adipocytes seeded on CaF2 substrate were cultured in d7-glucose substituted DMEM medium with 3.5 μg/mL bovine insulin for 48 hours. The medium is then replaced with d7-glucose and 13C-AA DMEM containing 100-μM azido-palmitic acid for 24 hours. Cells were then fixed with 4% PFA at R.T. for 20 min and washed 3 times with PBS buffer and 3 times with dd-H2O. The samples were air-dried before imaging.
C. elegans and P. aeruginosa biofilm labelling
C. elegans wild-type (N2) was maintained at 20°C using nematode growth media (NGM) and E. coli strain OP50 as a food source. For D2O treatment, D2O was added to replace 20% of the H2O in NGM plates. For d7-glucose and azido-palmitic acids labeling, OP50 bacterial culture were mixed with the probes at indicated concentrations and then seeded onto regular NGM plates. 24 hours later, eggs were placed onto these plates and grew until L4 stage. Worms were then collected, washed with M9 buffer and fixed with 4% formaldehyde for 30 min and washed with M9 buffer. Those fixed worms were further washed with three times of dd-H2O and subsequently placed onto CaF2 substrate and air-dried before imaging.
The agar medium of 2% tryptone (Teknova, USA) and 2% agar (Teknova, USA) was autoclaved and D2O was added in a 1:1 ratio for final concentrations of 1% tryptone, 1% agar in 1:1 of D2O:H2O. Coomassie Blue (OmniPur, MilliporeSigma) and Congo Red (Alfa Aesar) were added to the agar medium to final concentrations of 20 μg/mL and 40μg/mL, respectively. The agar medium was poured in two layers of 3 mL (bottom layer) and 1 mL (top layer) into 35 mm×10 mm round Petri dishes (25373–041, VWR). Biofilms were prepared by spotting 5 μL of mid-exponential phase bacterial culture of Pseudomonas aeruginosa UCBPP-PA14 (WT strain, stock #LD0) on agar medium. Biofilms were incubated at 25˚C in the dark for 96 hours. For FTIR imaging, the top layer of agar with the biofilm was moved onto CaF2 substrate and air-dried.
Mouse labelling and mouse tumor xenograft
The animal protocol for mice studies was approved by Columbia University Institutional Animal Care and Use Committee (IACUC) (AC-AABD1552). All experiments using mice were conducted in strict adherence to the ethical regulations of Columbia University IACUC. Wild-type 3~4-month-old female adult C57BL/6J mice were purchased from the Jackson Laboratory.
To establish glioblastoma xenograft model, intracranial implantation of U87MG human glioma cells were performed on nude mice (J:NU, Jackson Laboratory). The mice were anesthetized and stabilized in stereotaxic instrument (David Kopf Instruments), and then the head skin was cut open to make the skull bone exposed, a small section (2 mm in diameter) on the frontal region of the skull was ground with a dental drill (Braintree Scientific INC) until it became transparent and soft. 1.5×10⁵ U87MG tumor cells in 3 μL were injected into the frontal region of the cerebral cortex over the course of 5 min using a 1.5-mm glass capillary (injection tip is a few hundred microns in diameter) via the grounded region. Mouse head skin was then closed with silk sutures (Harvard Apparatus) after implantation. 4 mice were treated in this way with all 4 mice survived. 2 mice were sacrificed at 15 days post xenograft (early stage) and 2 mice were sacrificed at 26 days post xenograft (late stage) for imaging. During tumor progression, the animals were monitored daily, including weekends, for any sign of morbidity, including weight loss, inability to eat or drink, dehydration, inability to maintain balance, or unresponsiveness to noxious external stimuli, such as tow-pinch withdrawal test. When these signs are apparent, the animal will be euthanized.
For D2O probing experiments, 25% D2O in drinking water was given to the mice for certain days. For glioblastoma bearing mice, 25% D2O were provided for 15 days with different starting time points post tumor implantation (early stage: label from day 0–15 post xenograft; late stage: label from day 11–26 post xenograft), then sacrificed for imaging experiments.
For d7-glucose probing experiment, 2% d7-glucose was administered to the pregnant or the lactating female mouse in drinking water from E11-P21. Mice were anesthetized with isoflurane and scarified by cervical dislocation and organs were then collected. The organs were fixed with 4% PFA for 2 days.
For tissue slicing, the organs were embedded in 6% agarose gel and sliced into 10–20 μm thin slices with a vibratome (Leica) in HBSS buffer. The collected tissue slices were washed 2 times with HBSS buffer and 1 time with dd-H2O. The samples were then mounted on CaF2 substrates for air-drying.
Spectral unmixing algorithms and single-cell analysis
Retrieval of CDP and CDL signals for D2O labeled mouse
To measure the IR spectra for D-labeled protein and lipid, tissue slices (100 μm thick) from various organs were soaked in either pure methanol for 2 days at R.T. to dissolve lipids or in proteinase K solution (400 μg/mL proteinase K, 0.5 mM EDTA and 30 mM Tris buffer) on a 37 °C shaker to digest protein. The resolved spectral unmixing algorithm can be referred to Extended Data Fig. 4.
Retrieval of 12C amide I and 13C amide I
The unmixing coefficients were measured from spectra of bacteria growing in the media with 12C6-glucose or 13C6-glucose as the only carbon source (Extended Data Fig. 2a). The final linear combination algorithm was given as:
Retrieval of 12C ester carbonyl and 13C ester carbonyl
The cross-talk from the 12C amide I peak to the 13C ester carbonyl peak was calculated from spectra of bacteria growing in the media with 12C6-glucose or 13C6-glucose as the only carbon source (Extended Data Fig. 2a). The final linear combination algorithm was given as:
Unmixing in d-AA and azido-PA dual-probe experiment
The cross-talk from the broad CD band to the narrow azide peak was calculated from spectra of single-probe labeling experiment. The final algorithm was given as:
For single-cell analysis in Fig. 2h and Fig. 3, cell segmentation was first performed with an open-source software CellProfiler53 based on the amide image for 13C-AA labeling (data in Fig. 2h and Fig. 3e–g) and on the sum of azide image and C-D image for two-probe labeling (data in Fig. 3a–d). Single-cell spectra were generated by summing up all pixels inside after pixel-based spectral pre-processing. All metabolic rates (including CD/Amide I, Azide/CH2 and 13C Amide I/12C Amide I) were calculated based on single-cell spectra.
Statistics and reproducibility
Statistical analysis was carried out using MATLAB (R2016a) and GraphPad Prism 7. Data are presented as mean±s.d. with statistical significance if required (not significant P≥0.5, *P<0.05, **P<0.01, ***P <0.001, ****P <0.0001 with the exact P values in the figure legends). P values were calculated using a two-tailed Welch’s t-test in Fig. 3g. One-way analysis of variance (ANOVA) was used to compare more than two groups of data in Fig. 4g. All values of n are provided in the figure legends. In box plot (Fig. 1h), center indicates the median, and the minima and maxima of the box indicate the 25th and 75th percentiles. n for each time points from 0h to 48h are 3496, 5304, 2983, 4964 and 7721 pixels, respectively. Statistics source data for Fig. 3–4 are provided in Source Data. For Fig. 1, experiments in a, c-e, and k were repeated five times independently with similar results; experiments in f, i, l-n and p were repeated three times independently with similar results; experiments in o were repeated on three tissue slices with similar results. For Fig. 2, experiments in b, d and j were repeated three times independently with similar results; experiments in c, e, f and i were repeated on three tissue slices for each organ with similar results. For Fig. 3, experiments in a and b were repeated five times independently with similar results; experiments in d were repeated on three cell cultures independently with similar results. For Fig. 4, Experiments in a-c and e were repeated on three tissue slices each with similar results.
Data availability
The source data for Figs. 3 and 4 are available online as Source Data. Other data that support the findings of this study are available from the corresponding author upon reasonable request.
Extended Data
Extended Data Fig. 1 |. Azide probes.
a-b, A single azide band at 2098 cm−1 can be consistently detected on azido-palmitic acid labeled (a) and AHA labeled (b) but not on unlabeled control inside Raw264.7 cells. c, High-definition imaging on single azido-palmitic acid labeled Raw264.7 cells. Pixel size = 0.66 μm. The diffraction-limited resolution is about ~3 μm for the azide band. d, Imaging on C. elegans labeled with azido-palmitic acid. Pixel size = 3.3 μm. Experiments in a-c were repeated five times independently with similar results. Experiments in d were repeated three times independently with similar results. Scale bars, 5 μm in c, 100 μm in d.
Extended Data Fig. 2 |. 13C-substituted precursors as metabolism-mediated vibrational probes and carbon-deuterium probes.
a, Spectral identification of 13C and 12C carbonyl bonds (both amide I and ester carbonyl) in bacteria grown in M9 minimum medium with 13C6/12C6-glucose as the only carbon source. Experiments were repeated three times independently with similar results. b, The ratio maps as A1616 (absorbance at 1616 cm−1) over A1651 increase after culturing MDA-MB-468 with 13C-AA medium. Experiments were repeated three times independently with similar results. c, Single-pixel FTIR spectrum of differentiated adipocyte labeled with 13C6-glucose for 4 days. The squared region was enlarged as in Fig. 1i. d, Imaging on de novo lipogenesis in differentiated 3T3-L1 adipocytes with 13C6-glucose. Experiments in c and d were repeated three times with similar results. e, Imaging on C. elegans labeled with d7-glucose. Experiments were repeated three times with similar results. Pixel size = 3.3 μm for b-e. f, Single-pixel FTIR spectrum in cerebellum of pup (P21) mice labeled with 2% d7-glucose for 30 days (E11 to P21). The squared region (2050–2250 cm−1) was enlarged in the right. Experiments were repeated on three tissue slices with similar results. Scale bars: 10 μm in d, 40 μm in e.
Extended Data Fig. 3 |. Imaging speed comparison between broadband FTIR and single-frequency SRS.
a, Broadband FTIR microscope acquires a hyperspectral data cubic in a single scan. C-D image was generated as the transmittance difference between on-resonant (2140 cm−1) and off-resonant (2000 cm−1) with 3.3-μm pixel size. Noise was estimated as the spectral noise in the spectral region of 2100–2200 cm−1. 128 co-scans background was utilized. With 8 co-scans of signal measurement, total acquisition time is 80 min for 3.3-μm pixel size (25× objective), 30 min for 5.5-μm pixel size (15× objective) and 3 min for 20.2-μm pixel size (4× objective). b, Narrowband picosecond excitation was utilized in SRS microscope. C-D image was generated as the intensity difference between on-resonant (2135 cm−1) and off-resonant (2370 cm−1). 100-mW pump and 150-mW Stokes were utilized with 20-μs pixel dwell time and 20-μs lock-in time constant. Noise was estimated by the s.d. among pixels with only pump laser under the same laser power and lock-in time constant. Total acquisition time for a single frequency is about 20 min for 2-μm pixel size, and 80 min for 1-μm pixel size, respectively. Experiments in a and b were not repeated. Scale bars, 1 mm.
Extended Data Fig. 4 |. Spectral unmixing for D2O labeled tissue from various organs.
a, Spectral characterization on CD vibrations in lipid and protein with solution standards. The isolated D-labeled lipids spectrum agrees with the CD peak in 12-d1-PA (left) and D-labeled protein spectrum matches with the C(α)D peak from d4-alanine (right). Experiments were repeated two times independently with similar results. b, Retrieval of CDP and CDL signals for different organs of D2O labeled mouse. The linear combinational algorithms for different organs are presented below each spectrum. Raw spectra were truncated to spectral region of 2080–2220 cm−1 followed by polynomial baseline correction and normalization. Black solid lines are spectra for untreated tissues, red dashed lines are spectra for lipid components (protein were digested with Proteinase K) and blue dashed lines are spectra for protein components (lipids were removed by methanol wash). Experiments were repeated three times independently with similar results.
Extended Data Fig. 5 |. Multiplexed imaging of macromolecules synthesis activities in D2O labeled mice.
CDp and CDL are D2O-dereived protein synthesis signal and de novo lipid synthesis signal after linear unmixing (with the algorithms in Extended Data Fig. 4), respectively. Experiments were repeated on three tissue slices for each organ with similar results. Scale bars, 1 mm for brain, cerebellum and kidney; 500 μm for olfactory bulb, intestine and liver.
Extended Data Fig. 6 |. MIR imaging of brain metabolic activities during development.
a, b, CDL, CDP, Amide I and CHL FTIR images (a) and generated maps of protein synthesis and de novo lipid synthesis activities (b) on brains of adult and young mouse. cc: corpus callosum; fi: fimbria; sm: stria medullaris; int: internal capsule; mtt: mammilothalmic tract; HPF: hippocampus; DG-sg: granule cell layer of dentate gyrus. c, d, FTIR images (c) and generated maps of protein synthesis and de novo lipid synthesis activities (d) on olfactory bulb of adult and young mouse. P35 is 35 days postnatal mice given with 25% D2O in drinking water for P1-P35 duration and adult mice were also labeled with 25% D2O in drinking water for 35 days. e, f, FTIR images (e) and generated maps of protein synthesis and de novo lipid synthesis activities (f) on cerebellum of adult and young mouse. Experiments in a-f were repeated on three tissue slices each with similar results. (g) Immunofluorescence imaging of myelin basic protein (MBP) and NeuN (neuronal nuclei) on adult and young mouse. NeuN is mainly restricted to granular layer of cerebellum. Experiments were not repeated. Scale bars, 1 mm in a, b and e-g, 500 μm in c, d.
Extended Data Fig. 7 |. MIR metabolic imaging on tumor progression with D2O labeling.
Left column is the early stage and right column is the late stage. Early stage: label from day 0–15 post xenograft; Late stage: label from day 11–26 post xenograft. Experiments were repeated on three tissue slices each with similar results. Scale bars: 1 mm.
Supplementary Material
Acknowledgements
We thank Keegan A. McHose and Louis Tisinger from Agilent Inc. for technical supports on FTIR microscope and Lu Wei for helpful discussion. W.M. acknowledges support from NIH R01 (GM128214 and GM128214-02S1) and R01 (EB029523). L.E.P.D. was supported by NIH/NIAID grant R01AI103369.
Footnotes
Competing interests
The authors declare no competing interests.
References
- 1.Kandel ER The molecular biology of memory storage: a dialogue between genes and synapses. Science 294, 1030, (2001). [DOI] [PubMed] [Google Scholar]
- 2.Roche FK, Marsick BM & Letourneau PC Protein synthesis in distal axons is not required for growth cone responses to guidance cues. J. Neurosci. 29, 638, (2009). [DOI] [PMC free article] [PubMed] [Google Scholar]
- 3.Hinz FI, Dieterich DC, Tirrell DA & Schuman EM Noncanonical amino acid labeling in vivo to visualize and affinity purify newly synthesized proteins in larval zebrafish. ACS Chem. Neurosci. 3, 40–49, (2012). [DOI] [PMC free article] [PubMed] [Google Scholar]
- 4.Zilberter Y & Zilberter M The vicious circle of hypometabolism in neurodegenerative diseases: ways and mechanisms of metabolic correction. J. Neurosci. Res. 95, 2217–2235, (2017). [DOI] [PubMed] [Google Scholar]
- 5.Hebert SL & Nair KS Protein and energy metabolism in type 1 diabetes. Clin. Nutr. 29, 13–17, (2010). [DOI] [PMC free article] [PubMed] [Google Scholar]
- 6.Pavlova Natalya N. & Thompson Craig B. The emerging hallmarks of cancer metabolism. Cell Metab. 23, 27–47, (2016). [DOI] [PMC free article] [PubMed] [Google Scholar]
- 7.Kim MM, Parolia A, Dunphy MP & Venneti S Non-invasive metabolic imaging of brain tumours in the era of precision medicine. Nat. Rev. Clin. Oncol. 13, 725–739, (2016). [DOI] [PMC free article] [PubMed] [Google Scholar]
- 8.Steinhauser ML et al. Multi-isotope imaging mass spectrometry quantifies stem cell division and metabolism. Nature 481, 516–519, (2012). [DOI] [PMC free article] [PubMed] [Google Scholar]
- 9.Palonpon AF, Sodeoka M & Fujita K Molecular imaging of live cells by Raman microscopy. Curr. Opin. Chem. Biol. 17, 708–715, (2013). [DOI] [PubMed] [Google Scholar]
- 10.Wei L et al. Live-cell bioorthogonal chemical imaging: stimulated Raman scattering microscopy of vibrational probes. Acc. Chem. Res. 49, 1494–1502, (2016). [DOI] [PMC free article] [PubMed] [Google Scholar]
- 11.Shen Y, Hu F & Min W Raman imaging of small biomolecules. Annu. Rev. Biophys. 48, 347–369, (2019). [DOI] [PubMed] [Google Scholar]
- 12.Hu F, Shi L & Min W Biological imaging of chemical bonds by stimulated Raman scattering microscopy. Nat. Methods 16, 830–842, (2019). [DOI] [PubMed] [Google Scholar]
- 13.Lee HJ et al. Assessing cholesterol storage in live cells and C. elegans by stimulated Raman scattering imaging of phenyl-diyne cholesterol. Sci. Rep. 5, 7930, (2015). [DOI] [PMC free article] [PubMed] [Google Scholar]
- 14.Schiessl KT et al. Phenazine production promotes antibiotic tolerance and metabolic heterogeneity in Pseudomonas aeruginosa biofilms. Nat. Commun. 10, 762, (2019). [DOI] [PMC free article] [PubMed] [Google Scholar]
- 15.Shi L et al. Optical imaging of metabolic dynamics in animals. Nat. Commun. 9, 2995, (2018). [DOI] [PMC free article] [PubMed] [Google Scholar]
- 16.Zhang L et al. Spectral tracing of deuterium for imaging glucose metabolism. Nat. Biomed. Eng. 3, 402–413, (2019). [DOI] [PMC free article] [PubMed] [Google Scholar]
- 17.Lin-Vien D, Colthup NB, Fateley WG & Grasselli JG The handbook of infrared and Raman characteristic frequencies of organic molecules. (Academic, 1991). [Google Scholar]
- 18.Ma J, Pazos IM, Zhang W, Culik RM & Gai F Site-specific infrared probes of proteins. Annu. Rev. Phys. Chem. 66, 357–377, (2015). [DOI] [PMC free article] [PubMed] [Google Scholar]
- 19.Suydam IT & Boxer SG Vibrational Stark effects calibrate the sensitivity of vibrational probes for electric fields in proteins. Biochemistry 42, 12050–12055, (2003). [DOI] [PubMed] [Google Scholar]
- 20.Pilling M & Gardner P Fundamental developments in infrared spectroscopic imaging for biomedical applications. Chem. Soc. Rev. 45, 1935–1957, (2016). [DOI] [PubMed] [Google Scholar]
- 21.Yeh K, Kenkel S, Liu J-N & Bhargava R Fast infrared chemical imaging with a quantum cascade laser. Anal. Chem. 87, 485–493, (2015). [DOI] [PMC free article] [PubMed] [Google Scholar]
- 22.Haase K, Kröger-Lui N, Pucci A, Schönhals A & Petrich W Real-time mid-infrared imaging of living microorganisms. J. Biophotonics. 9, 61–66, (2016). [DOI] [PubMed] [Google Scholar]
- 23.Gazi E et al. A FTIR microspectroscopic study of the uptake and metabolism of isotopically labelled fatty acids by metastatic prostate cancer. Vib. Spectrosc. 50, 99–105, (2009). [Google Scholar]
- 24.Bai Y, Zhang D, Li C, Liu C & Cheng J-X Bond-selective imaging of cells by mid-infrared photothermal microscopy in high wavenumber region. J. Phys. Chem. B. 121, 10249–10255, (2017). [DOI] [PMC free article] [PubMed] [Google Scholar]
- 25.Clède S et al. Synchrotron radiation FTIR detection of a metal-carbonyl tamoxifen analog. Correlation with luminescence microscopy to study its subcellular distribution. Biotechnol. Adv. 31, 393–395, (2013). [DOI] [PubMed] [Google Scholar]
- 26.McCoy S & Caughey WS Infrared studies of azido, cyano, and other derivatives of metmyoglobin, methemoglobin, and hemins. Biochemistry 9, 2387–2393, (1970). [DOI] [PubMed] [Google Scholar]
- 27.Błasiak B, Londergan CH, Webb LJ & Cho M Vibrational Probes: From Small Molecule Solvatochromism Theory and Experiments to Applications in Complex Systems. Acc. Chem. Res. 50, 968–976, (2017). [DOI] [PubMed] [Google Scholar]
- 28.Prescher JA & Bertozzi CR Chemistry in living systems. Nat. Chem. Biol. 1, 13–21, (2005). [DOI] [PubMed] [Google Scholar]
- 29.Pazos IM, Ghosh A, Tucker MJ & Gai F Ester carbonyl vibration as a sensitive probe of protein local electric field. Angew. Chem. Int. Ed. 53, 6080–6084, (2014). [DOI] [PMC free article] [PubMed] [Google Scholar]
- 30.Muhamadali H, Chisanga M, Subaihi A & Goodacre R Combining Raman and FT-IR spectroscopy with quantitative isotopic labeling for differentiation of E. coli cells at community and single cell levels. Anal. Chem. 87, 4578–4586, (2015). [DOI] [PubMed] [Google Scholar]
- 31.Cheng J-X & Xie XS Vibrational spectroscopic imaging of living systems: An emerging platform for biology and medicine. Science 350, aaa8870, (2015). [DOI] [PubMed] [Google Scholar]
- 32.Wrobel TP & Bhargava R Infrared spectroscopic imaging advances as an analytical technology for biomedical sciences. Anal. Chem. 90, 1444–1463, (2018). [DOI] [PMC free article] [PubMed] [Google Scholar]
- 33.Yeh K, Lee D & Bhargava R Multicolor discrete frequency infrared spectroscopic imaging. Anal. Chem. 91, 2177–2185, (2019). [DOI] [PMC free article] [PubMed] [Google Scholar]
- 34.Hosios Aaron M. et al. Amino acids rather than glucose account for the majority of cell mass in proliferating mammalian cells. Dev. Cell. 36, 540–549, (2016). [DOI] [PMC free article] [PubMed] [Google Scholar]
- 35.Peng SK, Ho KJ & Taylor CB Biologic effects of prolonged exposure to deuterium oxide. A behavioral, metabolic, and morphologic study. Arch. Pathol. 94, 81–89, (1972). [PubMed] [Google Scholar]
- 36.Hodel A, Gebbers JO, Cottier H & Laissue JA Effects of prolonged moderate body deuteration on proliferative activity in major cell renewal systems in mice. Life Sci. 30, 1987–1996, (1982). [DOI] [PubMed] [Google Scholar]
- 37.Ran S, Berisha S, Mankar R, Shih W-C & Mayerich D Mitigating fringing in discrete frequency infrared imaging using time-delayed integration. Biomed. Opt. Express 9, 832–843, (2018). [DOI] [PMC free article] [PubMed] [Google Scholar]
- 38.Mittal S et al. Simultaneous cancer and tumor microenvironment subtyping using confocal infrared microscopy for all-digital molecular histopathology. Proc. Natl Acad. Sci. USA 115, E5651, (2018). [DOI] [PMC free article] [PubMed] [Google Scholar]
- 39.Liu Y-L et al. Assessing metastatic potential of breast cancer cells based on EGFR dynamics. Sci. Rep. 9, 3395, (2019). [DOI] [PMC free article] [PubMed] [Google Scholar]
- 40.Knobloch M et al. Metabolic control of adult neural stem cell activity by Fasn-dependent lipogenesis. Nature 493, 226–230, (2013). [DOI] [PMC free article] [PubMed] [Google Scholar]
- 41.Snaidero N & Simons M Myelination at a glance. J. Cell Sci. 127, 2999, (2014). [DOI] [PubMed] [Google Scholar]
- 42.Ji M et al. Rapid, label-free detection of brain tumors with stimulated Raman scattering microscopy. Sci. Transl. Med. 5, 201ra119, (2013). [DOI] [PMC free article] [PubMed] [Google Scholar]
- 43.Röhrig F & Schulze A The multifaceted roles of fatty acid synthesis in cancer. Nat. Rev. Cancer 16, 732–749, (2016). [DOI] [PubMed] [Google Scholar]
- 44.Clemens MJ Targets and mechanisms for the regulation of translation in malignant transformation. Oncogene 23, 3180–3188, (2004). [DOI] [PubMed] [Google Scholar]
- 45.Zhang D et al. Depth-resolved mid-infrared photothermal imaging of living cells and organisms with submicrometer spatial resolution. Sci. Adv. 2, e1600521, (2016). [DOI] [PMC free article] [PubMed] [Google Scholar]
- 46.Shi J et al. High-resolution, high-contrast mid-infrared imaging of fresh biological samples with ultraviolet-localized photoacoustic microscopy. Nat. Photonics 13, 609–615, (2019). [DOI] [PMC free article] [PubMed] [Google Scholar]
- 47.Dazzi A & Prater CB AFM-IR: technology and applications in nanoscale infrared spectroscopy and chemical imaging. Chem. Rev. 117, 5146–5173, (2017). [DOI] [PubMed] [Google Scholar]
- 48.Andrew Chan KL & Kazarian SG Attenuated total reflection Fourier-transform infrared (ATR-FTIR) imaging of tissues and live cells. Chem. Soc. Rev. 45, 1850–1864, (2016). [DOI] [PubMed] [Google Scholar]
- 49.Pleitez MA et al. Label-free metabolic imaging by mid-infrared optoacoustic microscopy in living cells. Nat. Biotechnol. 38, 293–296, (2020). [DOI] [PubMed] [Google Scholar]
- 50.Pupeza I et al. Field-resolved infrared spectroscopy of biological systems. Nature 577, 52–59, (2020). [DOI] [PubMed] [Google Scholar]
References
- 51.Wei L et al. Imaging Complex Protein Metabolism in Live Organisms by Stimulated Raman Scattering Microscopy with Isotope Labeling. ACS Chem. Biol. 10, 901–908, (2015). [DOI] [PMC free article] [PubMed] [Google Scholar]
- 52.Baker MJ et al. Using Fourier transform IR spectroscopy to analyze biological materials. Nat. Protoc. 9, 1771–1791, (2014). [DOI] [PMC free article] [PubMed] [Google Scholar]
- 53.Carpenter AE et al. CellProfiler: image analysis software for identifying and quantifying cell phenotypes. Genome Biol. 7, R100, (2006). [DOI] [PMC free article] [PubMed] [Google Scholar]
Associated Data
This section collects any data citations, data availability statements, or supplementary materials included in this article.
Supplementary Materials
Data Availability Statement
The source data for Figs. 3 and 4 are available online as Source Data. Other data that support the findings of this study are available from the corresponding author upon reasonable request.


