Abstract
Expanding the palette of fluorescent dyes is vital to push the frontier of biological imaging. Although rhodamine dyes remain the premier type of small-molecule fluorophore due to their bioavailability and brightness, variants excited with far-red or near-infrared light suffer from poor performance due to their propensity to adopt a lipophilic, nonfluorescent form. We report a framework for rationalizing rhodamine behavior in biological environments and a general chemical modification for rhodamines that optimizes long-wavelength variants and enables facile functionalization with different chemical groups.
Introduction
The development of hybrid small-molecule:protein labeling strategies enable the use of chemical fluorophores in living cells and in vivo1. Optimizing small-molecule dyes for these complex biological environments is important, as synthetic fluorophores are often brighter and more photostable than fluorescent proteins2. We recently developed general methods to improve3 and fine-tune4 rhodamine fluorophores by incorporating four-membered azetidines into the structure, yielding the ‘Janelia Fluor’ dyes. Although our existing tuning strategies allow optimization of short-wavelength rhodamines, we discovered these methods cannot be applied to analogs excited with far-red and near-infrared (NIR) light due to their propensity to adopt a colorless form. Here, we report a new complementary tuning strategy that allows rational optimization of a broader palette of fluorophores. This general method also serves as a basis for facile functionalization, enabling the synthesis of novel cell- and tissue-permeable rhodamine labels for biological imaging experiments.
Results
A general rubric to predict rhodamine performance.
A key property of rhodamine dyes is an equilibrium between a lipophilic, colorless lactone and the polar, fluorescent zwitterion (Fig. 1a)5. Based on our previous work2–4, 6, 7, we outlined a general rubric that directly correlates the lactone–zwitterion equilibrium constant (KL–Z) to performance in biological environments (Fig. 1b). Dyes with high KL–Z exist almost exclusively in the zwitterionic form, making them useful as environmentally insensitive biomolecule labels8. Rhodamines with intermediate KL–Z values exhibit improved cell and tissue permeability due to the modestly higher propensity of the molecule to adopt the lipophilic lactone form and rapidly traverse biological membranes4, 7. Dyes exhibiting even smaller KL–Z values preferentially adopt the closed lactone form, which can be exploited to create ‘fluorogenic’ dyes7, 9–11 as binding of ligands and stains to their cognate biomolecular targets typically shifts the equilibrium to the fluorescent form. This property also decreases in vivo utility, however, due to problems with solubility and sequestration in membranes. Finally, dyes with extremely small KL–Z values exist completely in the nonfluorescent lactone form, rendering them effectively unusable in biological experiments.
Figure 1. General rubric relating lactone–zwitterion equilibrium to rhodamine dye performance and optimizing short-wavelength dyes by decreasing KL–Z.
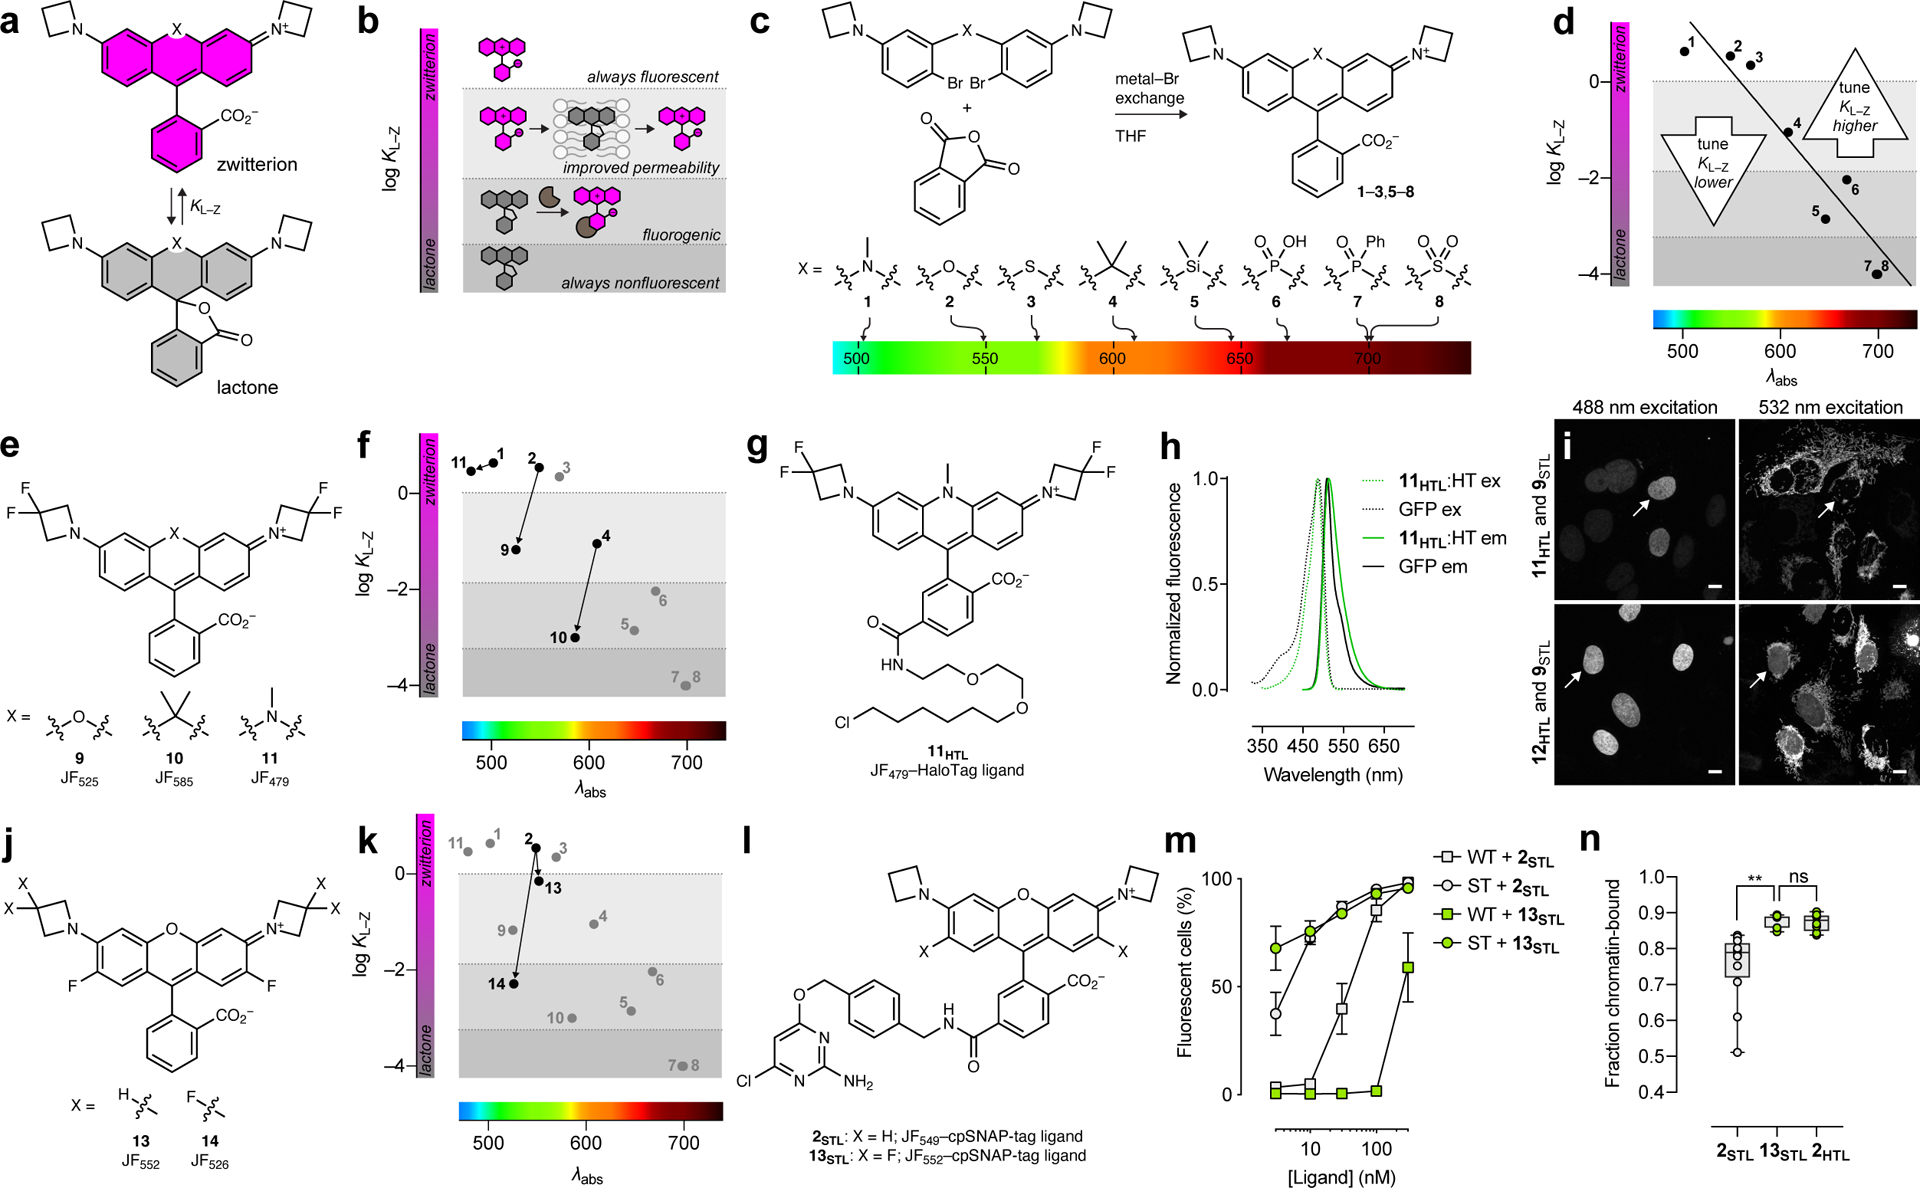
(a) The lactone–zwitterion equilibrium of Janelia Fluor rhodamine dyes and the equilibrium constant KL–Z. (b) Phenomenological plot categorizing the properties of different dyes based on KL–Z. (c) Synthesis, structures, and λabs of dyes 1–8. (d) Plot of KL–Z vs. λabs for dyes 1–8 and general tuning strategies for dyes with short or long λabs. (e) Structures of dyes 9–11. (f) Plot of KL–Z vs. λabs showing decreased KL–Z for dyes 9–11. (g) Structure of JF479–HaloTag ligand (11HTL). (h) Fluorescence excitation (ex) and emission (em) spectra of 11HTL:HaloTag conjugate and GFP. (i) Two-color confocal imaging experiment of live U2OS cells expressing HaloTag–histone H2B labeled with either 11HTL (500 nM, 3.5 h) or JF503–HaloTag ligand (12HTL; 500 nM, 3.5 h) excited with 488 nm (left panels) and TOMM20–SNAP-tag labeled with JF525–cpSNAP-tag ligand (9STL; 100 nM, 30 min, 3× wash) excited with 532 nm (right panels); scale bars: 10 μm; this experiment was duplicated with similar results. White arrows highlight the absence (11HTL) or presence (12HTL) of nuclear signal in the 532 nm-excited channel. (j) Structures of dyes 13–14. (k) Plot of KL–Z vs. λabs showing decreased KL–Z for dyes 13–14. (l) Structures of 2STL and 13STL. (m) Plot of fluorescently labeled mouse embryonic stem (ES) cells (%) vs. time determined by flow cytometry. Wild-type ES cells (WT) or ES cells expressing SNAP-tag–histone H2B (ST) were incubated with 2STL or 13STL (15 min); error bars show SE; experiments using 2STL n = 7 independent cellular samples except for [ligand] = 3 nM where n = 5 independent cellular samples; experiments using 13STL n = 3 independent cellular samples. (n) Plot showing fraction of chromatin-bound molecules per cell in single-particle tracking experiments using 2STL and 13STL in cells expressing SNAP-tag–histone H2B and 2HTL in U2OS cells expressing HaloTag–histone H2B; center line indicates median; box limits indicate upper and lower quartiles; whiskers indicate min–max; one-way ANOVA gave adjusted P Value = 0.0013 (**) for 2STL vs. 13STL and adjusted P Value = 0.9963 (ns) for 13STL vs. 2HTL; n = 12 cells for experiments using 2STL and n = 8 cells for experiments using 13STL and 2HTL.
We compared a series of Janelia Fluor rhodamine analogs with different fluorophoric systems (1–8, Fig. 1c). Compounds 2, 4, and 5 were described previously and include the azetidine-containing rhodamine (2), which we termed ‘Janelia Fluor 549’ (JF549), and the carborhodamine12, 13 and Si-rhodamine9, 14 analogs 4 and 5 (JF608 and JF646, respectively; Fig. 1c)3. We expanded the wavelength range of the JF dyes by synthesizing new azetidine-containing analogs of known rhodamine structures using metalation of bis(2-bromoarenes) (Fig. 1c, Supplementary Note), which we previously established as a general method for rhodamine synthesis6. These included compounds based on classic dyes containing nitrogen15–17 (X = NCH3; 1) and sulfur18 (X = S; 3) atoms as well as recently described variants containing phosphinate19, 20 (X = PO2H; 6), phosphine oxide21, 22 (X = P(O)Ph; 7), and sulfone23 (X = SO2; 8) moieties. We measured the absorption maximum (λabs), extinction coefficient at λabs (ε), fluorescence emission maximum λem, and fluorescence quantum yield (Φ) of these dyes in aqueous buffer and the KL–Z in a dioxane:water mixture (Table 1). Comparing KL–Z and λabs uncovered an inverse correlation (Fig. 1d), with the short wavelength NCH3-containing JF502 (1) exhibiting a high KL–Z = 4.33 and the near-infrared (NIR) dyes containing P(O)Ph (7) and SO2 (8) showing a low KL–Z ≈ 10–4. This correlation likely stems from the electron-withdrawing character of the X substituents24 as recently demonstrated in a computational study of rhodamines containing O, C(CH3)2, and Si(CH3)2 moieties11.
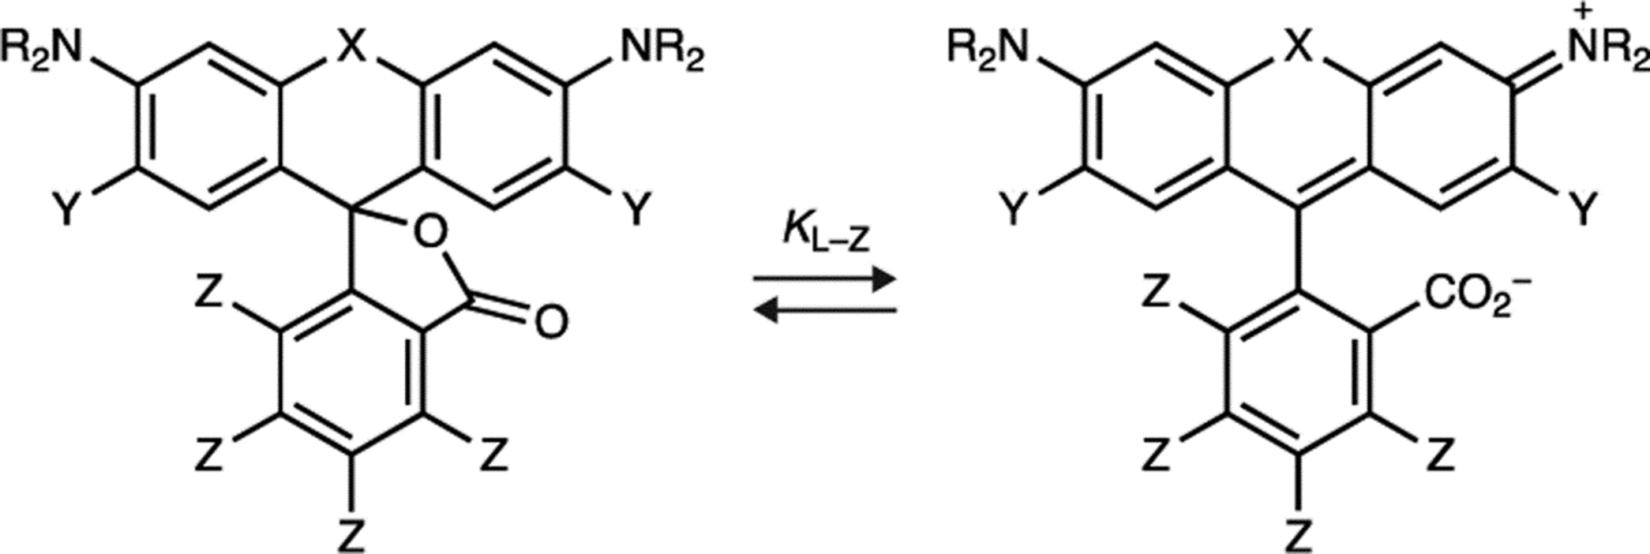
Table 1. Properties of Janelia Fluor dyes 1–11, 13–20, and 37–38.
All properties were measured in 10 mM HEPES, pH 7.3 except for KL–Z, which was determined in 1:1 dioxane:H2O. Properties for 2, 4, 5, 9, 10, 13, and 14were taken from previous work3, 4, 7. ND: not determined due to low absorbance.
 | ||||||||||
|---|---|---|---|---|---|---|---|---|---|---|
| Compound | Name | X | Y | Z | NR2 | λabs (nm) | ε (M–1cm–1) | λem (nm) | Φ | KL–Z |
| 1 | JF502 | 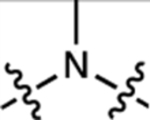 |
H | H |  |
502 | 57,800 | 533 | 0.71 | 4.33 |
| 2 | JF549 |  |
H | H |  |
549 | 101,000 | 571 | 0.88 | 3.47 |
| 3 | JF570 |  |
H | H |  |
570 | 83,600 | 593 | 0.63 | 2.24 |
| 4 | JF608 | 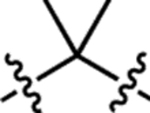 |
H | H |  |
608 | 99,000 | 631 | 0.67 | 0.091 |
| 5 | JF646 | 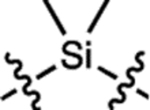 |
H | H |  |
646 | 5,600 | 664 | 0.54 | 0.0014 |
| 6 | JF668 | 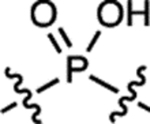 |
H | H |  |
668 | 26,700 | 687 | 0.34 | 0.0093 |
| 7 | – | 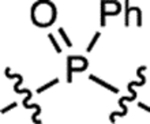 |
H | H |  |
~704 | <200 | ~723 | ND | <0.0001 |
| 8 | – | 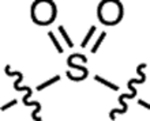 |
H | H |  |
ND | <100 | ND | ND | <0.0001 |
| 9 | JF525 |  |
H | H |  |
525 | 94,000 | 549 | 0.91 | 0.068 |
| 10 | JF585 | 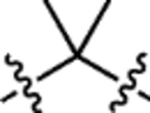 |
H | H |  |
585 | 1,500 | 609 | 0.78 | ~0.001 |
| 11 | JF479 | 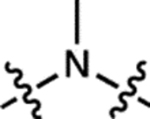 |
H | H |  |
479 | 47,900 | 517 | 0.62 | 2.88 |
| 13 | JF552 |  |
F | H |  |
552 | 95,000 | 575 | 0.83 | 0.70 |
| 14 | JF526 |  |
F | H |  |
526 | 19,000 | 550 | 0.87 | 0.005 |
| 15 | JF669 | 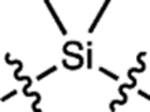 |
H | F |  |
669 | 112,000 | 682 | 0.37 | 0.262 |
| 16 | JF690 | 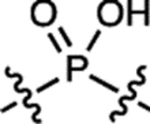 |
H | F |  |
690 | 150,000 | 707 | 0.24 | 2.90 |
| 17 | JF722 | 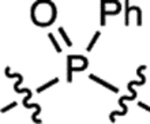 |
H | F |  |
722 | 87,200 | 743 | 0.11 | 0.026 |
| 18 | JF724 | 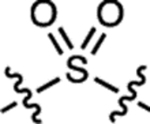 |
H | F |  |
724 | 6,600 | 748 | 0.05 | ~0.001 |
| 19 | JF571 |  |
H | F |  |
571 | 101,000 | 590 | 0.78 | 7.93 |
| 20 | JF593 |  |
H | F |  |
593 | 90,300 | 612 | 0.55 | 6.06 |
| 37 | JF559 |  |
H | F |  |
559 | 106,000 | 579 | 0.85 | 6.22 |
| 38 | JF711 | 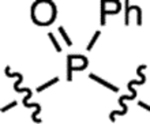 |
H | F |  |
711 | 12,400 | 732 | 0.17 | ~0.001 |
Optimizing short-wavelength dyes.
In previous work, we focused on tuning the KL–Z lower to improve tissue permeability and create fluorogenic ligands based on short-wavelength dyes. This allowed us to estimate thresholds between different categories of dyes based on measured KL–Z values (Fig. 1b,d)4, 7, 10. One general strategy to decrease KL–Z involved incorporation of 3,3-difluoroazetidines4. This modification also elicits a concomitant hypsochromic shift of ~25 nm, transforming JF549 (2; KL–Z = 3.5) into JF525 (9; KL–Z = 0.68, Fig. 1e, Table 1). The HaloTag25 ligand based on JF525 shows improved cell permeability relative to the JF549 derivative4, which is consistent with our KL–Z rubric (Fig. 1b,f), and is blood–brain-barrier (BBB) permeable making it useful for in vivo voltage imaging using the Voltron indicator2. This strategy also transformed JF608 (4; KL–Z = 0.091) into the fluorogenic JF585 (10; KL–Z = 0.001, Fig. 1e, Table 1), again supporting our KL–Z-based framework (Fig. 1b,f). We applied this same tuning approach to JF502 (1) to yield the fluorinated JF479 (11; Extended Data Fig. 1a–c). Given the high KL–Z = 4.33 for 1, however, this modification only moderately decreased KL–Z to 2.88 (Fig. 1e–f, Table 1) and the JF479–HaloTag ligand derivative (11HTL, Fig. 1g) exhibited similar cell permeability to our previously described rhodol-based JF503–HaloTag ligand (12HTL; Extended Data Fig. 1d–i). Although the molecular brightness of the parent JF479 (11; ε = 47,900 M–1cm–1, Φ = 0.62; Table 1) is lower than JF503 (ε = 83,000 M–1cm–1, Φ = 0.87)4, the shorter λabs is advantageous for multicolor imaging experiments. JF479–HaloTag ligand (11HTL) exhibits similar spectral properties to enhanced green fluorescent protein (GFP) when attached to the HaloTag protein (Fig. 1h). This property allows efficient excitation of 11HTL with 488 nm light but no appreciable signal when excited with 532 nm light, allowing two-color imaging with JF525–cpSNAP-tag ligand (9STL; Fig. 1i, Extended Data Fig. 2a–e)4 In contrast, the longer λabs of 12HTL results in unwanted excitation by 532 nm light, which makes spectral separation difficult when paired with 9STL (Fig. 1i, Extended Data Fig. 2b,f–h).
Another method to decrease KL–Z involves direct fluorination on the xanthene system of rhodamine dyes. Using this strategy, we previously created JF552 (13; KL–Z = 0.70; Fig. 1j, Table 1); the JF552–HaloTag ligand shows improved cell-permeability compared to JF549 derivatives7. This approach is complementary to incorporation of 3,3-difluoroazetidines and combining these modifications yielded the fluorogenic JF526 (14; KL–Z = 0.005; Fig. 1j, Table 1)7. The performance of both of these dyes is consistent with our KL–Z rubric (Fig. 1b,k) and we sought further validation by exploring a novel SNAP-tag ligand based on JF552. The SNAP-tag is typically inferior to the HaloTag in live-cell imaging experiments due to slower labeling kinetics25, 26, higher nonspecific interactions of the SNAP-tag ligands27, 28, and other factors29. We compared the performance of chloropyrimidine (cp)30 derivatives of JF549 and JF552 (2STL and 13STL, respectively; Fig. 1l). The shift in KL–Z resulted in the JF552 compound (13STL) showing low nonspecific staining across a wider range of concentrations (Fig. 1m) and faster live-cell labeling (Extended Data Fig. 3a–d) compared to the JF549 compound (2STL). 2STL and 13STL exhibited comparable brightness and photostability in single-particle tracking experiments using SNAP-tag–histone H2B fusions (Extended Data Fig. 3e–f), but the 13STL compound showed significantly lower nonspecific cytosolic staining, matching the performance of the widely used JF549–HaloTag ligand (2HTL, Fig. 1n, Extended Data Fig. 3g–i)3, 31.
Improving and derivatizing long-wavelength dyes.
Having conceived and validated our KL–Z-based framework with the short wavelength dyes, we then turned to the far-red and NIR rhodamines (5–8, Fig. 1c), where the KL–Z vs. λabs relationship reveals the need for alternative tuning strategy to increase KL–Z (Fig. 1d). This would improve the in vivo performance of Si-rhodamines such as JF646 and rescue the colorless P(O)Ph- and SO2-containing dyes (7–8). We previously showed that halogenation of the pendant phenyl ring system can substantially increase the KL–Z of Si-rhodamine dyes6, presumably by lowering the pKa of the benzoic acid moiety; this substitution also elicits a bathochromic shift32. For example, JF646 (5; λabs/λem = 646 nm/664 nm) exhibits a KL–Z = 0.0014 but the fluorinated analog, JF669 (15; λabs/λem = 669 nm/682 nm), is higher with KL–Z = 0.262 (Fig. 2a–b, Extended Data Fig. 4a–b). This shift in KL–Z manifests in a higher absorptivity in aqueous solution with 5 exhibiting ε = 5,600 M–1cm–1 but the fluorinated analog 15 showing ε = 112,000 M–1cm–1 (Fig. 2c, Table 1). We expected this strategy would be general and prepared the fluorinated PO2H-, P(O)Ph-, and SO2-containing rhodamines (16–18, Fig. 2a) by replacing phthalic anhydride with tetrafluorophthalic anhydride in our synthetic scheme (Extended Data Fig. 4a, Supplementary Note). This modification universally increased KL–Z and ε, while eliciting a ~23 nm shift in λabs (Fig. 2b–c, Table 1, Extended Data Fig. 4b–e). In particular, the fluorinated phosphine oxide derivative 17 strongly absorbs visible light in aqueous solution (ε = 87,000 M–1cm–1; λabs = 722 nm) compared to the parent compound 7 (ε < 200 M–1cm–1; λabs = 704 nm, Fig. 1c, Table 1). This trend was generalizable to oxygen- and sulfur-containing rhodamines based on 2 and 3 where the fluorine substituents on the pendant phenyl ring also increased KL–Z and λabs (19–20, Fig. 2d–e, Table 1, Extended Data Fig. 4f–g)6.
Figure 2. Optimizing long-wavelength rhodamine dyes by increasing KL–Z and subsequent derivatization.
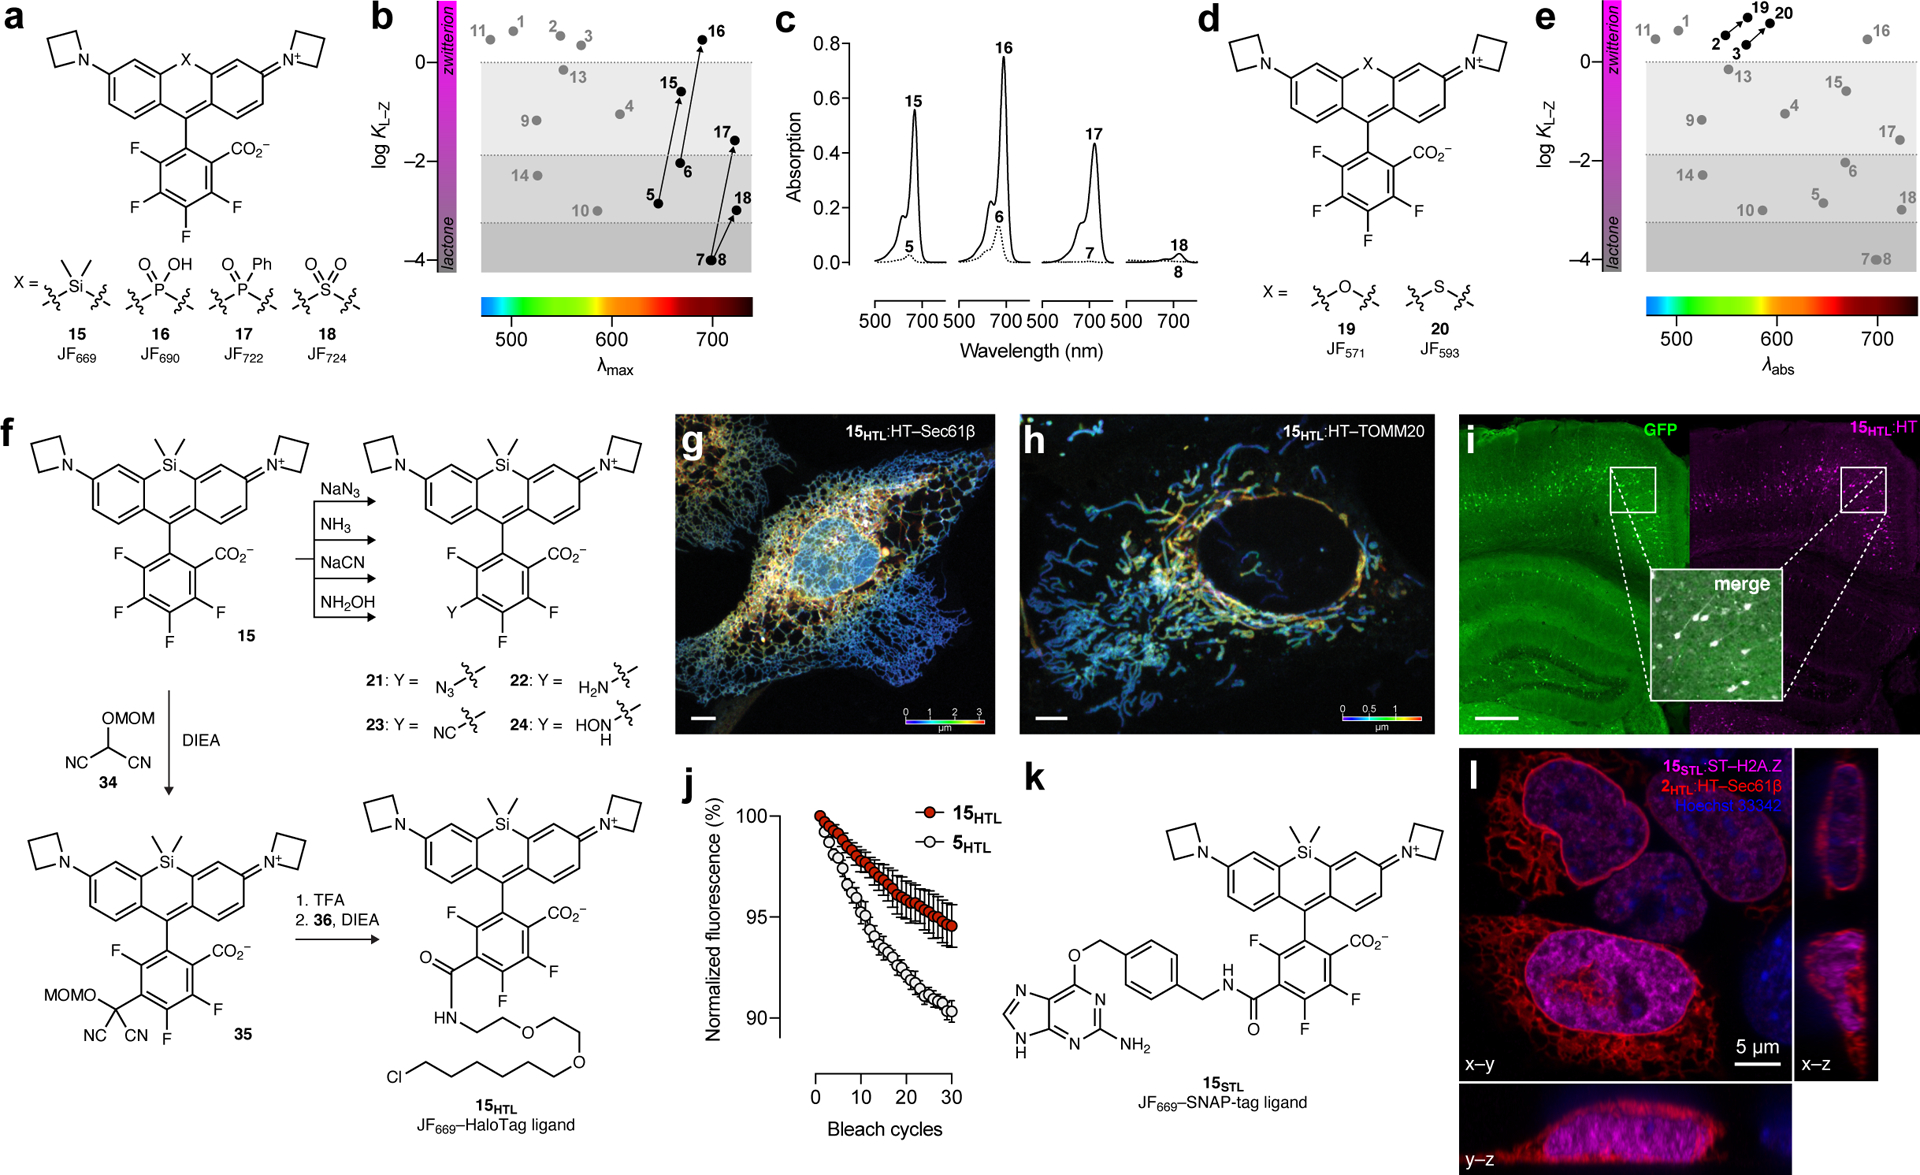
(a) Structures of dyes 15–18. (b) Plot of KL–Z vs. λabs showing increased KL–Z for dyes 15–18 relative to parent dyes 5–8. (c) Absorption spectra of 5–8 and fluorinated analogs 15–18. (d) Structures of dyes 19–20. (e) Plot of KL–Z vs. λabs showing increased KL–Z for dyes 19–20. (f) Nucleophilic aromatic substitution (SNAr) of JF669 (15) to form derivatives 21–24 and 35; subsequent synthesis of JF669–HaloTag ligand (15HTL). (g) Airyscan confocal fluorescence microscopy image of live U2OS cells expressing endoplasmic reticulum-localized HaloTag–Sec61β labeled with 15HTL (100 nM, 30 min, no wash); this imaging experiment was duplicated with similar results. (h) Airyscan confocal fluorescence microscopy image of live U2OS cells expressing mitochondria-localized HaloTag–TOMM20 labeled with 15HTL (100 nM, 30 min, no wash); this imaging experiment was duplicated with similar results; color scale in g and h indicates z-depth; scale bars: 5 μm. (i) Image of fixed coronal mouse brain slice from animal expressing GFP–HaloTag fusion protein in neurons after IV administration of 15HTL (100 nmol); scale bar = 500 μm. (j) Plot of fluorescence from fixed cells expressing HaloTag–H2B labeled with 5HTL or 15HTL (200 nM, 30 min, 3× wash) over 30 bleach cycles; error bars indicate SE; n = 3 independent cellular samples. (k) Structure of JF669–SNAP-tag ligand (15STL). (l) Airyscan confocal fluorescence microscopy image of live U2OS cells expressing Sec61β–HaloTag labeled with 2HTL (30 nM, 30 min, 3× wash) and nucleus-localized SNAP-tag–histone variant H2A.Z labeled with 15STL (30 nM, 30 min, 3× wash); co-stained with Hoechst 33342 (1 μM, 30 min, 3× wash); scale bar: 5 μm; this imaging experiment was duplicated with similar results.
We then explored derivatives of these new far-red and NIR dyes. In addition to increasing λabs and KL–Z, the halogenated phenyl ring motif can also serve as an electrophile in nucleophilic aromatic substitution (SNAr) reactions. Thiol nucleophiles have been used for decades to prepare conjugatable derivatives of fluorinated xanthene fluorophore derivatives33–35, including some Alexa Fluor dyes8, 36. The reactivity of nucleophiles other than thiols was largely unexplored, however; we discovered that N3–, CN–, NH3, and NH2OH could react with JF669 (15) to provide derivatives 21–24 (Fig. 2f). This reaction type was generalizable to other fluorinated rhodamines and regioselective at the 6-position (Supplementary Note). Although beyond the scope of this report, we briefly investigated some of these derivatives, finding azide 21 was an excellent reactant in strain-promoted ‘click chemistry’ with cyclic alkynes37 25–26 to form triazole adducts 27–28 (Extended Data Fig. 5a), validating the regiochemistry of the amine addition to form 22 using intermediates 21 and 29 (Extended Data Fig. 5b), and testing the reactivity of amine-containing ion-chelating groups 30 and 31 which generated novel prototype far-red indicators for K+ and Zn2+ (32–33, Extended Data Fig. 5c–e).
Synthesis of fluorescent labels for cellular imaging.
We then sought derivatives optimized for labeling strategies such as the HaloTag and SNAP-tag. Ligands based on 6-carboxyrhodamines are particularly attractive since compounds with this regiochemistry show superior labeling efficiency and lower toxicity27, 30. Although 6-carboxy-4,5,7-trifluororhodamines were unknown, we were encouraged by the selectivity of thiol and amine addition (Fig. 2f). We therefore explored malonates and related carbon nucleophiles, all of which gave a regioselective reaction at the 6-position (Supplementary Note). In particular, the addition of masked acyl cyanide38 reagent 34, an umpolung-type acyl anion equivalent, to JF669 resulted in intermediate 35, which could be deprotected to yield a reactive acyl cyanide suitable for direct conjugation with the HaloTag ligand amine (36) to form JF669–HaloTag ligand (15HTL; Fig. 2f, Extended Data Fig. 6a). As expected from the JF669 KL–Z value = 0.262 (Fig. 2b, Table 1), compound 15HTL was useful in cell biological experiments (Fig. 2g–h) and was also BBB permeable, labeling HaloTag-expressing neurons throughout the mouse brain after intravenous (IV) administration (Fig. 2i, Extended Data Fig. 6b). The fluorination also improves photostability, with 15HTL bleaching slower compared to the parent JF646–HaloTag ligand (5HTL, Fig. 2j, Extended Data Fig. 6c). The JF669–SNAP-tag ligand (15STL; Fig. 2k) was an excellent live-cell label with low nonspecific staining (Fig. 2l, Extended Data Fig. 6d–e). This chemistry was generalizable across fluorinated rhodamines, allowing facile synthesis of HaloTag ligands 15HTL–20HTL from dyes 15–20 with λabs ranging from the yellow to NIR (Fig. 3a, Extended Data Fig. 6a,f, Supplementary Note). These compounds selectively labeled HaloTag fusions in cells (Fig. 3a) and, like the JF669–HaloTag ligand (15HTL, Fig. 2j), the fluorinated dye ligands 19HTL and 20HTL showed higher photostability than their nonfluorinated congeners (2HTL and 3HTL; Extended Data Fig. 6c,g–h). We note this novel late-stage, regioselective introduction of a carboxy group has distinct advantages over classic rhodamine syntheses that generate isomeric mixtures39, 40 and will be useful for synthesizing derivatives beyond self-labeling tag ligands.
Figure 3. Fine-tuning of NIR rhodamines.
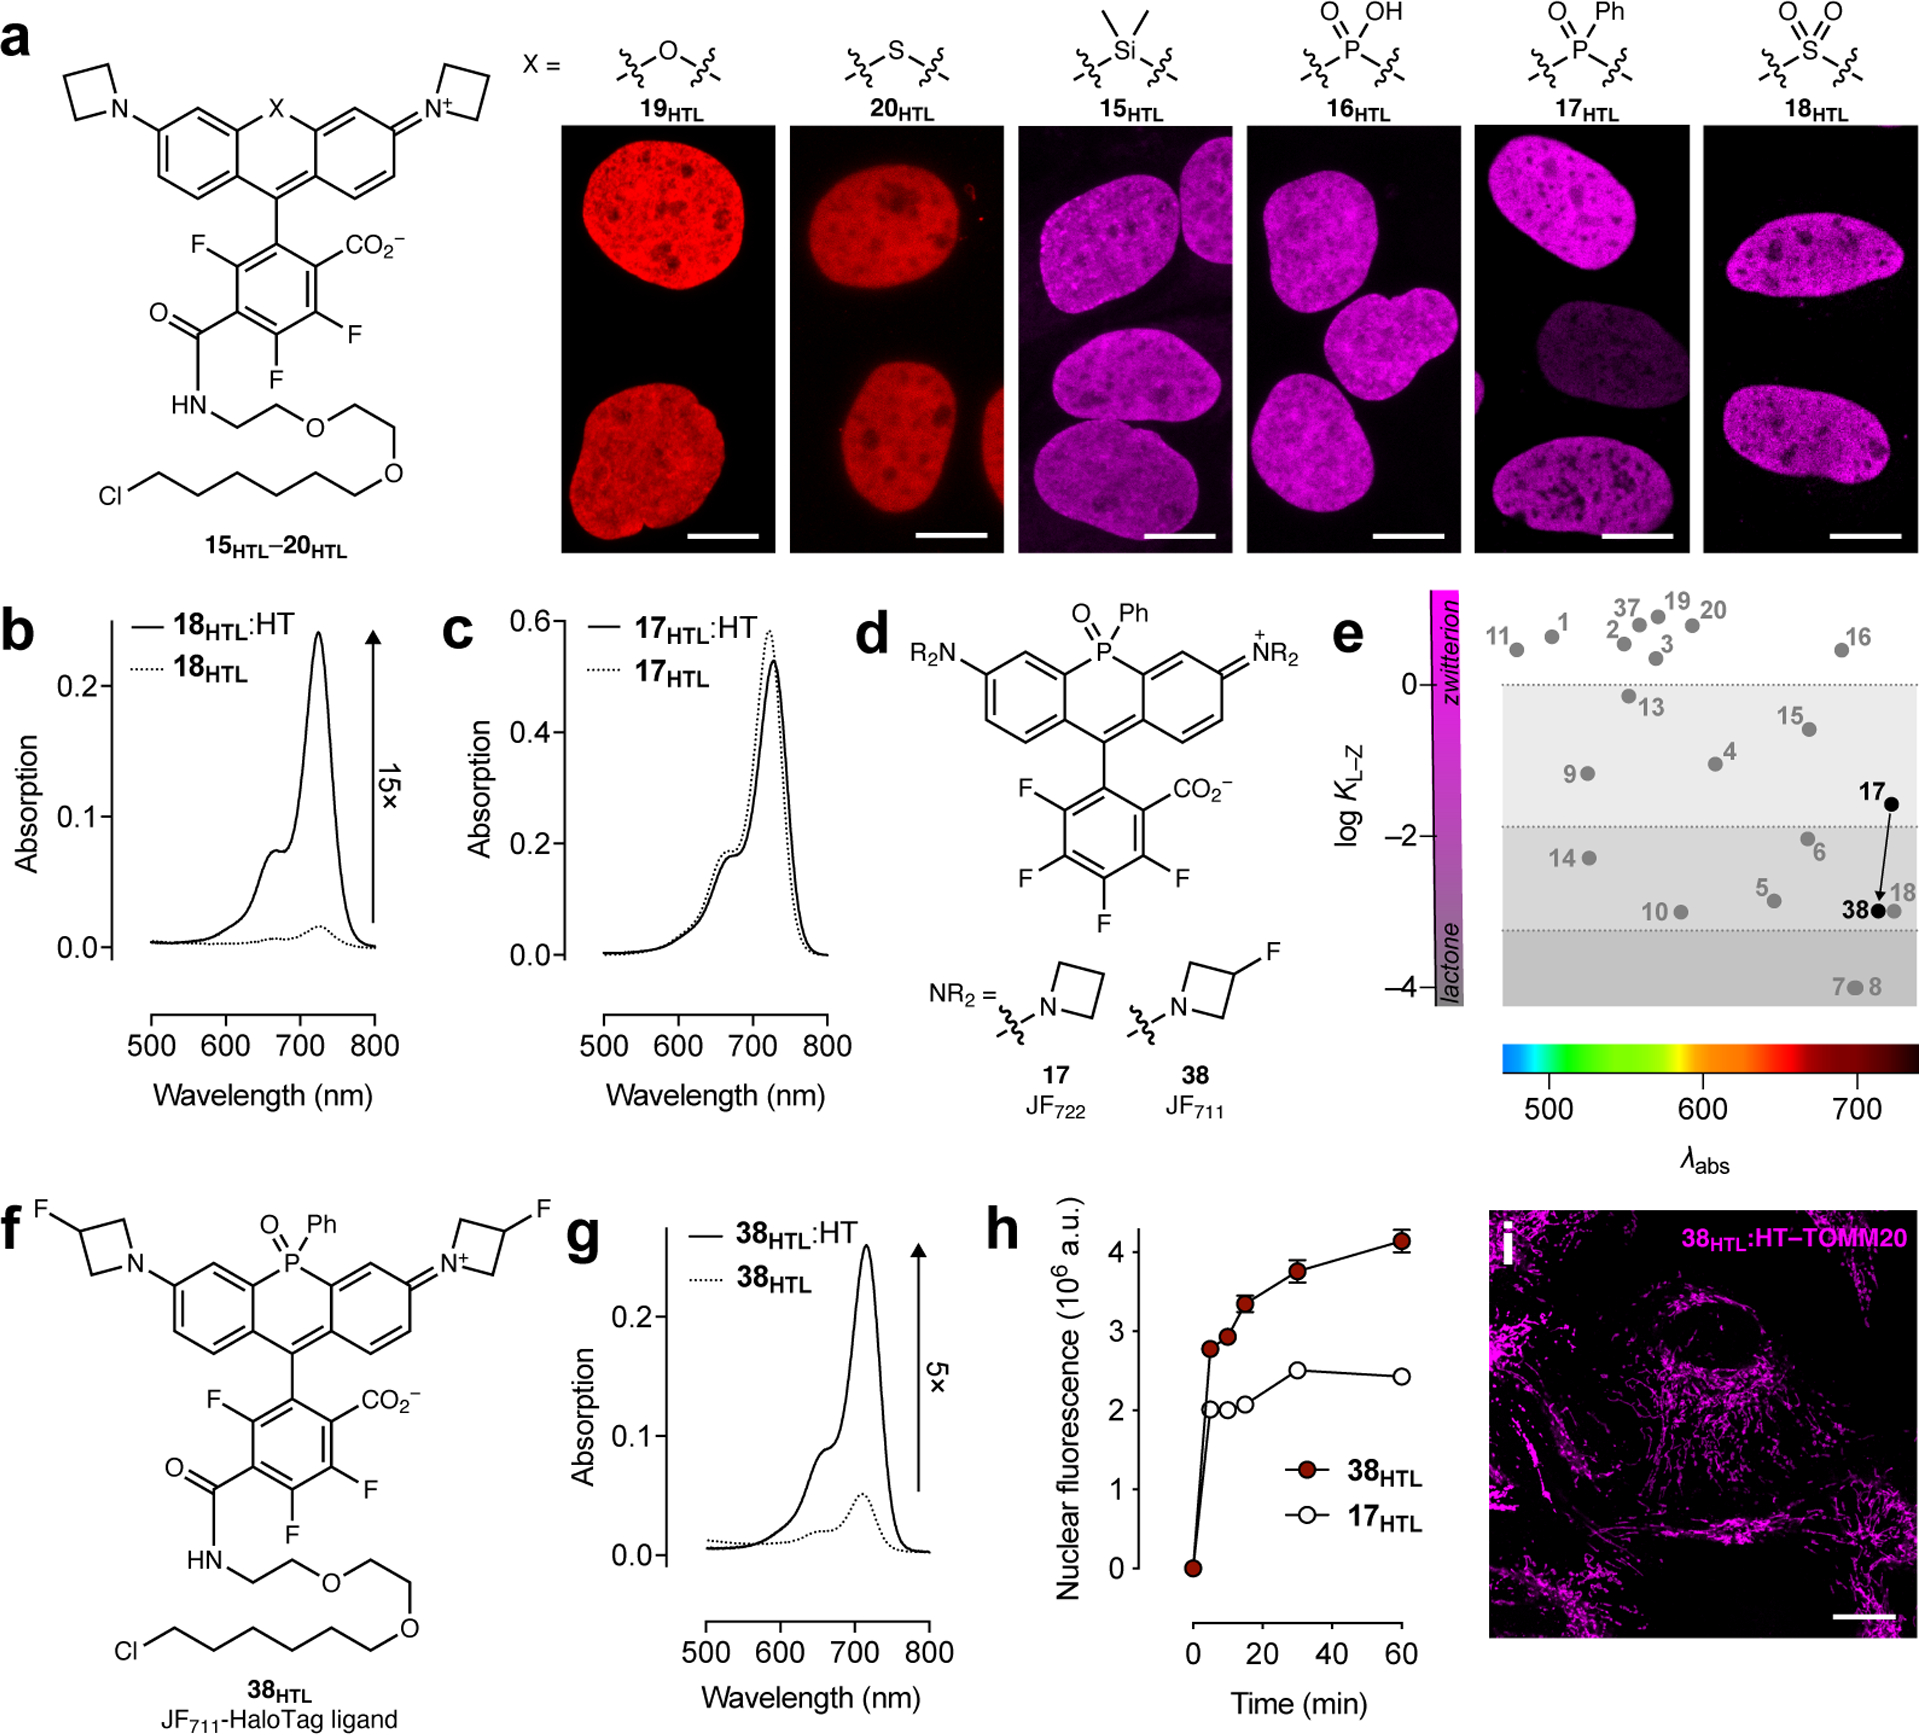
(a) Structures of HaloTag ligands 15 HTL–20HTL and high-magnification images of fixed U2OS cell nuclei expressing HaloTag–histone H2B and labeled with 15HTL–20HTL (100–200 nM, 30 min, 3× wash); scale bars: 10 μm; the imaging experiments were duplicated with similar results. (b) Absorption spectra of JF724–HaloTag ligand in the absence (18HTL) or presence (18HTL:HT) of excess HaloTag protein. (c) Absorption spectra of JF722–HaloTag ligand in the absence (17HTL) or presence (17HTL:HT) of excess HaloTag protein. (d) Structures of dyes 17 and 38. (e) Plot of KL–Z vs. λabs showing decreased KL–Z for dye 38. (f) Structure of JF711–HaloTag ligand (38HTL). (g) Absorption spectra of JF711–HaloTag ligand in the absence (38HTL) or presence (38HTL:HT) of excess HaloTag protein. (h) Nuclear fluorescence vs. time upon addition of ligands 17HTL or 38HTL (100 nM) to fixed cells expressing HaloTag–histone H2B; error bars indicate SE; n = 100 nuclei from three fields of view except for t = 30 min with compound 17HTL where n = 97 nuclei. (i) Confocal imaging experiment of fixed U2OS cells expressing HaloTag–TOMM20 labeled with 38HTL (1 μM, 30 min, 3× wash); scale bar: 20 μm; this imaging experiment was duplicated with similar results.
Fine-tuning of NIR labels.
Finally, we sought to optimize NIR HaloTag ligands for biological imaging. The SO2-containing rhodamine JF724 (18) possessed a promising KL–Z = 10–3 for creating fluorogenic compounds; the JF724–HaloTag ligand (18HTL) showed a 15-fold increase upon reaction with HaloTag protein in vitro (Fig. 3b). Nevertheless, this dye was plagued with a low Φ = 0.05 (Table 1), making it suboptimal for imaging experiments. In contrast, the P(O)Ph-containing fluorophore JF722 (17) exhibits a larger Φ = 0.11 but also a relatively high KL–Z = 0.026; as expected the JF722–HaloTag ligand (17HTL) was not fluorogenic (Fig. 3c). We investigated whether our two tuning strategies could work synergistically, using JF571 (19, Fig. 2d) as a proof-of-concept. We introduced a fluorine substituent on each azetidine ring to create JF559 (37; Extended Data Fig. 7a) and found this dye exhibits KL–Z = 6.22, intermediate between JF549 (2; KL–Z = 3.5) and JF571 (20; KL–Z = 7.93; Table 1, Extended Data Fig. 7b–d), demonstrating the compatibility of these strategies. The JF559–HaloTag ligand (37HTL) could be used in live cell labeling (Extended Data Fig. 7e–f). We then applied this modification to JF722, synthesizing the 3-fluoroazetidinyl JF711 (38, Fig. 3d, Extended Data Fig. 7g). The fluorination in JF711 gave a further improvement in Φ = 0.17 (Table 1) and was predicted to yield fluorogenic ligands based on its KL–Z = 10–3 (Fig. 3e). In line with our KL–Z rubric, the JF711–HaloTag ligand 38HTL (Fig. 3f) showed a 5-fold increase upon binding HaloTag (Fig. 3g). We compared JF711 ligand 38HTL with the parent JF722–HaloTag ligand (17HTL) in cells. Consistent with the Φ values of the parent dyes (Table 1) and our KL–Z-based framework (Fig. 1b, Fig. 3e) we found that the JF711 ligand 38HTL shows higher brightness in fixed cells (Fig. 3h–i), but the JF722–HaloTag ligand (17HTL) shows better loading kinetics in live cells (Extended Data Fig. 7h) along with modestly higher photostability (Extended Data Fig. 7i). Thus, JF711 derivatives could be most useful in experiments where high brightness and low background are crucial, and JF722-based compounds could be better-suited for live-cell applications.
Discussion
In summary, we developed a rubric to relate the performance of simple rhodamine dyes to a single parameter, KL–Z (Fig. 1b), and discovered an inverse correlation between KL–Z and λabs (Fig. 1d). We validated this rubric by using our established tuning strategies4 to decrease KL–Z and λabs, resulting in the GFP-like JF479 (11; Fig. 1e–i) and an optimized SNAP-tag ligand based on JF552 (13; Fig. 1j–n). The NIR-excited dyes 7 and 8 posed a new challenge, with low KL–Z values that rendered the compounds unusable in biological environments (Fig. 1d). We therefore established a complementary general method to increase both λabs and KL–Z by incorporating fluorines on the pendant phenyl ring of rhodamine dyes (Fig. 2a–b) followed by facile, generalizable SNAr chemistry to install groups for bioconjugation (Fig. 2f). This strategy yielded the bioavailable JF669 (15, Fig. 2g–l) along with other new fluorophores (16–20, Fig. 3a) and could be combined with our previous tuning method to rationally design the fluorogenic NIR-excited JF711–HaloTag ligand (38HTL, Fig 3f–i). Although we have focused here on HaloTag and SNAP-tag ligands and mammalian systems, we expect this general rubric relating KL–Z to cellular performance (Fig. 1b) could be customized for other ligand types and biological systems7. More generally, we anticipate this expanded fluorophore palette and new derivatization chemistry will facilitate the synthesis of novel ligands, labels, stains, and indicators for biological imaging experiments in cells or animals.
Online Methods
Chemical synthesis.
Methods for chemical synthesis, full characterization of all novel compounds, and crystallographic confirmation of regioselective SNAr can be found in the Supplementary Note.
General UV–vis and fluorescence spectroscopy (Fig. 2c; Table 1; Extended Data Fig. 1a–b; Extended Data Fig. 4b–g; Extended Data Fig. 5d–e; Extended Data Fig. 7d,g).
Fluorescent and fluorogenic molecules for spectroscopy were prepared as stock solutions in DMSO and diluted such that the DMSO concentration did not exceed 1% v/v. Spectroscopy was performed using 1-cm path length, 3.5-mL quartz cuvettes or 1-cm path length, 1.0-mL quartz microcuvettes from Starna Cells. All measurements were taken at ambient temperature (22 ± 2 °C). Absorption spectra were recorded on a Cary Model 100 spectrometer (Agilent). Fluorescence spectra were recorded on a Cary Eclipse fluorometer (Varian). Maximum absorption wavelength (λabs), extinction coefficient (ε), and maximum emission wavelength (λem) were measured in 10 mM HEPES, pH 7.3 buffer; reported values for ε are averages (n = 3). Normalized spectra are shown for clarity. For prototype ion indicators 32 and 33 (Extended Data Fig. 5d–e) the compounds were dissolved in 10 mM HEPES, pH 7.3 buffer alone or with either 100 mM KCl or 10 μM ZnCl2; the fluorescence emission spectra of these solutions were recorded using λex = 575 nm and λem = 625–825 nm.
Determination of KL–Z (Fig. 1d,f,k; Fig. 2b,e; Fig. 3e; Table 1; Extended Data Fig. 7b–c).
We calculated KL–Z using the following equation5: KL–Z = (εdw/εmax)/(1 – εdw/εmax). εdw is the extinction coefficient of the dyes in a 1:1 v/v dioxane:water solvent mixture; this dioxane–water mixture was chosen to give the maximum spread of KL–Z values4. εmax refers to the maximal extinction coefficients measured in different solvent mixtures empirically determined depending on dye type: 0.1% v/v TFA in ethanol for the Si-rhodamines (5 and 15); 0.1% v/v trifluoroacetic acid (TFA) in 2,2,2-trifluoroethanol (TFE) for all the other rhodamine variants. We note that accurate determination of low KL–Z values (≤ 10−3) is complicated by the relatively poor sensitivity of absorbance measurements. We estimated KL–Z = 10−3 when we observed a small but significant absorbance signal in 1:1 v/v dioxane:water solvent mixture over the dye-free control, and KL–Z ≈ 10−4 when we observed no significant absorbance of the dye solution.
Quantum yield determination (Table 1).
All reported absolute fluorescence quantum yield values (Φ) were measured in our laboratory under identical conditions using a Quantaurus-QY spectrometer (model C11374, Hamamatsu). This instrument uses an integrating sphere to determine photons absorbed and emitted by a sample. Measurements were carried out using dilute samples (A < 0.1) and self-absorption corrections41 were performed using the instrument software. Reported values are averages (n = 3).
Absorption increase of ligands upon binding HaloTag protein (Fig. 3b,c,g).
HaloTag protein was used as a 100 μM solution in 75 mM NaCl, 50 mM TRIS·HCl, pH 7.4 with 50% v/v glycerol (TBS–glycerol). Absorption measurements were performed in 1-mL quartz cuvettes. A solution of HaloTag ligands 17HTL, 18HTL, or 38 HTL (5 μM) was prepared in 10 mM HEPES, pH 7.3 containing 0.1 mg·mL–1 CHAPS. An aliquot of HaloTag protein (1.5 equiv, 7.5 μM final [HaloTag]) was added and the resulting mixture was incubated until consistent absorption signal was observed (60–120 min). An equivalent volume of TBS–glycerol blank was added in place of enzyme to record the ‘ligand-only’ absorption. Spectra are averages (n = 2).
Fluorescence spectroscopy of HaloTag conjugates (Fig. 1h; Extended Data Fig. 2b).
HaloTag protein was used as a 200 μM solution in PBS buffer pH 7.4. A solution of HaloTag ligands 11HTL or 12HTL (5 μM) was prepared in 10 mM HEPES, pH 7.3 containing 0.1 mg·mL–1 CHAPS. An aliquot of HaloTag protein (2 equiv, 10 μM final) was added and the resulting mixture was incubated at 4 °C overnight. Fluorescence measurements were performed after the HaloTag conjugate solutions were diluted 5× (1 μM final [ligand]) into 10 mM HEPES, pH 7.3 buffer solution. Spectra are averages (n = 2). The spectra of GFP (Fig. 1h) was taken from FPbase (https://www.fpbase.org/protein/egfp/)42.
Multiphoton spectroscopy of dyes and HaloTag conjugates.
For compounds 1, 11, and the fluorescein control (Extended Data Fig. 1c) solutions of the free dyes (5 μM) were prepared in 10 mM HEPES buffer, pH 7.3. For other rhodamines (Extended Data Fig. 6f), spectra of the HaloTag conjugates were measured. As above, solutions of HaloTag ligands compounds 15HTL–20HTL and 37HTL–38HTL (5 μM) were prepared in 10 mM HEPES, pH 7.3 containing 0.1 mg·mL–1 CHAPS. An aliquot of HaloTag protein (2 equiv, 10 μM final) was added and the resulting mixtures were incubated at 4 °C overnight. These HaloTag conjugate solutions were diluted 5× (1 μM final [ligand]) into 10 mM HEPES, pH 7.3 and the two-photon excitation spectra were measured as previously described43, 44. Briefly, measurements were taken on an inverted microscope (IX81, Olympus) equipped with a 60×, 1.2NA water objective (Olympus). Dye–protein samples were excited with pulses from an 80 MHz Ti-Sapphire laser (Chameleon Ultra II, Coherent) for 710–1080 nm and with an OPO (Chameleon Compact OPO, Coherent) for 1000–1300 nm. Fluorescence collected by the objective was passed through a dichroic filter (675DCSXR, Omega) and a short pass filter (720SP, Semrock) and detected by a fiber-coupled Avalanche Photodiode (SPCM_AQRH-14, Perkin Elmer). All excitation spectra are corrected for the wavelength-dependent transmission of the dichroic and band-pass filters, and quantum efficiency of the detector. Spectra are averages (n = 2).
General cell culture and fluorescence microscopy.
All cell lines undergo regular mycoplasma testing by the Janelia Cell Culture Facility. Unless otherwise noted, U2OS cells (ATCC) were cultured in Dulbecco’s modified Eagle medium (DMEM, phenol red-free; Life Technologies) supplemented with 10% v/v fetal bovine serum (FBS, Life Technologies), 1 mM GlutaMAX (Life Technologies) and maintained at 37 °C in a humidified 5% (v/v) CO2 environment. For confocal and widefield imaging of cell nuclei (Fig. 1i; Fig. 3a; Extended Data Fig. 1f,h; Extended Data Fig. 2c–h; Extended Data Fig. 7f), we used U2OS cells with an integrated HaloTag–histone H2B fusion protein expressing plasmid via the piggyBac transposon system unless otherwise noted. For confocal imaging of mitochondria (Fig. 3i), we used U2OS cells with an integrated TOMM20–HaloTag fusion protein expressing plasmid unless otherwise noted; TOMM20 is an outer mitochondrial membrane protein as part of a protein translocase complex. These cell lines were kept under the selection of 500 μg/mL Geneticin (Life Technologies). For confocal imaging of the cell surface (Extended Data Fig. 1g,i), we used U2OS cells transiently transfected by nucleofection (Lonza) with a plasmid expressing a C-terminal transmembrane anchoring domain from platelet-derived growth factor receptor (PDGFR) fused to the HaloTag protein (HaloTag–PDGFR). Unless otherwise noted, cells were imaged on the following microscopes: Nikon Eclipse Ti with a Plan APO λ 20×/0.75 air objective, Leica SP8 Falcon confocal microscope with an HC PL-APO 86×/1.20 water objective; Zeiss LSM 800 confocal microscope with a Plan APO 20×/0.8 air M27 objective or Plan APO 63×/1.4 oil DIC M27 objective; Zeiss LSM 880 with a C-APO 40×/1.2 W Corr FCS M27 objective. The Leica and Zeiss LSM 800 confocal images were processed using FIJI45. Unless otherwise noted, live cells were washed in media and fixed cells were washed in phosphate buffered saline. We use the following shorthand in figures: HT = HaloTag; ST = SNAP-tag; H2B =histone H2B; PDGFR = C-terminal transmembrane anchoring domain from platelet-derived growth factor receptor; H2A.Z = histone variant H2A.Z
Multiplexed imaging comparison JF503 and JF479 (Fig. 1i; Extended Data Fig. 2c–h).
U2OS cells stably expressing HaloTag–histone H2B fusion protein were transiently transfected with plasmids encoding pSNAPf–TOMM20 fusion protein using nucleofection (Lonza). Live cells were incubated with JF479–HaloTag ligand (11HTL, 500 nM) or JF503–HaloTag ligand (12HTL; 500 nM; Extended Data Fig. 1d) for 3 h followed by addition of JF525–cpSNAP-tag ligand (9STL, 100 nM, Extended Data Fig. 2a) and incubated for an additional 30 min. These cells were then washed 3× in dye free media and imaged (Fig. 1i) using tunable white light laser (WLL) excitation at 488 nm or 532 nm on a Leica SP8 Falcon confocal microscope with an HC PL-APO 86×/1.20 water objective. The images are displayed as maximum intensity projections of confocal image stacks. These images were processed and associated line-scans were extracted using FIJI45.
Flow cytometry loading experiments (Fig. 1m; Extended Data Fig. 3a–d).
This experiment utilized the mouse embryonic stem cell line JM8.N4, a gift from R. Tjian (Berkeley), derived from the C57BL/6N strain. The JM8.N4 cells were authenticated by short tandem repeat DNA profiling and approved by the NIH 4D Nucleome project as a Tier2 cell line. Wild-type mouse embryonic stem (ES) cells or ES cells stably expressing SNAP-tag–histone H2B fusion protein were plated into onto flat-bottom 96-well microplates precoated with 0.1% gelatin (Corning). Cells were washed 3× for 10 min, trypsinized, and loaded onto CytoFLEX S flow cytometer equipped with a plate loader (Beckman Coulter). The ES cell population was designated based on its forward light scatter (FSC) and side light scatter (SSC) characteristics (Extended Data Fig. 3a). The gating strategy to determine the nonfluorescent cell population used control ES cell samples not incubated with SNAP-tag ligands, plotting SSC vs. fluorescence from the Y585-PE channel (phycoerythrin; 561 nm laser excitation, 585 nm with a 42 nm bandpass emission, avalanche photodiode detector; Extended Data Fig. 3b). For the assays, cells at 70% confluency were stained with JF549–cpSNAP-tag ligand (2STL) or JF552–cpSNAP-tag ligand (13STL) at different concentrations (3 nM, 10 nM, 30 nM, 100 nM, 300 nM) for 15 min (Fig. 1m) or at different time points (15 min, 30 min, 60 min, 120 min, 210 min) using 10 nM ligand (Extended Data Fig. 3c–d). A typical experiment recorded 20,000 cells per condition and the percentage of fluorescently positive cells was determined. For the experimental replicates, the mouse embryonic stem cell line used for flow cytometry analysis had between 85–98% expression of SNAP-tag–histone H2B as determined against negative fluorescence gating. Sample dilution and flow rate were adjusted to optimize event recordings for the 96-well microplate format. The instrument settings were as follows: FSC avalanche photodiode (AP) detector gain setting = 12; SSC AP detector gain setting = 130; FSC threshold Automatic; PE channel AP gain setting = 1. The experimental data from the CytoFLEX was analyzed using FlowJo v.10.6.1. In some cases, not all concentrations or timepoints could be sampled during every run due to microplate and instrument constraints. For experiments varying loading concentration (Fig. 1m) replicates were as follows: experiments using 2STL n = 7 except for [ligand] = 3 nM where n = 5; experiments using 13STL n = 3. For experiments varying loading time (Extended Data Fig. 3d) replicates were as follows: experiments using 2STL n = 3; experiments using 13STL n = 4 except for t = 7.5 min where n = 2 and t = 210 min where n = 3.
Single-particle tracking (SPT) experiments (Fig. 1n; Extended Data Fig. 3e–i).
SPT experiments were performed in U2OS cells with an integrated SNAP-tag–histone H2B fusion protein expressing plasmid or an integrated HaloTag–histone H2B fusion protein expressing plasmid via the piggyBac transposon system. SNAP-tag–histone H2B expressing cells were labeled with 2 nM of either JF549–cpSNAP-tag ligand (2STL) or JF552–cpSNAP-tag ligand (13STL). HaloTag–histone H2B fusion protein expressing cells were labeled with 2 nM of JF549–HaloTag ligand (2HTL). Cells were incubated with dyes for 15 min at 37 °C and then washed 3× for 30 min each. SPT was performed at 100 Hz (10 ms frames) and 5000 frames were recorded for each cell. Single molecules were localized and tracked by a MATLAB implementation of multiple target tracing (MTT) and SLIMFast31, 46. For SPT brightness (photons/s; Extended Data Fig. 3e) n = 19008 single-molecule events using 2STL and n = 9511 single-molecule events using 13STL. For SPT track length (s; Extended Data Fig. 3f) n = 10822 single-molecule events using 2STL and n = 9387 single-molecule events using 13STL. Trajectories were fitted into a two-state model: chromatin bound and diffusive (free) using diffusion coefficient (D) cut off Dbound: [0.0005,0.08] and Dfree: [0.15, 25]. The fraction of chromatin bound molecules per cell are plotted (Fig. 1n); n = 12 cells for experiments using 2STL and n = 8 cells for experiments using 13STL and 2HTL.
Airyscan imaging experiments using 15HTL (Fig. 2g–h).
U2OS cells were transiently transfected with HaloTag–Sec61β fusion protein expressing plasmid or HaloTag–TOMM20 fusion protein expressing plasmid using FuGENE HD (Promega) and maintained in DMEM containing 10% v/v FBS and penicillin–streptomycin–glutamine. Sec61β is an endoplasmic reticulum membrane protein translocator protein. Cells were incubated with 100 nM JF669–HaloTag ligand (15HTL) in full media at 37 °C for 30 min. Imaging was performed without intermediate washing steps using a Zeiss LSM 880 with Airyscan and a plan-apochromatic 63× oil objective (NA=1.4). The airyscan images were processed using the Zen software from Zeiss.
Mouse in vivo labeling experiments (Fig. 2i; Extended Data Fig. 6b).
A GFP–HaloTag fusion was expressed protein throughout the brain by systemic injection of adult C57/BL6 male mice, 2–4 months old, with the viral vector: PHP-eB-Syn-HaloTag-GFP (~5 × 10¹¹ infectious units per mL, 100 μL). The virus was injected using a 0.5 mL 27G syringe to the retro-orbital sinus. JF669–HaloTag ligand (15HTL) was administered to mice 3–4 weeks after the viral injection. Dye solution was prepared by first dissolving 100 nmol (76 μg) of 15HTL in 20 μL DMSO. After vortexing, 20 μL of a Pluronic F-127 solution (20% w/w in DMSO) was added and this stock solution was diluted into 200 μL sterile saline for IV (retro-orbital) injection. For the reported images (Fig. 2i; Extended Data Fig. 6b) the mouse was injected with virus at 122 days old, injected with 15HTL ligand at 148 days old, and perfused at 149 days old. Imaging was done on a TissueFAXS 200 confocal slide scanner (Tissuegnostics) using a SpectraX light engine (Lumencor) with the following peak powers and excitation filters: V = 395 nm (400 mW) with a 395 nm-centered extictaion filter and 25 nm band-pass; C = 475 nm (480 mW) with a 475 nm-centered excitation filter and 34 nm band-pass; G/Y = lightpipe with a 585 nm-centered excitation filter and 35 nm band-pass; R = 619 nm (629 mW) with a 635 nm-centered excitation filter and 22 nm band-pass. These excitation sources were fed by a lightguide to a Crest X-Light V2 confocal spinning disc (Crestoptics; 60 μm pinhole spinning disk) with the following dichroics: T425lpxr, T495lpxt, T600lpxr, and T660lpxr; and emission filters: ET460 nm/50 nm, ET525 nm/50 nm, ET625 nm/30 nm, ET700 nm/75 nm. The emission light was collected with the following Zeiss objectives: EC Plan-Neofluar 2.5×/0.085 M27 for tissue detection and Plan-Apochromat 20×/0.8 M27 imaging. Detection was done by a Zyla 5.5 sCMOS camera (Andor). Acquisition of the coronal sections was performed after semi-automated tissue detection and by using multiple autofocusing points per section (5×5 fields of view). Three z-planes with a 7 μum spacing were imaged and z-projected. All experimental protocols were conducted according to the National Institutes of Health guidelines for animal research and were approved by the Institutional Animal Care and Use Committee at the Janelia Research Campus, HHMI.
Photobleaching experiments (Fig. 2j; Extended Data Fig. 6g–h; Extended Data Fig. 7i).
U2OS cells expressing HaloTag–histone H2B fusion protein were co-fixed and labeled by incubation of 4% w/v PFA and 200 nM of ligands 5HTL, 15HTL, 2HTL, 19HTL, 3HTL, 20HTL, 17HTL, or 38HTL in 0.1 M phosphate buffer. Cells were washed 3× in phosphate-buffered saline and then imaged. To measure photobleaching for dyes 5HTL, 15HTL, 2HTL, 19HTL, 3HTL, and 20HTL, we used the tunable WLL excitation on the Leica SP8 Falcon confocal microscope to excite dyes at their λabs in constant power mode. For each dye wavelength we set the WLL laser percent power to equal the 50% power of the 549 nm excitation used to bleach 2HTL. For dyes 17HTL and 38HTL we performed the photobleaching experiment with excitation at 660 nm with WLL power set to 40%; n = 3.
Dye loading kinetics (Fig. 3h; Extended Data Fig. 1e; Extended Data Fig. 7h).
For live-cell labeling, U2OS cells stably expressing HaloTag–histone H2B fusion protein were labeled over a time course of 0–4 h with 200 nM of JF479–HaloTag ligand (11HTL), JF503–HaloTag ligand (12HTL), JF722–HaloTag ligand (17HTL), or JF711–HaloTag ligand (38HTL). Cells were briefly washed 2× with dye-free media and immediately imaged live using widefield microscopy on a Nikon Eclipse Ti, Plan APO λ 20×/0.75 air objective. For fixed-cell labeling, U2OS cells stably expressing HaloTag–histone H2B were co-fixed in 4% w/v PFA in 0.1 M phosphate buffer with 200 nM of either JF722–HaloTag ligand (17HTL) or JF711–HaloTag ligand (38HTL) over a time course of 0–60 min. Fluorescence was quantified from the average of the summed intensity of nuclear signals in single-plane widefield images analyzed using Nikon NIS-Elements AR software. Fields of view were chosen to obtain approximately 30 nuclei per image and a maximum of 100 nuclear signals were plotted. For 38HTL vs. 17HTL in fixed cells (Fig. 3h) n = 100 except for t = 30 min with 17HTL where n = 97. For 11HTL vs. 13HTL (Extended Data Fig. 1e) n = 100. For 38HTL vs. 17HTL in live cells (Extended Data Fig. 7h) n = 100 except for: t = 0.5 h with 38HTL where n = 86; t = 1 h with 38HTL where n = 94; t = 2 h with 38HTL where n = 96; t = 0.5 h with 17HTL where n = 94.
Airyscan imaging experiments using 15STL (Fig. 2l; Extended Data Fig. 6d–e).
U2OS cells stably expressing SNAP-tag–histone H2AZ and HaloTag–Sec61b fusion proteins were labeled with JF669-SNAP-tag ligand (15STL; 30 nM) and JF549–HaloTag ligand (2HTL; 30 nM) for 30 min, co-staining with Hoechst 33342 (1 μM; ThermoFisher). Cells were washed (3× 10 min) and then imaged using the Zeiss LSM 880 platform under the Airyscan SR mode using a plan-apochromatic 63× oil objective (NA=1.4). The Airyscan images were processed using the Zen software (Zeiss) and the fluorescence intensity line-scan (Extended Data Fig. 6e) was extracted using FIJI45.
Statistics and Reproducibility.
For spectroscopy measurements reported n values for absorption spectra, extinction coefficient (ε) and quantum yield (Φ) represent measurements of different samples prepared from the same dye DMSO stock solution or HaloTag conjugate stock solution. For flow cytometry experiments, reported n denotes separate cell samples taken from different microplate wells. For single-particle tracking brightness and track-length experiments, n indicates separate events extracted by the MTT algorithim. For fraction chromatin-bound from single-particle tracking experiments, n indicates the number of individual cells; one-way ANOVA gave adjusted P Value = 0.0013 (**) for 2STL vs. 13STL and adjusted P Value = 0.9963 (ns) for 13STL vs. 2HTL; F (2, 25) = 11.38. For photobleaching experiments, n indicates the number of separate cellular experiments where the intensity of the entire field of view was measured at the indicated time points. For cell loading experiments, n represents the number of intensity values from individual cells extracted from three fields of view at the indicated time points. For representative fluorescence microscopy and flow cytometry experiments, all procedures were duplicated at least once on a separate biological sample to ensure results were similar as indicated in the figure legends. Additional information can be found in the Life Sciences Reporting Summary.
Data Availability
The data that support the findings of this study are provided in the Source Data files or available from the corresponding author upon request.
Extended Data
Extended Data Fig. 1. Utility of JF479–HaloTag (11HTL) ligand in cellular imaging experiments.
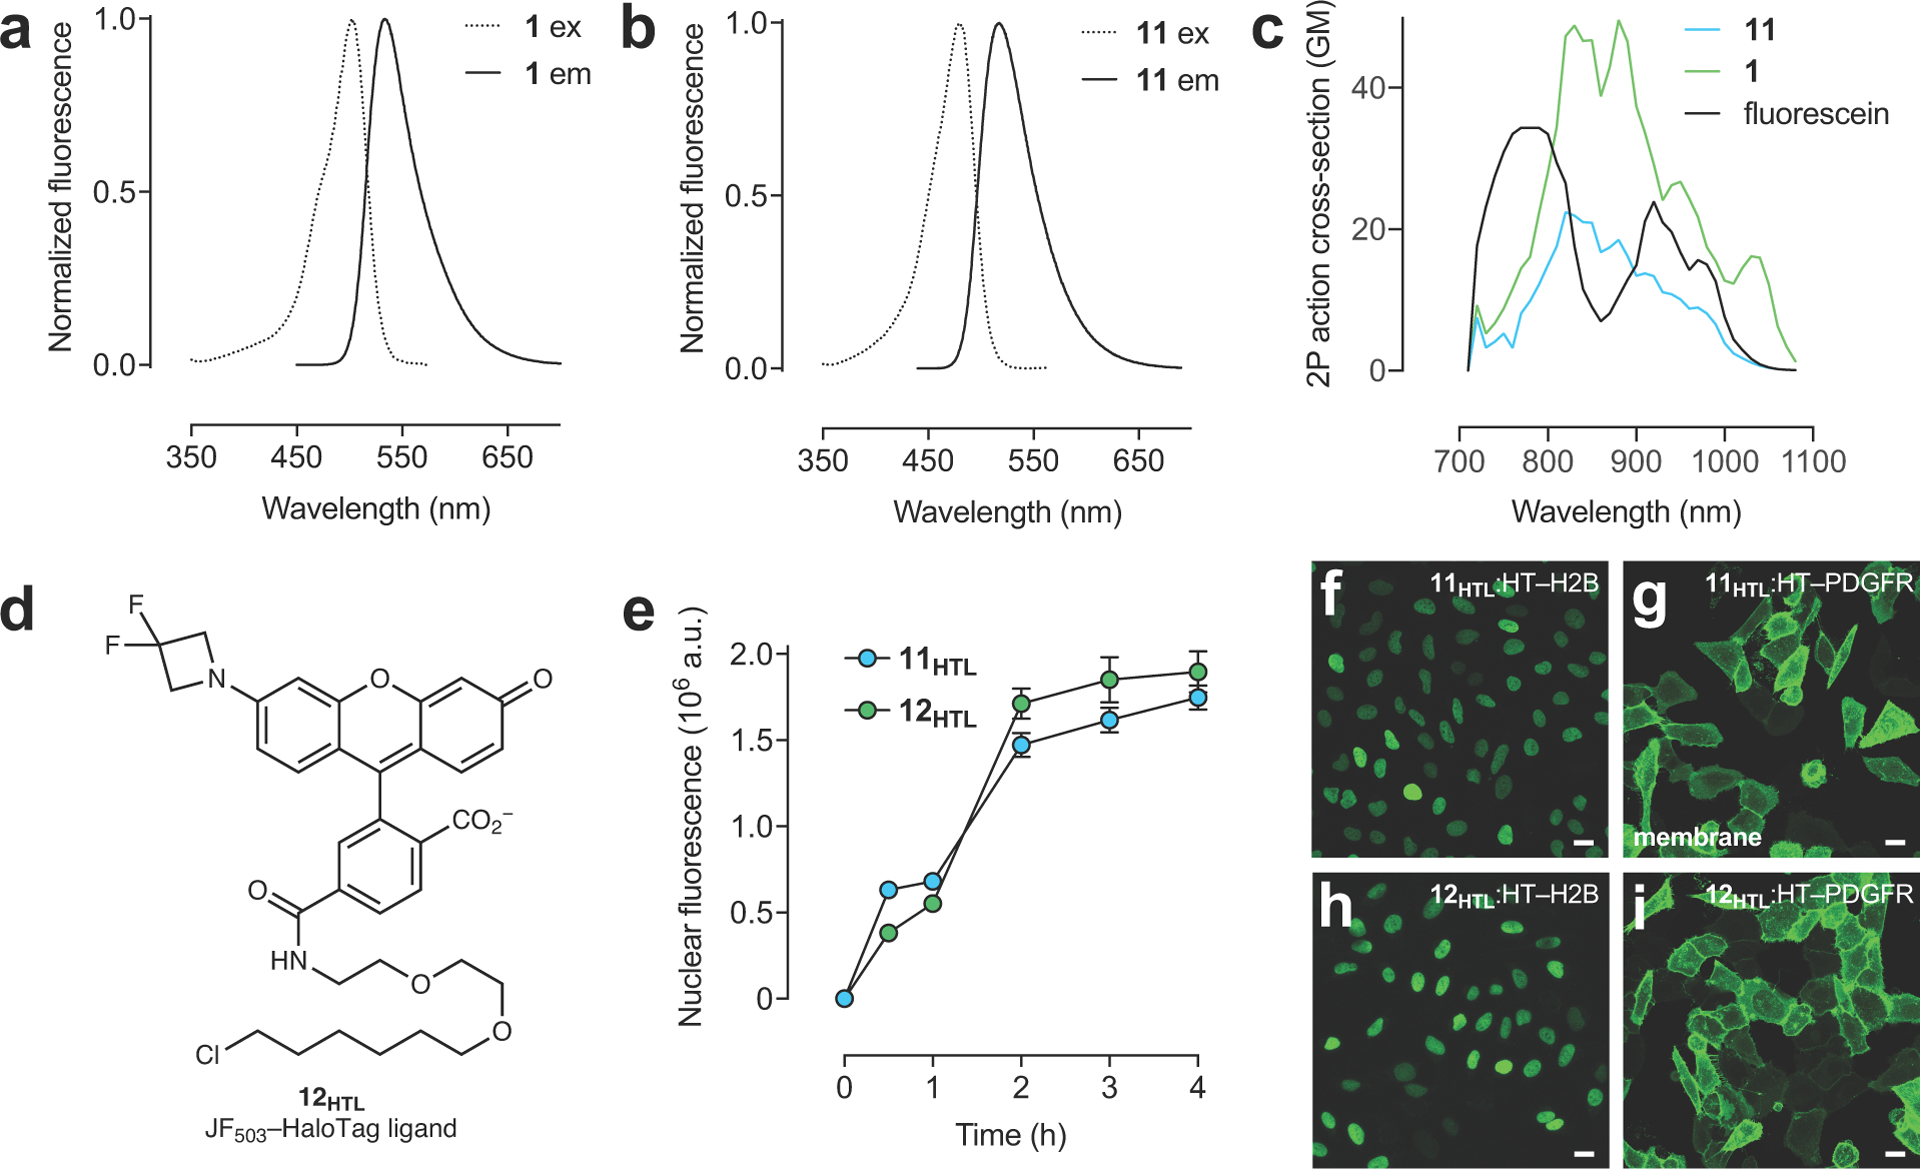
(a–b) Fluorescence excitation (ex) and emission (em) spectra of 1 (a) and 11 (b). (c) Two-photon absorption spectra of 1, 11, and reference dye fluorescein. (d) Structure of JF503–HaloTag ligand (12HTL). (e) Nuclear fluorescence vs. time upon addition of ligands 11HTL or 12HTL (200 nM) to live cells expressing HaloTag–histone H2B; error bars indicate SE; n = 100 nuclei. (f–i) Confocal imaging experiments of fixed U2OS cells expressing either HaloTag histone–H2B fusion protein (f,h; nucleus) or HaloTag–PDGFR transmembrane domain (TMD) fusion protein (g,i; plasma membrane) labeled with JF479–HaloTag ligand (11HTL; 100 nM, 1 h, 2× wash; f,g) or JF503–HaloTag ligand (12HTL; 100 nM, 1 h, 2× wash; h,i); scale bars: 21 μm; these imaging experiments were duplicated with similar results.
Extended Data Fig. 2. Comparison of JF479–HaloTag ligand (11HTL) and JF503–HaloTag ligand (12HTL) in two-color experiments with JF525–cpSNAP-tag ligand (9STL).
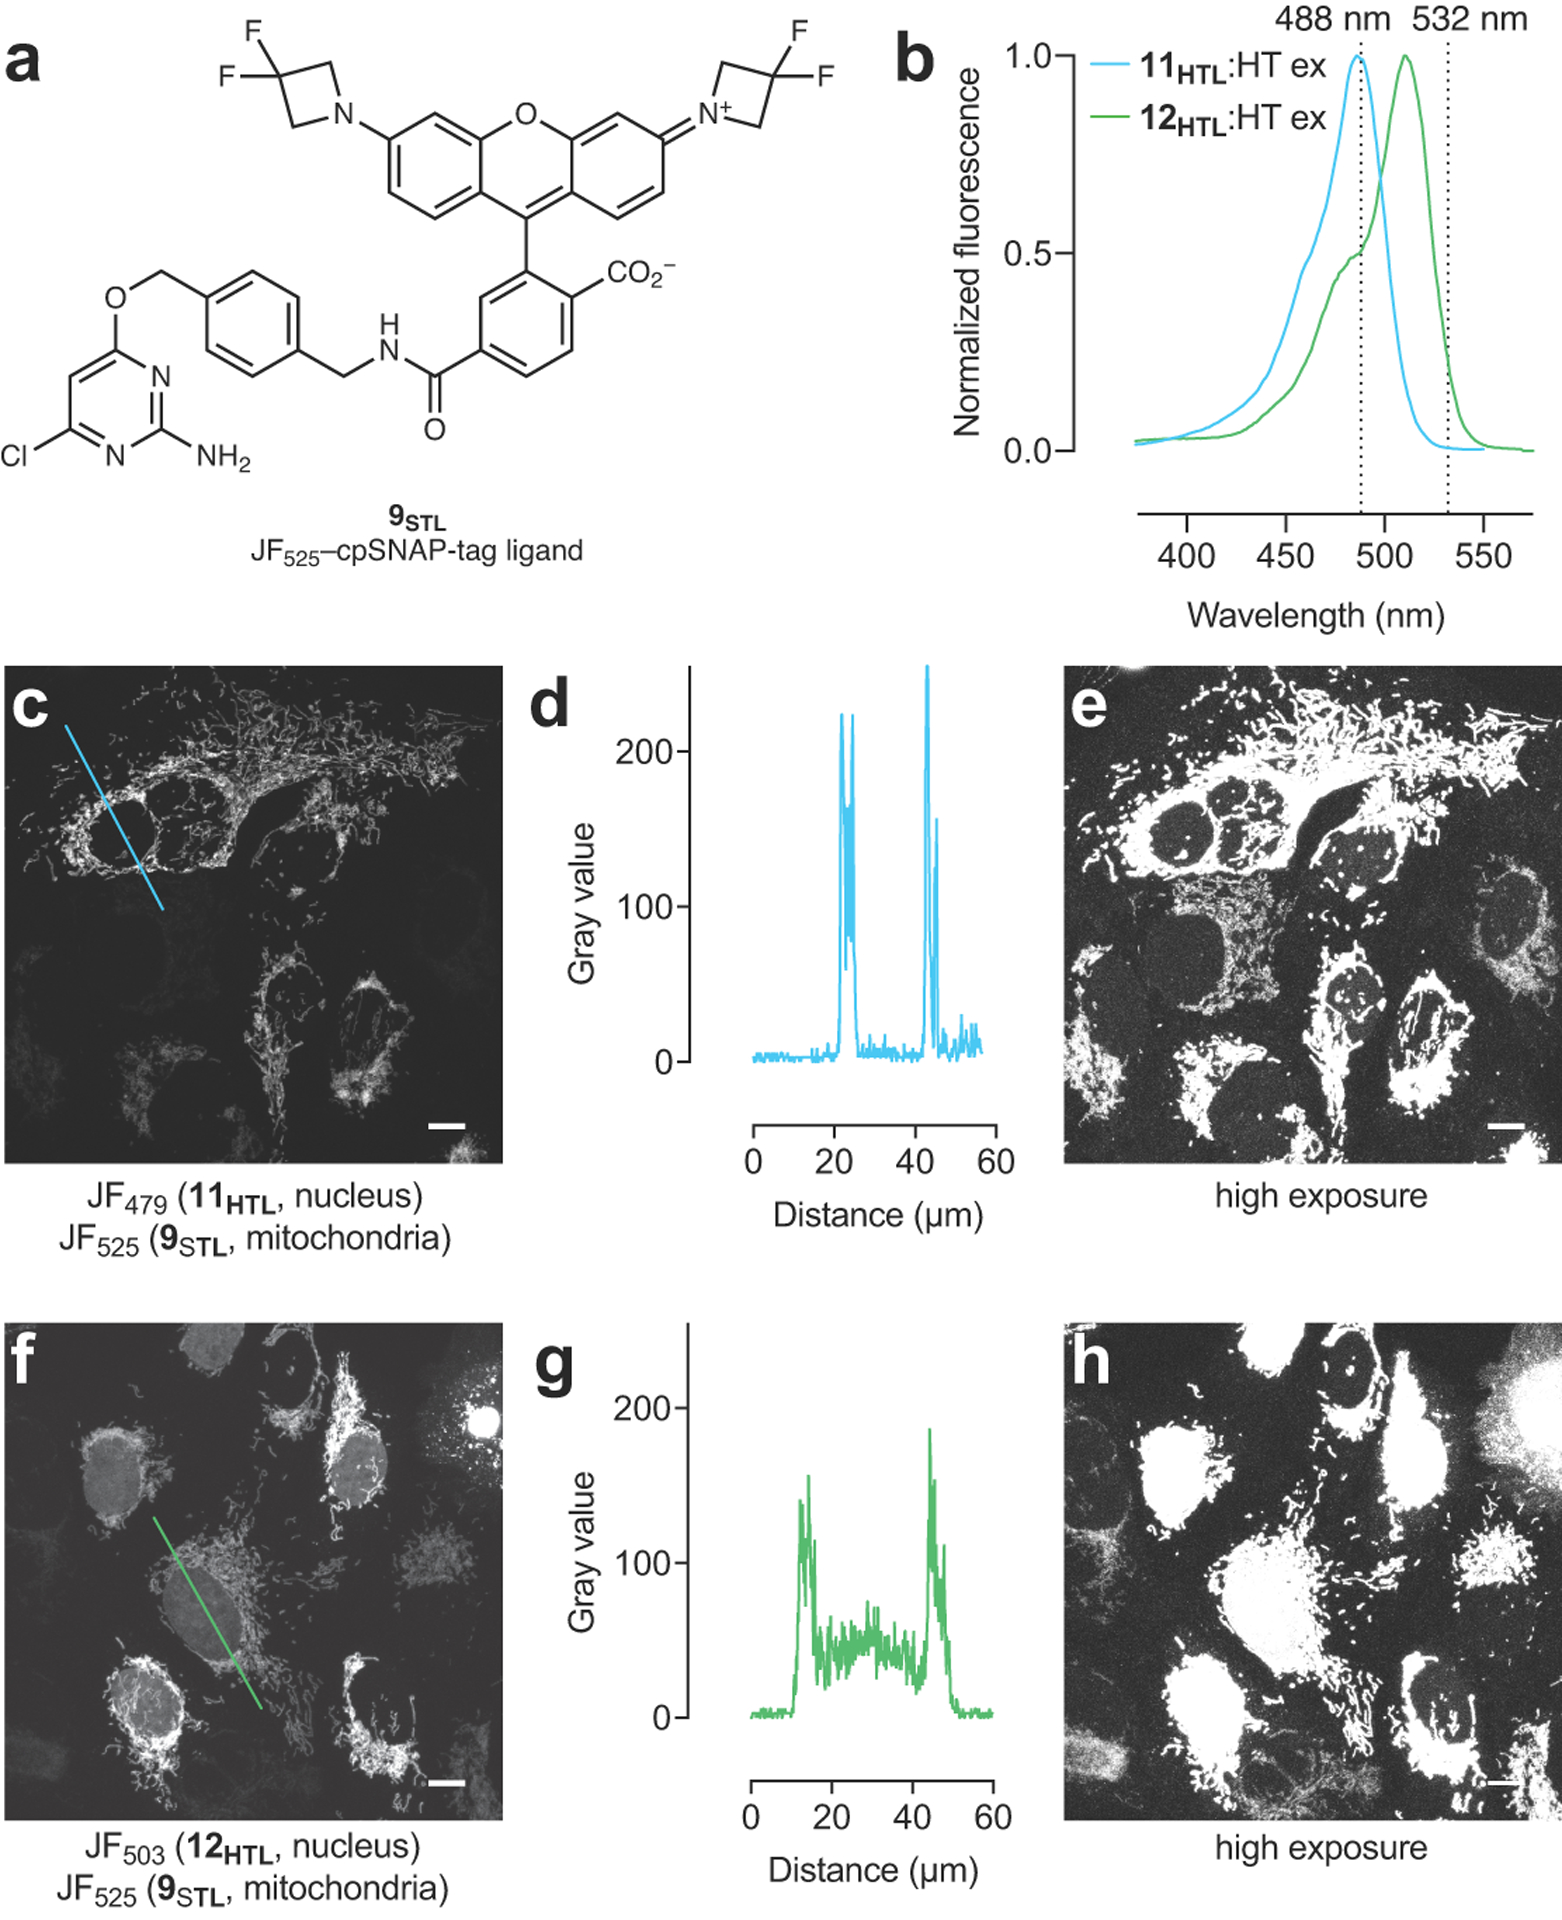
(a) Structure of JF525–cpSNAP-tag ligand (9STL). (b) Fluorescence excitation spectra of JF479–HaloTag ligand (11HTL) or JF503–HaloTag ligand (12HTL) of bound to HaloTag protein. Dashed lines highlight 488 nm or 532 nm excitation. (c–e) Enlarged confocal images and line-scan from Figure 1i showing live U2OS cells expressing HaloTag–histone H2B labeled with 11HTL (500 nM, 3.5 h, 3× wash) and TOMM20–SNAP-tag labeled with 9STL (100 nM, 30 min, 3× wash) excited with 532 nm; this imaging experiment was duplicated with similar results. (c) Confocal image from Figure 1i with blue line indicating line-scan position; (d) Line-scan profile; (e) Over-exposed image showing low nuclear signal. (f–h) Enlarged confocal images and line-scan from Figure 1i showing U2OS cells expressing HaloTag–histone H2B labeled with 12HTL (500 nM, 3.5 h, 3× wash) and TOMM20–SNAP-tag labeled with 9STL (100 nM, 30 min, 3× wash) excited with 532 nm; this imaging experiment was duplicated with similar results. (f) Confocal image from Figure 1i with green line indicating line-scan position; (g) Line-scan profile; (h) Over-exposed image showing high nuclear signal. Scale bars for all images: 10 μm.
Extended Data Fig. 3. Utility of JF552–cpSNAP-tag ligand (13STL) in cellular imaging experiments.
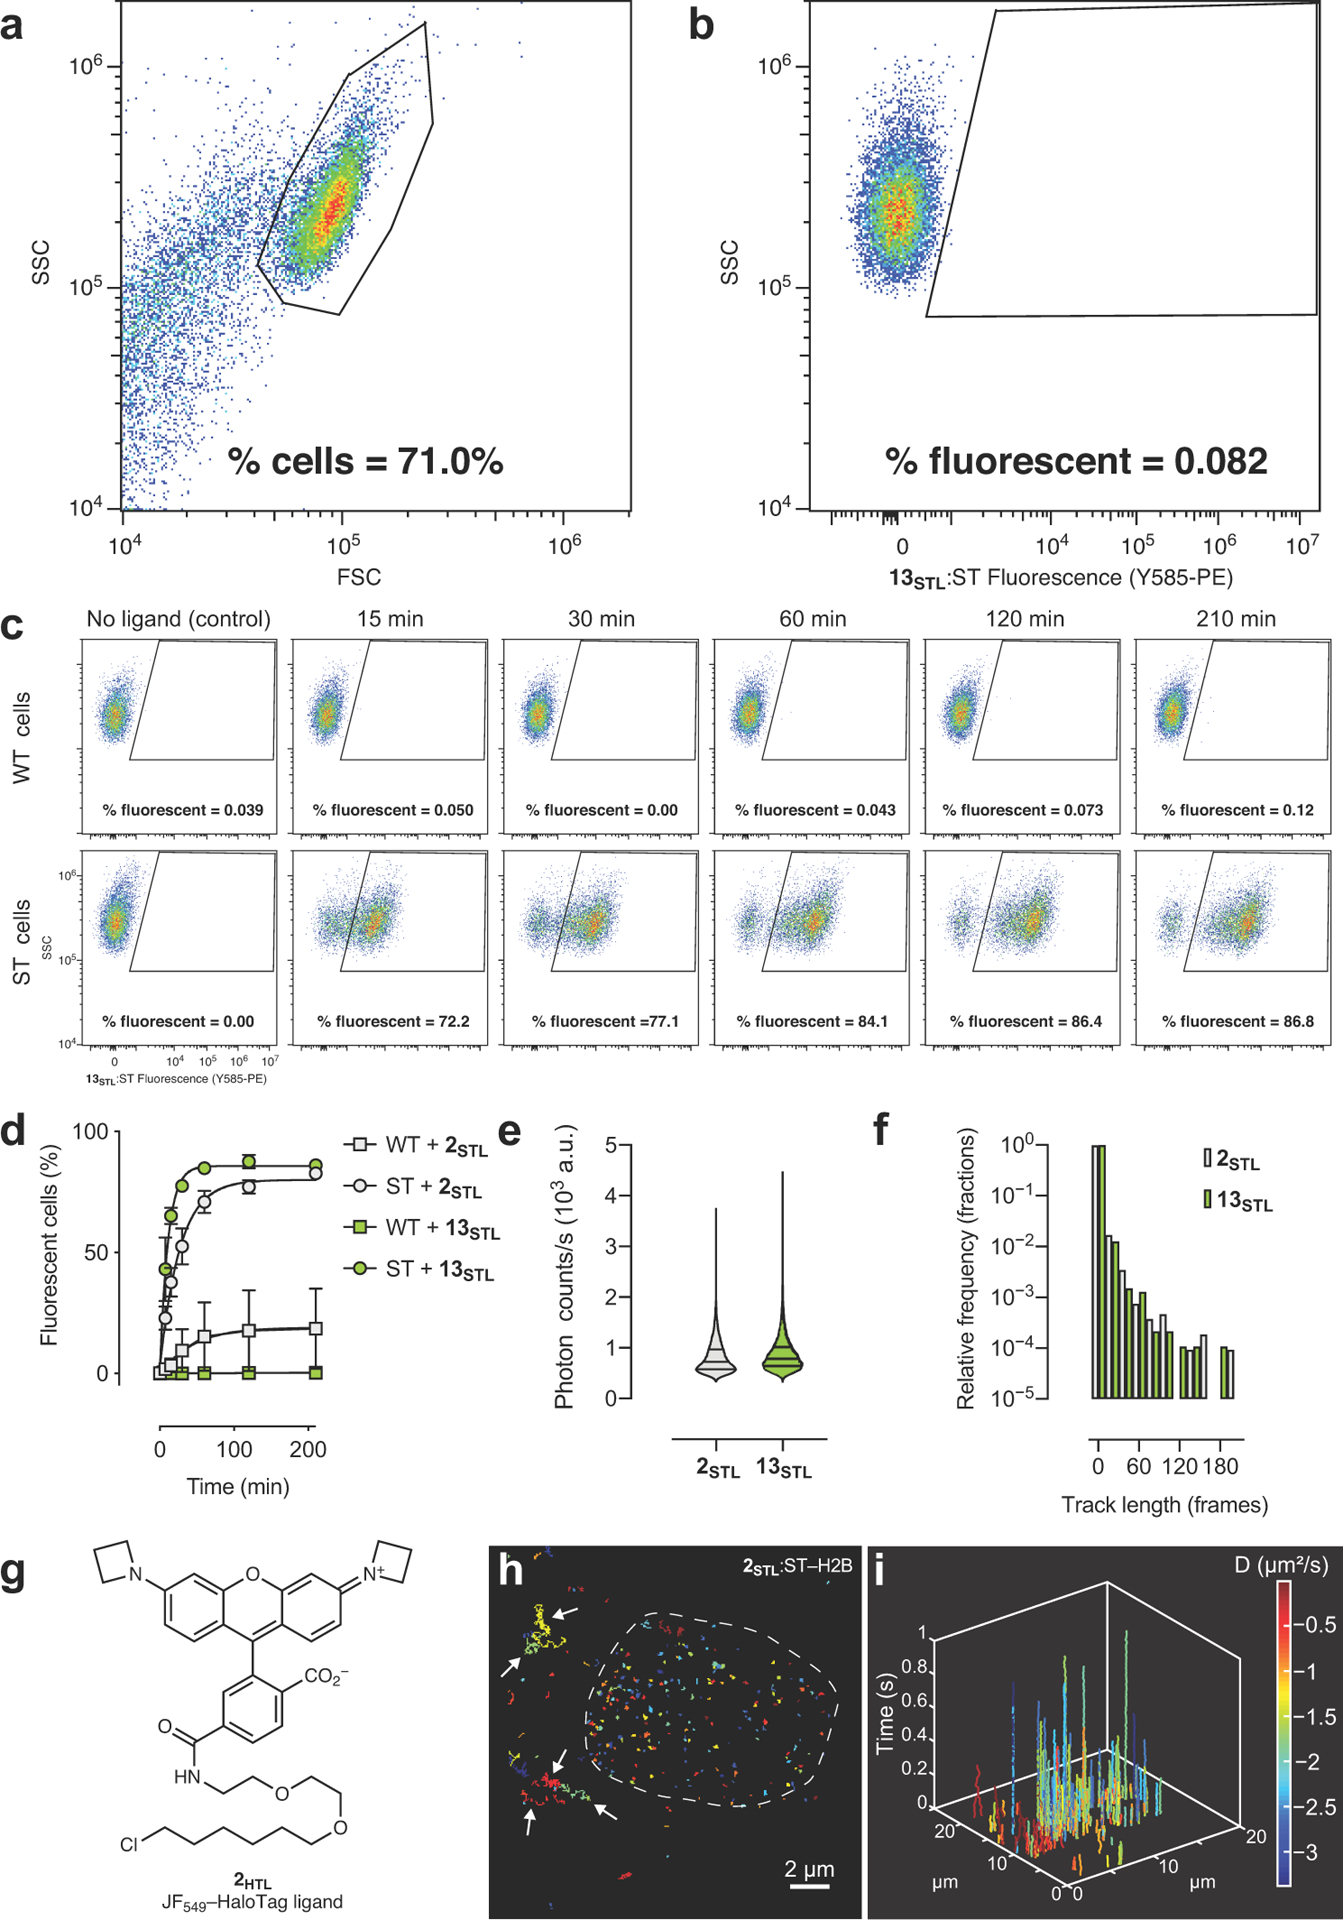
(a) Representative flow cytometry plot showing forward light scatter (FSC) vs. side light scatter (SSC) demonstrating gating strategy to separate cells from debris; experiment was duplicated with similar results. (b) Representative flow cytometry plot showing SSC vs. fluorescence of 13STL:SNAP-tag measured using the Y585-PE channel (561 nm laser excitation, 585 nm with a 42 nm bandpass emission) to demonstrate gating strategy to separate fluorescent and nonfluorescent cells; experiment was duplicated with similar results. (c) Representative flow cytometry plots showing the change in % fluorescent cells as a function of incubation time with 13STL (10 nM); top row: wild-type (WT) embryonic stem (ES) cells; bottom row SNAP-tag–histone H2B (ST) expressing ES cells; experiment was duplicated with similar results. (d) Plot of fluorescent mouse ES cells (%) vs. time determined by the flow cytometry experiment exemplified in c. WT cells or ST cells were incubated with 2STL or 13STL (10 nM) for different times and % fluorescent cells were measured; error bars show SE; experiments using 2STL n = 3; experiments using 13STL n = 4 except for t = 7.5 min where n = 2 and t = 210 min where n = 3. (e) Violin plot of photon counts from a single-particle tracking (SPT) experiment using U2OS cells expressing SNAP-tag–histone H2B and labeled with 2STL or 13STL (2 nM, 30 min, 3× wash); lines indicate median and quartiles; n = 19008 single-molecule events for experiment using 2STL and n = 9511 single-molecule events for experiment using 13STL. (f) Histogram of track lengths from SPT experiment using cells expressing SNAP-tag–histone H2B and labeled with 2STL or 13STL (2 nM, 30 min, 3× wash); n = 10822 single-molecule events for experiment using 2STL and n = 9387 single-molecule events for experiment using 13STL. (g) Structure of JF549–HaloTag ligand (2HTL). (h) Image of individual SPT traces in live U2OS cells expressing SNAP-tag–histone H2B and labeled with 2STL (2 nM, 30 min, 3× wash); dashed line indicates outline of nucleus; arrows highlight nonspecific staining in cytosol; scale bar: 2 μm. (i) 3D kymograph showing data from e detailing single-particle track position and length as a function of time. Diffusion coefficient values (D) are calculated from single-particle tracking data and color-coded; experiment was duplicated with similar results.
Extended Data Fig. 4. Synthesis and spectral properties of 15–20.
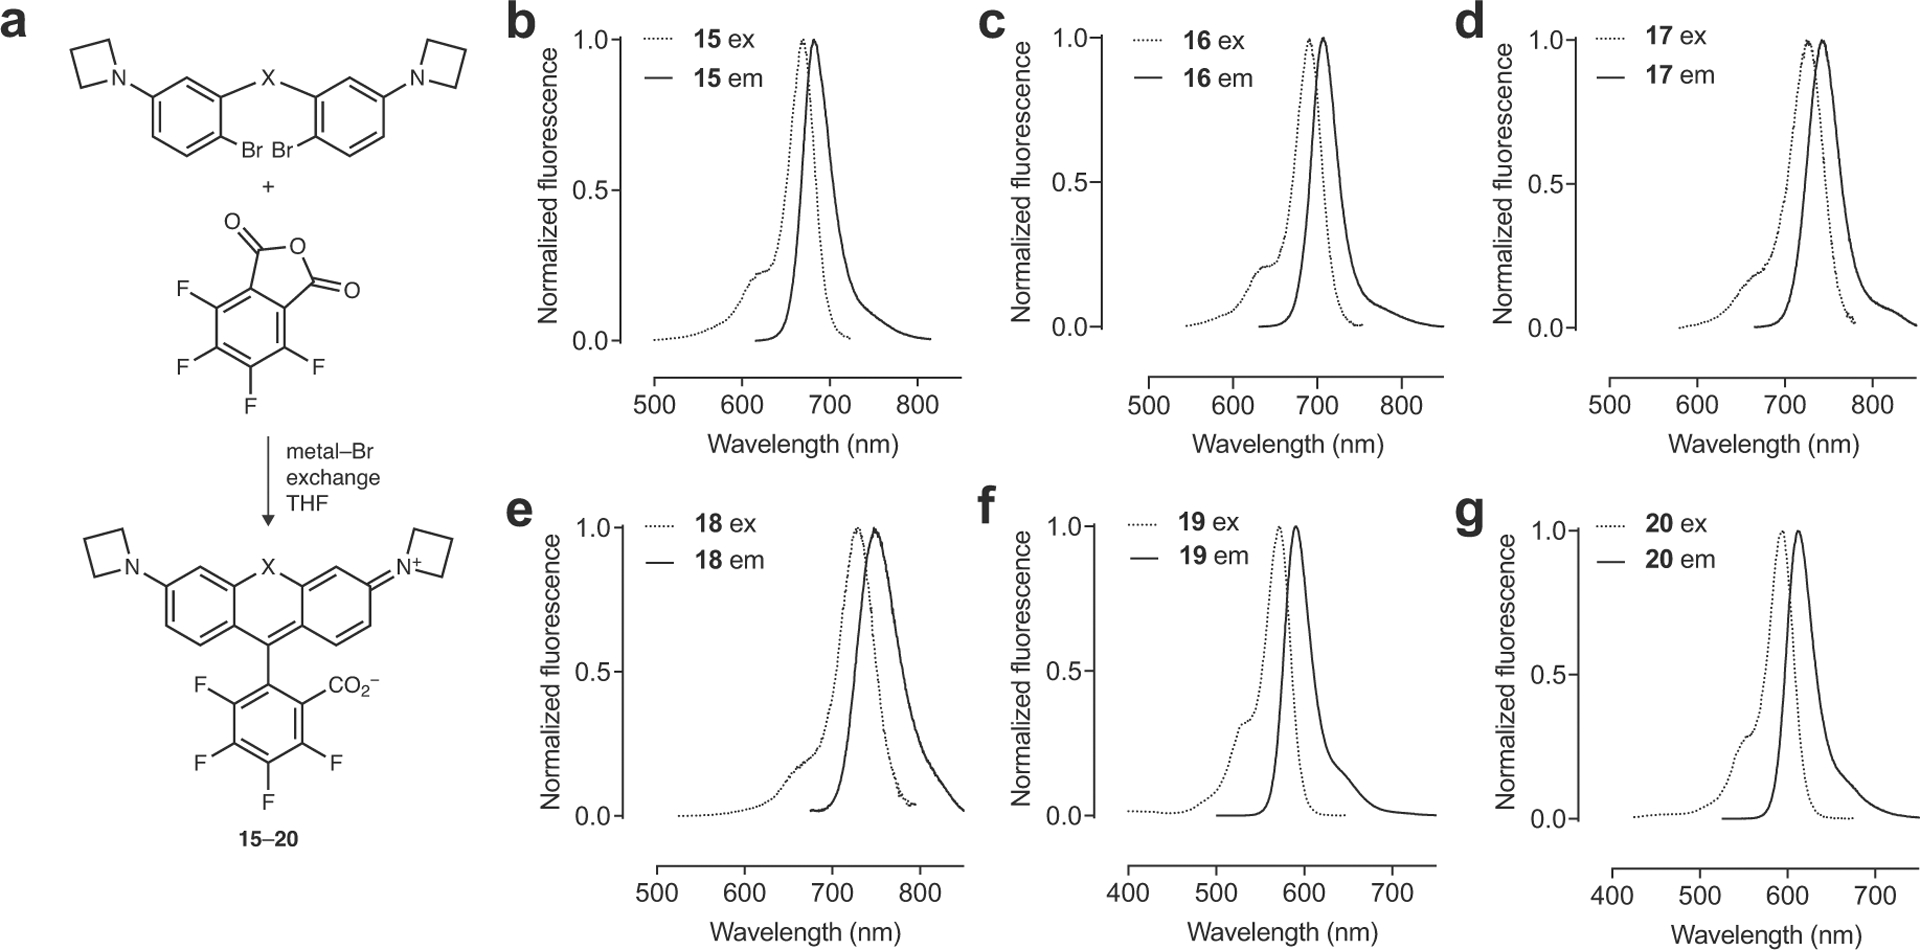
(a) Synthesis of Janelia Fluor dyes 15–20. (b–g) Fluorescence excitation (ex) and emission (em) spectra of JF669 (15; b), JF690 (16; c), JF722 (17; d), JF724 (18; e), JF571 (19; f), and JF593 (20; g).
Extended Data Fig. 5. Derivatization of JF669.
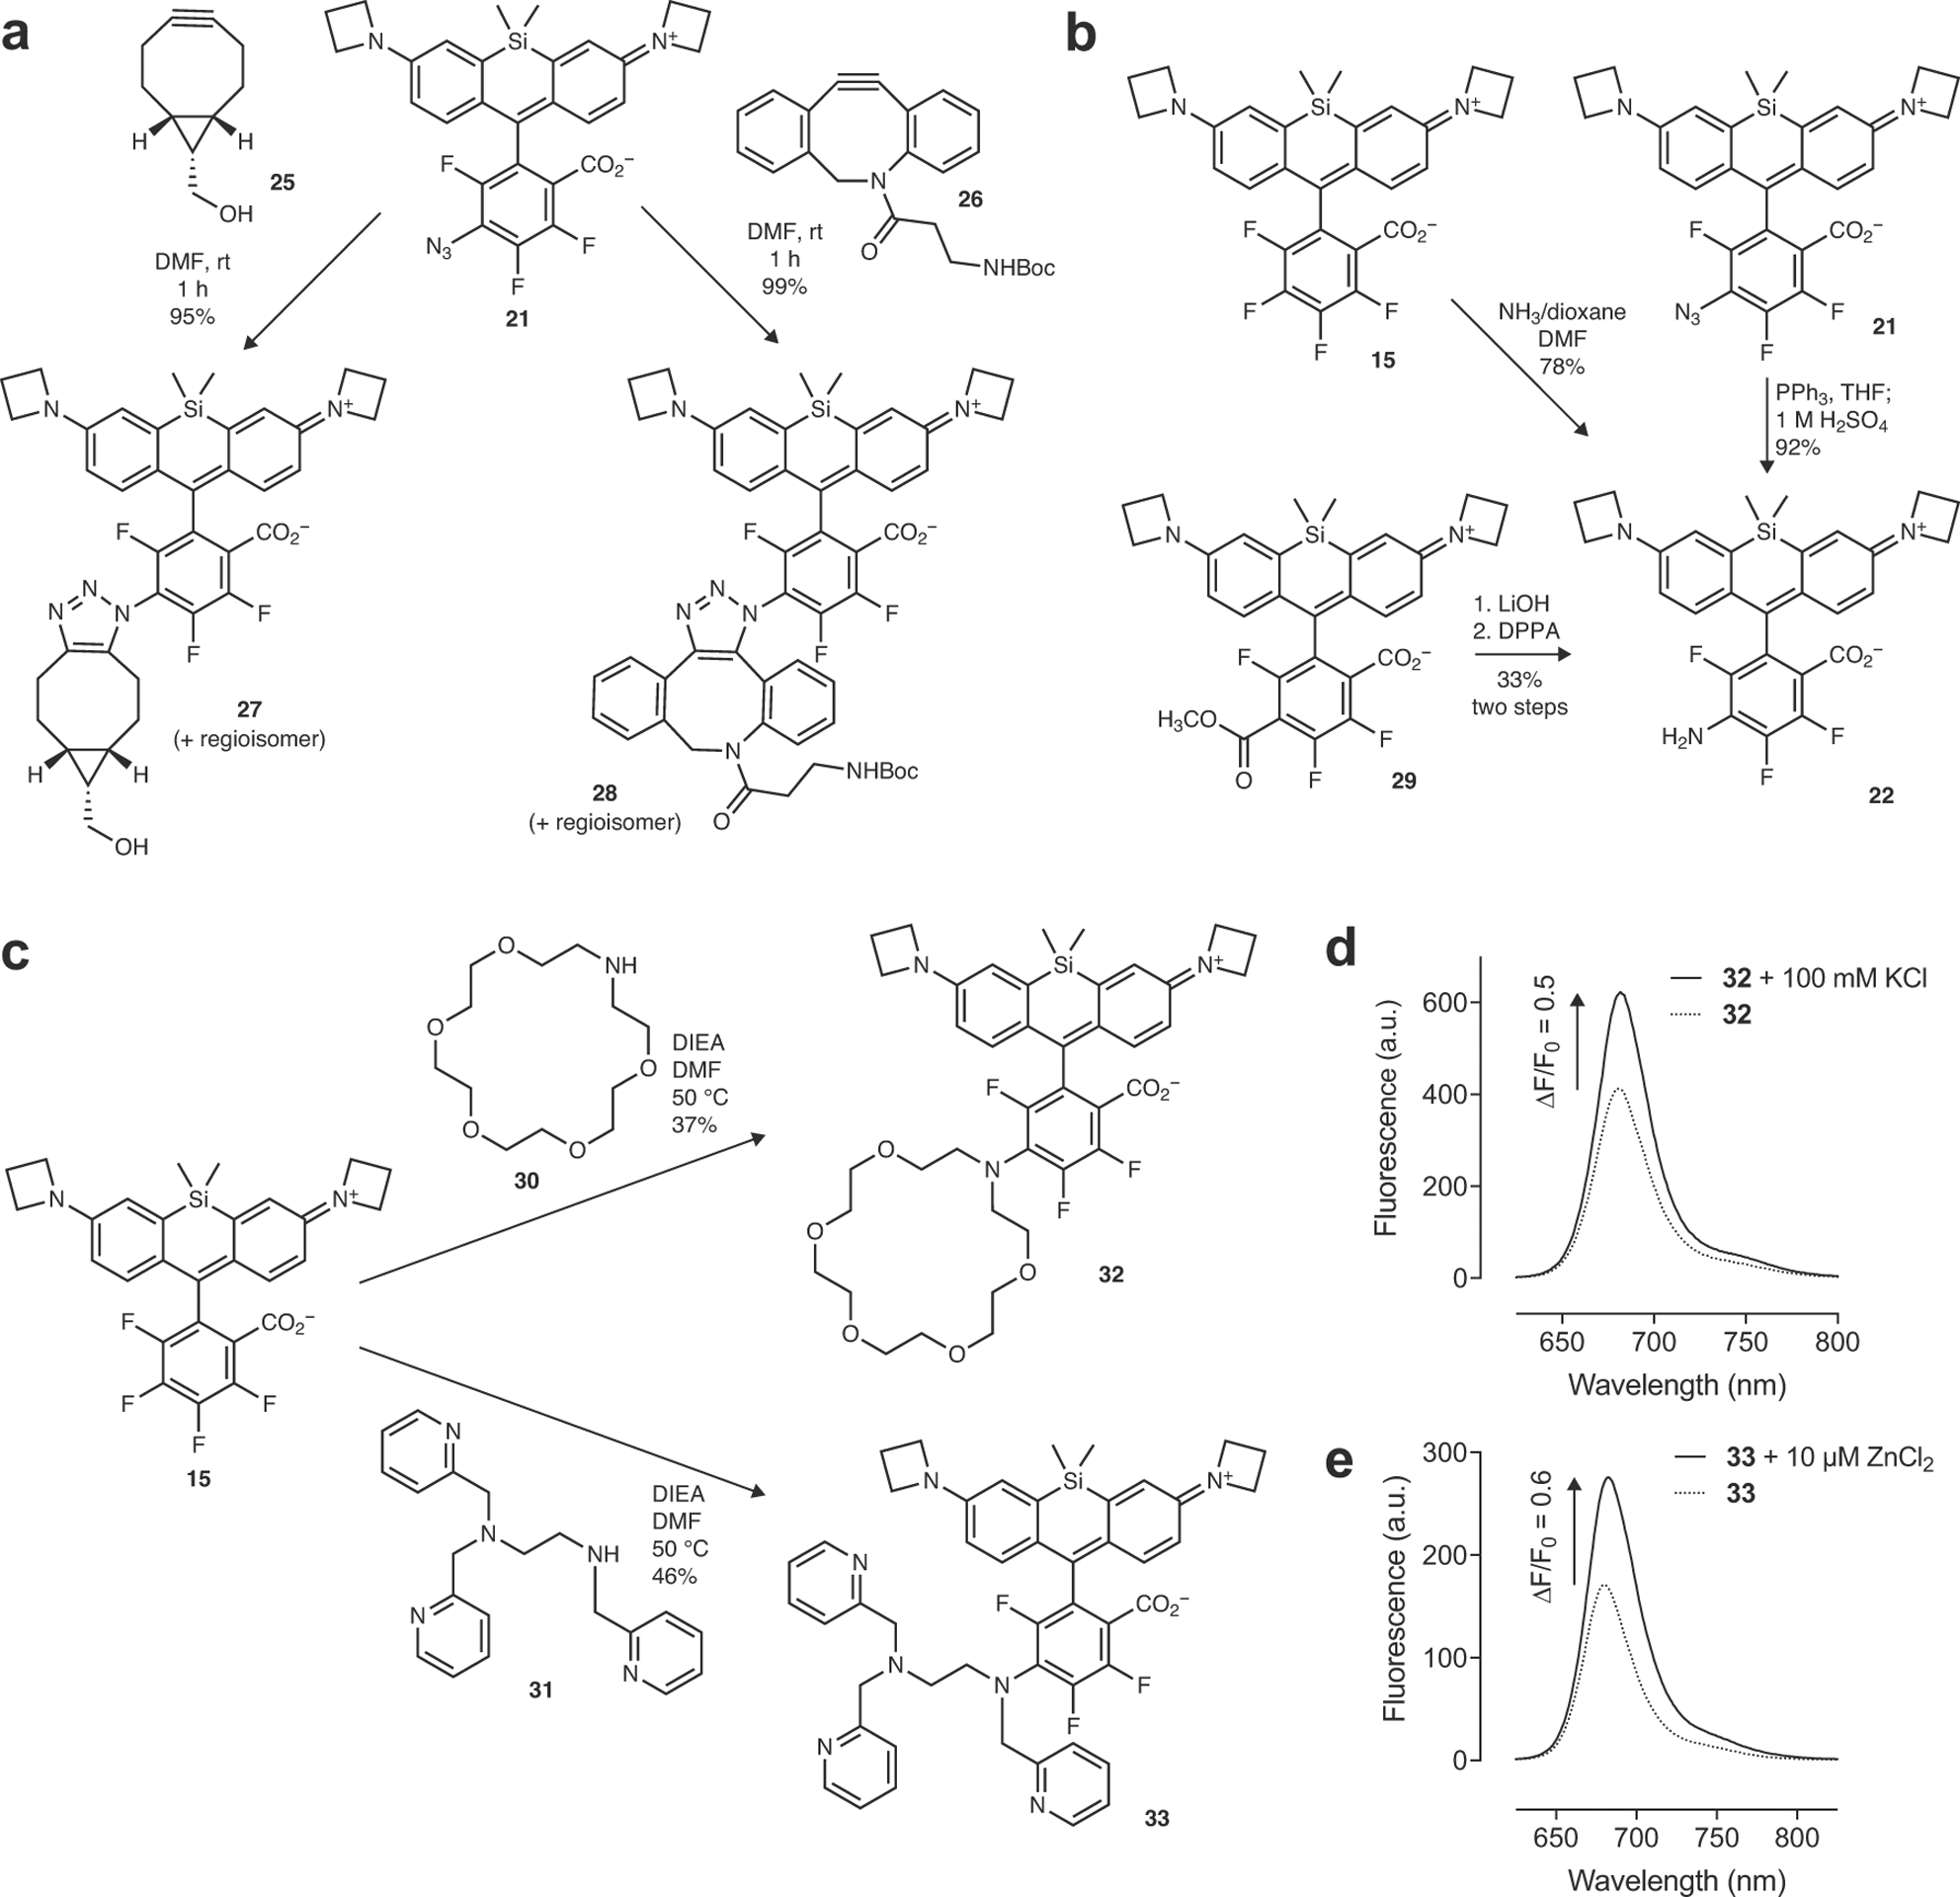
(a) Reaction of azide 21 with strained alkynes 25 or 26 to form triazole adducts 27 or 28. (b) Synthesis of amine 22 via reaction of JF669 (15) with NH3, reduction of azide 21, or Curtius rearrangement starting from ester 29 showing consistent regioselectivity of SNAr reactions. (c) Reaction of 15 with amine-containing chelator groups 30 and 31 to form far-red K+ indicator 32 and far-red Zn2+ indicator 33. (d) Fluorescence emission spectra of 32 in the absence or presence of 100 mM K+. (e) Fluorescence emission spectra of 30 in the absence or presence of 10 μM Zn2+.
Extended Data Fig. 6. Synthesis and properties of new HaloTag and SNAP-tag ligands based on 15–20 and 37–38.
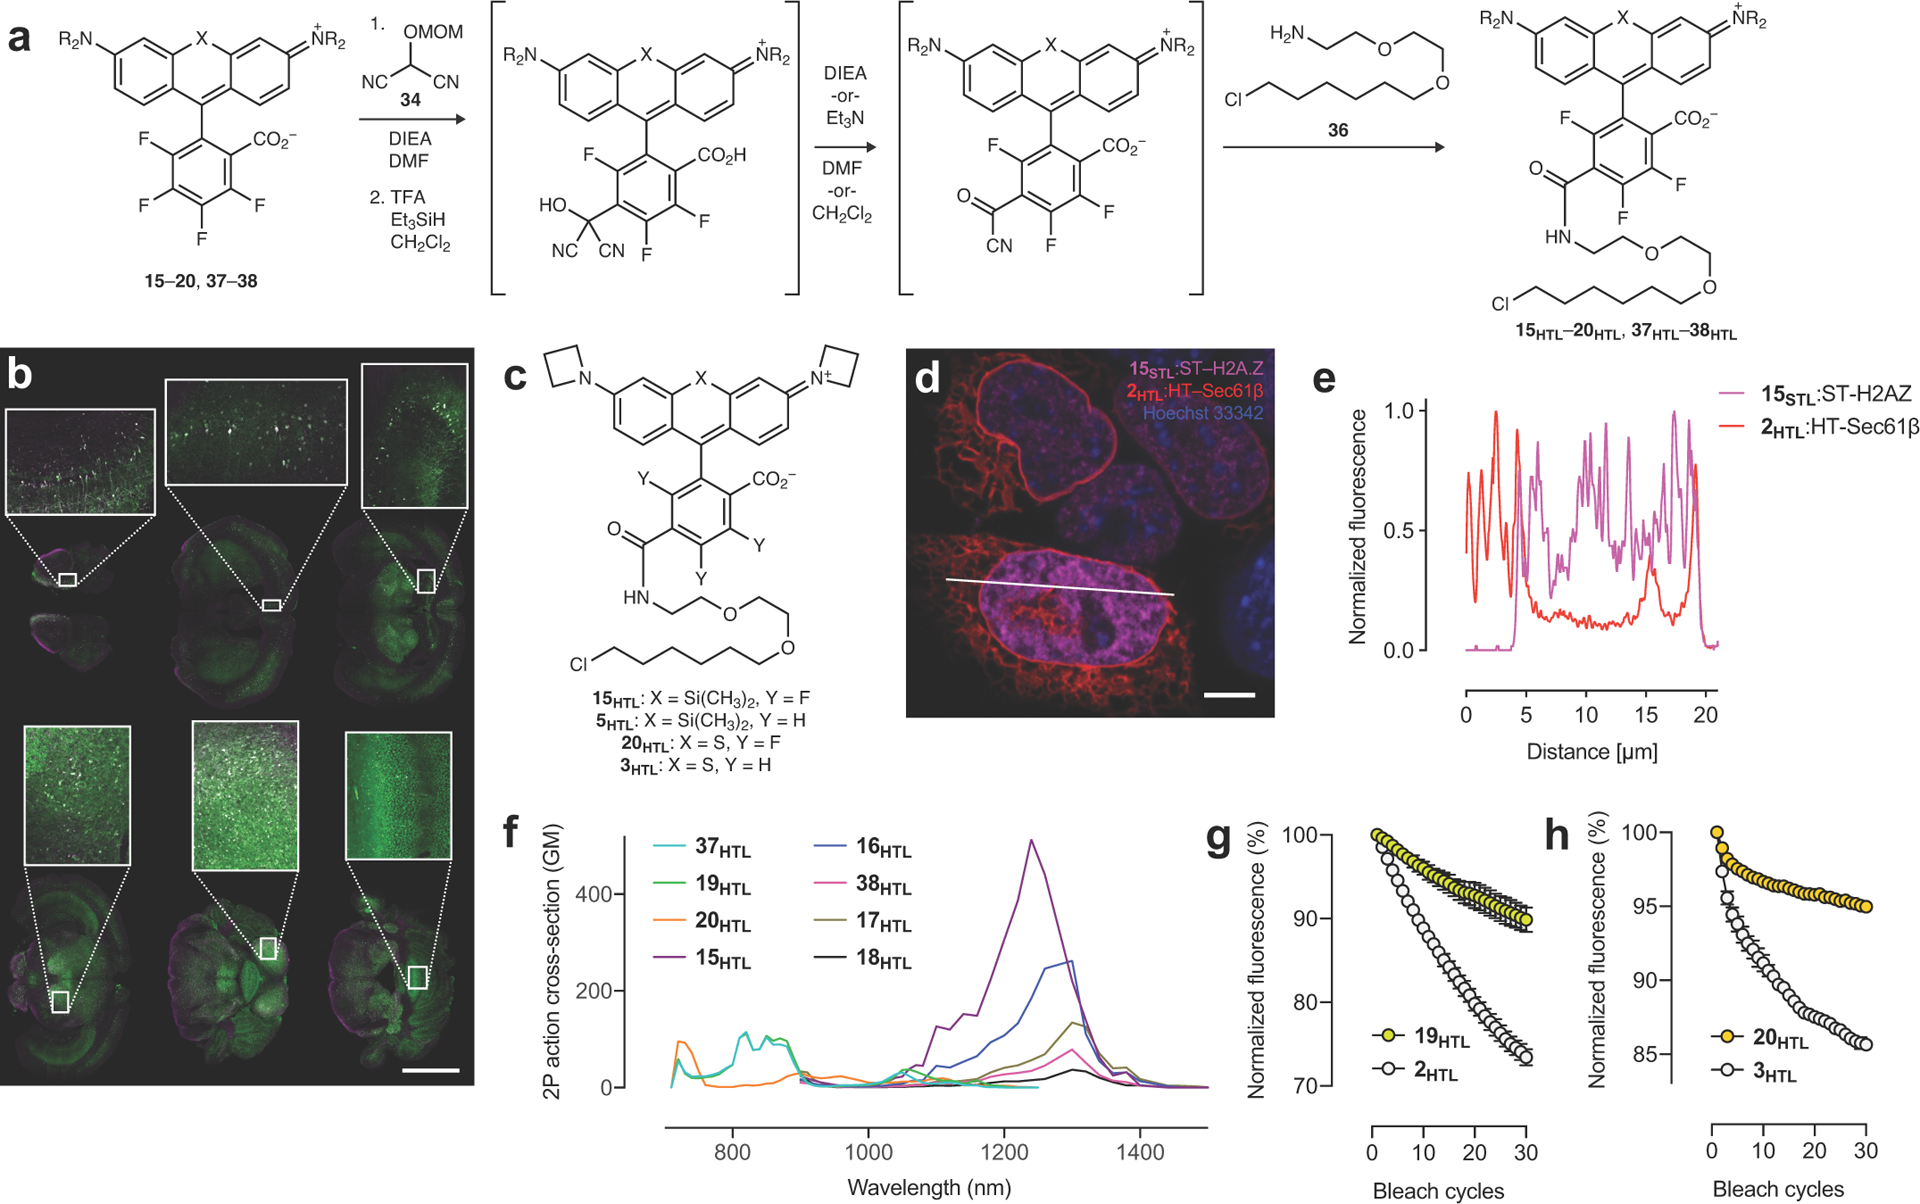
(a) Expanded synthetic scheme of HaloTag ligands 15HTL–20HTL and 37HTL–38HTL starting with nucleophilic aromatic substitution (SNAr) of 15–20 and 37–38 with masked acyl cyanide 34. (b) Two-color montage image of fixed coronal slices with zoom-in regions from a mouse expressing HaloTag–GFP in neurons transduced by IV administration of the viral vector PHP-eB-Syn-HaloTag–GFP followed by IV administration of 15HTL (100 nmol), perfusion, and slicing; GFP signal in green and 15HTL signal in magenta; scale bar = 3 mm; experiment was duplicated with similar results. (c) Structures of JF669–HaloTag ligand (15HTL), JF646–HaloTag ligand (5HTL), JF593–HaloTag ligand (20HTL), and JF570–HaloTag ligand (3HTL). (d–e) Confocal image and line-scan from Figure 2l showing live U2OS cells expressing Sec61β–HaloTag labeled with 2HTL (30 nM, 30 min, 3× wash) and SNAP-tag–histone variant H2A.Z labeled with 15STL (30 nM, 30 min, 3× wash); co-stained with Hoechst 33342 (1 μM, 30 min, 3× wash); (d) Confocal image with white line indicating line-scan position; (e) Line-scan profile; scale bar: 5 μm; experiment was duplicated with similar results. (f) Two-photon absorption spectra of the HaloTag conjugates of HaloTag ligands 15HTL–20HTL, and 37HTL–38HTL. (g) Plot of fluorescence from cells expressing HaloTag–H2B labeled with 2HTL (200 nM) or 19HTL (200 nM) over 30 bleach cycles; error bars indicate SE; n = 3 independent cellular samples. (h) Plot of fluorescence from fixed U2OS cells expressing HaloTag–H2B labeled with 3HTL (200 nM) or 20HTL (200 nM) over 30 bleach cycles; error bars indicate SE; n = 3 independent cellular samples.
Extended Data Fig. 7. Further fine-tuning of JF571 (19) and JF722 (17).
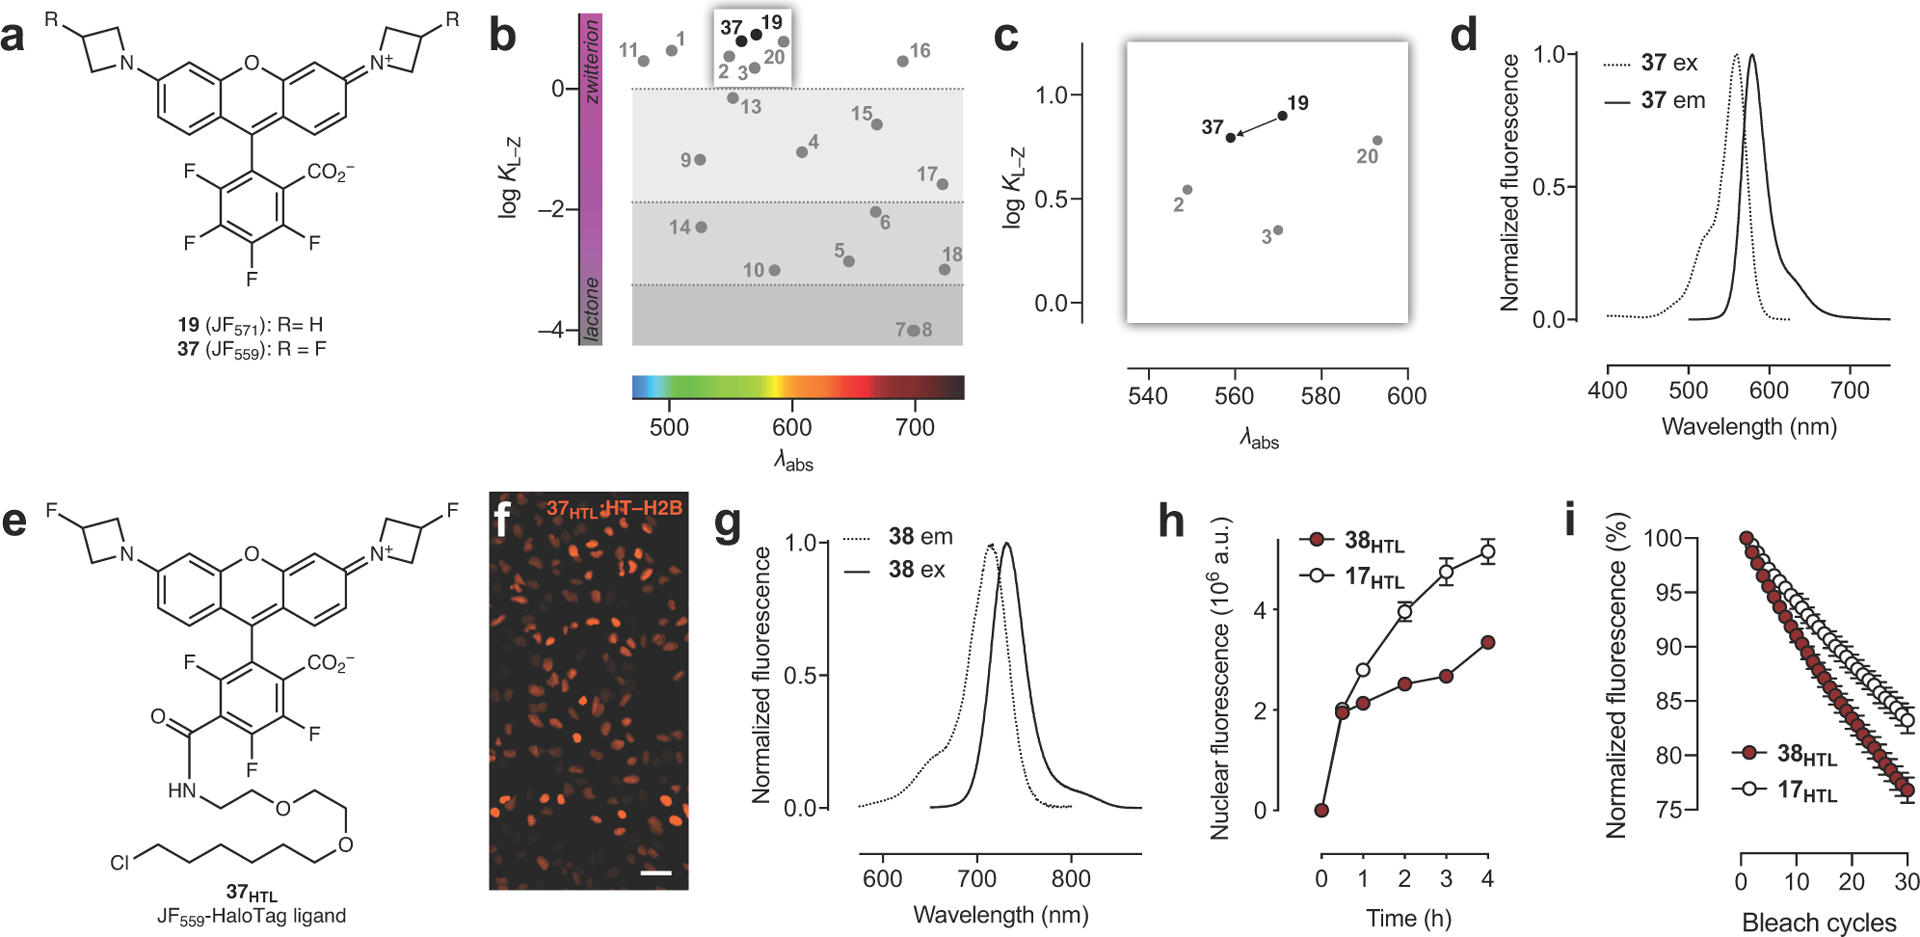
(a) Structure of JF571 (19) and JF559 (37). (b–c) Full plot of KL–Z vs. λabs (b) and zoom-in (c) showing decreased KL–Z for dye 37. (d) Fluorescence excitation (ex) and emission (em) spectra of JF559 (37). (e) Structure of JF559–HaloTag ligand (37HTL). (f) Widefield imaging experiment of U2OS cells expressing HaloTag–histone H2B labeled with 37HTL (100 nM, 30 min, 3× wash); scale bar: 51 μm; experiment was duplicated with similar results. (g) Fluorescence excitation (ex) and emission (em) spectra of JF711 (38). (h) Nuclear fluorescence vs. time upon addition of ligands 17HTL (200 nM) or 38HTL (200 nM) to live cells expressing HaloTag–histone H2B; error bars indicate SE; n = 100 nuclei except for: t = 0.5 h with 38HTL where n = 86 nuclei; t = 1 h with 38HTL where n = 94 nuclei; t = 2 h with 38HTL where n = 96 nuclei; t = 0.5 h with 17HTL where n = 94 nuclei. (i) Plot of fluorescence from cells expressing HaloTag–H2B labeled with 17HTL (200 nM) or 38HTL (200 nM) over 30 bleach cycles; error bars indicate SE; ; n = 3 independent cellular samples.
Supplementary Material
Acknowledgements
We thank: S. Sternson for initial discussions on umpolung reagents; K. Svoboda for advice on in vivo labeling experiments; C. Deo and E. Schreiter for purified HaloTag protein and contributive discussions; B. Mensh and P. Kumar for a critical reading of the manuscript; R. Tjian (University of California, Berkeley) for the mouse ES cell line; the Janelia Cell and Tissue Culture, Anatomy and Histology, and Vivarium teams for assistance with biological experiments. This work was supported by the Howard Hughes Medical Institute.
Footnotes
Ethics Declaration
HHMI owns patent US 9,933,417 B2 protecting azetidine-containing fluorophores with J.B.G. and L.D.L. listed as inventors and has filed additional patent applications US 2019/0367736 A1 and US 2019/0106573 A1 involving other compositions of azetidine-containing fluorophores with J.B.G. and L.D.L. listed as inventors.
References
- 1.Lavis LD Chemistry is dead. Long live chemistry! Biochemistry 56, 5165–5170 (2017). [DOI] [PubMed] [Google Scholar]
- 2.Abdelfattah AS et al. Bright and photostable chemigenetic indicators for extended in vivo voltage imaging. Science 365, 699–704 (2019). [DOI] [PubMed] [Google Scholar]
- 3.Grimm JB et al. A general method to improve fluorophores for live-cell and single-molecule microscopy. Nat. Methods 12, 244–250 (2015). [DOI] [PMC free article] [PubMed] [Google Scholar]
- 4.Grimm JB et al. A general method to fine-tune fluorophores for live-cell and in vivo imaging. Nat. Methods 14, 987–994 (2017). [DOI] [PMC free article] [PubMed] [Google Scholar]
- 5.Hinckley DA & Seybold PG A spectroscopic/thermodynamic study of the rhodamine B lactone–zwitterion equilibrium. Spectrochim. Acta, Part A 44, 1053–1059 (1988). [Google Scholar]
- 6.Grimm JB, Brown TA, Tkachuk AN & Lavis LD General synthetic method for Si-fluoresceins and Si-rhodamines. ACS Cent. Sci 3, 975–985 (2017). [DOI] [PMC free article] [PubMed] [Google Scholar]
- 7.Zheng Q et al. Rational design of fluorogenic and spontaneously blinking labels for super-resolution imaging. ACS Cent. Sci 5, 1602–1613 (2019). [DOI] [PMC free article] [PubMed] [Google Scholar]
- 8.Panchuk-Voloshina N et al. Alexa Dyes, a series of new fluorescent dyes that yield exceptionally bright, photostable conjugates. J. Histochem. Cytochem 47, 1179–1188 (1999). [DOI] [PubMed] [Google Scholar]
- 9.Lukinavičius G et al. A near-infrared fluorophore for live-cell super-resolution microscopy of cellular proteins. Nature Chem. 5, 132–139 (2013). [DOI] [PubMed] [Google Scholar]
- 10.Wang L et al. A general strategy to develop cell permeable and fluorogenic probes for multicolour nanoscopy. Nat. Chem. Biol 12, 165–172 (2020). [DOI] [PubMed] [Google Scholar]
- 11.Chi W, Qi Q, Lee R, Xu Z & Liu X A unified push–pull model for understanding the ring-opening mechanism of rhodamine dyes. J. Phys. Chem C 124, 3793–3801 (2020). [Google Scholar]
- 12.Arden-Jacob J, Frantzeskos J, Kemnitzer NU, Zilles A & Drexhage KH New fluorescent markers for the red region. Spectrochim. Acta, Part A 57, 2271–2283 (2001). [DOI] [PubMed] [Google Scholar]
- 13.Grimm JB et al. Carbofluoresceins and carborhodamines as scaffolds for high-contrast fluorogenic probes. ACS Chem. Biol 8, 1303–1310 (2013). [DOI] [PMC free article] [PubMed] [Google Scholar]
- 14.Koide Y, Urano Y, Hanaoka K, Terai T & Nagano T Evolution of Group 14 rhodamines as platforms for near-infrared fluorescence probes utilizing photoinduced electron transfer. ACS Chem. Biol 6, 600–608 (2011). [DOI] [PubMed] [Google Scholar]
- 15.Ioffe IS & Zelenin KN Synthesis of azafluorescein. Zh. Obshch. Khim 34, 2811 (1964). [Google Scholar]
- 16.Van Duuren BL, Goldschmidt BM & Seltzman HH The synthesis and aggregation of 9-phenyl- and 9-s-butyl-3,6-bisdimethylaminoacridine in solution. The dealkylation of 9-t-butylacridans. J. Chem. Soc. B, 814–819 (1967). [Google Scholar]
- 17.Fischer C & Sparr C Direct transformation of esters into heterocyclic fluorophores. Angew. Chem. Int. Ed 57, 2436–2440 (2018). [DOI] [PubMed] [Google Scholar]
- 18.Gannon MK 2nd et al. Rhodamine inhibitors of P-glycoprotein: An amide/thioamide “switch” for ATPase activity. J. Med. Chem 52, 3328–3341 (2009). [DOI] [PMC free article] [PubMed] [Google Scholar]
- 19.Zhou X, Lai R, Beck JR, Li H & Stains CI Nebraska Red: A phosphinate-based near-infrared fluorophore scaffold for chemical biology applications. Chem. Commun. (Camb) 52, 12290–12293 (2016). [DOI] [PMC free article] [PubMed] [Google Scholar]
- 20.Zhou X, Fang Y, Lesiak L & Stains CI A phosphinate-containing fluorophore capable of selectively inducing apoptosis in cancer cells. ChemBioChem 20, 1712–1716 (2019). [DOI] [PMC free article] [PubMed] [Google Scholar]
- 21.Grzybowski M et al. A highly photostable near-infrared labeling agent based on a phospha-rhodamine for long-term and deep imaging. Angew. Chem. Int. Ed 57, 10137–10141 (2018). [DOI] [PubMed] [Google Scholar]
- 22.Sauer M, Nasufovic V, Arndt H-D & Vilotijevic I Robust synthesis of NIR-emissive P-rhodamine fluorophores. Org. Biomol. Chem 18, 1567–1571 (2020). [DOI] [PubMed] [Google Scholar]
- 23.Liu J et al. Sulfone-rhodamines: A new class of near-infrared fluorescent dyes for bioimaging. ACS Appl. Mater. Interfaces 8, 22953–22962 (2016). [DOI] [PubMed] [Google Scholar]
- 24.Hansch C, Leo A & Taft RW A survey of Hammett substituent constants and resonance and field parameters. Chem. Rev 91, 165–195 (1991). [Google Scholar]
- 25.Los GV et al. HaloTag: A novel protein labeling technology for cell imaging and protein analysis. ACS Chem. Biol 3, 373–382 (2008). [DOI] [PubMed] [Google Scholar]
- 26.Sun X et al. Development of SNAP-tag fluorogenic probes for wash-free fluorescence imaging. ChemBioChem 12, 2217–2226 (2011). [DOI] [PMC free article] [PubMed] [Google Scholar]
- 27.Stagge F, Mitronova GY, Belov VN, Wurm CA & Jakobs S SNAP-, CLIP- and Halo-tag labelling of budding yeast cells. PLoS One 8, e78745–e78745 (2013). [DOI] [PMC free article] [PubMed] [Google Scholar]
- 28.Presman DM et al. Quantifying transcription factor binding dynamics at the single-molecule level in live cells. Methods 123, 76–88 (2017). [DOI] [PMC free article] [PubMed] [Google Scholar]
- 29.Erdmann RS et al. Labeling strategies matter for super-resolution microscopy: A comparison between HaloTags and SNAP-tags. Cell Chem. Biol 26, 584–592.e586 (2019). [DOI] [PMC free article] [PubMed] [Google Scholar]
- 30.Correa IR et al. Substrates for improved live-cell fluorescence labeling of SNAP-tag. Curr. Pharm. Des 19, 5414–5420 (2013). [DOI] [PubMed] [Google Scholar]
- 31.Liu Z et al. 3D imaging of Sox2 enhancer clusters in embryonic stem cells. eLife 3, e04236 (2014). [DOI] [PMC free article] [PubMed] [Google Scholar]
- 32.Liu J et al. Rational design and synthesis of a novel class of highly fluorescent rhodamine dyes that have strong absorption at long wavelengths. Tetrahedron Lett. 44, 4355–4359 (2003). [Google Scholar]
- 33.Gee KR et al. Novel derivatization of protein thiols with fluorinated fluoresceins. Tetrahedron Lett. 37, 7905–7908 (1996). [Google Scholar]
- 34.Mitronova GY et al. Functionalization of the meso-phenyl ring of rhodamine dyes through SNAr with sulfur nucleophiles: Synthesis, biophysical characterizations, and comprehensive NMR analysis. Eur. J. Org. Chem 2015, 337–349 (2015). [Google Scholar]
- 35.Kolmakov K et al. Far-red emitting fluorescent dyes for optical nanoscopy: Fluorinated silicon-rhodamines (SiRF dyes) and phosphorylated oxazines. Chemistry 21, 13344–13356 (2015). [DOI] [PubMed] [Google Scholar]
- 36.Shen Z, Lu Z, Chhatbar PY, O’Herron P & Kara P An artery-specific fluorescent dye for studying neurovascular coupling. Nat. Methods 9, 273–276 (2012). [DOI] [PMC free article] [PubMed] [Google Scholar]
- 37.Patterson DM, Nazarova LA & Prescher JA Finding the right (bioorthogonal) chemistry. ACS Chem. Biol 9, 592–605 (2014). [DOI] [PubMed] [Google Scholar]
- 38.Nemoto H, Kubota Y & Yamamoto Y Development of a new acyl anion equivalent for the preparation of masked activated esters, and their use to prepare a dipeptide. J. Org. Chem 55, 4515–4516 (1990). [Google Scholar]
- 39.Wysocki LM et al. Facile and general synthesis of photoactivatable xanthene dyes. Angew. Chem., Int. Ed 50, 11206–11209 (2011). [DOI] [PMC free article] [PubMed] [Google Scholar]
- 40.Dwight SJ & Levin S Scalable regioselective synthesis of rhodamine dyes. Org. Lett 18, 5316–5319 (2016). [DOI] [PubMed] [Google Scholar]
- 41.Suzuki K et al. Reevaluation of absolute luminescence quantum yields of standard solutions using a spectrometer with an integrating sphere and a back-thinned CCD detector. Phys. Chem. Chem. Phys 11, 9850–9860 (2009). [DOI] [PubMed] [Google Scholar]
- 42.Lambert TJ FPbase: A community-editable fluorescent protein database. Nat. Methods 16, 277–278 (2019). [DOI] [PubMed] [Google Scholar]
- 43.Mütze J et al. Excitation spectra and brightness optimization of two-photon excited probes. Biophys. J 102, 934–944 (2012). [DOI] [PMC free article] [PubMed] [Google Scholar]
- 44.Akerboom J et al. Optimization of a GCaMP calcium indicator for neural activity imaging. J. Neurosci 32, 13819–13840 (2012). [DOI] [PMC free article] [PubMed] [Google Scholar]
- 45.Schindelin J et al. Fiji: An open-source platform for biological-image analysis. Nat. Methods 9, 676–682 (2012). [DOI] [PMC free article] [PubMed] [Google Scholar]
- 46.Sergé A, Bertaux N, Rigneault H & Marguet D Dynamic multiple-target tracing to probe spatiotemporal cartography of cell membranes. Nat Methods 5, 687–694 (2008). [DOI] [PubMed] [Google Scholar]
Associated Data
This section collects any data citations, data availability statements, or supplementary materials included in this article.
Supplementary Materials
Data Availability Statement
The data that support the findings of this study are provided in the Source Data files or available from the corresponding author upon request.


