

Abstract
Imaging techniques based on retinal autofluorescence have found broad applications in ophthalmology because they are extremely sensitive and noninvasive. Conventional fundus autofluorescence imaging measures fluorescence intensity of endogenous retinal fluorophores. It mainly derives its signal from lipofuscin at the level of the retinal pigment epithelium. Fundus autofluorescence, however, can not only be characterized by the spatial distribution of the fluorescence intensity or emission spectrum, but also by a characteristic fluorescence lifetime function. The fluorescence lifetime is the average amount of time a fluorophore remains in the excited state following excitation. Fluorescence lifetime imaging ophthalmoscopy (FLIO) is an emerging imaging modality for in vivo measurement of lifetimes of endogenous retinal fluorophores. Recent reports in this field have contributed to our understanding of the pathophysiology of various macular and retinal diseases.
Within this review, the basic concept of fluorescence lifetime imaging is provided. It includes technical background information and correlation with in vitro measurements of individual retinal metabolites. In a second part, clinical applications of fluorescence lifetime imaging and fluorescence lifetime features of selected retinal diseases such as Stargardt disease, age-related macular degeneration, choroideremia, central serous chorioretinopathy, macular holes, diabetic retinopathy, and retinal artery occlusion are discussed. Potential areas of use for fluorescence lifetime imaging ophthalmoscopy will be outlined at the end of this review.
Keywords: Fluorescence lifetimes, Fundus autofluorescence, Retinal imaging, FLIO, Fluorophore, Metabolism
1. Introduction
Fluorescence lifetime imaging ophthalmoscopy (FLIO) is a relatively new method within the field of retinal imaging. It is a noninvasive technique to measure and quantify lifetimes of endogenous retinal autofluorescence. When endogenous fluorophores are excited by photons derived from a monochromatic light source, they gain a higher level of energy before returning to their ground state by emitting photons of longer wavelengths than the exciting light. The average time between excitation and reaching the ground state again can be quantified as the fluorescence lifetime.
The technique is based on fluorescence lifetime imaging microscopy (FLIM) which is used in basic science for analysis of microscopic images of fixed, as well as living cells (Ishikawa-Ankerhold et al., 2012). Every single fluorophore is characterized by its own excitation and emission wavelength spectrum and exhibits an individual fluorescence lifetime. The fluorescence lifetimes depend on the molecular environment but are largely independent of the fluorophore’s concentration (Becker, 2012). Therefore, fluorescence lifetime measurement can be applied to detect weakly fluorescing fluorophores if they differ in terms of their lifetime. Additionally, lifetimes can be used as indicator for specific metabolic conditions of changes within the molecular micro-environment (Becker, 2012).
Fundus autofluorescence intensity imaging and FLIO are two very closely related imaging modalities and thereby share many common facets. Whereas conventional fundus autofluorescence measurement provides spacial resolved information on fluorescence intensities, (Delori, 1994; von Rückmann et al., 1995a,b) FLIO additionally measures fluorescence lifetimes or decay times and thereby includes time as a third dimension (space and time resolved). This additional dimension enables extracting many components that have overlapping emission properties.
Retinal autofluorescence intensity predominantly stems from lipofuscin which is located within the lysosomes of the retinal pigment epithelium (RPE) (Delori et al., 1995). Accumulation of lipofuscin is a hallmark of aging RPE cells originating from incomplete degradation of photoreceptor outer segment disks (Delori et al., 1995; Bertolotto et al., 2014). Major constituents of RPE lipofuscin are a complex mixture of di-retinal conjugates, one of which is A2E (Sparrow et al., 2003; Sparrow et al., 2012). Extracellular fluorophores from shed outer segment debris in the subretinal space as well as extracellular proteins also contain components from di-retinal adducts.
Additionally, melanin has been reported to have a peak excitation wavelength of 450 nm with a peak emission starting at 440 nm extending to the near-infrared spectra (>800 nm). Therefore, melanin is likely to contribute to fluorescence lifetime measurements with FLIO (Gallas and Eisner, 1987; König, 2008) (Kayatz et al., 2001; Keilhauer and Delori, 2006; Han et al., 2009; Yung et al., 2016). However, given the major contribution of lipofuscin to the autofluorescence signal, it is difficult to identify weaker endogenous fluorophores using autofluorescence intensity measurement in the retina. Because fluorescence lifetimes are largely independent of the fluorophores concentration and intensity, the predominance of lipofuscin can be overcome with FLIO, and fluorophores other than lipofuscin can be identified by their lifetimes.
In this review, we will provide an overview of the fundamentals of autofluorescence lifetime imaging and the technical principles of FLIO. Furthermore, we will provide a summary of findings from FLIO measurements in healthy retinae as well as in various retinal diseases, and highlight the potential benefit and further perspectives of this technique.
2. Fundamentals of autofluorescence lifetime imaging of the retina
2.1. Historical background
Although fluorescence lifetime measurement is considered to be a relatively new technique in biomedical imaging (see Berezin and Achilefu for review (Berezin and Achilefu, 2010)), it has been initially described in the 19th century. In 1859, Edmond Bequerel developed the so called phosphoroscope with a time resolution of 10−4 s. In the 1920s, time resolution was improved to 10−8 s which enabled the first fluorescence lifetime measurements (Gottling, 1923; Gaviola, 1926). However, only the advent of short pulse lasers and the introduction of time-correlated single photon counting (TCSPC) (Lewis et al., 1973; Leskovar et al., 1976) made fluorescence lifetime measurement sufficiently sensitive for the detection of intrinsic fluorophores in living tissue.
Schweitzer et al. first applied lifetime imaging to the human retina in vivo (Schweitzer et al., 2001a,b). They fiber-coupled a mode-locked argon-ion laser into a scanning laser ophthalmoscope (cLSO, Carl Zeiss, Jena, Germany) and used TCSPC for fluorescence detection. However, the lack of an image registration algorithm limited the time available for the recording of an image without motion artifacts to few seconds. This resulted in the recording of some hundred photons per pixel only. Despite the resulting low signal to noise ratio, first fluorescence lifetime images were recorded in 2001 (Schweitzer et al., 2001a,b). An offline registration of recorded images was introduced in 2002 (Schweitzer et al., 2002) and first clinical experiments in patients with age-related macular degeneration (AMD) were published in 2003 using a picosecond diode laser as light source (Schweitzer et al., 2003). Although the resolution was still low due to limited memory of the TCSPC electronics (64 × 64 pixels with a size of 80 × 80 μm2), the images clearly revealed an extension of lifetimes in age-related macular degeneration (Schweitzer et al., 2004). In vitro and histological studies were performed to identify the fluorophores seen in fundus autofluorescence and to measure their emission spectra as well as lifetimes (Schweitzer et al., 2007a; Schweitzer et al., 2007b).
Considerable progress was made with the use of the Heidelberg Retina Angiograph scanner [Heidelberg Engineering, Heidelberg, Germany] enabling an online image registration (Hammer et al., 2009). An industrially designed prototype device, based on the Heidelberg Engineering Spectralis scanner, was first used by Dysli et al. (Dysli et al., 2014b). More recent clinical research with this device is described in later sections of this review.
2.2. Fluorescence lifetime imaging microscopy fundamentals
Fluorescence lifetime microscopy (FLIM) adds a number of benefits to traditional fluorescence-based imaging. Largely sharing the same microscope, FLIM attachments provide complementary contrast to biological tissue, present a snapshot of the environment around the endogenous or exogenous fluorophore, and reduce the background associated with typical fluorescence imaging. With FLIM, many hidden details of cell or tissue architecture can be exposed, and their machinery can be investigated in greater detail. A conventional FLIM microscope system operates in the visible and near infrared (NIR) range (400–900 nm) with some of the latest developments going as far as deep ultraviolet (UV, 240 nm) (De Jong et al., 2015) and shortwave infrared (1700 nm) wavelengths (Becker and Shcheslavsky, 2016). With such a broad spectral range, FLIM can efficiently excite endogenous fluorophores found in the retina and surrounding tissue, such as elastin, collagen, and melanin, as well as many exogenous probes, providing valuable intrinsic structural and biochemical information. However, strong absorption of UV by UV-B and UV-A filter molecules present in the human lens and cornea precludes the usage of UV light sources for retinal imaging (Tsentalovich et al., 2011). In addition, because of the damaging potential of the UV and mid-infrared light to the retina, such wavelengths of excitation are unlikely to find applications in clinics. The current fluorescence lifetime imaging ophthalmoscopy technique relies on 473 nm lasers. However, the method is not restricted to a specific wavelength.
Single-photon excitation for the majority of fluorophores found in the retina lies primarily in the ultraviolet range, and their fluorescence cannot be excited non-invasively through the pupil of the eye because of the ocular transmission window (Palczewska et al., 2014; Sharma et al., 2016). As mentioned above, this window restricts the UV and deep-blue photons from reaching the retina. Interestingly, the spectral transparency is different across the species. Thus, the anterior segment of the primate eye transmits light only at the wavelengths longer than 400 nm, while rabbit’s eye transmits photons down to 350 nm and rats’ eye transmits as low as 300 nm (Dillon et al., 2000). With an advance of two-photon excitation techniques this is no longer a limitation (Sharma et al., 2013; Palczewska et al., 2014; Sharma et al., 2016) and the retina’s fluorophores can be directly excited with red or near-infrared light. Given that the fluorescence lifetime is independent on the method of excitation, in vivo retinal imaging with two-photon excitation, although not reported yet, is expected to provide the same lifetime results as with a single photon excitation.
2.2.1. Theory of fluorescence lifetime
The fluorescence of organic molecules used in FLIM corresponds to the excitation of the light absorbing molecule from its ground state or singlet state S0 to one of the excited states (S1, S2 etc.) and subsequent radiative transition from the lowest energy level at the first singlet state S1 back to the ground singlet state S0 (Fig. 1) This S1 to S0 transition is characterized by several quantitative parameters: i) fluorescence spectrum I(λ), defined as fluorescence intensity as a function of a wavelength, ii) quantum yield Φ, the ratio of the total number of emitted photons per number of absorbed photons, and iii) fluorescence lifetime T – the average time the excited molecule spends in the excited state. While measured independently, all three parameters are related. Typically, an organic fluorophore with strong fluorescence intensity demonstrates a high quantum yield and a relatively long fluorescence lifetime. Of these three parameters, fluorescence lifetime is the most valuable for imaging as it combines the intensity of the fluorescence signal and the change in time during the decay process. The time of decay is highly sensitive to the environment and constitutes the quintessence of fluorescence lifetime imaging.
Fig. 1.

Energy levels and radiative transition from the excited state (S1/S2) to the ground state (S0).
Most of organic fluorophores, both endogenous and exogenous, including fluorescent proteins, decay within several nanoseconds (Berezin and Achilefu, 2010). On a molecular timescale, fluorescence lifetime is a relatively slow process. During this time, a high energy fluorophore can undergo a variety of transformations, from minor electron redistribution to structural isomerization and chemical reaction with surrounding molecules. Under ideal conditions, (i.e. a vacuum with no other molecules around) the excited state has the longest lifetime, known as the natural fluorescence lifetime Tn. This value is difficult to measure, but possible to predict using the well-known and historically important Strickler-Berg equation (Strickler and Berg, 1962). Any activity or process around the fluorophore (solvation, heating, collisions with quenchers) will absorb energy form the fluorophore while it is still in the excited state, and lead to a decrease in fluorescence lifetime. Thus, mapping the fluorescence lifetime of a fluorophore in a cell or a tissue is essentially mapping the biochemical processes occurring in the vicinity of the fluorophore during decay.
2.2.2. Data acquisition
A number of great advances in instrumentation have made FLIM systems highly flexible with a variety of detectors and light sources capable of achieving rapid imaging under low light conditions necessary to preserve biological samples (Suhling et al., 2016). Currently, two families of instruments based on time-domain [e.g. Picoquant, Berlin, Germany; Becker&Hickl, Berlin, Germany] and frequency-domain [e.g. ISS fluorescence imaging, USA; Lambert Instruments, Netherlands] data acquisition methods are used to map fluorescence lifetime on a microscopic level. Although the basic hardware and data processing methods for each technique are different, both approaches are mathematically equivalent and their data can be interconverted. Each method has advantages and disadvantages. Some FLIM microscopes implement time-domain and frequency-domain techniques.
Point-by-point lifetime detection systems on conventional confocal laser scanning microscopes mainly operate in the time-domain, using time-correlated single photon counting (TCSPC) detectors (Becker, 2005, 2008) or fast-gated image intensifiers (Sparks et al., 2017). Measurement of fluorescence lifetime requires short, high intensity excitation pulses and fast detection electronics. Each point in the sample is excited sequentially with a pulsed laser (pulse width <100 ps) at a specific excitation wavelength. Shorter pulses improve the resolution of imaging, enable to measure short fluorescence lifetimes (Becker and Bergmann, 2003), reduce photobleaching of the tissue chromophores (Periasamy et al., 1996), and minimize the heat in order to prevent the tissue from thermal damage. The time-dependent distribution of photons emitted after each pulse is recorded at each point using photon counting photomultiplier tubes [i.e. PMC-100-20, Becker&Hickl] (Yazdanfar et al., 2010) or single photon avalanche photodiodes (SPAD) (Schwartz et al., 2008) [Micro Photon Devices, Bolzano BZ, Italy; ID Quantique, Carouge, Switzerland]. Detectors are equipped with emission filters to eliminate stray light. Fast-gated image intensifiers operated in time-domain measure fluorescence intensity in preset time windows after each pulse (Sparks et al., 2017). Lifetime values are derived from exponential fits to the emission decay data.
The point-by-point measurements imply relatively long acquisition times that might not be optimal for widefield images, or live tissues where a real-time rate frame is desirable. Data acquisition can be significantly accelerated by using a parallelized TCSPC with an array of commercially available eight channel system single-photon avalanche diode detectors [Becker&Hickl] (Gersbach et al., 2010; Rech et al., 2012).
Frequency-domain is considered to be faster than TCSPC, however, it has a higher signal-to-noise ratio. In frequency-domain systems, the incident light is sinusoidally modulated at high frequencies. In this configuration, emission occurs at the same frequency as the incident light but experiences a phase delay (φ) and a change in amplitude (M) relative to the excitation light (demodulation). Data are acquired with photomultipliers or charge-coupled devices equipped with a gain modulator. Molecules with longer lifetimes give rise to larger phase shifts and a smaller demodulation ratio. The key advantage of frequency-domain FLIM is its fast lifetime image acquisition, making it suitable for dynamic applications such as live cell research (Shagaghi et al., 2017).
Most FLIM measurements (time- and frequency-domain) employ single photon excitation. Since most biological tissues strongly scatter light, the assignment of photons to a particular region of the illuminated sample is challenging. In two-photon FLIM microscopy molecules are excited by near-simultaneous absorption of two lower energy photons. This approach overcomes the common limitation of conventional FLIM systems by restraining fluorescent signal generation to a tiny voxel at the focal point. Both, time- and frequency-domain two-photon FLIM systems have been reported (Gratton et al., 2003; Estrada and Dunn, 2010) and are supported by most of FLIM manufacturers.
In both methods the lifetime in every pixel is calculated using curve fitting algorithms, with the least squares criterion being the most common. This method relies on calculation of the lifetime of one or several components in the tissue simultaneously. Complementary approaches in dealing with the complexity of multiexponential images that are often seen in autofluorescence FLIM (see below) include stretched exponential (Lee et al., 2001), global fitting algorithms (Pelet et al., 2004), the Laguerre deconvolution method (Jo et al., 2006), and the phasor analysis method (Redford and Clegg, 2005; Digman et al., 2008).
2.3. Natural fluorophores of the retina using ex vivo FLIM
The retina and nearby tissue is rich with endogenous fluorophores (Fig. 2) that absorb and emit in the 250 nm to nearly 700 nm range (Table 1). However, because of UV filtering properties of the cornea and lens, wavelengths below do not enter or exit the eye, and as such cannot be measured in vivo. This section provides information about lifetime characteristics of fluorophores found in the retina ex vivo by using FLIM. Autofluorescence FLIM is an attractive modality because it does not require administration of a fluorescent dye. However, the low signal of autofluorescence, and the complex nature of autofluorescence spectrally overlapping with several fluorophores, each with a variable lifetime, makes interpretation of the images difficult. Yet, the complicated landscape of autofluorescence carries substantial information regarding organ pathology and provides an excellent opportunity for FLIM to decipher the available data.
Fig. 2.

Source of autofluorescence in retina and surrounding tissue (with permission from Han et al. 2007).
Table 1.
Endogenous fluorophores responsible for autofluorescence in the retina and nearby tissue.
| Fluorophore | Excitation, nm | Emission, nm | Lifetime, ns | References |
|---|---|---|---|---|
| phenylalanine | 258 (max) 240-270 | 280 (max) | 7.5 | (McGuinness et al., 2006) |
| tyrosine | 275 (max) 250-290 | 300 (max) | 2.5 | (Ashikawa et al., 1982) |
| tryptophan | 280 (max) 250-310 | 350 (max) | 2.0–6.0 | (Guo et al., 2012; Guo et al., 2013) |
| NAD(P)H free | 300–380 | 450–500 | 0.3 | (König, 2008) |
| NAD(P)H protein | 300–380 | 450–500 | 2.0–2.3 | (König, 2008) |
| FAD free | 420–500 | 520–570 | 2.91 | (Koziol et al., 2006; König, 2008) |
| FAD protein bound | 420–500 | weak in 520–570 | <0.01 | (Schweitzer et al., 2007b) |
| retinal (Shiff base) | 350 | 600–650 | 0.030–0.1 | (Bachilo and Gillbro, 1999) |
| hemoglobin | 400–600 | non-fluorescent | n/a | – |
| melanin | 300–800 | broad in NIR | 0.65–1.6 | (König, 2008) |
| collagen | 280–350 | 370–440 | ≤5.3 | (Maarek et al., 2000; König, 2008) |
| elastin | 300–370 | 420–460 | ≤2.3 | (Maarek et al., 2000; König, 2008) |
| lutein | 440–540 | 550 | 0.03–0.08 | (Barker et al., 2011; Dysli et al. 2016e) |
| zeaxanthin | 440–540 | 550 | 0.03–0.08 | (Barker et al., 2011; Dysli et al. 2016e) |
| lipofuscin | 340–500 | 540,430-460 | up to 2.2 | (Sparrow et al., 2000; Schweitzer et al., 2007b) |
Abbreviations: nicotinamide adenine dinucleotide (NADH); nicotinamide adenine dinucleotide phosphate (NADPH); flavin adenine dinucleotide (FAD); near-infrared autofluorescence (NIR); nanometer (nm); nanoseconds (ns).
Retinal fluorophores include aromatic amino acids that form proteins and enzymes, redox-active chromophores which regulate cell metabolism, structural proteins responsible for the shape and flexibility of the retina, and some fluorescent pigments which are markers of many age-related pathologies. A brief overview of fluorescent properties of retinal fluorophores is given below.
2.3.1. Amino acids
Three amino acids, phenylalanine, tyrosine, and tryptophan are fluorescent (Supplementary Fig. 1). Of these amino acids, tryptophan is the only one useful for FLIM because of its broad emission tail that goes beyond the 350 nm range where conventional FLIM can be utilized. The fluorescence of other fluorophores occurs in the deep UV region that cannot be detected by typical glass-based microscopes. Phenylalanine and tyrosine suffer from low quantum yield and poor molar absorptivity (Chen, 1967; Barrett and Elmore, 1998) with weak emission at 350 nm. Tryptophan, with its moderate molar absorptivity (5500 M−1 cm−1) (Barrett and Elmore, 1998) and decent quantum yield (Φ = 0.13) (Chen, 1967), dominates the lifetime map around 350–400 nm in the absence of strong exogenous fluorophores in that range.
2.3.2. NADH
A reduced form of nicotinamide adenine dinucleotide (NADH) and its phosphate derivative (NADPH) are the major endogenous fluorophores responsible for autofluorescence in cells when excited above 400 nm. NAD(P)H has an absorption maximum at 350 nm and emits at 450 nm (Kierdaszuk et al., 1996). The oxidized form NAD + absorbs at a much shorter wavelength (~ 260 nm) and does not fluoresce. Protein bound NAD(P)H exhibits a relatively long fluorescence lifetime of 2.3–3.0 ns and a short lifetime ~ 0.3–0.4 ns in the free form (Lakowicz et al., 1992; Blinova et al., 2005). This decrease is due to facilitated rotation around the bond between the pyridine and amide in the excited state. The difference in lifetime between the free and protein bound forms is the basis of almost all fluorescence lifetime imaging techniques aimed at NADH (Wakita et al., 1995; Schneckenburger et al., 2004) which is where biexponential FLIM maps of cellular metabolism are typically generated (Niesner et al., 2004).
2.3.3. Flavin
Flavin adenine dinucleotide (FAD) is a redox cofactor with strong although oxidation dependent fluorescent properties. As with NAD(P)H, flavin exists in several redox configurations (Kao et al., 2008). Only the fully oxidized FAD form is fluorescent. This fully oxidized form emits at a longer wavelength than NAD(P)H and has only a small overlap, allowing for selection of imaging conditions specifically for FAD without spectral contamination from NAD(P)H. The non-bound form of FAD has the longest lifetime of 2.3–2.9 ns, while protein binding leads to a significant decrease of the lifetime to <0.1 ns (Nakashima et al., 1980; Maskevich et al., 1997), apparently due to the presence of adjacent aromatic residues in the protein binding pocket (Yang et al., 2003; Kao et al., 2008).
2.3.4. Melanin
Melanin constitutes a diverse group of pigments produced by melanocytes and found in the eyes to protect them from UV and high-intensity visible light. Melanin is composed from a complex mixture of largely unknown biopolymers derived from tyrosine (Ito, 1986). With respect to the eye, important members of the melanin family are eumelanin and pheomelanin (Supplementary Fig. 1). Eumelanin is more common in brown-eyed people, while pheomelanin is found in blue- and green-eyed population (Kolb, 2007). The emission decay of melanin is complex, as would be expected from its featureless absorption spectra and the lifetime ranges from picoseconds to almost 8 ns (Forest et al., 2000; Ehlers et al., 2007).
Under the near-infrared illumination (i.e. 785 nm), melanin is a relatively strong fluorophore (Huang et al., 2006) and a major source of near-infrared fundus autofluorescence (NIR-AF) (Gibbs et al., 2009). Under ultraviolet or short visible light, melanin shows a relatively poor quantum yield with low emission. Because of this optical behavior, melanin was considered to be non-fluorescent under UV-VIS light excitation. However, under the oxidizing conditions, the oxidized form of melanin exhibits a lipofuscin-like yellow fluorescence with excitation max at 450–470 nm and emission at 540 nm (Gallas and Eisner, 1987; Kayatz et al., 2001).
2.3.5. Lipofuscin
The visual cycle begins with the photoisomerization of retinal. When the 11-cis-retinal chromophore, bound to the transmembrane portion of the photoreceptor cell opsin, absorbs a photon, it isomerizes from the 11-cis state to the all-trans state. This conformational change in the opsin leads to a cascade of signaling reactions leading to an electrical response in the photoreceptor. The recycling of all-trans-retinal to the 11-cis conformation includes conversion of the all-trans-retinal to all-trans-retinol by all-transretinol-dehydrogenase. Although most all-trans-retinal is recycled, some all-trans-retinal, which is not bound to opsin, can enter a nonenzymatic reaction with phosphatidylethanolamine (PE) to create N-retinylidene-PE or alternatively, fusion with a second all-trans-retinal to create a bisretinoid molecule A2-PE-H2. RPE lipofuscin is a complex mixture of di-retinal conjugates, including A2E, A2-PE-H2 and A2-PE and is predominantly found in an intracellular organelle, the lysosome (Spaide, 2008). Lipofuscin is a pale, yellow-brown pigment of varied molecular weight (Taubold et al., 1975) mostly visible in skin as the so-called “age” or “liver” spots. (Supplementary Fig. 1), with some minor cis-trans isomers and phosphatidyl analogs. Lipofuscin is formed in the cytoplasm of muscle and nerve cells and has been implicated in age-related diseases of the retina, such as macular degeneration and Stargardt disease (Sparrow and Boulton, 2005).
By selecting an appropriate set of excitation and emission conditions, lipofuscin can be distinguished from other fluorophores in tissues. In the window of 440–470 nm excitation and 510–700 nm emission, lipofuscin was found to be the brightest endogenous fluorophore (Schweitzer et al., 2007b). The decay of lipofuscin in vivo is multiexponential due to a heterogeneous microenvironment consisting of multiple fluorophores with a variety of energy transfers. Several studies have revealed at least two major components with lifetimes of 390 ps and 2.2 ns. The short component has been used to distinguish lipofuscin from other fluorophores present in the retina, such as bound NAD(P)H, melanin, and collagen (Schweitzer et al., 2007b).
2.3.6. Retinal
Retinal bound to rhodopsin (Supplementary Fig. 1) by itself is only weakly fluorescent with an extremely low quantum yield (Alexiev and Farrens, 2014). The Schiff base of retinal, a model of the chromophore, shows its absorption maximum at 360 nm and emission at ca. 610 nm with a lifetime of 56 ps in ethanol (Bachilo and Gillbro, 1999). Retinoid binding proteins have very weak and ultrafast fluorescence because of excited-state photochemical reactions. The most important one among them is the rapid cis-trans isomerization that occurs in <1 ps (Doukas et al., 1984). The short lifetime is unlikely to be distinguished from the instrument response function on most of commercial FLIM systems.
2.3.7. Lutein and zeaxanthin
Lutein and zeaxanthin are the predominant carotenoids found in the retina and are mainly located in the macular center, leading to the yellowish color of the fovea (Schalch, 1992; Widomska and Subczynski, 2014). They play an important role as antioxidants to prevent against oxidative stress (Bernstein et al., 2016). Due to the absorbance maximum of lutein and zeaxanthin around 460 nm, both compounds act as blue filters for UV light (Barker et al., 2011). Both pigments show weak and broad emission at 550 nm max. Fluorescence lifetime of lutein and zeaxanthin in solution excited at 473 nm is below 100 ps (see Table 1 and Section 4). However, in the aggregated form, the lifetime of zeaxanthin has been reported to reach 1.06 ns when measured at an emission of 680 nm (Gruszecki et al., 1990).
2.3.8. Collagen and elastin
Collagen is a slightly fluorescent structural protein consisting of a network of fibrils. It can be observed in the retina, contributing to retinal architecture and stability, as well as vitreoretinal adhesion and stability of the vitreous gel (Sebag, 1992; Ponsioen et al., 2008). Elastin is rare in the human retina. It is found in retinal arteries (Chen and Weiland, 2014) as a regulator of contractility and blood flow in the retinal vascular system. Both, collagen and elastin, show emission of up to 500 nm when excited with UV of up to 350 nm (Zheng et al., 2008) or with two-photon excitation using red lasers (Han et al., 2005).
3. Technical principles of fluorescence lifetime imaging ophthalmoscopy
In the last four decades, imaging of intrinsic retinal fluorophores has mainly focused on intensity measurements. However, in the last years efforts have been made to include fluorescence lifetime as an additional dimension leading to combined time- and intensity-resolved autofluorescence measurement. The fluorescence lifetime is a photophysical and –chemical function and describes the average time a molecule remains in its electronically excited state after absorbing the energy of a photon and before returning to the ground state by emitting a photon. This process follows an exponential decay and the time scale is typically in the order of pico- to nanoseconds. Equation (1) represents the sum of fluorescence, indicated as fluorescence intensity (I), at time (t) with the respective fluorescence lifetime (T) and amplitude (α), depending on the number of decay components.
| (1) |
I: intensity
T: lifetime
n: number of components
α: weighting, amplitude
The fluorescence lifetime is not only dependent on the molecule itself, but also on its local environment. It is therefore a promising parameter for metabolic processes in the retina.
The decay of the excited state of the fluorophore is a statistical process. Hence, to derive fluorescence lifetimes, a number of decay cycles must be measured. For every single fluorophore, detection time upon excitation is measured and sorted into different time channels, which then form an exponential function.
3.1. Pulsed fluorescence excitation and decay histogram
Experimentally, each fluorescent photon has to be precisely registered according to its arrival time at the detector upon excitation and corresponding position on the retina. Therefore, the FLIO system consists of a pulsed laser source and a sensitive detector for registration of every single photon. A confocal laser scanning ophthalmoscope (cSLO) is the basis for image recording throughout the acquisition process.
The resulting histogram of the fluorescence decay can be fitted by an exponential function (see Fig. 3 A). For a single fluorophore, the decay function should theoretically be mono-exponential. However, several factors influence the shape of the exponential decay:
Interaction of more than one fluorophore specimen
Time distribution of the excitation photon bunch
Movement artifacts
Fig. 3.

A) Fluorescence excitation and emission pathway and fluorescence decay histogram. The excitation laser raster scans the retina in multiple periods (1,2,3, …,n) and detects and integrates every single emitted fluorophore and builds up a distribution histogram over time. B) Schematic illustration of the FLIO system. C) Technical setup of the FLIO system. Beam splitter (BS), fixation target (F), scanning mirror (SM), mirror (M), detector (D, short (SSC, 498–560 nm) and long (LSC, 560–720 nm) spectral channel), laser (L, 473 nm), TCSPC module (T), detector control module (DC).
Usually, more than one fluorophore specimen is present. Currently, the depth resolution does not allow to measure fluorescence in single retinal layers. Therefore, with the FLIO imaging devices, fluorescence lifetimes across the entire retinal depth are measured. This results in fluorescence lifetimes which are composed from a variety of different fluorophores or from the same fluorophores but with different local environments. Hence, the resulting histogram of photon decay times is a mixture of the most prominent fluorophores.
Within the exponential decay of the fluorophores (equation (2)) the instrument response function (IRF) is integrated which represents the temporal behavior of the detectors. During data analysis, the influence of the instrument (IRF) has to be cancelled, so that only the data resulting from the fluorophores are analyzed.
| (2) |
The fluorescence is not always decayed after one measurement period of 12 ns. As a standard approach, repetitive measurement of periods or cycles of 12 ns are performed and integrated over time. This is especially important for long lifetimes, because photons from a previous cycle can leak into the next cycle and influence the calculation results.
The higher the order of the exponent, the more fluorophores might be distinguished. However, increasing exponents necessitate higher numbers of photons to satisfy statistical requirements for accurate exponential decay approximation. Therefore, a compromise between precise fitting and enough photons needs to be found. For high spatial resolution, a low binning factor of 0 or 1 is used, requesting accumulation of sufficient photons per individual pixel. A binning factor of 0 indicates that photons of one single pixel location are considered for the exponential decay function. However, 1 means that the photons from the immediately neighboring pixels are also included, increasing the number of photons by nine. In cases of low amount of photons detected per pixel, the binning factor needs to be increased accordingly, leading to a larger area with the same fluorescence lifetime and thereby a lower spatial resolution. Depending on the type of disease, either higher spatial resolution or a more precise curve fit of the recorded lifetime data can be chosen. In our hands, a binning of 1 and a bi-exponential curve fit seems to be appropriate in most diseases.
3.2. Fluorescence lifetime imaging ophthalmoscope
The fluorescence lifetime imaging ophthalmoscope is based on a Heidelberg Retina Angiograph cSLO (HRA2, Heidelberg Engineering). Fig. 3B) and C)) shows schematical illustrations of the FLIO setup. It is equipped with an infrared camera for active eye tracking (TruTrack) to correct for eye movements and thereby to ensure correct live registration of each arriving photon within a 256 × 256 pixel frame. The fluorescence lifetime imaging ophthalmoscope has been modified and synchronized with a picosecond pulsed illumination excitation diode laser at 473 nm (Becker&Hickl). Autofluorescence excitation occurs with a confocal laser beam, raster scanning the central 30° of the fundus with a frame rate of 9 Hz and a laser repetition rate of 80 MHz. Two spectrally separated highly sensitive single photon counting detectors (HPM-100-40, Becker&Hickl) connected to two time-correlated single photon counting cards (TCSPC, Becker&Hickl) are responsible for detection of every single emitted fluorophore. According to their wavelength, photons are separately detected in two channels: a short spectral channel (wavelength 498–560 nm, SSC) and a long spectral channel (560—720 nm, LSC). The laser and the detectors are controlled by a detector control module (Becker&Hickl). Over the entire scan duration, repetitive measurement periods, each 12 ns apart, are performed at each pixel of the scan. The detected photons are then put into a histogram with time channels of 12.5 ps.
All parts of the current FLIO device are integrated into the Heidelberg engineering cSLO architecture and fulfill laser safety class 1 considerations which comply with ANSI Z136.1–2007 (ANSI, 2007) and International Electrotechnical Commission (IEC, 2014). The instrument is controlled with a modified version of the Heidelberg Eye Explorer (HEYEX) software (Heidelberg Engineering) and the final lifetime calculation is done with an integrated version of SPCImage (Becker&Hickl).
3.3. Image acquisition and analysis
Standard FLIO image acquisition is usually performed with maximally dilated pupils to reduce influence of lens autofluorescence lifetimes, as in mydriasis the time-correlated photon counts from retinal fluorophores are higher. Eyes with clinically significant lens opacities were excluded for the studies included in this review. As in autofluorescence intensity imaging, image quality is decreased in cases of significant cataract, and longer auto-fluoescence lifetimes are measured. Within the macular center, we recommend to acquire a minimum of 1000 photons per pixel in both channels, resulting in a total scan duration of about 90 s. As the autofluorescence lifetimes are generally insensitive to moderate levels of photobleaching (Ishikawa-Ankerhold et al., 2012), this effect can be neglected in FLIO. Additionally, the fluorescence lifetimes are averaged over the entire scan duration, and thereby possible time dependent effects can be excluded. Currently, no photo-oxidative changes can be measured in vivo (Teussink et al., 2017).
SPCImage software from Becker&Hickl can be used for analysis of the recorded fluorescence lifetime data. In both wavelength channels and for each location, a photon distribution histogram is built over the time span of 12.5 ns. To increase the numbers of photons for the exponential decay curve fit, a binning factor of one can be used, averaging the photons of an individual pixel point with the directly adjacent pixels.
The acquired data is fitted by an exponential decay curve (Fig. 4 A + B). Comparison of bi-versus three-exponential decay functions revealed insignificant differences between these two models for the mean fluorescence lifetime within a study population of 31 healthy subjects (Correlation of 0.996 in both spectral channels, see Supplementary Fig. 2). Consistency of analysis within one study is important. The goodness of fit of the exponential decay function is indicated by the x2 value, whereby low parameters indicate an appropriate fluorescence lifetime fit. The x2 value ranged between 1.1 and 1.3. Bi- versus three-exponential analysis did not influence the x2 value substantially if the fit was appropriate.
Fig. 4.

FLIO imaging in the healthy retina. A) Representative fundus autofluorescence intensity (FAF) and mean fluorescence lifetime image (FLIO; long spectral channel (LSC) 560–720 nm; color range Tm: 200–1000 ps) of the right eye of a 35 years old healthy subject. For comparability, the same settings (LSC, consistent color range if not further specified) is used for further illustration in retinal pathologies. B) Calculated fluorescence decay curves over the time interval of 12 ns for individual pixel locations (1–4) marked in A). C) 2D histogram showing the distribution of fluorescence lifetime clouds for specific retinal areas when plotting the short decay component T1 (x-axis) versus the long decay component T2 (y-axis) according to equation (3). Note the different time scales used for the axis.
The determined bi-exponential decay function resulted in the following individual lifetime components within the SSC and the LSC: a short (T1) and a long (T2) decay time with their corresponding relative amplitudes (= relative intensity) α1 and α2 (Fig. 5). Within the ocular fundus, T1 is much shorter than T2 and the amplitude α1 is much higher than α2. A main outcome parameter, representing all abovementioned fluorescence lifetime components, is the mean fluorescence lifetime tau mean (Tm). It represents the amplitude weighted mean fluorescence decay time per pixel and wavelength channel. Tm is calculated from the individual four lifetime components T1, T2, α1, and α2:
| (3) |
Fig. 5.

Illustration of individual lifetime components according to equation 3 (LSC). A) Autofluorescence intensity image with indicated standard ETDRS grid which was used for quantitative analysis of lifetime values within the individual rings and subfields (C: center subfield, d = 1 mm; IR: inner ring, d = 3 mm; OR: outer ring, d = 6 mm). B) mean fluorescence lifetime with adjusted color range with minimal to maximal fluorescence lifetime (Tm: 200–350 ps). C + D) Amplitude and lifetime of the short decay component. Note that the amplitude a1 contributes to 92–98% with the very short decay component T1 of 150–200 ps. E + F) Amplitude and lifetime of the long decay component. Note that the amplitude a2 contributes only to 2–8% with the extremely long decay component T2 of 1500–2000 ps. G) The distribution of the photon count ranged between less than 1500 photons in the macular center, the optic nerve head and the retinal vessels and 5800 photons in the area of the peripheral retina. H) The chi2 value indicates the goodness of the exponential fit with main values between 1,0 and 1,5.
Two dimensional distribution histograms (2D) can be used for visualization of individual lifetime components such as the short and the long decay parameters T1 and T2. Thereby, lifetime clouds of specific retinal locations can be identified. Fig. 4 C) shows the 2D lifetime distribution histogram of a healthy subject.
3.4. Image analysis software
For clinical image analysis, FLIO data can be analyzed using the custom made ‘FLIO reader’ (ARTORG Center for Biomedical Engineering Research, University of Bern, Bern, Switzerland) or FLIMX software (M. Klemm, Ilmenau, Germany) (Klemm et al., 2015). They allow continuous overlay of the fluorescence intensity image and the color coded image of single lifetime components (Tm, T1, T2, α1, α2, photon count, chi-square value, Fig. 5). A standard Early Treatment Diabetic Retinopathy Study (ETDRS) grid with circle diameters of 1 mm for the central area (C), 3 mm for the inner ring (IR) and 6 mm for the outer ring (OR) can be used to analyze areas of interest (Dysli et al., 2014b). The grid is adjustable in position and if needed also in size. It enables averaging of single lifetime components and provides corresponding standard deviation values for all of the nine subfields of the grid. For specific analysis, a small region of interest (circle diameter of 0.2 mm) can be used.
4. Fluorescence lifetimes of retinal fluorophores ex vivo
In order to illustrate the lifetime contribution of possible individual retinal fluorophores, single compounds can be measured and analyzed individually using FLIO. As these measurements are usually performed in vitro and independent of the ocular system consisting of cornea, lens, vitreous body, and all retinal layers, the acquired data might not be directly transferable to in vivo measurements, but may rather serve as reference for further studies.
The shortest retinal autofluorescence lifetimes are observed within the macular center and are assumed to be caused by macular pigment (Sauer et al., 2015; Sauer et al., 2016). The macular pigment mainly consists of the retinal carotenoids lutein and zeaxanthin (Wustemeyer et al., 2003; Neuringer et al., 2004; Johnson et al., 2005; Leung et al., 2005; Barker et al., 2011; Lima et al., 2016). Its absorption spectrum lays between 400 and 540 nm with a peak at 460 nm. Our measurements using the FLIO system with 473 nm excitation wavelength revealed mean autofluorescence lifetimes for lutein and zeaxanthin between 41 and 84 ps in the short spectral channel (498–560 nm) and 31–58 ps in the long spectral channel (560–720 nm; (Dysli et al., 2016e). This supports the hypothesis that carotenoids, even though they are not detectable in fundus autofluorescence intensity measurements, might contribute to short retinal fluorescence lifetimes.
Other fluorophores residing in retina are known to originate as by-products of the visual cycle. FLIO measurements of the visual cycle compound retinal revealed very short decay times with values around 82–85 ps in the short, and 32–47 ps in the long spectral channel. All-trans-retinal is an intermediate substrate within the visual cycle before reduction to all-trans-retinol or – in case of accumulation of all-trans-retinal – formation of all-trans-retinal dimers and subsequent conjugation with phosphatidylethanolamine (Fishkin et al., 2004; Fishkin et al., 2005).
On the other hand, fluorescence lifetimes of retinol were between 330 and 566 ps in both detection channels. Given that the excitation peak of retinol is below 400 nm and therefore not reaching the retina due to absorption by the lens, it is unlikely that retinol fluorescence lifetimes contribute significantly to retinal fluorescence lifetimes in vivo. Retinal is the aldehyde form of vitamin A that is generated from vitamin A (retinol) by oxidation. Although all-trans-retinal has not been shown to exhibit fluorescence at 488 nm excitation, all-trans-retinal derivates such as the all-trans-retinal dimer-phosphatidylethanolamine formed in the outer photoreceptor segments display fluorescence at this excitation wavelength. Deposition of shed but not phagocytized outer segments containing retinaldehyde adducts such as all–trans-retinal dimer in the subretinal space due to separation of the outer segments from the RPE may contribute to short lifetimes such as seen in newly arisen deposits in Stargardt disease and active lesions in central serous chorioretinopathy (Dysli et al., 2016b,c,d; Dysli et al., 2017). In Stargardt disease, a defect in the ABCA4 transmembrane transport protein, which is involved in the transport of N-retinylidene-PE across the outer segment disks of the photoreceptors, leads to accumulation of all-trans-retinal derivatives within the outer segment before phagocytosis (Spaide, 2008).
With increasing age and in retinal dystrophies such as Stargardt disease, these compounds are deposited and accumulate in the RPE as lipofuscin. Melanin might be another possible source of retinal autofluorescence lifetimes (Weiter et al., 1986). Melanin has a strong, broadband absorption with a peak around 380 nm. However, the emission is quite low and peaks at around 450 nm (Gallas and Eisner, 1987). On conventional fundus autofluorescence intensity images, melanin absorbs the short-wavelength excitation beam, decreasing the overall autofluorescence signal (Yung et al., 2016). FLIO measurement of pure melanin featured long values with decay times between 648 and 1600 ps (Dysli et al., 2016e).
5. Fluorescence lifetime imaging ophthalmoscopy
5.1. FLIO in healthy retina
We have reported on the basic features of autofluorescence lifetime imaging of the human retina in a study population of 31 healthy subjects with an age range between 22 and 61 years (mean age 35 ± 11 years) (Dysli et al., 2014b). In both spectral channels, the shortest fluorescence lifetimes were measured within the foveal center with lifetimes of 200 ps in the short and 240 ps in the long spectral channel. In this area, the fluorescence intensity was decreased due to the presence of macular pigment. This is in agreement with other studies showing congruence of macular pigment optical density measurements with short fluorescence lifetimes in an independent population of healthy subjects (Sauer et al., 2015; Sauer et al., 2016). Towards the retinal periphery, longer lifetimes were measured. These areas correlate with the topographic distribution of the bisretinoids of retinal lipofuscin (Delori et al., 1995).
The longest mean fluorescence lifetimes can be detected within the area of retinal vessels and the optic nerve head, possibly due to a higher content of connective tissue components such as collagen and elastin. Characteristic fluorescence decay curves for specific locations on the posterior pole of the eye are shown in Fig. 4A) and B). Quantitative autofluorescence intensity, which is mainly based on lipofuscin, is highest 10–15° around the foveal center with slightly decreasing values towards the periphery (Greenberg et al., 2013).
When analyzing the individual fluorescence decay components T1 and T2, a typical lifetime distribution can be shown in a 2D histogram (Fig. 4 C). Thereby, retinal landmarks such as the fovea, the retina, retinal vessels and the optic nerve head can be differentiated.
Repeated measurements using FLIO show a high reproducibility and a low coefficient of variation between measurements of fellow eyes and between repeated measurements within one subject with same pupil dilation size (Dysli et al., 2014b). Furthermore, the influence of pupil size on fluorescence lifetimes was investigated. In non-dilated eyes a shift towards longer fluorescence lifetimes was observed (Dysli et al., 2014b). This may derive from a lower efficacy of detection of retinal fluorophores in non-dilated eyes and possibly stronger fluorescence lifetime effects of the crystalline lens. There were no differences found in fluorescence lifetime distribution between female and male subjects.
With age, retinal fluorescence lifetimes become longer in both spectral channels (see Fig. 6). This is probably the result from progressive accumulation of retinal metabolic by-products such as lipofuscin, and change in the composition of the contributing fluorophores, which finally results in a shift towards longer lifetimes. Additionally, progressive subclinical media opacities might contribute to prolonged mean fluorescence lifetimes with advancing age. In keeping with this, quantitative autofluorescence intensity was shown to increase with age between 20 and 70 years (Greenberg et al., 2013).
Fig. 6.

Quantitative analysis of retinal autofluorescence lifetime values in healthy subjects. Correlation of mean fluorescence lifetimes of the inner ring with age in both spectral channels (SSC: r2 = 0.617, p < 0.001; LSC: r2 = 0.647, p < 0.001).
5.2. FLIO and macular pigment
Fluorescence lifetime imaging of healthy eyes shows typical patterns, whereby shortest mean fluorescence lifetimes (Tm) are found in the macular center. Schweitzer et al., who first described these local differences in 2004, proposed that the short autofluorescence lifetimes originate from within the retinal pigment epithelium (Schweitzer et al., 2004) (Schweitzer et al., 2007b). This assumption was based on two-photon excited autofluorescence imaging of ex vivo porcine retinal cells, confirming short fluorescence lifetimes within RPE cells (Peters, 2011). Because of the inherent thinning of the neuroretina at the fovea and in consideration of these ex vivo studies, it was initially thought that the short fluorescence lifetimes observed in the human macula were a consequence of short lifetimes derived from the melanin contained in the RPE layer. Because macular carotenoids contained in the macular pigment are strong blue light absorbers, it was originally assumed that they do not influence fluorescence lifetimes. However, with the work of Delori it was shown that macular pigment density influences lipofuscin fluorescence and therefore can be imaged indirectly using fundus autofluorescence intensity measurement (Delori, 2004). Studies on patients with macular holes gave further evidence on the impact of macular pigment on the short fluorescence lifetimes (Sauer et al., 2016). It is now assumed that the short fluorescence lifetimes in the macular region originate from the macular pigment.
Macular pigment, mainly consisting of the carotenoids lutein, zeaxanthin, and meso-zeaxanthin, is located in the plexiform layers and photoreceptor axons (Henle’s layer) in the macula lutea (Snodderly et al., 1984; Landrum and Bone, 2001; Krinsky, 2002; Trieschmann et al., 2008). It absorbs the short-wavelength excitation light, causing a hypofluorescent central macula in autofluorescence images (Delori et al., 2001). Different distribution patterns of macular pigment in fundus autofluorescence have been described (Ermakov et al., 2005; Sharifzadeh et al., 2006). In 2015, a strong correlation of short macular Tm with macular pigment optical density measurements was found, providing indirect evidence that the very short fluorescence lifetimes in the macula derive from the influence of macular pigment (Sauer et al., 2015). The fluorescence lifetime of xanthophylls in vitro is very short, with approximately 200–250 fs (Kandori et al., 1994; Sharifzadeh et al., 2006).
The time resolution of FLIO is limited to approximately 30 ps. Therefore, the autofluorescence of macular carotenoids in vivo shows apparently longer lifetimes as compared to the in vitro lifetimes. Accordingly, the shortest fluorescence lifetimes detected with FLIO are found within the fovea and show fluorescence lifetimes of approximately 30–50 ps (Tm in the SSC) (Sauer et al., 2015). The macular region, presumably containing a large fraction of carotenoid fluorescence, also contains a fraction of fluorophores with longer fluorescence lifetimes, such as lipofuscin or melanin. As such, fluorescence lifetimes in the macula are likely to result from a superposition of many fluorophores including lipofuscin and macular pigment. One may argue about the impact of fluorescence of macular pigment in that context, as lipofuscin is reported to show greater fluorescence efficiency (10−2) than macular pigment (10−4) (Lamb et al., 2001; Bhosale et al., 2009a).
In general, known lipofuscin components in vitro show longer Tm (1352 ps) than the shortest mean fluorescence lifetime that is detected with FLIO in the macular region in vivo (Schweitzer et al., 2004) (Schweitzer et al., 2007b). Short autofluorescence lifetimes are only reported for the component A2E (16 and 189 ps); yet, a decline within the distribution of A2E at the macular region has been found (Lamb et al., 2001; Schweitzer et al., 2004; Bhosale et al., 2009b) (Schweitzer et al., 2007b). Therefore, neither lipofuscin nor A2E can explain the short macular Tm (Sauer et al., 2015).
However, the fluorescence of lipofuscin is strongly reduced by macular pigment, which is found within approximately 1 mm (4°) from the central fovea and is located anterior to the RPE. Macular pigment has an absorption spectrum of 400–540 nm, peaking at approximately 460 nm (Bone et al., 1992). Macular pigment is not only acting as an excitation and emission filter on the lipofuscin autofluorescence, it is also a major contributor to macular autofluorescence lifetimes, and thereby causing the shortest lifetimes observed in the human retina. The impact of this has to be considered as fluorescence lifetimes are meant to be largely independent of the fluorophore’s concentration. However, because fluorescence lifetimes in the retina are an amalgamation of various fluorophores, the concentration of a given fluorophore in the retina in a given location is likely to influence the mean fluorescence lifetimes. The decay curve of the mean fluorescence lifetime will be dominated by the most prominent fluorescence lifetime at this location. Fluorescence lifetimes can be detected even in areas where the fluorescence intensity is very weak.
In keeping with this assumption, it was found that macular Tm shows a strong correlation with the amount of macular pigment, independent of the subject’s age or the retinal thickness. Xanthophylls in vitro show a fluorescence emission of approximately 500–580 nm and a peak at 520–540 nm (Sharifzadeh et al., 2006). Due to the peak emission wavelength, the SSC is more influenced by macular pigment fluorescence than the LSC, which is reflected in a stronger correlation for the SSC (Snyder et al., 1985; Cosgrove et al., 1990; Decoster et al., 1992; Andersson and Gillbro, 1995; Sauer et al., 2015).
The macular pigment distribution varies between individuals independent of the sex. The fractional contribution of macular pigment is reflected in the fluorescence lifetimes; a higher fractional contribution of the xanthophylls leads to a shorter Tm. As shown in Fig. 7, the different distribution patterns of macular pigment are reflected in fluorescence lifetime images and can be distinguished (A: broad shaped, B: cone shaped).
Fig. 7.

Autofluorescence lifetimes and macular pigment (MP). FLIO images (en face and 3D view; SSC) and 3D view of macular pigment optical density measurement in two individuals. A: broad shaped MP distribution. B: cone shaped MP distribution. Short fluorescence lifetimes suit well to the distribution of macular pigment.
5.3. FLIO and macular holes
Full-thickness idiopathic macular holes are full-layer defects of the retina located at the fovea. Here, the neuronal retinal layers containing macular pigment are disrupted and dislocated to the side of the defect. Solely the RPE is left inside the macular hole. The fluorescence lifetime patterns in eyes with macular holes differ from the pattern found in healthy eyes (Sauer et al., 2016). The lifetimes inside the defects were significantly longer compared to intact macular regions. Short fluorescence lifetimes were found adjacent to the macular holes, often in a ring-shaped manner. They appeared to be dislocated in the same manner as the retinal layers were dislocated to areas besides the defect (Sauer et al., 2016). Fig. 8A) shows an example of a full thickness macular hole.
Fig. 8.
Autofluorescence lifetimes in macular holes. Fluorescence lifetime image of a patient with a full thickness macular hole before (A) and three months after surgery and successful closure of the macular hole (B).
Additionally, macular holes with opercula were described (Sauer et al., 2016). An operculum is a small piece of detached retina above the defect that often contains macular pigment (Gass and Van Newkirk, 1992; Ezra et al., 1997). The fluorescence lifetimes of the opercula were comparable to those adjacent to the defect as well as the healthy fovea. The same fluorophores must be likewise present, always co-located with macular pigment. This supports the conclusion that macular pigment is responsible for the short mean fluorescence lifetimes (Sauer et al., 2016).
Follow-up examinations after successful macular hole closure with surgery showed a foveal region with fluorescence lifetimes very similar to the fovea in healthy eyes. Here, the neuronal retinal layers were relocated towards their original position (Sauer et al., 2016). FLIO does not show the layers that are located back towards the fovea like OCT, but it shows if the cells containing macular pigment, that originally were at the fovea, were relocated. This may be used to assess the outcome of the surgery. Fig. 8 B) shows an example after successful macular hole surgery with a re-location of short macular Tm. Visual acuity was shown to correlate significantly with Tm of the fovea one month after surgery.
In general, the distributions of macular pigment and short fluorescence lifetimes were congruent. It was observed that short fluorescence lifetimes are dis- and relocated in the same manner as macular pigment is dis- and relocated in the foveal region (Sauer et al., 2016). The short mean macular fluorescence lifetimes can be assigned to the macular pigment, and FLIO is indirectly able to detect the distribution of macular pigment.
5.4. FLIO in retinal artery occlusion
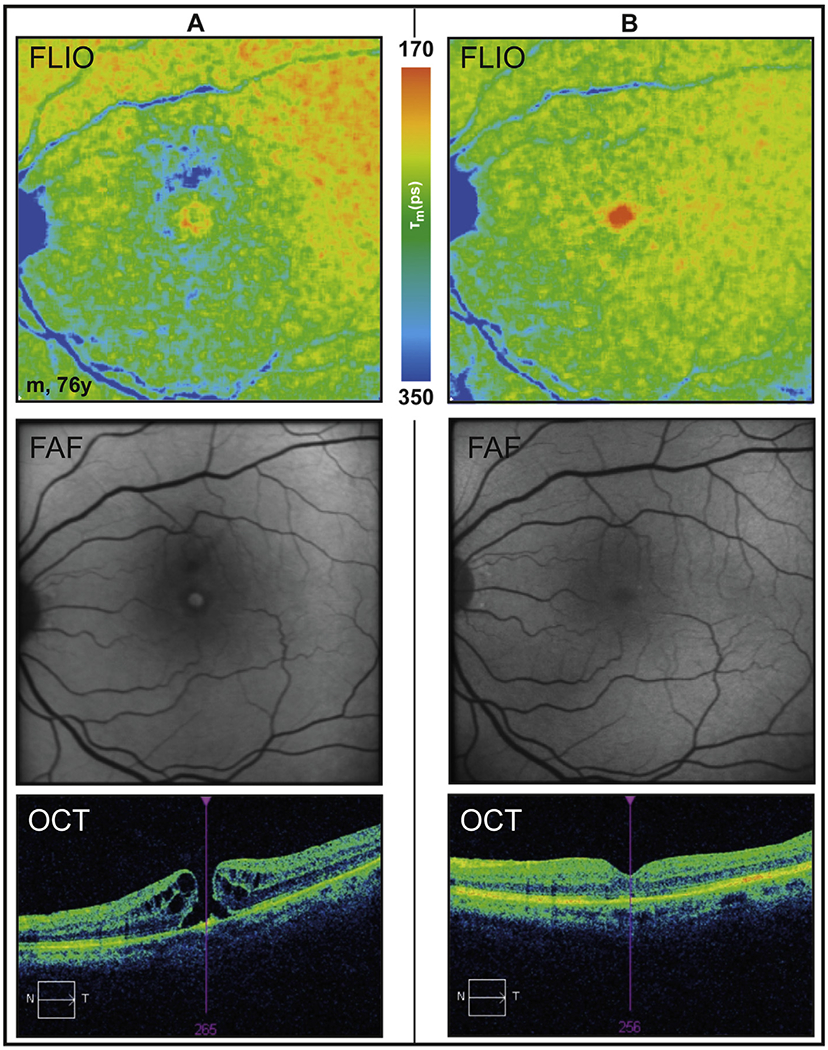
Retinal artery occlusion (RAO) is characterized by sudden painless loss of vision. Two main forms can be distinguished: central and branch retinal artery occlusion (CRAO and BRAO). CRAO is associated with a severe permanent vision loss (Hayreh and Zimmerman, 2005). The resulting oxygen undersupply of the retina leads to a swelling of the inner retinal layers in affected areas in the acute disease stage (Varma et al., 2013). Fundoscopically., this presents as a ‘cherry red spot’ within the macular center due to an absence of the swelling within the fovea and visibility of the choroid. Over time, the swelling reduces and an atrophy of the inner retinal layers can be observed in OCT. Retinal artery occlusion represents a model disease of acute retinal ischemia and therefore acute metabolic alterations. In a recent study, FLIO was used to monitor retinal changes in retinal artery occlusion (Dysli et al., 2015).
In this study of 24 patients with central (mean age 76 ± 4 years) or branch (mean age 61 ± 7 years) retinal artery occlusion, patients were imaged with FLIO in the acute stage early after reported loss of vision (<3 days) (Dysli et al., 2015). At this stage, retinal fluorescence lifetimes were significantly prolonged in areas of RAO (Fig. 9). Hypoxia is therefore thought to lead to decreased contribution of fluorophores with short autofluorescence lifetimes and/or increased influences of long fluorescence lifetimes (Dysli et al., 2015).
Fig. 9.

Autofluorescence lifetimes in inferior retinal artery occlusion: acute disease stage.
Fundus autofluorescence intensity (FAF), fluorescence lifetime (FLIO, LSC), OCT of the indicated green line in FAF image.
Ischemia induces multiple changes of the cellular and molecular environment within the retina. These include formation of reactive oxygen species (ROS), decrease in pH value, and changes in enzymatic activation, cytokine synthesis, gene activation and ionic concentration (Bonne et al., 1998; Kuriyama et al., 2001; Siskova and Wilhelm, 2001; Xu et al., 2004). Due to hypoxia, the ratio for the oxidative phosphorylation of adenosine diphosphate (ADP) to adenosine triphosphate (ATP) is changed as well. Thereby, the two redox pairs NAD+/NADH (oxidized and reduced nicotinamide adenine dinucleotide) and FAD/FADH2 (oxidized and reduced flavin adenine dinucleotide) might influence the measured fluorescence lifetimes. Whereas NAD+ and FADH2 are non-fluorescent, the reduced NADH and the oxidized FAD show specific fluorescence properties depending on the excitation wavelength and their protein-binding state (Lakowicz et al., 1992). As NADH shows very short-wavelength excitation and emission spectra which will be blocked by the lens and cornea, most likely it cannot be detected using the present conditions in FLIO. However, FAD with an excitation maximum at 450 nm and emission at 528 nm lies within the detection range of FLIO (Heikal, 2010). Protein-bound FAD is thought to contribute to very short fluorescence lifetimes, and therefore a shift towards reduced FADH2 and/or reduced protein-binding of FAD due to hypoxia would lead to decreased contribution of short fluorescence lifetimes and thereby longer fluorescence lifetimes in ischemic conditions. Additionally, fundus autofluorescence intensity measurements in RAO showed decreased autofluorescence from the RPE probably due to blockage from the swelling of the inner retinal layers (Mathew et al., 2010). This phenomenon may also partly contribute to the measured prolonged fluorescence lifetimes.
Over time, affected retinal areas developed atrophy of the inner retinal layers. In this post-acute disease stage (>30 days), fluorescence lifetimes in the affected areas were comparable to the unaffected fellow eyes (Dysli et al., 2015). Therefore, the remaining thinned inner retinal layers contribute to the measured mean autofluorescence lifetimes in the same way as normal inner retinal layers in healthy retinae.
5.5. FLIO in age-related macular degeneration
Age-related macular degeneration (AMD) is one of the leading causes of vision loss in patients over 50 years in developed countries. AMD is classified in an early disease stage with presence of retinal drusen and thickening of the Bruch membrane, and late AMD. There are two forms of late AMD: neovascular AMD with accumulation of intra- or subretinal fluid, and dry AMD with geographic atrophy of the retina (Holz et al., 2014; Yung et al., 2016).
5.5.1. Drusen and reticular pseudodrusen
Drusen is a general term for focal deposits of extracellular debris located between the basal lamina of the RPE and the inner layer of Bruch membrane. It includes soft drusen of various sizes (small, medium, large), hard drusen, cuticular drusen, crystalline drusen and reticular pseudodrusen. Drusen and drusenoid deposits can be related to normal aging process; however, they are also the main sign of early AMD (Khan et al., 2016).
FLIO measurement in patients with AMD showed that the mean autofluorescence lifetimes of the retina in AMD was longer compared to age matched healthy control eyes. (Dysli et al., 2016e) This might be a sign of early accumulation of bisretinoids in the RPE. In early stages, membranous debris from atrophic photoreceptor outer segments may not yet appear as visible in conventional imaging techniques (Khan et al., 2016) When analyzing specifically fluorescence lifetime values of soft drusen and reticular pseudodrusen as the two main forms of drusenoid deposits, a broad range of fluorescence lifetimes was detected. However, fluorescence lifetimes of drusen and reticular pseudodrusen did not differ significantly from the surrounding retina. In fluorescence intensity images, soft drusen typically appear hyper-fluorescent, especially at the edges of the deposits. In contrast, reticular pseudodrusen do not show hyper- but rather hypo-fluorescence and are particularly visible in infrared images. Their subretinal location is likely to block the autofluorescence from the underlying RPE (Khan et al., 2016) and might therefore attenuate the contribution of relatively short fluorescence lifetimes deriving from the RPE, resulting in a general shift towards longer lifetime values.
Hyper-fluorescent areas with short retinal lifetimes were colocalized with hyper-dense deposits in the areas of degenerating photoreceptor cells, especially the outer photoreceptor segments as identified by OCT (Fig. 10 A) (Sparrow et al., 2015). These deposits might contain high concentrations of visual cycle by-products such as retinaldehyde adducts with short fluorescence lifetimes similar to what we have observed in early flecks in patients with Stargardt disease (Dysli et al., 2016b,c,d) However, large drusen associated with pigment epithelial bulging, which appear hyper-fluorescent in fluorescence intensity measurement, were not directly visible in FLIO measurement. On the other hand, areas of clearly prolonged autofluorescence lifetimes were co-localized with intraretinal deposits at the level of the photoreceptors. In these cases, the RPE-photoreceptor band seemed to be highly altered and as such, these lesions might reflect connective tissue remodeling rather than photoreceptor activity.
Fig. 10.
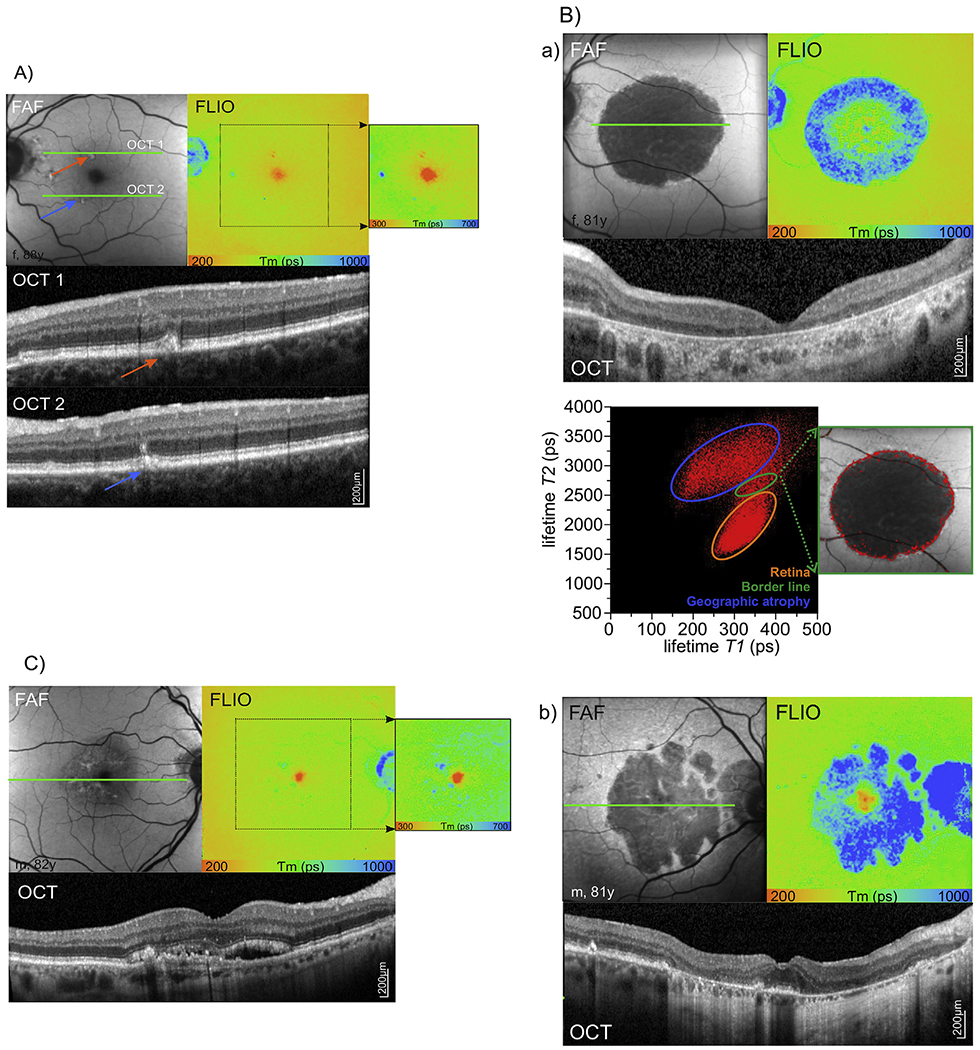
A) Autofluorescence lifetimes in age-related macular degeneration with drusen. Areas of short respectively long fluorescence lifetimes are shown in detail (adjusted color scale). B) Autofluorescence lifetimes in geographic atrophy (GA). a) Central geographic atrophy with 2D distribution histogram of the short (T1) versus the long (T2) decay component. Thereby, borders of geographic atrophy can be identified. b) Geographic atrophy with foveal sparing. C) Autofluorescence lifetimes in neovascular age-related macular degeneration.
Fundus autofluorescence intensity (FAF), fluorescence lifetime (FLIO, LSC), OCT of the indicated green line in FAF image.
5.5.2. Geographic atrophy
The hallmark of dry late AMD is geographic atrophy which leads to irreversible central vision loss due to progressive degeneration of the RPE, the choriocapillary layer, and the outer retina (Bowes Rickman, Farsiu et al., 2013; Holz et al., 2014; Yung et al., 2016). RPE atrophy and consequent loss of intrinsic fluorophores results in an area with a low to extinguished fundus autofluorescence intensity signal with sharply demarcated borders. Geographic atrophy lesions including the fovea are more difficult to identify in autofluorescence intensity measurement due to low baseline concentration of lipofuscin and absorption interference by macular pigment (Yung et al., 2016). Typically, lesions of geographic atrophy are surrounded by hyper-fluorescence, which represents areas of photoreceptor and RPE dysfunction and deposits. Using autofluorescence intensity measurement, different forms of geographic atrophy are described in literature with specific morphological characteristics and respective prognostic values. According to the distribution of hyper-fluorescence around the lesion of atrophy, the fundus autofluorescence intensity patterns are classified in none (no hyper-fluorescence), focal, banded, patchy, and diffuse with subgroups reticular, branching, fine granular, trickling, and granular with peripheral punctuate spots (Bindewald et al., 2005). Additionally, geographic atrophy can be classified in single and multifocal lesions, and whether the foveal center is affected by atrophy or spared (Bindewald et al., 2005).
Similarly, geographic atrophy can be investigated and classified using autofluorescence lifetime imaging (Dysli et al., 2016b,c,d) (Fig. 10 B). Thereby, areas of RPE atrophy, appearing dark in autofluorescence intensity measurement due to missing autofluorescence contribution of the RPE, generally featured prolonged autofluorescence lifetimes. However, a broad range of lifetime values was detected, indicating contribution of different retinal fluorophores in the absence of the RPE. Long fluorescence lifetimes in geographic atrophy may originate from the underlying choroid or from the inner retinal layers. In some cases, short fluorescence lifetimes were detected in the area of geographic atrophy in the macular center. They presumably originate from the macular pigment within the Henle fiber layer and were only found when structures of the outer nuclear layer and outer plexiform layer were partially preserved. Of special interest in advanced dry AMD are the marginal zones of geographic atrophy. As known from autofluorescence intensity imaging, this zone helps to classify the different forms of geographic atrophy and potentially provides information about disease progression. In FLIO, this border zone can be demarcated and visualized using fluorescence lifetime maps and 2D correlation of the short and the long lifetime component. Therefore, FLIO might be used for monitoring of progression of geographic atrophy, and could serve as a tool for monitoring novel treatment approaches for geographic atrophy involving complement factor inhibitors.
5.5.3. Neovascular age-related macular degeneration
Neovascular AMD is characterized by the presence of choroidal neovascularization which are located below the RPE (type 1) or above the RPE (type 2) (Yung et al., 2016). As the RPE and photoreceptors are primarily intact, neovascularizations do not seem to influence autofluorescence intensity measurements in early disease stages. Over time, hypo-autofluorescence can occur due to blockage of RPE autofluorescence by fibrovascular complex and/or progressive atrophy of the RPE and photoreceptors.
Fluorescence lifetime imaging in neovascular AMD revealed generally slightly prolonged fluorescence lifetimes (Fig. 11 C, Dysli et al., 2016e). Local spots with prolonged lifetimes correlated with intraretinal deposits or RPE atrophy. The presence or absence or the amount of intraretinal fluid did not significantly influence the measured mean fluorescence lifetimes. Therefore, similar as in post-acute disease stage in retinal artery occlusion, the inner retinal layers and their distance from the RPE probably do not substantially influence the measured mean fluorescence lifetimes.
Fig. 11.

Autofluorescence lifetimes in central serous chorioretinopathy (CSCR). A) Acute disease stage. B) Chronic recurrent disease stage with long fluorescence lifetimes due to RPE and photoreceptor atrophy. C) Central area of acute disease activity characterized by short fluorescence lifetimes and temporal area of recent disease activity appearing with slightly prolonged fluorescence lifetimes. D) The 2D histogram of the short (T1) versus the long (T2) decay component (from image C) shows specific lifetime clouds for the different anatomical locations.
Fundus autofluorescence intensity (FAF), fluorescence lifetime (FLIO, LSC), OCT of the indicated green line in FAF image.
5.6. FLIO in diabetic retinopathy
Diabetic retinopathy is a micro-vascular complication in diabetes (Cogan and Kuwabara, 1963). Micro-vasculopathy and inflammation finally result in neuronal degeneration (Barber et al., 2011) and a breakdown of the blood – retina barrier causing retinopathy and macular edema (Zhang et al., 2014). As hyperglycemia is a primary event in diabetes, this causes not only an impairment of the vascular endothelium but also a general protein glycation. This formation of advanced glycation end products (AGE) in the nonenzymatic Maillard reaction of proteins with glucose and other sugar molecules is involved in blood – retina barrier breakdown (Zhang et al., 2014) as well as endothelial dysfunction and activation of the protein kinase C pathway (Yu et al., 2001). AGE show fluorescence, and their concentration in serum was found to increase with the severity of diabetic retinopathy (de la Maza et al., 2012). As increased fundus autofluorescence has been found in diabetic macular edema in association with decreased macular sensitivity (Vujosevic et al., 2011), Schweitzer et al (Schweitzer et al., 2015). and Schmidt et al (Schmidt et al., 2017). investigated fundus autofluorescence lifetimes in diabetic patients.
Schweitzer et al (Schweitzer et al., 2015). compared the fluorescence lifetimes upon a 448 nm excitation for a group of 48 patients suffering from type two diabetes but no retinopathy with 48 healthy control subjects of same age. They found a general prolongation of the fundus autofluorescence lifetimes in diabetes. Using a three-exponential fit of the decay and a sophisticated statistical procedure, they revealed a good discrimination of both groups with a sensitivity of 73% and 70% as well as a specificity of 84% and 64% for the two spectral channels used in this study (490–560 nm and 560–700 nm) respectively for the mean fluorescence lifetime Tm. The best discrimination was achieved by the intermediate lifetime component T2 at 490–560 nm (sensitivity 84%, specificity 76%) which the authors addressed to fluorophores in the retina. They discuss this as a result of reduced protein binding of FAD as well as protein glycation leading to an accumulation of AGEs. In a subgroup analysis, they found a considerably better discrimination in phakic patients and controls as in pseudo-phakic. Thus, they concluded an influence of the lens fluorescence on the measurements at the fundus despite the use of confocal scanning due to the extremely strong fluorescence emission from the lens. As AGE accumulation in the lens is well known (Araki et al., 1992), this, in part, could account for the lifetimes measured in diabetics.
Schmidt et al. (Schmidt et al., 2017) extended this study to patients with diabetic retinopathy. They compared fluorescence lifetimes upon excitation at 468 nm in 34 patients suffering from non-proliferative diabetic retinopathy (NPDR) with that of 28 age matched healthy controls. Fluorescence lifetimes were recorded in the macular center as well as in two concentric rings given by the standard ETDRS grid from a three-exponential fit. Consistent with Schweitzer et al., they showed prolonged lifetimes in the patient group in all investigated retinal fields. This holds for both spectral channels, however was more pronounced at short wavelengths (498–560 nm, p ≤ 0.002) than for longer wavelengths (560–700 nm, p < 0.05). A ROC (receiver operating characteristic) analysis using a logistic regression model resulted in a sensitivity of 90% and a specificity of 71% for the discrimination of NPDR patients. In contrast to Schweitzer et al., Schmidt et al. found the best discrimination for the long-living fluorescence component T3 instead of T2. This might result from the longer excitation wavelength used. Again, the formation of AGEs in neurons, vascular, and glial cells was discussed as source of the extension of lifetimes. This was corroborated by FLIO measurements at the lenses of the subjects. These showed shorter lifetimes in the patients, again predominantly in the short wavelength channel. As AGE (bovine serum albumin incubated with glucose) showed a lifetime of 1.7 ns and an emission maximum of 523 nm (Schweitzer et al., 2004), (Schweitzer et al., 2007b) its accumulation must increase the physiologically shorter fundus autofluorescence lifetime, however decrease that of the lens, which is known to be longer in healthy state.
Taken together, investigations in diabetic patients indicated that FLIO has the potential to show protein glycation as well as alterations in coenzymes of the cellular energy metabolism associated with diabetes.
5.7. FLIO in central serous chorioretinopathy
Central serous chorioretinopathy (CSCR) is a macular disorder characterized by idiopathic subretinal fluid accumulation leading to a decrease of visual acuity, metamorphopsia and micropsia. It primarily affects males aged 40–51 years and is associated with the use of corticosteroids and intrinsic cortisone metabolism (Nicholson et al., 2013). This pathology affects both, the choroid and the retina (Daruich et al., 2015). In the acute phase, leakage of fluid through the retinal pigment epithelium leads to serous retinal detachment. Normally, the disease is self-limiting with spontaneous resorption of the fluid. However, in over 50% central serous chorioretinopathy can appear in a chronic form with persisting subretinal fluid of more than six months or in a chronic recurrent form with periodical reappearance of fluid (Nicholson et al., 2013). So far, the exact disease mechanisms remain an area of active investigation.
In a study of 35 patients (mean age 46 ± 6 years, range 29–53 years) FLIO was performed and lifetime values were analyzed in different stages of disease (Fig. 11) (Dysli et al., 2017). Thereby, in patients with reported onset of symptoms of less than six months, shorter fluorescence lifetimes were measured in affected areas compared to age matched healthy controls (Dysli et al., 2017). The presence or absence of subretinal fluid did not influence the values. However, the short lifetimes correlated with the presence of elongated outer segments of the photoreceptors (Dysli et al., 2017), possibly due to accumulation of bisretinoids (visual cycle byproducts) such as all-trans-retinal dimer, A2PE, A2-DHP-PE and A2-GPE (Sparrow et al., 2012) (Matsumoto et al., 2011). In physiological conditions, the adjacent RPE degrades the shed outer photoreceptor segments. Over time, the autofluorescence lifetime values prolong towards values of the unaffected retina (Dysli et al., 2017). However, in chronic disease stage, secondary retinal changes such as scar formation and retinal atrophy with loss of the RPE and the photoreceptor layer lead towards longer lifetime values compared to the mean autofluorescence lifetime value of the healthy retina. This correlates with data from FLIO measurements in AMD with geographic atrophy. There, longer lifetimes were seen in atrophic areas with absence of the RPE, and were assigned to fluorophores from connective tissue components such as collagen and elastin (Dysli et al., 2017).
5.8. FLIO in Stargardt disease
Stargardt disease is the most common hereditary retinal dystrophy. The leading symptom is a progressive reduction of the central visual acuity with onset in the second decade of life. The underlying pathology is a mutation in the ABCA4 gene, which codes for a receptor involved in the transport of vitamin A derivatives of the visual cycle within the outer segments of the photoreceptors. Due to this dysfunction, a progressive accumulation of byproducts of the visual cycle, such as lipofuscin occurs within the RPE (Lewis et al., 1999). The clinical manifestation varies widely due to a broad phenotypic heterogeneity associated with a large number of genetic sequence variants (Tanna et al., 2017). Typically, yellowish-white deposits appear on the posterior pole of the retina. In later stages, these deposits lead to a destruction of the RPE and the retinal layer structure, and finally result in retinal atrophy. In autofluorescence intensity measurements, the retinal deposits appear as hyperfluorescent spots compared to the surrounding retina, which in general features increased autofluorescence intensity as found by quantitative autofluorescence measurement (Burke et al., 2014). In later stages, reduced autofluorescence intensity in atrophic areas was found due to absence of the RPE cell layer (McBain et al., 2012).
In a study of 16 patients with Stargardt disease (mean age 40 ± 3 years, range 22–56 years) FLIO measurements were performed (Dysli et al., 2016b,c,d) (Fig. 12). Autofluorescence lifetimes within areas of normal retinal layer structure without deposits or atrophy was comparable to age matched healthy controls. Within hyper-fluorescent areas of retinal deposits corresponding to fundoscopically visible flecks, shorter and longer fluorescence lifetime values compared to the normal retina were observed. In follow-up examinations, flecks with initially short lifetimes were shown to change to longer lifetimes, indicating a change of composition of these deposits. By comparing in vivo data with ex vivo measurements of intermediate compounds from the visual cycle, the short autofluorescence lifetime might be assigned to retinaldehyde adducts and bisretinoid fluorophores located in degenerating photoreceptor cells (Sparrow et al., 2015), whereas longer lifetimes might originate from photooxidation and photodegradation products of A2E compounds. In individual cases, flecks with short fluorescence lifetimes were visible in FLIO before they appeared as hyper-fluorescent deposits in the autofluorescence intensity image.
Fig. 12.

Autofluorescence lifetimes in Stargardt disease. Retinal deposits with short and long fluorescence lifetimes are discernible and identifiable on the 2D distribution histogram. Fundus autofluorescence intensity (FAF), fluorescence lifetime (FLIO, LSC), OCT of the indicated green line in FAF image.
FLIO provides a promising method to screen and follow-up patients with Stargardt disease and to monitor disease progression. In late stage of disease, when retinal atrophy occurs, fluorescence lifetimes were prolonged in peripheral areas. However, within the macular center, remaining areas of short fluorescence lifetimes may persist. This confirms results from measurements in geographic atrophy due to dry age related macular degeneration and is most likely due to residual macular pigment.
By now, there is no therapy available for Stargardt disease. However, novel experimental approaches include replacement of vitamin A by deuterated vitamin A in order to inhibit vitamin A dimerization and thereby formation of abnormal high amounts of lipofuscin (Charbel Issa et al., 2015). First clinical studies are ongoing and FLIO might be helpful to detect and quantify therapeutic efforts.
5.9. FLIO in choroideremia
Choroideremia is a rare hereditary retinal disease, affecting mainly male subjects due to its X-linked inheritance pattern. This monogenetic retinal dystrophy is caused by defects in the CHM gene, which encodes Rab escort protein-1 (REP 1), a protein responsible for membrane trafficking in the retina and the RPE. Choroideremia features a distinct phenotype and leads to progressive degeneration of well-defined retinal layers such as the choroid, the RPE, and the neurosensory retina (Zinkernagel and MacLaren, 2015). Autofluorescence intensity measurement in choroideremia reveals distinctive patterns, whereby the area of remaining autofluorescence is inversely correlated with disease progression (Jolly et al., 2016).
Using FLIO, areas of intact RPE were identified and visualized by autofluorescence intensity measurement (Fig. 13) (Dysli et al., 2016b,c,d). Mainly due to the high content of lipofuscin, preserved RPE exhibited high level of autofluorescence compared to areas with RPE atrophy which appear dark in the intensity measurement. In a study of 16 eyes of eight patients (mean age 55 ± 13 years, range 32–70 years) with advanced choroideremia, fluorescence lifetime maps provided additional information in areas of RPE atrophy (Dysli et al., 2016c). In areas with absence of the RPE, regions with remaining photoreceptor layers in OCT were clearly identifiable and featured shorter fluorescence lifetimes compared to areas with combined RPE- and photoreceptor loss. These short lifetimes might origin from remaining visual cycle activity within the persisting photoreceptors segments with generation and accumulation of visual cycle by-products (e.g. all-trans-retinal dimers with short fluorescence lifetimes) (Goldberg et al., 2016).
Fig. 13.

Autofluorescence lifetimes in choroideremia. Hyperfluorescent areas in FAF correspond to remaining islands of RPE. Shorter fluorescence lifetimes correlate with areas of partially intact photoreceptor layer structure. Corresponding 2D histogram is shown.
Fundus autofluorescence intensity (FAF), fluorescence lifetime (FLIO, LSC), OCT of the indicated green line in FAF image.
In FLIO, retinal areas with complete chorioretinal atrophy featured the longest mean florescence lifetimes, and areas of intact retinal layer structure within the macular center featured the shortest lifetimes (Dysli et al., 2016c). In follow-up examinations, a decrease of short fluorescence lifetimes was correlated with disease progression and increase of chorioretinal atrophy (Dysli et al., 2016c). Using 2D correlations of the short decay component T1 versus the long component T2, distribution and borders of individual areas were clearly separable (Dysli et al., 2016c).
6. FLIO in mouse models
With the development and presence of numerous animal models for nearly all ophthalmic and systemic diseases and conditions, in vivo imaging in animal models has become more and more important within the last decades. Animal models are used to mimic various diseases in order to investigate the pathophysiological pathways involved, the natural course of disease, and potential therapeutic interventions. Therefore, ophthalmic imaging techniques such as OCT, fluorescein angiography, and autofluorescence intensity measurement were adapted and modified for retinal imaging in small rodents.
We adapted the FLIO technique for the use in mice and described retinal fluorescence lifetimes in pigmented C57BL/6 and albino BALBc mice. Fluorescence lifetimes were shown to be shorter in non-pigmented retinae compared to C57BL/6 mice (Fig. 14) (Dysli et al., 2014a; Dysli et al., 2016a). Possibly, retinal melanin might contribute to longer fluorescence lifetimes in pigmented mice. In the short spectral channel, fluorescence lifetimes in the murine retina were on average 800–950 ps and therefore significantly longer than those observed in the human retina and significantly longer than the lifetime values reported for lipofuscin (390 ps). In the long spectral channel, similar values were measured. Over the observational period of seven months, in all mouse models a trend towards shorter lifetimes was observed in both spectral channels. A possible explanation is that over time and with progressive accumulation of retinal fluorophores, such as lipofuscin, the mean lifetime shortens in the murine retina and prolongs in human eyes, and thereby approaches similar values. In contrast to the human retina, murine retinal vessels featured significantly shorter lifetime values compared to the surrounding retina.
Fig. 14.

Autofluorescence lifetimes in mice. Fundus autofluorescence intensity (FAF) and lifetime maps (FLIO) of pigmented C57BL/6 mice (A) and non pigmented BALBc mice (B) (short spectral channel). Note the different color range (500–1400 ps).
In a mouse model of slow retinal degeneration (short RDS, C3A.Cg-Pde6b+Prph2Rd2/J) there was a marked variance of lifetime values in animals within the same age group. RDS mice feature a slow degeneration of the outer nuclear layer, primarily the rod, followed by the cone cells, and finally degeneration of all retinal layers including the retinal pigment epithelium (Schalken et al., 1990; Dysli et al., 2014a). In this model, patchy changes of retinal lifetime values were observed, resulting most likely from different stages of degeneration within the same retina.
In order to investigate the contribution of individual retinal layers to the measured autofluorescence lifetime, pharmacological degeneration of specific layers was induced in C57BL/6 mice (Dysli et al., 2014a; Dysli et al., 2016a). A well suited model to study the influence of individual retinal layers is the sodium iodate (NaIO3) induced model of retinal degeneration, which primarily leads to degeneration of the RPE, followed by subsequent loss of photoreceptors. Over the experiment duration of one month, a prolongation of retinal autofluorescence lifetimes was observed. In another model, N-methyl-N-nitrosourea (MNU) was used for specific ablation of the photoreceptor cell layer with preservation of the RPE. Here, a shortening of the mean autofluorescence lifetime values was observed. Short autofluorescence lifetimes in the murine retina may mainly originate from the RPE and may be influenced by the neurosensory retina leading to shorter or longer autofluorescence lifetimes. In case of photoreceptor degeneration, the contribution of short fluorescence lifetimes from the RPE is increased, probably due to missing attenuation of overlying photoreceptors and/or due to increased RPE activity caused by additional cell debris from degenerating photoreceptors. On the other hand, if the RPE is destroyed, metabolic activity of this layer is also extinct and long fluorescence lifetimes from other layers such as the choroid or the inner retinal layers might dominate the measured mean fluorescence lifetime.
Overall, fluorescence lifetime imaging in mouse models provides an interesting tool to record and investigate metabolic changes in specific and well defined metabolic or genetic conditions.
7. Conclusion and future directions
Autofluorescence lifetime imaging ophthalmology is a novel imaging technology which provides additional insights into metabolic processes of the retina. As illustrated in this review, FLIO is based on measurement of decay times of intrinsic fluorescence. Fluorescence lifetime imaging in ophthalmology has been shown to be highly reproducible and provides distinct and specific information for different retinal diseases.
In combination with common standard imaging techniques such as color fundus photography and optical coherence tomography, the FLIO technique provides additional information on structural alterations in retinal diseases. Various applications of FLIO measurements are summarized in this review, ranging from vascular disorders over degenerative diseases and age related changes to hereditary retinal diseases. Retinal autofluorescence lifetime images and individual lifetime values can be analyzed both, in a qualitative and quantitative way. Basic information is provided in the mean lifetime value Tm, representing the amplitude weighted mean fluorescence lifetime value. Tm is currently regarded as the main outcome parameter in FLIO, representing the most important lifetime information. The color coded Tm histograms of fluorescence lifetime measurements provide an easy overview of lifetime changes in the retina. However, analysis of individual lifetime components and 2D histograms are more complex to analyze and at this stage probably not suitable for everyday clinical use. Additionally, the technique allows for refined analysis and visualization of individual lifetime components depending on the scientific question. Follow-up examinations as well as versatile opportunities to analyze, investigate, and present the acquired lifetime data enable further clinical and research opportunities.
FLIO measurement of single compounds, solutions, cell cultures and mouse models might provide essential information for dissecting the fraction of individual fluorophores within the obtained fluorescence lifetime signal.
Currently, the provided information is based on individual pilot studies. Further studies will refine and expand the current knowledge, and investigate subtle retinal changes over time in order to identify fluorescence lifetime biomarkers for retinal disease. Similar to fundus autofluorescence intensity imaging, FLIO is mainly a qualitative imaging procedure. However, as shown in this review, it has the potential to be analyzed quantitatively using the fluorescence lifetime values. This enables and facilitates standardized imaging procedure for data comparison between individual subjects, diseases and for follow-up examinations over time. Additional efforts in expanded translational possibilities from in vitro to in vivo will further improve the understanding of retinal autofluorescence lifetimes in physiological conditions and metabolic changes. It is important to be aware of certain limitations when using this technique. Despite the confocality of the FLIO system, the lifetime signal obtained in any given pixel represents a bulk signal from various adjacent fluorophores. Additionally, contribution of components from other structures such as the cornea and the lens cannot be entirely excluded. Furthermore, as with other imaging modalities, there is a certain degree of variation between individual subjects and variation with age.
In future applications FLIO might serve as a tool for visualization of early retinal changes in hereditary retinal dystrophies as shown for Stargardt disease and choroideremia, and therefore may be invaluable to test novel therapeutic approaches such as gene therapy. In addition, follow-up examinations with FLIO in hereditary as well as degenerative retinal diseases such as dry age-related macular degeneration could provide information on therapeutic effects in respective trials. Further studies will show the value of this method for detection of early systemic metabolic conditions such as elevated blood glucoses like in pre-diabetic conditions, dyslipidemia and neurodegenerative diseases by analysis of the retinal autofluorescence lifetimes.
For future approaches, the basic FLIO device might be refined and could include adjustable autofluorescence excitation wavelengths and range of detection for emitted fluorescence. Thereby individual fluorophores could be addressed more specifically. Also analysis of the registered fluorescence lifetimes could be refined and interpretation could be standardized and automated.
Supplementary Material
Supplementary Figure 1: Structures of common autofluorophores in the retina and neighboring tissue.
Supplementary Figure 2: Correlation of two versus three exponential decay fit in the short and the long spectral channel (Dysli et al., 2014b).
Acknowledgments
The fluorescence lifetime imaging ophthalmoscope is kindly provided and supported by Heidelberg Engineering (Heidelberg, Germany). Thereby we especially mention Dr. Y. Katayama, Dr. J. Fischer and Dr. K. Nahen. The sponsor or funding organization had no role in the design or conduct of this research. The authors thank the ARTORG Center for Biomedical Engineering Research - Ophthalmic Technology (Bern, Switzerland) for developing and providing the FLIO reader and M. Klemm (Ilmenau, Germany) for developing and providing the FLIMX software. The authors also thank Dr. F. Delori (Boston, USA) as well as all participants, patients, coauthors and contributors to the reported studies.
Financial support
This work was supported by a grant of the Swiss National Science Foundation (#320030_156019, MZ) and the National Cancer Institute/National Institutes of Health (CA198419 (MB)). The sponsor or funding organization had no role in the design or conduct of this research.
Footnotes
Conflict of interest
Chantal Dysli: Heidelberg Engineering (nonfinancial); Sebastian Wolf: Heidelberg Engineering (nonfinancial); Mikhail Berezin: none; Lydia Sauer: Heidelberg Engineering (nonfinancial); Martin Hammer: Heidelberg Engineering (patent, nonfinancial); Martin S. Zinkernagel: Heidelberg Engineering (nonfinancial).
Appendix A. Supplementary data
Supplementary data related to this article can be found at http://dx.doi.org/10.1016/j.preteyeres.2017.06.005.
References
- Alexiev U, Farrens DL, 2014. Fluorescence spectroscopy of rhodopsins: insights and approaches. Biochimica Biophysica Acta (BBA) - Bioenergetics 1837 (5), 694–709. [DOI] [PMC free article] [PubMed] [Google Scholar]
- Andersson PO, Gillbro T, 1995. Photophysics and dynamics of the lowest excited singlet-state in long substituted polyenes with implications to the very long-chain limit. J. Chem. Phys 103 (7), 2509–2519. [Google Scholar]
- ANSI, L.I. o. A., 2007. ANSI Z136.1—2007 American National Standard for Safe Use of Lasers. [Google Scholar]
- Araki N, Ueno N, Chakrabarti B, Morino Y, Horiuchi S, 1992. Immunochemical evidence for the presence of advanced glycation end products in human lens proteins and its positive correlation with aging. J. Biol. Chem 267 (15), 10211–10214. [PubMed] [Google Scholar]
- Ashikawa I, Nishimura Y, Tsuboi M, Watanabe K, Iso K, 1982. Lifetime of tyrosine fluorescence in nucleosome core particles. J. Biochem 91 (6), 2047–2055. [DOI] [PubMed] [Google Scholar]
- Bachilo SM, Gillbro T, 1999. Fluorescence of retinal schiff base in alcohols. J. Phys. Chem. A 103 (15), 2481–2488. [Google Scholar]
- Barber AJ, Gardner TW, Abcouwer SF, 2011. The significance of vascular and neural apoptosis to the pathology of diabetic retinopathy. Invest Ophthalmol. Vis. Sci 52 (2), 1156–1163. [DOI] [PMC free article] [PubMed] [Google Scholar]
- Barker FM 2nd, Snodderly DM, Johnson EJ, Schalch W, Koepcke W, Gerss J, Neuringer M, 2011. Nutritional manipulation of primate retinas, V: effects of lutein, zeaxanthin, and n-3 fatty acids on retinal sensitivity to blue-light-induced damage. Invest Ophthalmol. Vis. Sci 52 (7), 3934–3942. [DOI] [PMC free article] [PubMed] [Google Scholar]
- Barrett GC, Elmore DT, 1998. Amino Acids and Peptides. Cambridge University Press, Cambridge; New York. [Google Scholar]
- Becker W, 2005. Advanced Time-correlated Single Photon Counting Techniques. Springer, Berlin; New York. [Google Scholar]
- Becker W, 2008. The Bh TCSPC Handbook. Becker & Hickl Gmbh. [Google Scholar]
- Becker W, 2012. Fluorescence lifetime imaging-techniques and applications. J. Microsc 247 (2), 119–136. [DOI] [PubMed] [Google Scholar]
- Becker W, Bergmann A, 2003. Lifetime Imaging Techniques for Optical Microscopy Technical report. Becker & Hickl GmbH. [Google Scholar]
- Becker W, Shcheslavsky V, 2016. TCSPC FLIM in the Wavelength Range from 800 Nm to 1700 Nm (Conference Presentation). [Google Scholar]
- Berezin MY, Achilefu S, 2010. Fluorescence lifetime measurements and biological imaging. Chem. Rev 110 (5), 2641–2684. [DOI] [PMC free article] [PubMed] [Google Scholar]
- Bernstein PS, Li B, Vachali PP, Gorusupudi A, Shyam R, Henriksen BS, Nolan JM, 2016. Lutein, zeaxanthin, and meso-zeaxanthin: the basic and clinical science underlying carotenoid-based nutritional interventions against ocular disease. Prog. Retin Eye Res 50, 34–66. [DOI] [PMC free article] [PubMed] [Google Scholar]
- Bertolotto M, Borgia L, Iester M, 2014. Hyperautofluorescence in outer retinal layers thinning. Biomed. Res. Int 2014, 741538. [DOI] [PMC free article] [PubMed] [Google Scholar]
- Bhosale P, Li B, Sharifzadeh M, Gellermann W, Frederick JM, Tsuchida K, Bernstein PS, 2009a. Purification and partial characterization of a lutein-binding protein from human retina. Biochemistry 48 (22), 4798–480 . [DOI] [PubMed] [Google Scholar]
- Bhosale P, Serban B, Bernstein PS, 2009b. Retinal carotenoids can attenuate formation of A2E in the retinal pigment epithelium. Archives Biochem. Biophysics 483 (2), 175–181. [DOI] [PMC free article] [PubMed] [Google Scholar]
- Bindewald A, Bird AC, Dandekar SS, Dolar-Szczasny J, Dreyhaupt J, Fitzke FW, Einbock W, Holz FG, Jorzik JJ, Keilhauer C, Lois N, Mlynski J, Pauleikhoff D, Staurenghi G, Wolf S, 2005. Classification of fundus autofluorescence patterns in early age-related macular disease. Invest Ophthalmol. Vis. Sci 46 (9), 3309–3314. [DOI] [PubMed] [Google Scholar]
- Blinova K, Carroll S, Bose S, Smirnov AV, Harvey JJ, Knutson JR, Balaban RS, 2005. Distribution of mitochondrial NADH fluorescence lifetimes: steady-state kinetics of matrix NADH interactions. Biochemistry 44 (7), 2585–2594. [DOI] [PubMed] [Google Scholar]
- Bone RA, Landrum JT, Cains A, 1992. Optical density spectra of the macular pigment in vivo and in vitro. Vis. Res 32 (1), 105–110. [DOI] [PubMed] [Google Scholar]
- Bonne C, Muller A, Villain M, 1998. Free radicals in retinal ischemia. Gen. Phar-macol 30 (3), 275–280. [DOI] [PubMed] [Google Scholar]
- Bowes Rickman C, Farsiu S, Toth CA, Klingeborn M, 2013. Dry age-related macular degeneration: mechanisms, therapeutic targets, and imaging. Invest Ophthalmol. Vis. Sci 54 (14), ORSF68–80. [DOI] [PMC free article] [PubMed] [Google Scholar]
- Burke TR, Duncker T, Woods RL, Greenberg JP, Zernant J, Tsang SH, Smith RT, Allikmets R, Sparrow JR, Delori FC, 2014. Quantitative fundus autofluorescence in recessive Stargardt disease. Invest Ophthalmol. Vis. Sci 55 (5), 2841–2852. [DOI] [PMC free article] [PubMed] [Google Scholar]
- Charbel Issa P, Barnard AR, Herrmann P, Washington I, MacLaren RE, 2015. Rescue of the Stargardt phenotype in Abca4 knockout mice through inhibition of vitamin A dimerization. Proc. Natl. Acad. Sci. U. S. A 112 (27), 8415–8420. [DOI] [PMC free article] [PubMed] [Google Scholar]
- Chen K, Weiland JD, 2014. Discovery of retinal elastin and its possible role in age-related macular degeneration. Ann. Biomed. Eng 42 (3), 678–684. [DOI] [PubMed] [Google Scholar]
- Chen RF, 1967. Fluorescence quantum yields of tryptophan and tyrosine. Anal. Lett 1 (1), 35–42. [Google Scholar]
- Cogan DG, Kuwabara T, 1963. Capillary shunts in the pathogenesis of diabetic retinopathy. Diabetes 12, 293–300. [DOI] [PubMed] [Google Scholar]
- Cosgrove SA, Guite MA, Burnell TB, Christensen RL, 1990. Electronic relaxation in long polyenes. J. Phys. Chem 94 (21), 8118–8124. [Google Scholar]
- Daruich A, Matet A, Dirani A, Bousquet E, Zhao M, Farman N, Jaisser F, Behar-Cohen F, 2015. Central serous chorioretinopathy: recent findings and new physiopathology hypothesis. Prog. Retin Eye Res 48, 82–118. [DOI] [PubMed] [Google Scholar]
- De Jong CJ, Lajevardipour A, Gecevicius M, Beresna M, Gervinskas G, Kazansky PG, Bellouard Y, Clayton AH, Juodkazis S, 2015. Deep-UV fluorescence lifetime imaging microscopy. Photonics Res. 3 (5), 283–288. [Google Scholar]
- de la Maza MP, Garrido F, Escalante N, Leiva L, Barrera G, Schnitzler S, Zanolli M, Verdaguer J, Hirsch S, Jara N, Bunout D, 2012. Fluorescent advanced glycation end-products (ages) detected by spectro-photofluorimetry, as a screening tool to detect diabetic microvascular complications. J. Diabetes Mellitus 2 (2), 221–226. [Google Scholar]
- Decoster B, Christensen RL, Gebhard R, Lugtenburg J, Farhoosh R, Frank HA, 1992. Low-lying electronic states of carotenoids. Biochimica Biophysica Acta 1102 (1), 107–114. [DOI] [PubMed] [Google Scholar]
- Delori FC, 1994. Spectrometer for noninvasive measurement of intrinsic fluorescence and reflectance of ocular fundus. Appl. Opt 33 (31), 7439–7452. [DOI] [PubMed] [Google Scholar]
- Delori FC, 2004. Autofluorescence method to measure macular pigment optical densities fluorometry and autofluorescence imaging. Arch. Biochem. Biophys 430 (2), 156–162. [DOI] [PubMed] [Google Scholar]
- Delori FC, Dorey CK, Staurenghi G, Arend O, Goger DG, Weiter JJ, 1995. In vivo fluorescence of the ocular fundus exhibits retinal pigment epithelium lipofuscin characteristics. Invest Ophthalmol. Vis. Sci 36 (3), 718–729. [PubMed] [Google Scholar]
- Delori FC, Goger DG, Hammond BR, Snodderly DM, Burns SA, 2001. Macular pigment density measured by autofluorescence spectrometry: comparison with reflectometry and heterochromatic flicker photometry. J. Opt. Soc. Am. A Opt. Image Sci. Vis 18 (6), 1212–1230. [DOI] [PubMed] [Google Scholar]
- Digman MA, Caiolfa VR, Zamai M, Gratton E, 2008. The phasor approach to fluorescence lifetime imaging analysis. Biophysical J. 94 (2), L14–L16. [DOI] [PMC free article] [PubMed] [Google Scholar]
- Dillon J, Zheng L, Merriam JC, Gaillard ER, 2000. Transmission spectra of light to the mammalian retina. Photochem Photobiol. 71 (2), 225–229. [DOI] [PubMed] [Google Scholar]
- Doukas AG, Junnarkar MR, Alfano RR, Callender RH, Kakitani T, Honig B, 1984. Fluorescence quantum yield of visual pigments: evidence for subpico-second isomerization rates. Proc. Natl. Acad. Sci. U. S. A 81 (15I), 4790–4794. [DOI] [PMC free article] [PubMed] [Google Scholar]
- Dysli C, Berger L, Wolf S, Zinkernagel MS, 2017. Fundus autofluorescence lifetimes and central serous chorioretinopathy. Retina. 10.1097/IAE.0000000000001452 [DOI] [PMC free article] [PubMed] [Google Scholar]
- Dysli C, Dysli M, Enzmann V, Wolf S, Zinkernagel MS, 2014a. Fluorescence lifetime imaging of the ocular fundus in mice. Invest Ophthalmol. Vis. Sci 55 (11), 7206–7215. [DOI] [PubMed] [Google Scholar]
- Dysli C, Dysli M, Zinkernagel MS, Enzmann V, 2016a. Effect of pharmacologi-cally induced retinal degeneration on retinal autofluorescence lifetimes in mice. Exp. Eye Res 153, 178–185. [DOI] [PubMed] [Google Scholar]
- Dysli C, Quellec G, Abegg M, Menke MN, Wolf-Schnurrbusch U, Kowal J, Blatz J, La Schiazza O, Leichtle AB, Wolf S, Zinkernagel MS, 2014b. Quantitative analysis of fluorescence lifetime measurements of the macula using the fluorescence lifetime imaging ophthalmoscope in healthy subjects. Invest Ophthalmol. Vis. Sci 55 (4), 2106–2113. [DOI] [PubMed] [Google Scholar]
- Dysli C, Wolf S, Hatz K, Zinkernagel MS, 2016b. Fluorescence lifetime imaging in Stargardt disease: potential marker for disease progression. Invest Ophthalmol. Vis. Sci 57 (3), 832–841. [DOI] [PubMed] [Google Scholar]
- Dysli C, Wolf S, Tran HV, Zinkernagel MS, 2016c. Autofluorescence lifetimes in patients with choroideremia identify photoreceptors in areas with retinal pigment epithelium atrophy. Invest Ophthalmol. Vis. Sci 57 (15), 6714–6721. [DOI] [PubMed] [Google Scholar]
- Dysli C, Wolf S, Zinkernagel MS, 2015. Fluorescence lifetime imaging in retinal artery occlusion. Invest Ophthalmol. Vis. Sci 56 (5), 3329–3336. [DOI] [PubMed] [Google Scholar]
- Dysli C, Wolf S, Zinkernagel MS, 2016d. Autofluorescence lifetimes in geographic atrophy in patients with age-related macular degeneration. Invest Ophthalmol. Vis. Sci 57 (6), 2479–2487. [DOI] [PubMed] [Google Scholar]
- Dysli C, Wolf S, Zinkernagel MS 2016e. unpublished data. [Google Scholar]
- Ehlers A, Riemann I, Stark M, König K, 2007. Multiphoton fluorescence lifetime imaging of human hair. Microsc. Res. Tech 70 (2), 154–161. [DOI] [PubMed] [Google Scholar]
- Ermakov IV, Ermakova MR, Gellermann W, 2005. Simple Raman instrument for in vivo detection of macular pigments. Appl. Spectrosc 59 (7), 861–867. [DOI] [PMC free article] [PubMed] [Google Scholar]
- Estrada AD, Dunn AK, 2010. Improved sensitivity for two-photon frequency-domain lifetime measurement. Opt. express 18 (13), 13631–13639. [DOI] [PubMed] [Google Scholar]
- Ezra E, Munro PM, Charteris DG, Aylward WG, Luthert PJ, Gregor ZJ, 1997. Macular hole opercula. Ultrastructural features and clinicopathological correlation. Arch. Ophthalmol 115 (11), 1381–138 . [DOI] [PubMed] [Google Scholar]
- Fishkin N, Pescitelli G, Sparrow JR, Nakanishi K, Berova N, 2004. Absolute configurational determination of an all-trans-retinal dimer isolated from photoreceptor outer segments. Chirality 16 (9), 637–641. [DOI] [PubMed] [Google Scholar]
- Fishkin NE, Sparrow JR, Allikmets R, Nakanishi K, 2005. Isolation and characterization of a retinal pigment epithelial cell fluorophore: an all-trans-retinal dimer conjugate. Proc. Natl. Acad. Sci. U. S. A 102 (20), 7091–7096. [DOI] [PMC free article] [PubMed] [Google Scholar]
- Forest SE, Lam WC, Millar DP, Nofsinger JB, Simon JD, 2000. A model for the activated energy transfer within eumelanin aggregates. J. Phys. Chem. B 104 (4), 811–814. [Google Scholar]
- Gallas JM, Eisner M, 1987. Fluorescence of melanin-dependence upon excitation wavelength and concentration. Photochem. Photobiol 45 (5), 595–600. [Google Scholar]
- Gass JD, Van Newkirk M, 1992. Xanthic scotoma and yellow foveolar shadow caused by a pseudo-operculum after vitreofoveal separation. Retina 12 (3), 242–244. [DOI] [PubMed] [Google Scholar]
- Gaviola E, 1926. The decay-time of dye stuff fluorescence. Ann. Phys 8. [Google Scholar]
- Gersbach M, Trimananda R, Maruyama Y, Fishburn M, Stoppa D, Richardson J, Walker R, Henderson R, Charbon E, 2010. Proc. SPIE, Detectors and Imaging Devices: Infrared, Focal Plane, Single Photon, 77801H. High frame-rate TCSPC-FLIM using a novel SPAD-based image sensor, 7780. [Google Scholar]
- Gibbs D, Cideciyan AV, Jacobson SG, Williams DS, 2009. Retinal pigment epithelium defects in humans and mice with mutations in MYO7A: imaging melanosome-specific autofluorescence. Investigative Ophthalmol. Vis. Sci 50 (9), 4386–4393. [DOI] [PMC free article] [PubMed] [Google Scholar]
- Goldberg AF, Moritz OL, Williams DS, 2016. Molecular basis for photoreceptor outer segment architecture. Prog. Retin Eye Res 55, 52–81. [DOI] [PMC free article] [PubMed] [Google Scholar]
- Gottling PF, 1923. Determination of the time between excitation and emission for certain fluorescent solids. Phys. Rev 22. [Google Scholar]
- Gratton E, Breusegem S, Sutin J, Ruan Q, Barry N, 2003. Fluorescence Lifetime Imaging for the Two-photon Microscope: Time-domain and Frequency-domain Methods. [DOI] [PubMed] [Google Scholar]
- Greenberg JP, Duncker T, Woods RL, Smith RT, Sparrow JR, Delori FC, 2013. Quantitative fundus autofluorescence in healthy eyes. Invest Ophthalmol. Vis. Sci 54 (8), 5684–5693. [DOI] [PMC free article] [PubMed] [Google Scholar]
- Gruszecki WI, Zelent B, Leblanc RM, 1990. Fluorescence of zeaxanthin and violaxanthin in aggregated forms. Chem. Phys. Lett 171 (5–6), 563–568. [Google Scholar]
- Guo K, Achilefu S, Berezin MY, 2012. Dating bloodstains with fluorescence lifetime measurements. Chem. – A Eur. J 18 (5), 1303–1305. [DOI] [PMC free article] [PubMed] [Google Scholar]
- Guo K, Zhegalova N, Achilefu S, Berezin MY, 2013. Bloodstain Age Analysis: toward Solid State Fluorescent Lifetime Measurements. [Google Scholar]
- Hammer M, Quick S, Klemm M, Schenke S, Mata N, Eitner A, Schweitzer D, 2009. In-vivo and in-vitro investigations of retinal fluorophores in age –related macular degeneration by fluorescence lifetime imaging. 10.1117/12.807943 Proc. SPIE, Multiphoton Microscopy in the Biomedical Sciences IX, 71832S. [DOI] [Google Scholar]
- Han M, Giese G, Bille JF, 2005. “Second harmonic generation imaging of collagen fibrils in cornea and sclera.”. Opt. Express 13 (15), 5791–5797. [DOI] [PubMed] [Google Scholar]
- Han M, et al. , 2007. Age-related structural abnormalities in the human retina-choroid complex revealed by two-photon excited autofluorescence imaging. J. Biomed. Optic 12 (2), 024012–024012-7. [DOI] [PubMed] [Google Scholar]
- Han X, Lui H, McLean DI, Zeng H, 2009. Near-infrared autofluorescence imaging of cutaneous melanins and human skin in vivo. J. Biomed. Opt 14 (2), 02401. [DOI] [PubMed] [Google Scholar]
- Hayreh SS, Zimmerman MB, 2005. Central retinal artery occlusion: visual outcome. Am. J. Ophthalmol 140 (3), 376–39. [DOI] [PubMed] [Google Scholar]
- Heikal AA, 2010. Intracellular coenzymes as natural biomarkers for metabolic activities and mitochondrial anomalies. Biomark. Med 4 (2), 241–263. [DOI] [PMC free article] [PubMed] [Google Scholar]
- Holz FG, Strauss EC, Schmitz-Valckenberg S, van Lookeren Campagne M, 2014. Geographic atrophy: clinical features and potential therapeutic approaches. Ophthalmology 121 (5), 1079–1091. [DOI] [PubMed] [Google Scholar]
- Huang Z, Zeng H, Hamzavi I, Alajlan A, Tan E, McLean DI, Lui H, 2006. Cutaneous melanin exhibiting fluorescence emission under near-infrared light excitation. J. Biomed. Opt 11 (3), 034010–034016. [DOI] [PubMed] [Google Scholar]
- IEC, 2014. IEC International Electrotechnical Commission. Standard 60825–1:2007 (Edition 2, ISBN 2-8318-9085-3), third ed. ISBN 978-2-8322-1499-2. [Google Scholar]
- Ishikawa-Ankerhold HC, Ankerhold R, Drummen GP, 2012. Advanced fluorescence microscopy techniques–FRAP, FLIP, FLAP, FRET and FLIM. Molecules 17 (4), 4047–4132. [DOI] [PMC free article] [PubMed] [Google Scholar]
- Ito S, 1986. Reexamination of the structure of eumelanin. Gen. Subj Biochim. Biophys. Acta 883 (1), 155–161. [DOI] [PubMed] [Google Scholar]
- Jo JA, Fang Q, Papaioannou T, Baker JD, Dorafshar AH, Reil T, Qiao JH, Fishbein MC, Freischlag JA, Marcu L, 2006. Laguerre-based method for analysis of time-resolved fluorescence data: application to in-vivo characterization and diagnosis of atherosclerotic lesions. J. Biomed. Opt 11 (2), 021004. [DOI] [PMC free article] [PubMed] [Google Scholar]
- Johnson EJ, Neuringer M, Russell RM, Schalch W, Snodderly DM, 2005. Nutritional manipulation of primate retinas, III: effects of lutein or zeaxanthin supplementation on adipose tissue and retina of xanthophyll-free monkeys. Invest Ophthalmol. Vis. Sci 46 (2), 692–702. [DOI] [PubMed] [Google Scholar]
- Jolly JK, Edwards TL, Moules J, Groppe M, Downes SM, MacLaren RE, 2016. A qualitative and quantitative assessment of fundus autofluorescence patterns in patients with choroideremia. Invest Ophthalmol. Vis. Sci 57 (10), 4498–4503. [DOI] [PMC free article] [PubMed] [Google Scholar]
- Kandori H, Sasabe H, Mimuro M, 1994. Direct determination of a lifetime of the S2 state of beta-carotene by femtosecond time-resolved fluorescence spectroscopy. J. Am. Chem. Soc 116 (6), 2671–2672. [Google Scholar]
- Kao Y-T, Saxena C, He T-F, Guo L, Wang L, Sancar A, Zhong D, 2008. Ultrafast dynamics of flavins in five redox states. J. Am. Chem. Soc 130 (39), 13132–13139. [DOI] [PMC free article] [PubMed] [Google Scholar]
- Kayatz P, Thumann G, Luther TT, Jordan JF, Bartz-Schmidt KU, Esser PJ, Schraermeyer U, 2001. Oxidation causes melanin fluorescence. Invest Ophthalmol. Vis. Sci 42 (1), 241–246. [PubMed] [Google Scholar]
- Keilhauer CN, Delori FC, 2006. Near-infrared autofluorescence imaging of the fundus: visualization of ocular melanin. Invest Ophthalmol. Vis. Sci 47 (8), 3556–3564. [DOI] [PubMed] [Google Scholar]
- Khan KN, Mahroo OA, Khan RS, Mohamed MD, McKibbin M, Bird A, Michaelides M, Tufail A, Moore AT, 2016. Differentiating drusen: drusen and drusen-like appearances associated with ageing, age-related macular degeneration, inherited eye disease and other pathological processes. Prog. Retin Eye Res 53, 70–106. [DOI] [PubMed] [Google Scholar]
- Kierdaszuk B, Malak H, Gryczynski I, Callis P, Lakowicz JR, 1996. Fluorescence of reduced nicotinamides using one- and two-photon excitation. Biophys. Chem 62 (1—3), 1–13. [DOI] [PubMed] [Google Scholar]
- Klemm M, Schweitzer D, Peters S, Sauer L, Hammer M, Haueisen J, 2015. FLIMX: a software package to determine and analyze the fluorescence lifetime in time-resolved fluorescence data from the human eye. PLoS One 10 (7), e0131640. [DOI] [PMC free article] [PubMed] [Google Scholar]
- Kolb H, 2007. Gross Anatomy of the Eye. [PubMed] [Google Scholar]
- König K, 2008. Clinical multiphoton tomography. J. Biophot 1(1), 13–23. [DOI] [PubMed] [Google Scholar]
- Koziol B, Markowicz M, Kruk J, Plytycz B, 2006. Riboflavin as a source of autofluorescence in Eisenia fetida coelomocytes. Photochem Photobiol. 82 (2), 570–573. [DOI] [PubMed] [Google Scholar]
- Krinsky NI, 2002. Possible biologic mechanisms for a protective role of xanthophylls. J. Nutr 132 (3), 540S–542S. [DOI] [PubMed] [Google Scholar]
- Kuriyama H, Waki M, Nakagawa M, Tsuda M, 2001. Involvement of oxygen free radicals in experimental retinal ischemia and the selective vulnerability of retinal damage. Ophthalmic Res. 33 (4), 196–202. [DOI] [PubMed] [Google Scholar]
- Lakowicz JR, Szmacinski H, Nowaczyk K, Johnson ML, 1992. Fluorescence lifetime imaging of free and protein-bound NADH. Proc. Natl. Acad. Sci. U. S. A 89 (4), 1271–1275. [DOI] [PMC free article] [PubMed] [Google Scholar]
- Lamb LE, Ye T, Haralampus-Grynaviski NM, Williams TR, Pawlak A, Sarna T, Simon JD, 2001. Primary photophysical properties of A2E in solution. J. Phys. Chem. B 105 (46), 11507–11512. [Google Scholar]
- Landrum JT, Bone RA, 2001. Lutein, zeaxanthin, and the macular pigment. Arch. Biochem. Biophys 385 (1), 28–40. [DOI] [PubMed] [Google Scholar]
- Lee KCB, Siegel J, Webb SED, Leveque-Fort S, Cole MJ, Jones R, Dowling K, Lever MJ, French PMW, 2001. Application of the stretched exponential function to fluorescence lifetime imaging. Biophysical J. 81 (3), 1265–1274. [DOI] [PMC free article] [PubMed] [Google Scholar]
- Leskovar B, Lo CC, Hartig PR, Sauer K, 1976. Photon-counting system for subnanosecond fluorescence lifetime measurements. Rev. Sci. Instrum 47 (9), 1113–1121. [DOI] [PubMed] [Google Scholar]
- Leung IY, Sandstrom MM, Zucker CL, Neuringer M, Max Snodderly D, 2005. Nutritional manipulation of primate retinas. IV. Effects of n–3 fatty acids, lutein, and zeaxanthin on S-cones and rods in the foveal region. Exp. Eye Res 81 (5), 513–529. [DOI] [PubMed] [Google Scholar]
- Lewis C, Ware WR, Doemeny LJ, Nemzek TL, 1973. Measurement of short-lived fluorescence decay using single photon-counting method. Rev. Sci. Instrum 44 (2), 107–114. [Google Scholar]
- Lewis RA, Shroyer NF, Singh N, Allikmets R, Hutchinson A, Li Y, Lupski JR, Leppert M, Dean M, 1999. Genotype/Phenotype analysis of a photoreceptor-specific ATP-binding cassette transporter gene, ABCR, in Stargardt disease. Am. J. Hum. Genet 64 (2), 422–434. [DOI] [PMC free article] [PubMed] [Google Scholar]
- Lima VC, Rosen RB, Farah M, 2016. Macular pigment in retinal health and disease. Int. J. Retina Vitr 2,19. [DOI] [PMC free article] [PubMed] [Google Scholar]
- Maarek JM, Marcu L, Snyder WJ, Grundfest WS, 2000. Time-resolved fluorescence spectra of arterial fluorescent compounds: reconstruction with the Laguerre expansion technique. Photochem. Photobiol 71 (2), 178–187. [DOI] [PubMed] [Google Scholar]
- Maskevich AA, Artsukevich IM, Stepuro VI, 1997. Fluorescent properties of the alcohol oxidase prostethic group and their relationship to the functional state of proteins. J. Mol. Struct 408–409, 261–264. [Google Scholar]
- Mathew R, Papavasileiou E, Sivaprasad S, 2010. Autofluorescence and high-definition optical coherence tomography of retinal artery occlusions. Clin. Ophthalmol 4, 1159–1163. [DOI] [PMC free article] [PubMed] [Google Scholar]
- Matsumoto H, Kishi S, Sato T, Mukai R, 2011. Fundus autofluorescence of elongated photoreceptor outer segments in central serous chorioretinopathy. Am. J. Ophthalmol 151 (4), 617–623 e61. [DOI] [PubMed] [Google Scholar]
- McBain VA, Townend J, Lois N, 2012. Progression of retinal pigment epithelial atrophy in Stargardt disease. Am. J. Ophthalmol 154 (1), 146–154. [DOI] [PubMed] [Google Scholar]
- McGuinness CD, Macmillan AM, Sagoo K, McLoskey D, Birch DJS, 2006. Excitation of fluorescence decay using a 265 nm pulsed light-emitting diode: evidence for aqueous phenylalanine rotamers. Appl. Phys. Lett 89 (6), 063901. [Google Scholar]
- Nakashima N, Yoshihara K, Tanaka F, Yagi K, 1980. Picosecond fluorescence lifetime of the coenzyme of D-amino acid oxidase. J. Biol. Chem 255 (11), 5261–5263. [PubMed] [Google Scholar]
- Neuringer M, Sandstrom MM, Johnson EJ, Snodderly DM, 2004. Nutritional manipulation of primate retinas, I: effects of lutein or zeaxanthin supplements on serum and macular pigment in xanthophyll-free rhesus monkeys. Invest Ophthalmol. Vis. Sci 45 (9), 3234–3243. [DOI] [PubMed] [Google Scholar]
- Nicholson B, Noble J, Forooghian F, Meyerle C, 2013. Central serous chorioretinopathy: update on pathophysiology and treatment. Surv. Ophthalmol 58 (2), 103–126. [DOI] [PMC free article] [PubMed] [Google Scholar]
- Niesner R, Peker B, Schlusche P, Gericke KH, 2004. Noniterative biexponential fluorescence lifetime imaging in the investigation of cellular metabolism by means of NAD(P)H autofluorescence. Chemphyschem 5 (8), 1141–1149. [DOI] [PubMed] [Google Scholar]
- Palczewska G, Dong Z, Golczak M, Hunter JJ, Williams DR, Alexander NS, Palczewski K, 2014. Noninvasive two-photon microscopy imaging of mouse retina and retinal pigment epithelium through the pupil of the eye. Nat. Med 20 (7), 785–789. [DOI] [PMC free article] [PubMed] [Google Scholar]
- Pelet S, Previte MJR, Laiho LH, So PTC, 2004. A fast global fitting algorithm for fluorescence lifetime imaging microscopy based on image segmentation. Biophys. J 87 (4), 2807–2817. [DOI] [PMC free article] [PubMed] [Google Scholar]
- Periasamy A, Wodnicki P, Wang XF, Kwon S, Gordon GW, Herman B, 1996. Time-resolved fluorescence lifetime imaging microscopy using a picosecond pulsed tunable dye laser system. Rev. Sci. Instrum 67 (10), 3722–3731. [Google Scholar]
- Peters SHMSD, 2011. Two-photon excited fluorescence microscopy application for ex vivo investigation of ocular fundus samples. In: SPIE Proceedings, p. 8086. [Google Scholar]
- Ponsioen TL, van Luyn MJA, van der Worp RJ, van Meurs JC, Hooymans JMM, Los LI, 2008. Collagen distribution in the human vitreoretinal interface. Investigative Ophthalmol. Vis. Sci 49 (9), 4089–4095. [DOI] [PubMed] [Google Scholar]
- Rech I, Cammi C, Crotti M, Gulinatti A, Maccagnani P, Ghioni M, Cova S, 2012. High performance SPAD array detectors for parallel photon timing applications. Proc. SPIE 8228, 82280H-82281H–82280H-82289. [Google Scholar]
- Redford G, Clegg R, 2005. Polar plot representation for frequency-domain analysis of fluorescence lifetimes. J. Fluoresc 15 (5), 805–815. [DOI] [PubMed] [Google Scholar]
- Sauer L, Peters S, Schmidt J, Schweitzer D, Klemm M, Ramm L, Augsten R, Hammer M, 2016. Monitoring macular pigment changes in macular holes using fluorescence lifetime imaging ophthalmoscopy. Acta Ophthalmol. 10.1111/aos.13269 [DOI] [PubMed] [Google Scholar]
- Sauer L, Schweitzer D, Ramm L, Augsten R, Hammer M, Peters S, 2015. Impact of macular pigment on fundus autofluorescence lifetimes. Invest Ophthalmol. Vis. Sci 56 (8), 4668–4679. [DOI] [PubMed] [Google Scholar]
- Schalch W, 1992. Carotenoids in the retina-a review of their possible role in preventing or limiting damage caused by light and oxygen. EXS 62, 280–298. [DOI] [PubMed] [Google Scholar]
- Schalken JJ, Janssen JJ, Sanyal S, Hawkins RK, de Grip WJ, 1990. Development and degeneration of retina in rds mutant mice: immunoassay of the rod visual pigment rhodopsin. Biochim. Biophys. Acta 1033 (1), 103–109. [DOI] [PubMed] [Google Scholar]
- Schmidt J, Peters S, Sauer L, Schweitzer D, Klemm M, Augsten R, Muller N, Hammer M, 2017. Fundus autofluorescence lifetimes are increased in non-proliferative diabetic retinopathy. Acta Ophthalmol. 95 (1), 33–40. [DOI] [PubMed] [Google Scholar]
- Schneckenburger H, Wagner M, Weber P, Strauss WSL, Sailer R, 2004. Autofluorescence lifetime imaging of cultivated cells using a UV picosecond laser diode. J. Fluoresc 14 (5), 649–654. [DOI] [PubMed] [Google Scholar]
- Schwartz DE, Charbon E, Shepard KL, 2008. A single-photon avalanche diode array for fluorescence lifetime imaging microscopy. IEEE J. solid-state circuits 43 (11), 2546–2557. [DOI] [PMC free article] [PubMed] [Google Scholar]
- Schweitzer D, Deutsch L, Klemm M, Jentsch S, Hammer M, Peters S, Haueisen J, Muller UA, Dawczynski J, 2015. Fluorescence lifetime imaging ophthalmoscopy in type 2 diabetic patients who have no signs of diabetic retinopathy. J. Biomed. Opt 20 (6), 61106. [DOI] [PubMed] [Google Scholar]
- Schweitzer D, Hammer M, Jentsch S, Schenke S, 2007a. Interpretation of Measurements of Dynamic Fluorescence of the Eye. SPIE, Boston, MA, USA. [Google Scholar]
- Schweitzer D, Hammer M, Schweitzer F, Anders R, Doebbecke T, Schenke S, Gaillard ER, Gaillard ER, 2004. In vivo measurement of time-resolved autofluorescence at the human fundus. J. Biomed. Opt 9 (6), 1214–1222. [DOI] [PubMed] [Google Scholar]
- Schweitzer D, Hammer M, Schweitzer F, Schenke S, Gaillard ER, 2003. Evaluation of Time-resolved Autofluorescence Images of the Ocular Fundus Diagnostic Optical Spectroscopy in Biomedicine II, Munich. [Google Scholar]
- Schweitzer D, Kolb A, Hammer M, 2001a. Autofluorescence lifetime measurements in images of the human ocular fundus. Proc. SPIE 4432, 29–39. [Google Scholar]
- Schweitzer D, Kolb A, Hammer M, Anders R, 2002. Zeitaufgeloste Messung der Autofluoreszenz - ein Werkzeug zur Erfassung von Stoffwechselvorgangen am Augenhintergrund. Der Opthalmologe 99 (10), 774–779. [DOI] [PubMed] [Google Scholar]
- Schweitzer D, Kolb A, Hammer M, Thamm E, 2001b. Basic investigations for 2-dimensional time-resolved fluorescence measurements at the fundus. Int. Ophthalmol 23, 399–404. [DOI] [PubMed] [Google Scholar]
- Schweitzer D, Schenke S, Hammer M, Schweitzer F, Jentsch S, Birckner E, Becker W, Bergmann A, 2007b. Towards metabolic mapping of the human retina. Microsc. Res. Tech 70 (5), 410–419. [DOI] [PubMed] [Google Scholar]
- Sebag J, 1992. Anatomy and pathology of the vitreoretinal interface. Eye 6 (6), 541–552. [DOI] [PubMed] [Google Scholar]
- Shagaghi N, Bhave M, Palombo EA, Clayton AHA, 2017. Revealing the sequence of interactions of PuroA peptide with Candida albicans cells by live-cell imaging. Sci. Rep 7, 43542. [DOI] [PMC free article] [PubMed] [Google Scholar]
- Sharifzadeh M, Bernstein PS, Gellermann W, 2006. Nonmydriatic fluorescence-based quantitative imaging of human macular pigment distributions. J. Opt. Soc. Am. A Opt. Image Sci. Vis 23 (10), 2373–2387. [DOI] [PMC free article] [PubMed] [Google Scholar]
- Sharma R, Williams DR, Palczewska G, Palczewski K, Hunter JJ, 2016. Two-photon autofluorescence imaging reveals cellular structures throughout the retina of the living primate eye. Invest Ophthalmol. Vis. Sci 57 (2), 632–646. [DOI] [PMC free article] [PubMed] [Google Scholar]
- Sharma R, Yin L, Geng Y, Merigan WH, Palczewska G, Palczewski K, Williams DR, Hunter JJ, 2013. In vivo two-photon imaging of the mouse retina. Biomed. Opt. Express 4 (8), 1285–1293. [DOI] [PMC free article] [PubMed] [Google Scholar]
- Siskova A, Wilhelm J, 2001. The effects of hyperoxia, hypoxia, and ischemia/reperfusion on the activity of cytochrome oxidase from the rat retina. Physiol. Res 50 (3), 267–273. [PubMed] [Google Scholar]
- Snodderly DM, Auran JD, Delori FC, 1984. The macular pigment. II. Spatial distribution in primate retinas. Invest Ophthalmol. Vis. Sci 25 (6), 674–685. [PubMed] [Google Scholar]
- Snyder R, Arvidson E, Foote C, Harrigan L, Christensen RL, 1985. Electronic-energy levels in long polyenes - S-2-]S-O emission in all-trans-1,3,5,7,9,11,13-tetradecaheptaene. J. Am. Chem. Soc 107 (14), 4117–4122. [Google Scholar]
- Spaide R, 2008. Autofluorescence from the outer retina and subretinal space: hypothesis and review. Retina 28 (1), 5–35. [DOI] [PubMed] [Google Scholar]
- Sparks H, Gorlitz F, Kelly DJ, Warren SC, Kellett PA, Garcia E, Dymoke-Bradshaw AK, Hares JD, Neil MA, Dunsby C, French PM, 2017. Characterisation of new gated optical image intensifiers for fluorescence lifetime imaging. Rev. Sci. Instrum 88 (1), 013707. [DOI] [PubMed] [Google Scholar]
- Sparrow JR, Boulton M, 2005. RPE lipofuscin and its role in retinal pathobiology. Exp. Eye Res 80 (5), 595–606. [DOI] [PubMed] [Google Scholar]
- Sparrow JR, Fishkin N, Zhou J, Cai B, Jang YP, Krane S, Itagaki Y, Nakanishi K, 2003. A2E, a byproduct of the visual cycle. Vis. Res 43 (28), 2983–2990. [DOI] [PubMed] [Google Scholar]
- Sparrow JR, Gregory-Roberts E, Yamamoto K, Blonska A, Ghosh SK, Ueda K, Zhou J, 2012. The bisretinoids of retinal pigment epithelium. Prog. Retin Eye Res 31 (2), 121–135. [DOI] [PMC free article] [PubMed] [Google Scholar]
- Sparrow JR, Marsiglia M, Allikmets R, Tsang S, Lee W, Duncker T, Zernant J, 2015. Flecks in recessive Stargardt disease: short-wavelength autofluorescence, near-infrared autofluorescence, and optical coherence tomography. Invest Ophthalmol. Vis. Sci 56 (8), 5029–5039. [DOI] [PMC free article] [PubMed] [Google Scholar]
- Sparrow JR, Nakanishi K, Parish CA, 2000. The lipofuscin fluorophore A2E mediates blue light-induced damage to retinal pigmented epithelial cells. Invest Ophthalmol. Vis. Sci 41 (7), 1981–1989. [PubMed] [Google Scholar]
- Strickler SJ, Berg RA, 1962. Relationship between absorption intensity and fluorescence lifetime of molecules. J. Chem. Phys 37 (4), 814–822. [Google Scholar]
- Suhling K, Hirvonen LM, Becker W, Smietana S, Netz H, Milnes J, Conneely T, Le Marois A, Jagutzki O, 2016. Wide-field TCSPC-based fluorescence lifetime imaging (FLIM) microscopy. Proc. SPIE 9858, 98580J 98510pp. [Google Scholar]
- Tanna P, Strauss RW, Fujinami K, Michaelides M, 2017. Stargardt disease: clinical features, molecular genetics, animal models and therapeutic options. Br. J. Ophthalmol 101 (1), 25–30. [DOI] [PMC free article] [PubMed] [Google Scholar]
- Taubold R, Siakotos A, Perkins E, 1975. Studies on chemical nature of lipofuscin (age pigment) isolated from normal human brain. Lipids 10 (7), 383–390. [DOI] [PubMed] [Google Scholar]
- Teussink MM, Lambertus S, de Mul FF, Rozanowska MB, Hoyng CB, Klevering BJ, Theelen T, 2017. Lipofuscin-associated photo-oxidative stress during fundus autofluorescence imaging. PLoS One 12 (2), e0172635. [DOI] [PMC free article] [PubMed] [Google Scholar]
- Trieschmann M, van Kuijk FJ, Alexander R, Hermans P, Luthert P, Bird AC, Pauleikhoff D, 2008. Macular pigment in the human retina: histological eval-uation of localization and distribution. Eye (Lond) 22 (1), 132–137. [DOI] [PubMed] [Google Scholar]
- Tsentalovich YP, Sherin PS, Kopylova LV, Cherepanov IV, Grilj J, Vauthey E, 2011. Photochemical properties ofUV Filter molecules of the human eye. Invest Ophthalmol. Vis. Sci 52 (10), 7687–7696. [DOI] [PubMed] [Google Scholar]
- Varma DD, Cugati S, Lee AW, Chen CS, 2013. A review of central retinal artery occlusion: clinical presentation and management. Eye (Lond) 27 (6), 688–69 . [DOI] [PMC free article] [PubMed] [Google Scholar]
- von Rückmann A, Fitzke FW, Bird AC, 1995a. Clinical application of in vivo imaging of fundus autofluorescence. Invest. Ophthalmol. 36 (4), 238. [Google Scholar]
- von Rückmann A, Fitzke FW, Bird AC, 1995b. Distribution of fundus autofluorescence with a scanning laser ophthalmoscope. Brit. J. Ophthalmol 79, 407–412. [DOI] [PMC free article] [PubMed] [Google Scholar]
- Vujosevic S, Casciano M, Pilotto E, Boccassini B, Varano M, Midena E, 2011. Diabetic macular edema: fundus autofluorescence and functional correlations. Invest Ophthalmol. Vis. Sci 52 (1), 442–448. [DOI] [PubMed] [Google Scholar]
- Wakita M, Nishimura G, Tamura M, 1995. Some characteristics of the fluorescence lifetime of reduced pyridine-nucleotides in isolated-mitochondria, isolated hepatocytes, and perfused-rat-liver in-situ. J. Biochem 118 (6), 1151–1160. [DOI] [PubMed] [Google Scholar]
- Weiter JJ, Delori FC, Wing GL, Fitch KA, 1986. Retinal pigment epithelial lipofuscin and melanin and choroidal melanin in human eyes. Invest Ophthalmol. Vis. Sci 27 (2), 145–152. [PubMed] [Google Scholar]
- Widomska J, Subczynski WK, 2014. Why has nature chosen lutein and zeaxanthin to protect the retina? J. Clin. Exp. Ophthalmol 5 (1), 326. [DOI] [PMC free article] [PubMed] [Google Scholar]
- Wustemeyer H, Moessner A, Jahn C, Wolf S, 2003. Macular pigment density in healthy subjects quantified with a modified confocal scanning laser ophthalmoscope. Graefes Arch. Clin. Exp. Ophthalmol 241 (8), 647–651. [DOI] [PubMed] [Google Scholar]
- Xu W, Chi L, Row BW, Xu R, Ke Y, Xu B, Luo C, Kheirandish L, Gozal D, Liu R, 2004. Increased oxidative stress is associated with chronic intermittent hypoxia-mediated brain cortical neuronal cell apoptosis in a mouse model of sleep apnea. Neuroscience 126 (2), 313–323. [DOI] [PubMed] [Google Scholar]
- Yang H, Luo G, Karnchanaphanurach P, Louie T-M, Rech I, Cova S, Xun L, Xie XS, 2003. Protein conformational dynamics probed by single-molecule electron transfer. Science 302 (5643), 262–266. [DOI] [PubMed] [Google Scholar]
- Yazdanfar S, Joo C, Zhan C, Berezin MY, Akers WJ, Achilefu S, 2010. Multiphoton microscopy with near infrared contrast agents. J. Biomed. Opt 15 (3), 030505, 030503pp. [DOI] [PMC free article] [PubMed] [Google Scholar]
- Yu DY, Cringle SJ, Su EN, Yu PK, Jerums G, Cooper ME, 2001. Pathogenesis and intervention strategies in diabetic retinopathy. Clin. Exp. Ophthalmol 29 (3), 164–166. [DOI] [PubMed] [Google Scholar]
- Yung M, Klufas MA, Sarraf D, 2016. Clinical applications of fundus autofluorescence in retinal disease. Int. J. Retina Vitr 2,12. [DOI] [PMC free article] [PubMed] [Google Scholar]
- Zhang XY, Zeng H, Bao S, Wang NL, Gillies MC, 2014. Diabetic macular edema: new concepts in pathophysiology and treatment. Cell Biosci. 4. [DOI] [PMC free article] [PubMed] [Google Scholar]
- Zheng W, Wu Y, Li D, Qu JY, 2008. Autofluorescence of epithelial tissue: single-photon versus two-photon excitation. J. Biomed. Opt 13 (5), 054010. [DOI] [PubMed] [Google Scholar]
- Zinkernagel MS, MacLaren RE, 2015. Recent advances and future prospects in choroideremia. Clin. Ophthalmol 9, 2195–2200. [DOI] [PMC free article] [PubMed] [Google Scholar]
Associated Data
This section collects any data citations, data availability statements, or supplementary materials included in this article.
Supplementary Materials
Supplementary Figure 1: Structures of common autofluorophores in the retina and neighboring tissue.
Supplementary Figure 2: Correlation of two versus three exponential decay fit in the short and the long spectral channel (Dysli et al., 2014b).