

Abstract
Mitochondria are eukaryotic organelles of bacterial origin where respiration takes place to produce cellular chemical energy. These reactions are catalyzed by the respiratory chain complexes located in the inner mitochondrial membrane. Notably, key components of the respiratory chain complexes are encoded on the mitochondrial chromosome and their expression relies on a dedicated mitochondrial translation machinery. Defects in the mitochondrial gene expression machinery lead to a variety of diseases in humans mostly affecting tissues with high energy demand such as the nervous system, the heart, or the muscles. The mitochondrial translation system has substantially diverged from its bacterial ancestor, including alterations in the mitoribosomal architecture, multiple changes to the set of translation factors and striking reductions in otherwise conserved tRNA elements. Although a number of structures of mitochondrial ribosomes from different species have been determined, our mechanistic understanding of the mitochondrial translation cycle remains largely unexplored. Here, we present two cryo‐EM reconstructions of human mitochondrial elongation factor G1 bound to the mammalian mitochondrial ribosome at two different steps of the tRNA translocation reaction during translation elongation. Our structures explain the mechanism of tRNA and mRNA translocation on the mitoribosome, the regulation of mtEFG1 activity by the ribosomal GTPase‐associated center, and the basis of decreased susceptibility of mtEFG1 to the commonly used antibiotic fusidic acid.
Keywords: cryo‐EM, elongation, mitoribosome, mtEFG1, translation
Subject Categories: Structural Biology, Protein Biosynthesis & Quality Control
Cryo‐EM reconstructions of distinct translation elongation steps explain mtEFG1 regulation by the ribosomal GTPase‐associated center and its decreased susceptibility to the commonly used antibiotic fusidic acid.
Introduction
During protein synthesis, the ribosome moves along a messenger RNA (mRNA) that is successively decoded through interactions of mRNA codons with the anticodons of cognate tRNAs on the small ribosomal subunit (SSU). The ribosome harbors three binding sites for tRNAs: the aminoacyl (A) site, the peptidyl (P) site, and the exit (E) site. With the addition of each amino acid, the nascent chain is transferred from the P site‐bound tRNA onto the A site tRNA. In a subsequent step, tRNA and mRNA are translocated by exactly one codon on the ribosome leading to a repositioning of the now deacylated P site tRNA to the E site and of the peptidyl‐tRNA from the A site to the P site. The deacylated tRNA is then released from the E site of the ribosome, and the ribosomal A site is ready to accept the next aminoacylated tRNA for peptide bond formation (Rodnina, 2018).
The translocation process is an important step during protein synthesis since the fidelity of simultaneous mRNA‐tRNA movement has to be very high in order to avoid frameshifting. Indeed, spontaneous frameshifting occurs in < 1 out of 100,000 translated codons demonstrating the high accuracy of the translocation reaction (Kurland, 1992). Translocation requires large‐scale movements of the small ribosomal subunit including rotation of the SSU with respect to the large ribosomal subunit (LSU) and a swiveling motion of the SSU head (Ratje et al, 2010; Guo & Noller, 2012; Chen et al, 2013; Ramrath et al, 2013; Tourigny et al, 2013; Zhou et al, 2013; Holtkamp et al, 2014; Belardinelli et al, 2016; Wasserman et al, 2016). mRNA‐tRNA movement occurs in multiple coordinated and evolutionary conserved steps that have been studied in detail in bacteria (for review see Rodnina et al, 2019). In the non‐rotated ribosome, A and P site tRNAs occupy a “classical” state being bound to the same tRNA site on both SSU and LSU (the tRNA states are therefore denoted A/A and P/P). Subunit rotation triggers movement of the A and P site tRNA to the P and E sites on the LSU while remaining bound to the A and P sites on the SSU (A/ap and P/pe). These tRNA states are referred to as “hybrid” states. Binding of translation elongation factor G stabilizes the rotated ribosome and the hybrid tRNAs to induce the next step of translocation. In this step, movements of head and body of the SSU are uncoupled with the body progressively returning into a non‐rotated conformation while the head starts the move, or “swivel”, around its own axis. The anticodon stem loops of the tRNAs stay associated with the A and P sites on the SSU head and follow its swiveling motion, which leads to their repositioning into the P and E sites on the SSU body. This tRNA state on the SSU is called “chimeric” (ap/ap and pe/pe). Eventually, the mRNA‐tRNA complex is “unlocked”, i.e., mRNA‐tRNA movement and motions of the SSU head are uncoupled. The acceptor ends of the tRNAs engage with their final positions in the P and E sites on the LSU, respectively, while the SSU head starts to move backwards. The anticodon stem loops (ASLs) of the tRNAs finally slip into their respective P and E site locations on the SSU head and body adopting again a classical conformation at the end of the translocation reaction (P/P, E/E).
Translocation is catalyzed by elongation factor G (EFG) in bacteria and mtEFG1 in mitochondria, which guide ribosomal motions and tRNA movement (Eberly et al, 1985; Chung & Spremulli, 1990; Savelsbergh et al, 2003; Bhargava et al, 2004; Tsuboi et al, 2009; Holtkamp et al, 2014; Adio et al, 2015). Translocation is possible but very slow in the absence of the elongation factor (Shoji et al, 2006; Konevega et al, 2007; Bock et al, 2013). EFG accelerates the reaction by more than five orders of magnitude (Rodnina et al, 1997; Munro et al, 2010). As a translational GTPase, it uses the energy derived from GTP hydrolysis to facilitate the rearrangements of the pre‐translocation ribosome and tRNA movement (Rodnina et al, 1997, 2019; Savelsbergh et al, 2003; Holtkamp et al, 2014; Adio et al, 2015; Belardinelli et al, 2016; Chen et al, 2016; Sharma et al, 2016) by (i) stabilizing the rotated state of the ribosomal subunits, (iii) uncoupling the motions of the SSU head and body from mRNA‐tRNA movement during “unlocking”, and (iii) likely preventing back slippage of the tRNA during backrotation and backswiveling of the SSU body and head, respectively.
EFG function has been extensively studied in bacteria. However, in the mitochondrial system translation elongation is poorly investigated so far and no structural information is available for mtEFG1 action during mRNA‐tRNA translocation on mitochondrial ribosomes. Strikingly, mitochondria have evolved two paralogues of EFG, mtEFG1 and mtEFG2, which catalyze different steps of the translation cycle (Hammarsund et al, 2001; Tsuboi et al, 2009). Mitochondrial EFG1 (mtEFG1) acts during translation elongation while mitochondrial EFG2 (mtEFG2) partakes in ribosome recycling (Chung & Spremulli, 1990; Bhargava et al, 2004; Tsuboi et al, 2009). This strict task sharing is in stark contrast to canonical bacterial EFG that plays a role not only in the elongation phase but is also crucially involved in ribosome recycling. The molecular basis for the separation of the dual function of canonical bacterial EFG over two separate proteins in mitochondria is not understood. In recent years, it has become known that also some bacterial species carry two paralogues of EFG (Hammarsund et al, 2001; Pandit & Srinivasan, 2003; Atkinson & Baldauf, 2011). However, while both paralogues show a similar task distribution as mitochondrial mtEFG1 and mtEFG2 in the spirochaete Borrelia burgdorferi, the role of EFG2 in other bacterial species is still unclear (Connell et al, 2007; Seshadri et al, 2009; Suematsu et al, 2010).
Here, we employed a previously developed in vitro reconstitution system to investigate how mitochondrial mtEFG1 interacts with the mammalian mitoribosome to clarify how mtEFG1 catalyzes tRNA translocation during elongation and how mtEFG1 and mtEFG2 have structurally specialized for their distinct functions.
Results and Discussion
Mitochondrial elongation complexes trapped in two states of translocation
We in vitro assembled mitochondrial elongation complexes from isolated, native mammalian S. scrofa mitoribosomal subunits, recombinantly generated human mtEFG1 and fMet‐mtRNAMet in the presence of a short hexanucleotide (CUGAUG) and the non‐hydrolyzable nucleotide analog GMPPNP (please see the Materials and Methods section for details). We find mtEFG1 bound to the factor binding site nestling between the small and large ribosomal subunits. The factor binds the ribosome in an extended fashion and contacts the codon–anticodon paired mRNA‐tRNA module in the P site of the ribosome (Fig 1A). Maximum likelihood‐based classification approaches yielded two distinct elongation complexes (Figs 1A and EV1 and EV2A and B). Complex 1 (hereafter referred to as POST) at 3.0 Å resembles a post‐translocation state carrying a P site tRNA in the classical P/P conformation (Figs 1A and B, and EV2B and EV3A). Complex 2 (hereafter referred to as TiPOST) at 4.2 Å contains two tRNAs that are still in transit into the P and E sites on the SSU showing that our in vitro system is in principle translocation competent (Figs 1A and B, and EV2A). In TiPOST, the acceptor ends of both tRNAs already engage with their final positions in the P and E sites on the LSU, respectively, whereas the anticodon stem loops on the SSU are bound in chimeric ap or pe positions, respectively, due to a rotation of the SSU head of about 17° (Fig 1C). Therefore, TiPOST adopts a conformation (ap/P, pe/E) prior to unlocking and shows a similar overall structure as previously reported for translocation intermediates in the bacterial system (Ramrath et al, 2013; Tourigny et al, 2013; Zhou et al, 2014). In TiPOST, the aminoacylated ap/P fMet‐tRNAMet contacts the canonical P site element A430 (A790 in T. thermophilus) of the SSU body, whereas the P site element of the SSU head, the G782/A783 (G1338/A1339 in T. thermophilus) ridge, is still engaged with the deacylated pe/E tRNAMet (Fig 2A) (Selmer et al, 2006; Jenner et al, 2010). Mutations in G1338/A1339 result in a significant decrease in translational activity in bacteria (Abdi & Fredrick, 2005). Our data show that these rRNA residues have maintained their critical role in mitochondria in guiding the deacylated tRNA into the chimeric pe position on the SSU. Both tRNAs maintain base pairing interactions with their mRNA codons in TiPOST, although the pe/E site tRNA interacts due to a mismatch of the CUG mRNA codon more weakly (Fig 2B). During transition of TiPOST to POST, it appears that upon backswiveling of the SSU head a generally conserved β‐hairpin of uS7m will dislodge the deacylated E site tRNA from the mRNA (Fig 2B). The tRNA then engages into the classical E/E position and is eventually ejected from the ribosome.
Figure 1. The mitochondrial elongation complex trapped in two states.
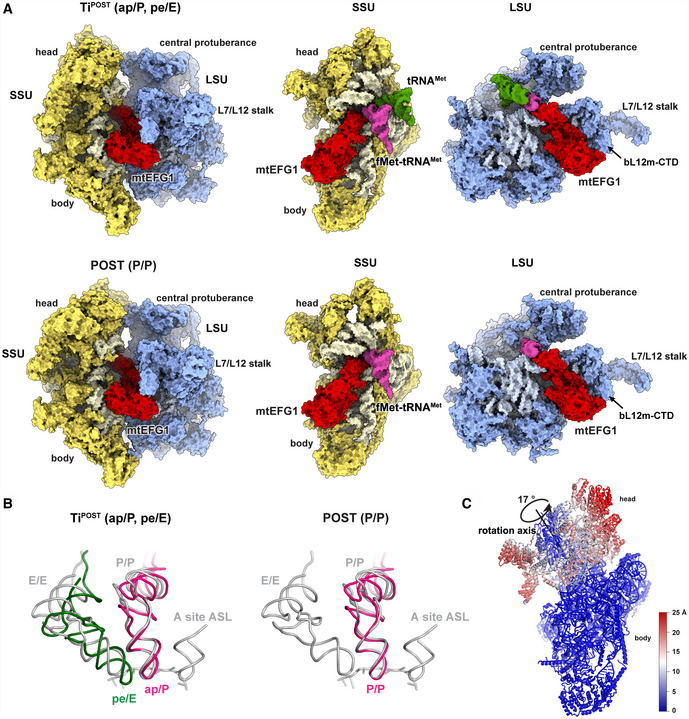
- Structures of mtEFG1 (red), aminoacylated fMet‐tRNAMet (pink), and deacylated tRNAMet (green) with the 55S mitoribsome in TiPOST and POST states. Separate views for SSU and LSU as seen from the subunit interface are shown for clarity.
- The tRNA orientations of TiPOST and POST are depicted in comparison with published classical tRNA positions (gray) after superposition of the LSU (Selmer et al, 2006). The aminoacylated fMet‐tRNAMet is colored in pink and the deacylated tRNAMet in green.
- The degree of head rotation comparing the TiPOST and POST complex is shown with the respective rotation axis and angle calculated in PyMOL using the draw_rotation_axis.py script (P.G. Calvo). The resulting displacement in Å is color‐coded.
Figure EV1. Particle classification scheme.
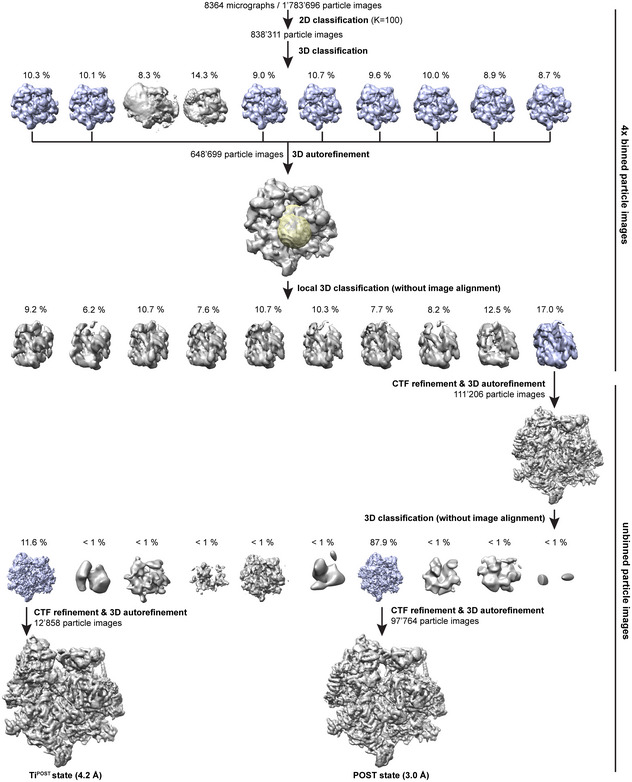
During classification, particles were discarded that were either of poor quality or could not be unambiguously interpreted. In each classification step, particles that were retained for further analysis are depicted in violet. The mask used for local 3D classification is shown in yellow superimposed onto the reference.
Figure EV2. Experimental EM densities of the TiPOST and POST states.
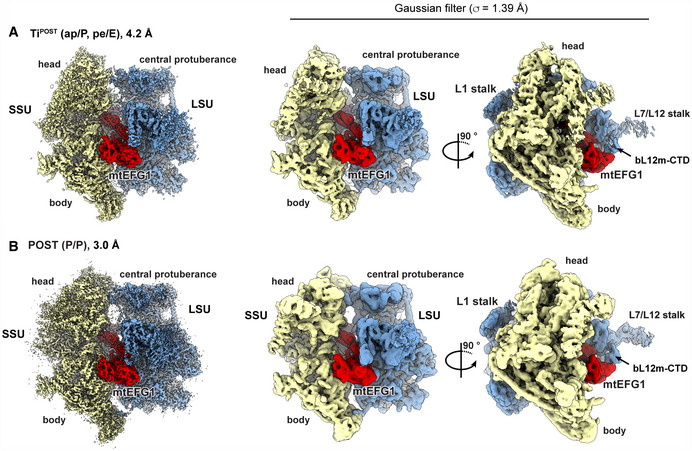
- Left: The postprocessed EM density of the TiPOST state is shown color‐coded according to the underlying structural model (red: mtEFG1, yellow: SSU, blue: LSU). Right: A Gaussian filter (σ = 1.39 Å) has been applied to the EM densities in ChimeraX to visualize also regions of lower resolution. (Goddard et al, 2018) EM densities are shown from two different viewing angles.
- The POST state is shown in the same manner as the TiPOST state in (A).
Figure EV3. Interaction of mtEFG1 with the tRNA‐mRNA module.
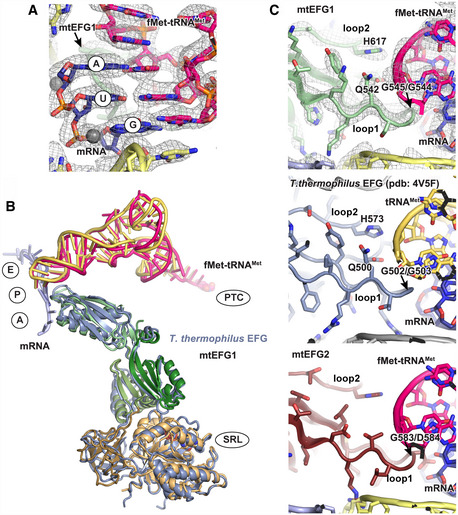
- Codon–anticodon interaction of the tRNA‐mRNA module in the POST state. mtEFG1 loop 1 that nestles into the minor groove of the module is shown in light green.
- Superposition of EFG (gray blue), tRNA (yellow), and mRNA (light blue) from the bacterial post‐translocation state (PDB: 4V5F) (Gao et al, 2009) with the mitochondrial POST state (mtEFG1 color‐coded according to Fig 2D, fMet‐tRNAMet in pink and mRNA in deep blue). The overall conformation of the bacterial elongation factor and mtEFG1 is very similar as is the interaction of the translation factors with the tRNA‐mRNA module. Important ribosomal regions surrounding the elongation factor and the tRNA‐mRNA module are indicated (SRL: sarcin–ricin loop, PTC: peptidyl‐transferase center on the large mitoribosomal subunit; A,P,E: A, P, E sites on the small mitoribosomal subunit).
- Interactions of different elongation factors with the tRNA‐mRNA module. Upper panel: Interaction of mtEFG1 domain IV loops 1 and 2 with the mRNA‐tRNA module in the P site of the POST state. Residues conserved in bacteria and important to establish the contact are highlighted. Middle panel: Bacterial EFG in the post‐translocation state is shown for comparison (pdb: 4V5F) (Gao et al, 2009). Lower panel: A Phyre2 homology model of mtEFG2 (ruby) has been superimposed on mtEFG1 using the POST state of elongation in mitochondria. Neither the critical di‐glycine motif nor Q542 that makes stabilizing interactions with the tRNA backbone are conserved.
Figure 2. mtEFG1 and tRNA interactions in both translocation states.
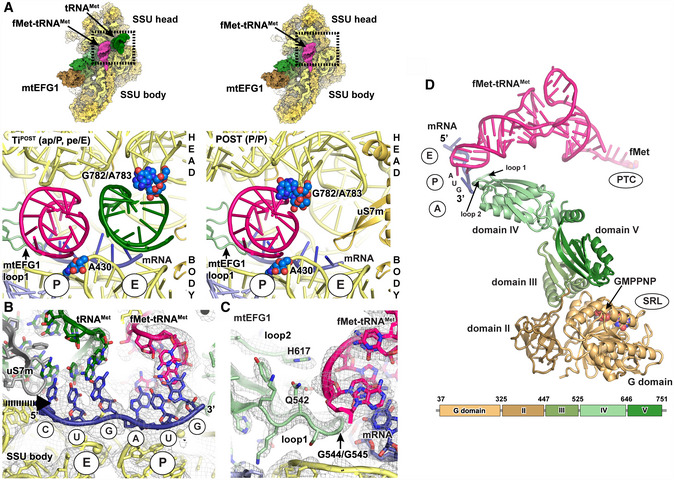
- Interactions of the tRNAs in TiPOST and POST states with ribosomal P site elements (blue) of the SSU head (G782/A783 ridge) and body (A430) rRNA. tRNA binding sites of the SSU body are indicated in circles. View from the subunit interface onto the SSU with the enlarged area being highlighted with a box. Left: In the transit TiPOST state, the SSU head is rotated with the G782/A783 ridge moving in concert with deacylated tRNAMet (green). This leads to a repositioning of aminoacylated fMet‐tRNAMet and deacylated tRNAMet into a chimeric ap or pe positions, respectively. Right: In the POST state, the aminoacylated fMet‐tRNAMet (pink) in the P site engages with both head and body elements.
- Both tRNAs remain associated with their respective mRNA codons in the TiPOST state. A superposition of the position of the uS7m beta‐hairpin in the unrotated SSU head conformation is displayed in gray to indicate its clash with the deacylated tRNAMet (green) upon backswiveling of the SSU head. The arrow indicates the direction of motion of uS7m. The EM density of the TiPOST state is contoured at 4σ.
- Loops 1 and 2 of mtEFG1 domain IV contact the fMet‐tRNAMet‐mRNA module via conserved residues including a di‐glycine motif (G544/G545), Q542 and H617 to prevent slippage of the tRNA and to maintain the mRNA reading frame. The EM density and the structural model are shown for the POST state but are very similar in the TiPOST state (The map is depicted at 4σ).
- mtEFG1, fMet‐tRNAMet, and mRNA of the POST state are shown in isolation. The domain organization of mtEFG1 is indicated by different colors. A corresponding schematic representation including the amino acid numbering of domain borders is given at the bottom. Locations of the surrounding ribosomal elements are indicated.
The conformation of mtEFG1 on the mitochondrial ribosome
The overall conformation of mtEFG1 is similar to previous structural reports from the bacterial system (Fig EV3B) (Agrawal et al, 1998; Stark et al, 2000; Connell et al, 2007; Gao et al, 2009; Chen et al, 2013; Pulk & Cate, 2013; Ramrath et al, 2013; Tourigny et al, 2013; Zhou et al, 2013; Li et al, 2015; Lin et al, 2015; Mace et al, 2018). The factor is bound to the mitochondrial ribosome in TiPOST and POST states in an extended conformation, where the GTPase (G) domain is bound to the sarcin–ricin loop (SRL) and domain II contacts the SSU body. Domain IV interacts with the mRNA‐tRNA codon–anticodon pair of the translocated P site tRNA in TiPOST as well as POST. Domain V of mtEFG1 engages closely with the GTPase‐associated center (GAC) on the LSU, and domain III serves as bridging element that stabilizes the domain arrangement of mtEFG1 by simultaneously contacting the G domain and domains II and V (Figs 2D and EV3B).
During translocation, A and P site tRNAs move together with their respective mRNA codons. It has been shown that bacterial EFG is crucial to maintain the mRNA‐tRNA interaction during tRNA movement, as the absence or mutation of EFG leads to increased frameshifting and decreased translocation efficiency (Martemyanov et al, 1998; Savelsbergh et al, 2000a; Holtkamp et al, 2014; Peng et al, 2019; Zhou et al, 2019). An important parameter to maintain the mRNA reading frame is the interaction of mtEFG1 domain IV with the tRNA‐mRNA module via two apical loops that engage with the minor groove of the codon–anticodon base pairs and with the backbone of the peptidyl‐tRNA (Gao et al, 2009). This interaction is conserved in mitochondrial translocation as mtEFG1 retained a critical di‐glycine motif (G544/G545) at the tip of loop1 that enables the loop to sterically fit into the minor groove of the mRNA‐tRNA module (Figs 2C and EV3C). Loops 1 and 2 in addition contain conserved residues Q542 and H617 (Q500 and H573 in T. thermophilus) that contact the tRNA backbone and prevent tRNA slippage (Figs 2C and EV3C) (Gao et al, 2009; Ramrath et al, 2013; Zhou et al, 2014; Peng et al, 2019).
GTPase regulation of mtEFG1 by ribosomal elements
Translational GTPases engage on the ribosome with several conserved rRNA and protein elements that are important for factor binding and GTPase activation. This GTPase‐associated center (GAC) comprises (i) the sarcin–ricin loop (SRL) of the mitochondrial 16S LSU rRNA, (ii) the ribosomal L7/L12 stalk composed of uL10m and 6 copies of bL7/12m in mammalian mitochondria (Kummer et al, 2018), and (iii) the stalk base (SB) that contains uL11m and 16S rRNA helices H43 and H44. In bacteria, the SB is the binding site for antibiotics of the thiopeptide family including thiostrepton that acts as a potent inhibitor of EFG‐catalyzed translocation (Harms et al, 2008). Accordingly, mutations of the conserved apical adenosine nucleotides A1067 (A512 in S. scrofa mitoribosomes) and A1095 (U539 in S. scrofa mitoribosomes) of H43 and H44, respectively, confers resistance to thiostrepton in bacteria (Thompson et al, 1988; Rosendahl & Douthwaite, 1994; Cameron et al, 2004). As mitochondrial H43 harbors an uracil (U539) instead of the conserved adenosine at the tip of H43, mammalian mitoribosomes are naturally resistant to thiostrepton action (Rosendahl & Douthwaite, 1994).
Thiostrepton is believed to act in bacteria not by inhibiting initial EFG engagement with the ribosome but rather by preventing the conversion of a loosely bound initial EFG complex to a stable complex that is competent to catalyze tRNA movement (Rodnina et al, 1999; Seo et al, 2006; Pan et al, 2007; Lin et al, 2015). It likely does so by inhibiting movements of the flexible SB that appear to be essential for the conversion into the tight conformation (Schuwirth et al, 2005; Harms et al, 2008). Rearrangements of the SB upon EFG binding have been observed in the bacterial as well as eukaryotic system although direction and magnitude of the described motions differ (Agrawal et al, 1998; Frank & Agrawal, 2001; Spahn et al, 2004; Seo et al, 2006; Brilot et al, 2013; Chen et al, 2013; Li et al, 2015). Eventually, tight complex formation is accompanied by the establishment of multiple conserved interactions of domain V of the elongation factor with the SB in both systems (Spahn et al, 2004; Connell et al, 2007; Gao et al, 2009; Zhou et al, 2013; Lin et al, 2015).
In mitochondria, domain V of mtEFG1 closely associates with the GTPase‐associated center of the mitoribosome in a manner similar to bacterial EFG (Fig 3). Intriguingly, mtEFG1 binding to the GAC triggers a concerted and directed downward motion of the SB including 16S rRNA H43, H44 as well as uL11m by on average 5 Å (Fig 3B and C). This movement is restricted to the SB as surrounding ribosomal elements are unaffected by factor binding (Fig 3C). SB motion results in a closure of the GAC on domain V of mtEFG1 establishing a large network of interactions that can be roughly clustered into 5 areas tightly connecting the SRL, uL11m‐NTD, 16S rRNA helices H43, H44, and H89, and mtEFG1 domain V (Fig 3D and E). Considering that bacterial EFG becomes translocation competent upon conversion from a weakly to a tightly bound state, it is thus tempting to speculate that the observed closure of the mitoribosomal stalk base onto domain V of mtEFG1 may facilitate the progression to the tightly bound conformation. The rearrangement of the GAC appears to be factor‐specific as we fail to detect similar motions either in the mitochondrial translation initiation complex containing mitochondrial initiation factor 2 (mtIF2) or in the mitochondrial ribosome in the absence of a translational GTPase (Figs 3B and EV4A) (Greber et al, 2015; Kummer et al, 2018). Sandwiching of mtEFG1 domain V between the SB and SRL could serve to stabilize the orientation of the G domain and its catalytic motifs at the SRL in order to promote efficient GTP hydrolysis and to delay subsequent release of inorganic phosphate (Fig 3D and E). These observations may be generally applicable to explain why EFG differs in its mode of action from other translational GTPases. Translational GTPases are usually active in the GTP‐bound form and use the energy of GTP hydrolysis to leave the ribosome. However, EFG exerts translocation activity in the post‐hydrolysis GDP‐Pi state as GTP hydrolysis is much faster than tRNA repositioning (Rodnina et al, 1997; Savelsbergh et al, 2000b, 2003; Seo et al, 2006; Belardinelli et al, 2016). Closure of the GAC around mtEFG1 domain V and a subsequent stabilization of the G domain on the SRL could be an EFG‐specific means to prolong the lifetime of the active GDP‐Pi state and to prevent premature dissociation of the factor.
Figure 3. mtEFG1 binding induces a concerted motion in the stalk base of the ribosomal GTPase‐associated center.
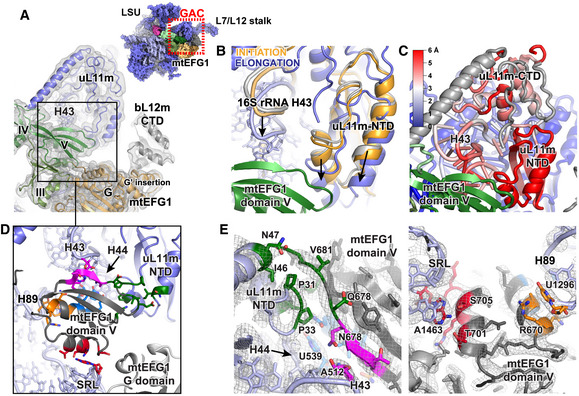
- The interaction of mtEFG1 in the POST state with the GTPase‐associated center (GAC) via domain V and with a bL12m‐CTD monomer (gray) via the G domain are shown (view from the subunit interface onto the LSU). The respective area is highlighted on the inset as red box. mtEFG1 domains are indicated according to the color code introduced in Fig 2D. The corresponding EM density is depicted low‐pass filtered to 5 Å and at σ = 2.5.
- The positions of the uL11m N‐terminal domain (NTD) and 16S rRNA helices H43 and H44 that form the stalk base of the GAC experience a downward motion upon binding of mtEFG1 (violet) but not upon binding of mtIF2 (orange, pdb: 6GAW; Kummer et al, 2018) or in the factor‐free ribosome (gray, pdb: 5AJ4 Greber et al, 2015). Complexes have been superimposed using the 16S rRNA of the LSU. The arrows display the direction of motion.
- The magnitude of the downward motion of the stalk base comparing the mtIF2‐bound and mtEFG1‐bound mitoribosome has been calculated in Å, and the stalk base components have been colored accordingly. Elements rebuilt in the current model were excluded from the calculation and are shown in gray.
- An enlarged view of the area in the black box of Fig 3A is shown. mtEFG1 domain V extensively interacts with multiple elements of the GAC at 5 sites that have been color‐coded. The orange, pink, and blue clusters interact with 16S rRNA helices H89, H43 and H44, respectively. The red cluster stacks onto the tip of the sarcin–ricin loop (SRL), and the green cluster contacts the uL11m N‐terminal domain (NTD).
- Close‐ups of the five interaction sites of mtEFG1 domain V with the SRL (red), uL11m‐NTD (green), 16S rRNA helices H43 (magenta), H44 (blue), and H89 (orange). The respective EM densities of the POST state are shown at σ = 4.
Figure EV4. Overview of the GAC in the mitochondrial elongation and initiation complexes.
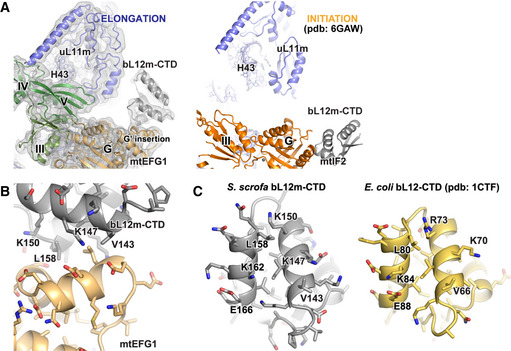
- 16S rRNA of the LSU in the initiation and elongation complexes has been superimposed to enable a direct comparison of both complexes using the exactly same view. The different interaction sites of the bL12m‐CTD on mtEFG1 (color‐coded according to Fig 2D) and mtIF2 (orange) are visible. Moreover, it becomes apparent that mtEFG1 engages in a close interaction with H43 of 16S rRNA as well as uL11m, leading to a downward motion of these elements onto the factor. In contrast, mtIF2 does not contact these elements in the initiation complex.
- A Phyre2 model of the bL12m‐CTD has been rigid‐body fitted into the EM density of the POST state. The interaction site of the bL12m‐CTD (gray) with the G′ insertion of the G domain of mtEFG1 is shown (light orange).
- For comparison, the interfaces of bL12m‐CTD (S. scrofa, gray) and bL12‐CTD (E. coli, yellow, pdb: 1CTF Leijonmarck & Liljas, 1987) that contact the mitochondrial or bacterial elongation factor, respectively, are shown. Key residues for interaction with the G domain of translational GTPases are conserved.
In addition to SB rearrangement, we find a monomer of the bL12m‐CTD associated with the G′ subdomain of the mtEFG1 G domain (Figs 3A and EV4A and B). The C‐terminal domains (CTDs) of bL12m are mobile elements of the ribosomal L7/L12 stalk, and their function is not fully understood. The bacterial bL12‐CTD has been assigned multiple roles in promotion of factor binding, GTPase activation, as well as Pi release (Savelsbergh et al, 2000b, 2005; Mohr et al, 2002; Diaconu et al, 2005). Interactions of the mitochondrial bL12m‐CTD have already been observed with the G domain of mtIF2 during translation initiation (Kummer et al, 2018). Binding occurs in both cases via a highly conserved surface on the bL12m‐CTD but different sites are used on the G domains of mtEFG1 and mtIF2, as the G′ insertion is not present in mtIF2 (Fig EV4A) (Helgstrand et al, 2007; Gao et al, 2009). It has been reported that E. coli EFG is unable to support translocation on mitochondrial ribosomes and this inability was attributed to an incompatibility of the mitochondrial bL12m‐CTD with bacterial EFG (Denslow & O'Brien, 1979; Eberly et al, 1985; Terasaki et al, 2004). However, we do not find bL12m‐CTD to engage with mtEFG1 in a different manner as compared to the bacterial system (Gao et al, 2009; Tourigny et al, 2013; Zhou et al, 2013). As the interaction surface of the bL12m‐CTD is in addition highly conserved, it remains to be clarified whether and how the bL12m‐CTD selects against bacterial translation elongation factor in mitochondrial translation (Fig EV4B and C).
Decreased susceptibility of mtEFG1 to fusidic acid is likely caused by an insertion in switch 1
Fusidic acid (FA) is an antibiotic that is used to treat bacterial infections of the skin or methicillin‐resistant S. aureus (MRSA) in the clinics. It targets bacterial EFG by binding to an interdomain pocket between the G domain and domain III. Here, it inhibits translation by preventing conformational changes in EFG after GTP hydrolysis and Pi release leading to a trapping of EFG‐GDP on the ribosome (Bodley & Lin, 1970; Gao et al, 2009). FA binding requires loosening of the catalytically important switch 1 loop of the EFG G domain, as FA would sterically clash with switch 1 at its binding site (Gao et al, 2009). Switch 1 is conserved in all translational GTPases and senses the nucleotide state via coordination of a Mg2+ ion and two water molecules with the β‐ and γ‐phosphates of the bound GTP molecule.
Strikingly, the translocation activity of mtEFG1 has been shown to be markedly less susceptible to FA than its bacterial counterpart, requiring a 10‐ to 100‐fold higher concentration for FA action (Chung & Spremulli, 1990; Bhargava et al, 2004). In accordance, using FA at concentrations similar to the ones that prevent dissociation of bacterial EFG from the ribosome, we do not see mtEFG1 trapped on the mitochondrial ribosome in presence of GTP in our in vitro reconstitution system (Ramrath et al, 2013). A likely explanation for FA insensitivity is that FA simply fails to bind mtEFG1 at these concentrations (0.5 mM FA + 1 μM mtEFG1) to exert its inhibitory function, and therefore, the factor undergoes a functional GTPase cycle and dissociates from the ribosome. Interestingly, many residues lining the binding pocket of FA are conserved in mtEFG1 including residues that have been shown to confer resistance to FA in the bacterial system upon mutation (Fig 4A, B) (Hansson et al, 2005; Gao et al, 2009; Ticu et al, 2011). Therefore, differences in the primary sequence of mtEFG1 are unlikely to cause the different susceptibility of the bacterial and mitochondrial factors (Bhargava et al, 2004). Based on our structure, we propose an alternative explanation for FA resistance due to an increased stabilization of switch 1 in mtEFG1 (Atkinson & Baldauf, 2011). In our reconstructions, we find that the density for switch 1 is very well defined in contrast to a number of reports on bacterial ribosome‐bound EFGs that either lack switch 1 density or report conflicting switch 1 conformations in the presence of non‐hydrolyzable GTP analogues (Fig 4C) (Chen et al, 2013; Pulk & Cate, 2013; Tourigny et al, 2013; Zhou et al, 2014; Li et al, 2015; Lin et al, 2015). The reason for the apparently higher stability is likely a well‐conserved 3 amino acid insertion in switch 1 of mtEFG1 that carries two positively charged lysine residues K80 and K82 (Fig 4B) (Atkinson & Baldauf, 2011). These two lysines form salt bridges with the phosphate backbone of the SRL and probably account for an additional stability of the switch 1 fold, thereby preventing FA from binding in a pocket that only becomes available when switch 1 residues move out of the way (Fig 4C).
Figure 4. Increased stability of switch 1 may prevent mtEFG1 inhibition by fusidic acid.
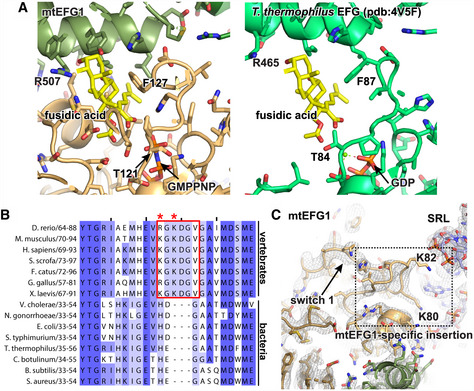
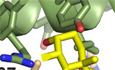
- Fusidic acid (yellow) has been modeled into its predicted binding site in mtEFG1 by superimposing a T. thermophilus model (pdb: 4V5F Gao et al, 2009). Critical residues for FA function are indicated. T121 and G127 correspond to T84 and F87 in T. thermophilus. The ordered conformation of switch 1 likely prevents binding of FA to mtEFG1. The bacterial structure, in which FA binding only occurs when switch 1 is disordered, is shown for comparison on the right (pdb:4V5F (Gao et al, 2009).
- Clustal Omega sequence alignment of the switch 1 region that contains the mtEFG1‐specific insertion from different vertebrate and bacterial species. Coloring was done according to percent identity in Jalview. The insert and K80 and K82 are highlighted with a red box or red asterisks, respectively.
- Switch 1 in the POST state is shown with the corresponding EM density at σ = 4. The position of the mtEFG1‐specific insertion with conserved K80 and K82 is boxed.
Mitoribosome‐specific elements compensate for the rigidity of a reduced L1 stalk
In the bacterial and eukaryotic system, tRNA repositioning from the ribosomal P to the E site is facilitated by interactions between the elbow region of the tRNA and the L1 stalk (Valle et al, 2003; Spahn et al, 2004; Fei et al, 2008, 2009; Fischer et al, 2010; Ramrath et al, 2013; Tourigny et al, 2013; Zhou et al, 2013; Mohan & Noller, 2017; Mace et al, 2018). The L1 stalk is a highly mobile ribosomal element composed of ribosomal RNA and the protein uL1, and its motions have been shown to be correlated with intersubunit rotation and tRNA translocation (Fei et al, 2008; Agirrezabala et al, 2012; Bock et al, 2013; Ning et al, 2014). Eventually, transition of the L1 stalk from a closed (inward‐facing) to an open (outward‐facing) conformation controls ejection of the tRNA from the ribosomal E site at the end of the translocation reaction (Trabuco et al, 2010; Ning et al, 2014). As a consequence of the evolutionary reduction of rRNA, the mammalian mitochondrial ribosome lacks the 16S rRNA segments (H76/H77) of the L1 stalk that bind the elbow region of tRNAs positioned in the E site of the bacterial and eukaryotic cytosolic ribosomes (Brown et al, 2014; Greber et al, 2014). Accordingly, the hinge point around which the L1 stalk moves during translocation is not conserved in mitochondria (Reblova et al, 2012). This has led to the assumption that the E site tRNA is not stabilized through contacts with the L1 stalk, resulting in a weaker binding to the mitochondrial ribosome (Sharma et al, 2003; Brown et al, 2014).
Our transit complex now provides information regarding the interaction between a mammalian mitochondrial tRNA and the mitoribosomal E site. In our reconstruction, the L1 stalk indeed does not engage with E site tRNA but remains in a rather static position, presumably due to the absence of a conformationally flexible rRNA hinge point in its base (Fig 5A and B). However, our EM density indicates that the lack of L1 stalk flexibility has been compensated for by a new protein element that emanates from the L1 stalk tip and connects with the mitoribosome‐specific P finger (mL40/mL48) and ribosomal protein mL64. We find that this element moves in response to the absence or presence of an E site tRNA and that it contacts the tRNA elbow region in our transit state (Fig 5B). Intriguingly, mammalian mitochondrial tRNAs possess a highly degenerate elbow region that may not permit conventional L1 stalk interactions and whose binding may instead be realized by a mitochondrial‐specific element (Sharma et al, 2003; Brown et al, 2014). Although we could not unambiguously assign the observed density to a protein due to lower resolution of the reconstruction in this area, putative candidate proteins that may contribute to the unknown element are the C‐terminus of mL64 or a mitochondrial‐specific N‐terminal extension of uL1m. Moreover, it is also conceivable that mitoribosomes may have acquired a yet unidentified, additional protein to compensate for loss of L1 functionality. Recently, such an additional protein component, mL108, has for example been identified in the L1 stalk of the fungal mitoribosome (preprint: Itoh et al, 2020).
Figure 5. A mitochondria‐specific element may compensate for loss of function of the L1 stalk.
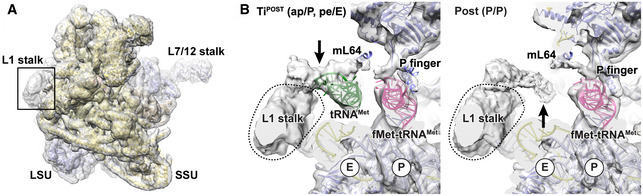
- Overview of the POST state to indicate the L1 stalk location (box) on the LSU (violet). The SSU is shown in yellow.
- Close‐up of the L1 stalk region on the LSU: EM densities for the TiPOST state and POST state are shown without postprocessing. The position of the immobile L1 stalk is indicated by a dashed line. The mobile element that may replace L1 function is indicated with an arrow. Models for the LSU (violet) as well as aminoacylated fMet‐tRNAMet (pink) and deacylated tRNAMet (green) are included.
Conclusion
In this work, we present the structures of elongation complexes from mammalian mitochondria at two different steps of the translocation reaction. Our data show that mitochondrial ribosomes translocate the mRNA‐tRNA module using conserved motions of the ribosomal small subunit and highly conserved features in mitochondrial elongation factor G1. We find that mtEFG1 does not only control conformational changes in the SSU to promote tRNA movement but also leads to large rearrangements within the GTPase‐associated center of the mitochondrial LSU (Fig 6). Our findings imply a mechanism by which mtEFG1 binding leads to closure of the GAC that stabilizes mtEFG1 from a weakly to a tightly bound state that is translocation competent.
Figure 6. Model for mtEFG1‐catalyzed mRNA‐tRNA translocation in mammalian mitochondria.
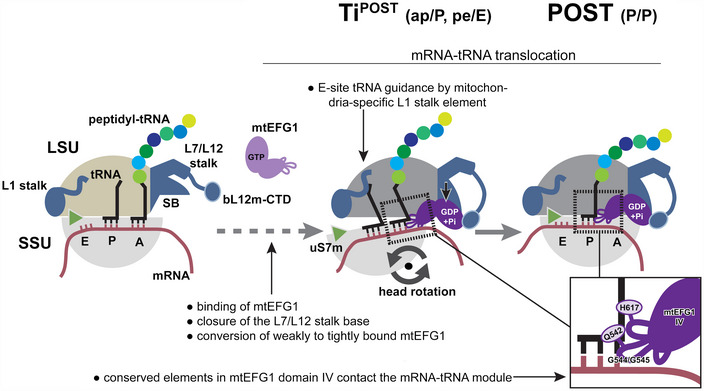
Following peptide bond formation, mtEFG1 is likely recruited to the ribosome by interaction with the bL12m‐CTD to catalyze translocation of the mRNA‐tRNA module. mtEFG1 binding to the ribosome induces a closure of the L7/L12 stalk base (SB), which converts mtEFG1 from a weakly to a tightly bound state that is translocation competent. Here, closure of the SB may be required to prolong the lifetime of the active GDP‐Pi state of mtEFG1. mRNA‐tRNA movement depends on large‐scale motions of the ribosome. Swiveling of the head repositions the tRNAs on the SSU ‐ the deacylated P site tRNA moves into the chimeric pe position and the peptidyl‐tRNA in the A site into the ap position, respectively. Translocation is completed upon backrotation and backswiveling of the SSU body and head, respectively, which positions the peptidyl‐tRNA into the classical P/P conformation. mtEFG1 contains highly conserved elements at the tip of domain IV that are required for interaction with the tRNA backbone and the minor groove of the mRNA‐tRNA module. Domain IV maintains these contacts throughout the translocation process. The dashed arrow indicates that in analogy to the bacterial system likely multiple additional translocation intermediates exist preceding the ones visualized in this study.
We show that the interaction site of mtEFG1 with the mRNA‐tRNA module, which serves to maintain the reading frame during translocation, is highly conserved. Strikingly, many of the highly conserved amino acids that recognize the codon–anticodon interacting mRNA/tRNA are absent in the second mitochondrial elongation factor G2, rationalizing why it is unable to promote efficient translocation (Fig EV3C) (Tsuboi et al, 2009). Such specialization is possible since a different region of EFG is critical for ribosome recycling in bacteria (Gao et al, 2007), and therefore, it appears that mtEFG1 and mtEFG2 become specialized for interaction with the corresponding ligands, mRNA‐tRNA in elongation and RRF in recycling, and are no more able to participate in both activities.
We also recognized the role of a mtEFG1‐specific insertion in the catalytically important switch 1 region of the G domain and discuss its involvement in the decreased susceptibility of mtEFG1 to the translocation inhibitor fusidic acid. Finally, we have been able to visualize a protein element in the mammalian mitoribosome that appears to compensate for loss of functionality of the otherwise highly conserved ribosomal L1 stalk, which plays a crucial role in translocation and ejection of tRNA in the bacterial and eukaryotic system. In summary, our study provides the structural basis to understand the extent of conservation and diversification of molecular mechanisms that govern mammalian mitochondrial translation elongation. Our data may furthermore aid to rationalize reported mutations in human mtEFG1 that cause combined oxidative phosphorylation deficiency 1 (COXPD1)—a fatal mitochondrial disease leading to early and rapidly progressive hepatoencephalopathy (Coenen et al, 2004; Valente et al, 2007; Smits et al, 2011; Kohda et al, 2016).
Materials and Methods
Purification of mtEFG1 and ribosomal subunit
The open reading frame for mtEFG1 was ordered from Thermo Scientific and subcloned into pET24a carrying an N‐terminal His6‐tag, a TEV cleavage site and a GGSGSG linker. The protein was expressed in E. coli BL21 (DE3) at 18°C overnight. mtEFG1 was affinity purified using a HisTrap FF 5 ml column (GE Healthcare) using standard buffers as described in (Kummer et al, 2018). After removal of the His6‐tag upon incubation with TEV‐His6 protease overnight at 4°C, uncleaved mtEFG1, the His6‐tag, and TEV‐His6 protease were removed by reverse Ni2+‐based affinity chromatography using a HisTrap FF 5 ml column. Eventually, mtEFG1 was buffer exchanged into storage buffer (40 mM HEPES‐KOH pH 7.6, 200 mM KCl, 40 mM MgCl2, 1 mM DTT, 10% (w/v) glycerol) by size exclusion chromatography using a Superdex200 16/600 column (GE Healthcare). Aliquots of mtEFG1 were flash frozen in liquid nitrogen and stored at −80°C until further use. Mitoribosomal subunits were prepared according to published protocols and used for complex formation immediately after purification (Kummer et al, 2018).
Preparation of mitochondrial fMet‐tRNAMet
Formylated and aminoacylated fMet‐tRNAMet was produced following published protocols (Kummer et al, 2018). In brief, mitochondrial tRNAMet was generated via run‐off T7 transcription and hammerhead ribozyme cleavage. The RNA fragment was purified via agarose gel electrophoresis, folded in the presence of 10 mM MgCl2, aminoacylated and formylated in vitro, and purified via phenol‐chloroform extraction. Aliquots were flash frozen and stored at −80°C.
Elongation complex formation
Elongation complexes were assembled in 1× monosome buffer (20 mM HEPES‐KOH pH 7.6, 100 mM KCl, 40 mM MgCl2, 1 mM DTT, 50 μM spermine) by mixing 60 nM 28S small ribosomal subunit with 1 μM fMet‐tRNAMet and 5 μM hexanucleotide (CUGAUG, Microsynth). After incubation for 3 min at 37°C, 60 nM of 39S large ribosomal subunit were added and 55S complex formation was allowed to proceed for 6 more min at 37°C. Subsequently, 1 μM of mtEFG1 premixed with 0.5 mM GMPPNP was added to the mixture and incubated for 3 min at 37°C. The sample was stored at least 10 min on ice before vitrification. The sample was then applied to glow‐discharged Quantifoil R2/2 grids coated with a continuous carbon film and vitrified in 1:2 ethane/propane mixture using a Vitrobot Mark IV (FEI).
Of note: The short CUGAUG oligo and mtRNAMet were used for reconstitution due to their efficient binding to the SSU and the elevated propensity of mtRNAMet to bind to the mitoribosomal P site due to a 3× CG base pair in its anticodon stem loop that interacts with the conserved P site G782/A783 ridge. Slightly longer mRNA oligonucleotides were less efficiently bound to the mitoribosomal SSU during in vitro reconstitution. Originally, we did not anticipate the non‐canonical interaction of the mtRNAMet with the CUG codon in the TiPOST state but it is likely possible due to the tighter binding of the mtRNAMet to the conserved P site elements.
Of note: Swine and human mitochondrial EFG1 are highly similar with 91.7% identity and 96.7% similarity in their primary sequences indicating their strong functional conservation. Therefore, we decided to reconstitute the mammalian mitochondrial translation elongation complex as a chimeric system using porcine mitochondrial ribosomes and human mtEFG1 and fMet‐tRNAMet so that the results would be more applicable to the scientist interested in the human system.
Data collection and image processing
Data were collected in movie mode on a FEI Titan Krios equipped with a Falcon III DED (FEI) at 300 kV and a total dose of 40 e‐/Å2. The dose was distributed over 16 frames during a 0.82 s exposure using EPU version 1.9.0.30REL (FEI). Images were recorded at a magnification of 100,719× and a defocus range of −0.5 to −2.7 μm. Alignment, summation, and dose weighting of movie frames were done in 5 × 5 patches using MOTIONCOR2 (Grant & Grigorieff, 2015; Zheng et al, 2017). CTF estimation was performed in GCTF (Zhang, 2016), and particles were picked using the Laplacian‐of‐Gaussian function implemented in Relion 3.1 with a minimum particle diameter of 250 Å, a maximum diameter of 350 Å, and a threshold of 0 (Scheres, 2012; Zivanov et al, 2018). All further steps were carried out in Relion 3.1 using 4× binned particle images starting with a reference‐free 2D classification that yielded 838 311 particles, which underwent subsequent unsupervised 3D classification using the 55S mitoribosome (excluding A and P site tRNAs) as a reference (Greber et al, 2015). 55S particles containing clear density for mtEFG1 were selected and 3D autorefined. A mask around mtEFG1 and P site tRNA was applied during the following 3D classification without alignment of particle images to differentiate varying occupancy or conformation of mtEFG1 among the selected particles. The class that displayed the sharpest features for mtEFG1 was selected and further 3D autorefined using unbinned images. After one round of CTF refinement, another 3D classification including the alignment of particle images was done, which unraveled two distinct classes corresponding to POST and TiPOST states. Both classes were 3D autorefined separately. Postprocessing in Relion3.0 yielded a final resolution of 3.0 Å for the POST state and 4.2 Å for the TiPOST state. Please see Fig EV1 for an overview of the particle classification process.
Structure building and refinement
The structures of the 39S large ribosomal subunit, head, and body domains of the 28S small ribosomal subunit as well as fMet‐tRNAMet were derived from the 55S initiation complex and fitted separately into the EM densities of the POST or TiPOST states (pdb: 6GAW Kummer et al, 2018). A homology model of mtEFG1 was generated from pdb 4WQF (Lin et al, 2015) using Phyre2 (Kelley et al, 2015) and fitted into the EM densities. Model fitting was performed in UCSF chimera. The models were rebuilt and adjusted in COOT (Emsley et al, 2010) to describe the EM densities of both states more accurately. This involved especially mtEFG1, the GTPase‐associated center, the decoding center, the central protuberance, and the tRNAs in both states. A homology model of the uL12m‐CTD was generated from pdb 1CTF (Leijonmarck & Liljas, 1987) using Phyre2 and fitted into the corresponding density. Manual model building was followed by real‐space refinement in PHENIX using default restraints (Ramachandran plot, C‐beta deviations, rotamer, secondary structure) and global minimization, as well as B‐factor refinement for 5 iterations with a weight between experimental data and restraints of wxc = 1.0 (Afonine et al, 2018). For the better‐resolved POST state, local rotamer fitting was applied in addition. Resolution estimation (Fig EV5A), particle distribution (Fig EV5B), local resolution plots (Fig EV5C), and the model validation are provided in Fig EV5 and Table EV1, respectively. A list of RNA and protein components of the complexes is provided in Table EV2.
Figure EV5. Map evaluation.
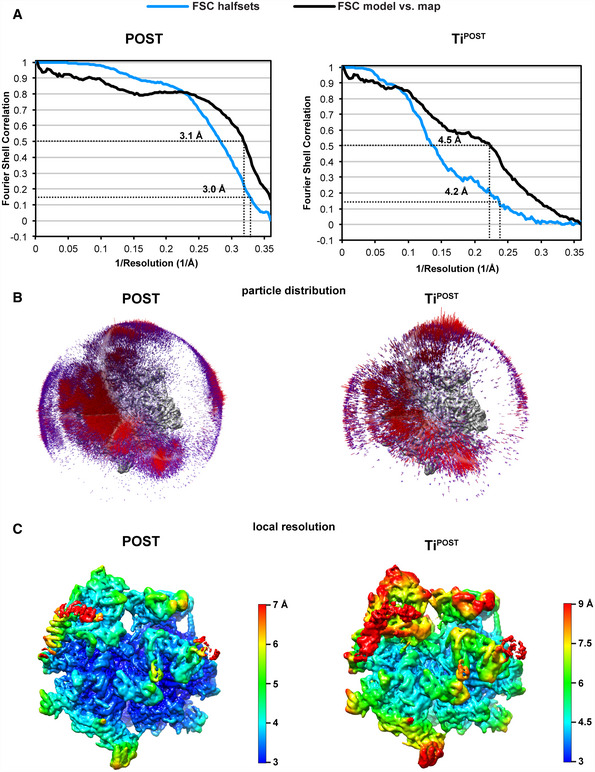
- FSC curves of the halfsets and model versus map for both states are shown with the dashed lines indicating the respective resolution estimates at 0.143 and 0.5 FSC. Curves are plotted until Nyquist (2.78 Å or 0.36 Å−1).
- The particle distribution in the final reconstructions is shown superimposed onto the corresponding EM densities.
- Local resolution estimation was done using the implemented algorithm in RELION 3.1 and has been plotted onto unpostprocessed maps for both states (Zivanov et al, 2018).
Figure generation
Graphics were generated in PyMOL (Schroedinger), UCSF Chimera or USCF ChimeraX (Pettersen et al, 2004; Goddard et al, 2018).
Author contributions
Project conceptualization: EK, NB; Sample preparation for EM data collection, data acquisition, calculation of EM reconstructions, building and validation of the structural models, structural data interpretation, figure preparation, and manuscript writing: EK; Structural data interpretation and manuscript revision: NB.
Conflict of interest
The authors declare that they have no conflict of interest.
Supporting information
Expanded View Figures PDF
Table EV1
Table EV2
Review Process File
Acknowledgements
We acknowledge the help of F. Gherlone during mtEFG1 purification, preparation of ribosomal subunits, and initial EM screening. We would like to thank D. Boehringer and S. Mattei for support during EM data acquisition as well as the ScopeM staff for technical support. We are grateful to A. Scaiola for IT support and S. Mattei for discussions. We thank M. Leibundgut for critical reading of the manuscript. We would like to thank D. Ramrath for providing the script to calculate and color code the displacements shown in Figs 1C and 3C. E.K. was supported by an EMBO long‐term fellowship (1196‐2014). This work was supported by the Swiss National Science Foundation grant (310030B_163478) and via the National Centre of Excellence in RNA and Disease and project funding 138262 to N.B.
The EMBO Journal (2020) 39: e104820
Data availability
The cryo‐EM density maps have been deposited in the Electron Microscopy Data Bank: accession number EMD‐10779 (https://www.ebi.ac.uk/pdbe/entry/emdb/EMD-10779) for the TiPOST state and EMD‐10778 (https://www.ebi.ac.uk/pdbe/entry/emdb/EMD-10778) for the POST state. Atomic models have been deposited in the Protein Data Bank (https://www.rcsb.org/): accession number PDB ID 6YDW for the TiPOST state and PDB ID 6YDP for the POST state. Requests for materials should be addressed to N.B. (ban@mol.biol.ethz.ch).
References
- Abdi NM, Fredrick K (2005) Contribution of 16S rRNA nucleotides forming the 30S subunit A and P sites to translation in Escherichia coli . RNA 11: 1624–1632 [DOI] [PMC free article] [PubMed] [Google Scholar]
- Adio S, Senyushkina T, Peske F, Fischer N, Wintermeyer W, Rodnina MV (2015) Fluctuations between multiple EF‐G‐induced chimeric tRNA states during translocation on the ribosome. Nat Commun 6: 7442 [DOI] [PMC free article] [PubMed] [Google Scholar]
- Afonine PV, Poon BK, Read RJ, Sobolev OV, Terwilliger TC, Urzhumtsev A, Adams PD (2018) Real‐space refinement in PHENIX for cryo‐EM and crystallography. Acta Crystallogr D Struct Biol 74(Pt 6): 531–544 [DOI] [PMC free article] [PubMed] [Google Scholar]
- Agirrezabala X, Liao HY, Schreiner E, Fu J, Ortiz‐Meoz RF, Schulten K, Green R, Frank J (2012) Structural characterization of mRNA‐tRNA translocation intermediates. Proc Natl Acad Sci USA 109: 6094–6099 [DOI] [PMC free article] [PubMed] [Google Scholar]
- Agrawal RK, Penczek P, Grassucci RA, Frank J (1998) Visualization of elongation factor G on the Escherichia coli 70S ribosome: the mechanism of translocation. Proc Natl Acad Sci USA 95: 6134–6138 [DOI] [PMC free article] [PubMed] [Google Scholar]
- Atkinson GC, Baldauf SL (2011) Evolution of elongation factor G and the origins of mitochondrial and chloroplast forms. Mol Biol Evol 28: 1281–1292 [DOI] [PubMed] [Google Scholar]
- Belardinelli R, Sharma H, Caliskan N, Cunha CE, Peske F, Wintermeyer W, Rodnina MV (2016) Choreography of molecular movements during ribosome progression along mRNA. Nat Struct Mol Biol 23: 342–348 [DOI] [PubMed] [Google Scholar]
- Bhargava K, Templeton P, Spremulli LL (2004) Expression and characterization of isoform 1 of human mitochondrial elongation factor G. Protein Expr Purif 37: 368–376 [DOI] [PubMed] [Google Scholar]
- Bock LV, Blau C, Schroder GF, Davydov II, Fischer N, Stark H, Rodnina MV, Vaiana AC, Grubmuller H (2013) Energy barriers and driving forces in tRNA translocation through the ribosome. Nat Struct Mol Biol 20: 1390–1396 [DOI] [PubMed] [Google Scholar]
- Bodley JW, Lin L (1970) Interaction of E. coli G factor with the 50S ribosomal subunit. Nature 227: 60–61 [DOI] [PubMed] [Google Scholar]
- Brilot AF, Korostelev AA, Ermolenko DN, Grigorieff N (2013) Structure of the ribosome with elongation factor G trapped in the pretranslocation state. Proc Natl Acad Sci USA 110: 20994–20999 [DOI] [PMC free article] [PubMed] [Google Scholar]
- Brown A, Amunts A, Bai XC, Sugimoto Y, Edwards PC, Murshudov G, Scheres SHW, Ramakrishnan V (2014) Structure of the large ribosomal subunit from human mitochondria. Science 346: 718–722 [DOI] [PMC free article] [PubMed] [Google Scholar]
- Cameron DM, Thompson J, Gregory ST, March PE, Dahlberg AE (2004) Thiostrepton‐resistant mutants of Thermus thermophilus . Nucleic Acids Res 32: 3220–3227 [DOI] [PMC free article] [PubMed] [Google Scholar]
- Chen Y, Feng S, Kumar V, Ero R, Gao YG (2013) Structure of EF‐G‐ribosome complex in a pretranslocation state. Nat Struct Mol Biol 20: 1077–1084 [DOI] [PubMed] [Google Scholar]
- Chen C, Cui X, Beausang JF, Zhang H, Farrell I, Cooperman BS, Goldman YE (2016) Elongation factor G initiates translocation through a power stroke. Proc Natl Acad Sci USA 113: 7515–7520 [DOI] [PMC free article] [PubMed] [Google Scholar]
- Chung HK, Spremulli LL (1990) Purification and characterization of elongation factor G from bovine liver mitochondria. J Biol Chem 265: 21000–21004 [PubMed] [Google Scholar]
- Coenen MJ, Antonicka H, Ugalde C, Sasarman F, Rossi R, Heister JG, Newbold RF, Trijbels FJ, van den Heuvel LP, Shoubridge EA et al (2004) Mutant mitochondrial elongation factor G1 and combined oxidative phosphorylation deficiency. N Engl J Med 351: 2080–2086 [DOI] [PubMed] [Google Scholar]
- Connell SR, Takemoto C, Wilson DN, Wang H, Murayama K, Terada T, Shirouzu M, Rost M, Schuler M, Giesebrecht J et al (2007) Structural basis for interaction of the ribosome with the switch regions of GTP‐bound elongation factors. Mol Cell 25: 751–764 [DOI] [PubMed] [Google Scholar]
- Denslow ND, O'Brien TW (1979) Elongation factors EF‐G from E. coli and mammalian mitochondria are not functionally interchangeable. Biochem Biophys Res Commun 90: 1257–1265 [DOI] [PubMed] [Google Scholar]
- Diaconu M, Kothe U, Schlunzen F, Fischer N, Harms JM, Tonevitsky AG, Stark H, Rodnina MV, Wahl MC (2005) Structural basis for the function of the ribosomal L7/12 stalk in factor binding and GTPase activation. Cell 121: 991–1004 [DOI] [PubMed] [Google Scholar]
- Eberly SL, Locklear V, Spremulli LL (1985) Bovine mitochondrial ribosomes. Elongation factor specificity. J Biol Chem 260: 8721–8725 [PubMed] [Google Scholar]
- Emsley P, Lohkamp B, Scott WG, Cowtan K (2010) Features and development of Coot. Acta Crystallogr D Biol Crystallogr 66(Pt 4): 486–501 [DOI] [PMC free article] [PubMed] [Google Scholar]
- Fei J, Kosuri P, MacDougall DD, Gonzalez RL Jr (2008) Coupling of ribosomal L1 stalk and tRNA dynamics during translation elongation. Mol Cell 30: 348–359 [DOI] [PubMed] [Google Scholar]
- Fei J, Bronson JE, Hofman JM, Srinivas RL, Wiggins CH, Gonzalez RL Jr (2009) Allosteric collaboration between elongation factor G and the ribosomal L1 stalk directs tRNA movements during translation. Proc Natl Acad Sci USA 106: 15702–15707 [DOI] [PMC free article] [PubMed] [Google Scholar]
- Fischer N, Konevega AL, Wintermeyer W, Rodnina MV, Stark H (2010) Ribosome dynamics and tRNA movement by time‐resolved electron cryomicroscopy. Nature 466: 329–333 [DOI] [PubMed] [Google Scholar]
- Frank J, Agrawal RK (2001) Ratchet‐like movements between the two ribosomal subunits: their implications in elongation factor recognition and tRNA translocation. Cold Spring Harb Symp Quant Biol 66: 67–75 [DOI] [PubMed] [Google Scholar]
- Gao N, Zavialov AV, Ehrenberg M, Frank J (2007) Specific interaction between EF‐G and RRF and its implication for GTP‐dependent ribosome splitting into subunits. J Mol Biol 374: 1345–1358 [DOI] [PMC free article] [PubMed] [Google Scholar]
- Gao YG, Selmer M, Dunham CM, Weixlbaumer A, Kelley AC, Ramakrishnan V (2009) The structure of the ribosome with elongation factor G trapped in the posttranslocational state. Science 326: 694–699 [DOI] [PMC free article] [PubMed] [Google Scholar]
- Goddard TD, Huang CC, Meng EC, Pettersen EF, Couch GS, Morris JH, Ferrin TE (2018) UCSF ChimeraX: meeting modern challenges in visualization and analysis. Protein Sci 27: 14–25 [DOI] [PMC free article] [PubMed] [Google Scholar]
- Grant T, Grigorieff N (2015) Measuring the optimal exposure for single particle cryo‐EM using a 2.6 A reconstruction of rotavirus VP6. Elife 4: e06980 [DOI] [PMC free article] [PubMed] [Google Scholar]
- Greber BJ, Boehringer D, Leibundgut M, Bieri P, Leitner A, Schmitz N, Aebersold R, Ban N (2014) The complete structure of the large subunit of the mammalian mitochondrial ribosome. Nature 515: 283–286 [DOI] [PubMed] [Google Scholar]
- Greber BJ, Bieri P, Leibundgut M, Leitner A, Aebersold R, Boehringer D, Ban N (2015) Ribosome. The complete structure of the 55S mammalian mitochondrial ribosome. Science 348: 303–308 [DOI] [PubMed] [Google Scholar]
- Guo Z, Noller HF (2012) Rotation of the head of the 30S ribosomal subunit during mRNA translocation. Proc Natl Acad Sci USA 109: 20391–20394 [DOI] [PMC free article] [PubMed] [Google Scholar]
- Hammarsund M, Wilson W, Corcoran M, Merup M, Einhorn S, Grander D, Sangfelt O (2001) Identification and characterization of two novel human mitochondrial elongation factor genes, hEFG2 and hEFG1, phylogenetically conserved through evolution. Hum Genet 109: 542–550 [DOI] [PubMed] [Google Scholar]
- Hansson S, Singh R, Gudkov AT, Liljas A, Logan DT (2005) Structural insights into fusidic acid resistance and sensitivity in EF‐G. J Mol Biol 348: 939–949 [DOI] [PubMed] [Google Scholar]
- Harms JM, Wilson DN, Schluenzen F, Connell SR, Stachelhaus T, Zaborowska Z, Spahn CM, Fucini P (2008) Translational regulation via L11: molecular switches on the ribosome turned on and off by thiostrepton and micrococcin. Mol Cell 30: 26–38 [DOI] [PubMed] [Google Scholar]
- Helgstrand M, Mandava CS, Mulder FA, Liljas A, Sanyal S, Akke M (2007) The ribosomal stalk binds to translation factors IF2, EF‐Tu, EF‐G and RF3 via a conserved region of the L12 C‐terminal domain. J Mol Biol 365: 468–479 [DOI] [PubMed] [Google Scholar]
- Holtkamp W, Wintermeyer W, Rodnina MV (2014) Synchronous tRNA movements during translocation on the ribosome are orchestrated by elongation factor G and GTP hydrolysis. BioEssays 36: 908–918 [DOI] [PubMed] [Google Scholar]
- Itoh Y, Naschberger A, Martezaei N, Herrmann J, Amunts A (2020) Analysis of translating mitoribosome reveals functional characteristics of protein synthesis in mitochondria of fungi. bioRxiv 10.1101/2020.01.31.929331 [PREPRINT] [DOI] [PMC free article] [PubMed] [Google Scholar]
- Jenner LB, Demeshkina N, Yusupova G, Yusupov M (2010) Structural aspects of messenger RNA reading frame maintenance by the ribosome. Nat Struct Mol Biol 17: 555–560 [DOI] [PubMed] [Google Scholar]
- Kelley LA, Mezulis S, Yates CM, Wass MN, Sternberg MJ (2015) The Phyre2 web portal for protein modeling, prediction and analysis. Nat Protoc 10: 845–858 [DOI] [PMC free article] [PubMed] [Google Scholar]
- Kohda M, Tokuzawa Y, Kishita Y, Nyuzuki H, Moriyama Y, Mizuno Y, Hirata T, Yatsuka Y, Yamashita‐Sugahara Y, Nakachi Y et al (2016) A comprehensive genomic analysis reveals the genetic landscape of mitochondrial respiratory chain complex deficiencies. PLoS Genet 12: e1005679 [DOI] [PMC free article] [PubMed] [Google Scholar]
- Konevega AL, Fischer N, Semenkov YP, Stark H, Wintermeyer W, Rodnina MV (2007) Spontaneous reverse movement of mRNA‐bound tRNA through the ribosome. Nat Struct Mol Biol 14: 318–324 [DOI] [PubMed] [Google Scholar]
- Kummer E, Leibundgut M, Rackham O, Lee RG, Boehringer D, Filipovska A, Ban N (2018) Unique features of mammalian mitochondrial translation initiation revealed by cryo‐EM. Nature 560: 263–267 [DOI] [PubMed] [Google Scholar]
- Kurland CG (1992) Translational accuracy and the fitness of bacteria. Annu Rev Genet 26: 29–50 [DOI] [PubMed] [Google Scholar]
- Leijonmarck M, Liljas A (1987) Structure of the C‐terminal domain of the ribosomal protein L7/L12 from Escherichia coli at 1.7 A. J Mol Biol 195: 555–579 [DOI] [PubMed] [Google Scholar]
- Li W, Liu Z, Koripella RK, Langlois R, Sanyal S, Frank J (2015) Activation of GTP hydrolysis in mRNA‐tRNA translocation by elongation factor G. Sci Adv 1: e1500169 [DOI] [PMC free article] [PubMed] [Google Scholar]
- Lin J, Gagnon MG, Bulkley D, Steitz TA (2015) Conformational changes of elongation factor G on the ribosome during tRNA translocation. Cell 160: 219–227 [DOI] [PMC free article] [PubMed] [Google Scholar]
- Mace K, Giudice E, Chat S, Gillet R (2018) The structure of an elongation factor G‐ribosome complex captured in the absence of inhibitors. Nucleic Acids Res 46: 3211–3217 [DOI] [PMC free article] [PubMed] [Google Scholar]
- Martemyanov KA, Yarunin AS, Liljas A, Gudkov AT (1998) An intact conformation at the tip of elongation factor G domain IV is functionally important. FEBS Lett 434: 205–208 [DOI] [PubMed] [Google Scholar]
- Mohan S, Noller HF (2017) Recurring RNA structural motifs underlie the mechanics of L1 stalk movement. Nat Commun 8: 14285 [DOI] [PMC free article] [PubMed] [Google Scholar]
- Mohr D, Wintermeyer W, Rodnina MV (2002) GTPase activation of elongation factors Tu and G on the ribosome. Biochemistry 41: 12520–12528 [DOI] [PubMed] [Google Scholar]
- Munro JB, Wasserman MR, Altman RB, Wang L, Blanchard SC (2010) Correlated conformational events in EF‐G and the ribosome regulate translocation. Nat Struct Mol Biol 17: 1470–1477 [DOI] [PMC free article] [PubMed] [Google Scholar]
- Ning W, Fei J, Gonzalez RL Jr (2014) The ribosome uses cooperative conformational changes to maximize and regulate the efficiency of translation. Proc Natl Acad Sci USA 111: 12073–12078 [DOI] [PMC free article] [PubMed] [Google Scholar]
- Pan D, Kirillov SV, Cooperman BS (2007) Kinetically competent intermediates in the translocation step of protein synthesis. Mol Cell 25: 519–529 [DOI] [PMC free article] [PubMed] [Google Scholar]
- Pandit SB, Srinivasan N (2003) Survey for g‐proteins in the prokaryotic genomes: prediction of functional roles based on classification. Proteins 52: 585–597 [DOI] [PubMed] [Google Scholar]
- Peng BZ, Bock LV, Belardinelli R, Peske F, Grubmuller H, Rodnina MV (2019) Active role of elongation factor G in maintaining the mRNA reading frame during translation. Sci Adv 5: eaax8030 [DOI] [PMC free article] [PubMed] [Google Scholar]
- Pettersen EF, Goddard TD, Huang CC, Couch GS, Greenblatt DM, Meng EC, Ferrin TE (2004) UCSF Chimera–a visualization system for exploratory research and analysis. J Comput Chem 25: 1605–1612 [DOI] [PubMed] [Google Scholar]
- Pulk A, Cate JH (2013) Control of ribosomal subunit rotation by elongation factor G. Science 340: 1235970 [DOI] [PMC free article] [PubMed] [Google Scholar]
- Ramrath DJ, Lancaster L, Sprink T, Mielke T, Loerke J, Noller HF, Spahn CM (2013) Visualization of two transfer RNAs trapped in transit during elongation factor G‐mediated translocation. Proc Natl Acad Sci USA 110: 20964–20969 [DOI] [PMC free article] [PubMed] [Google Scholar]
- Ratje AH, Loerke J, Mikolajka A, Brunner M, Hildebrand PW, Starosta AL, Donhofer A, Connell SR, Fucini P, Mielke T et al (2010) Head swivel on the ribosome facilitates translocation by means of intra‐subunit tRNA hybrid sites. Nature 468: 713–716 [DOI] [PMC free article] [PubMed] [Google Scholar]
- Reblova K, Sponer J, Lankas F (2012) Structure and mechanical properties of the ribosomal L1 stalk three‐way junction. Nucleic Acids Res 40: 6290–6303 [DOI] [PMC free article] [PubMed] [Google Scholar]
- Rodnina MV, Savelsbergh A, Katunin VI, Wintermeyer W (1997) Hydrolysis of GTP by elongation factor G drives tRNA movement on the ribosome. Nature 385: 37–41 [DOI] [PubMed] [Google Scholar]
- Rodnina MV, Savelsbergh A, Matassova NB, Katunin VI, Semenkov YP, Wintermeyer W (1999) Thiostrepton inhibits the turnover but not the GTPase of elongation factor G on the ribosome. Proc Natl Acad Sci USA 96: 9586–9590 [DOI] [PMC free article] [PubMed] [Google Scholar]
- Rodnina MV (2018) Translation in prokaryotes. Cold Spring Harb Perspect Biol 10: a032664 [DOI] [PMC free article] [PubMed] [Google Scholar]
- Rodnina MV, Peske F, Peng BZ, Belardinelli R, Wintermeyer W (2019) Converting GTP hydrolysis into motion: versatile translational elongation factor G. Biol Chem 401: 131–142 [DOI] [PubMed] [Google Scholar]
- Rosendahl G, Douthwaite S (1994) The antibiotics micrococcin and thiostrepton interact directly with 23S rRNA nucleotides 1067A and 1095A. Nucleic Acids Res 22: 357–363 [DOI] [PMC free article] [PubMed] [Google Scholar]
- Savelsbergh A, Matassova NB, Rodnina MV, Wintermeyer W (2000a) Role of domains 4 and 5 in elongation factor G functions on the ribosome. J Mol Biol 300: 951–961 [DOI] [PubMed] [Google Scholar]
- Savelsbergh A, Mohr D, Wilden B, Wintermeyer W, Rodnina MV (2000b) Stimulation of the GTPase activity of translation elongation factor G by ribosomal protein L7/12. J Biol Chem 275: 890–894 [DOI] [PubMed] [Google Scholar]
- Savelsbergh A, Katunin VI, Mohr D, Peske F, Rodnina MV, Wintermeyer W (2003) An elongation factor G‐induced ribosome rearrangement precedes tRNA‐mRNA translocation. Mol Cell 11: 1517–1523 [DOI] [PubMed] [Google Scholar]
- Savelsbergh A, Mohr D, Kothe U, Wintermeyer W, Rodnina MV (2005) Control of phosphate release from elongation factor G by ribosomal protein L7/12. EMBO J 24: 4316–4323 [DOI] [PMC free article] [PubMed] [Google Scholar]
- Scheres SH (2012) RELION: implementation of a Bayesian approach to cryo‐EM structure determination. J Struct Biol 180: 519–530 [DOI] [PMC free article] [PubMed] [Google Scholar]
- Schuwirth BS, Borovinskaya MA, Hau CW, Zhang W, Vila‐Sanjurjo A, Holton JM, Cate JH (2005) Structures of the bacterial ribosome at 3.5 A resolution. Science 310: 827–834 [DOI] [PubMed] [Google Scholar]
- Selmer M, Dunham CM, Murphy FVT, Weixlbaumer A, Petry S, Kelley AC, Weir JR, Ramakrishnan V (2006) Structure of the 70S ribosome complexed with mRNA and tRNA. Science 313: 1935–1942 [DOI] [PubMed] [Google Scholar]
- Seo HS, Abedin S, Kamp D, Wilson DN, Nierhaus KH, Cooperman BS (2006) EF‐G‐dependent GTPase on the ribosome. conformational change and fusidic acid inhibition. Biochemistry 45: 2504–2514 [DOI] [PubMed] [Google Scholar]
- Seshadri A, Samhita L, Gaur R, Malshetty V, Varshney U (2009) Analysis of the fusA2 locus encoding EFG2 in Mycobacterium smegmatis . Tuberculosis 89: 453–464 [DOI] [PubMed] [Google Scholar]
- Sharma MR, Koc EC, Datta PP, Booth TM, Spremulli LL, Agrawal RK (2003) Structure of the mammalian mitochondrial ribosome reveals an expanded functional role for its component proteins. Cell 115: 97–108 [DOI] [PubMed] [Google Scholar]
- Sharma H, Adio S, Senyushkina T, Belardinelli R, Peske F, Rodnina MV (2016) Kinetics of spontaneous and EF‐G‐accelerated rotation of ribosomal subunits. Cell Rep 16: 2187–2196 [DOI] [PubMed] [Google Scholar]
- Shoji S, Walker SE, Fredrick K (2006) Reverse translocation of tRNA in the ribosome. Mol Cell 24: 931–942 [DOI] [PMC free article] [PubMed] [Google Scholar]
- Smits P, Antonicka H, van Hasselt PM, Weraarpachai W, Haller W, Schreurs M, Venselaar H, Rodenburg RJ, Smeitink JA, van den Heuvel LP (2011) Mutation in subdomain G’ of mitochondrial elongation factor G1 is associated with combined OXPHOS deficiency in fibroblasts but not in muscle. Eur J Hum Genet 19: 275–279 [DOI] [PMC free article] [PubMed] [Google Scholar]
- Spahn CM, Gomez‐Lorenzo MG, Grassucci RA, Jorgensen R, Andersen GR, Beckmann R, Penczek PA, Ballesta JP, Frank J (2004) Domain movements of elongation factor eEF2 and the eukaryotic 80S ribosome facilitate tRNA translocation. EMBO J 23: 1008–1019 [DOI] [PMC free article] [PubMed] [Google Scholar]
- Stark H, Rodnina MV, Wieden HJ, van Heel M, Wintermeyer W (2000) Large‐scale movement of elongation factor G and extensive conformational change of the ribosome during translocation. Cell 100: 301–309 [DOI] [PubMed] [Google Scholar]
- Suematsu T, Yokobori S, Morita H, Yoshinari S, Ueda T, Kita K, Takeuchi N, Watanabe Y (2010) A bacterial elongation factor G homologue exclusively functions in ribosome recycling in the spirochaete Borrelia burgdorferi . Mol Microbiol 75: 1445–1454 [DOI] [PubMed] [Google Scholar]
- Terasaki M, Suzuki T, Hanada T, Watanabe K (2004) Functional compatibility of elongation factors between mammalian mitochondrial and bacterial ribosomes: characterization of GTPase activity and translation elongation by hybrid ribosomes bearing heterologous L7/12 proteins. J Mol Biol 336: 331–342 [DOI] [PubMed] [Google Scholar]
- Thompson J, Cundliffe E, Dahlberg AE (1988) Site‐directed mutagenesis of Escherichia coli 23 S ribosomal RNA at position 1067 within the GTP hydrolysis centre. J Mol Biol 203: 457–465 [DOI] [PubMed] [Google Scholar]
- Ticu C, Murataliev M, Nechifor R, Wilson KS (2011) A central interdomain protein joint in elongation factor G regulates antibiotic sensitivity, GTP hydrolysis, and ribosome translocation. J Biol Chem 286: 21697–21705 [DOI] [PMC free article] [PubMed] [Google Scholar]
- Tourigny DS, Fernandez IS, Kelley AC, Ramakrishnan V (2013) Elongation factor G bound to the ribosome in an intermediate state of translocation. Science 340: 1235490 [DOI] [PMC free article] [PubMed] [Google Scholar]
- Trabuco LG, Schreiner E, Eargle J, Cornish P, Ha T, Luthey‐Schulten Z, Schulten K (2010) The role of L1 stalk‐tRNA interaction in the ribosome elongation cycle. J Mol Biol 402: 741–760 [DOI] [PMC free article] [PubMed] [Google Scholar]
- Tsuboi M, Morita H, Nozaki Y, Akama K, Ueda T, Ito K, Nierhaus KH, Takeuchi N (2009) EF‐G2mt is an exclusive recycling factor in mammalian mitochondrial protein synthesis. Mol Cell 35: 502–510 [DOI] [PubMed] [Google Scholar]
- Valente L, Tiranti V, Marsano RM, Malfatti E, Fernandez‐Vizarra E, Donnini C, Mereghetti P, De Gioia L, Burlina A, Castellan C et al (2007) Infantile encephalopathy and defective mitochondrial DNA translation in patients with mutations of mitochondrial elongation factors EFG1 and EFTu. Am J Hum Genet 80: 44–58 [DOI] [PMC free article] [PubMed] [Google Scholar]
- Valle M, Zavialov A, Li W, Stagg SM, Sengupta J, Nielsen RC, Nissen P, Harvey SC, Ehrenberg M, Frank J (2003) Incorporation of aminoacyl‐tRNA into the ribosome as seen by cryo‐electron microscopy. Nat Struct Biol 10: 899–906 [DOI] [PubMed] [Google Scholar]
- Wasserman MR, Alejo JL, Altman RB, Blanchard SC (2016) Multiperspective smFRET reveals rate‐determining late intermediates of ribosomal translocation. Nat Struct Mol Biol 23: 333–341 [DOI] [PMC free article] [PubMed] [Google Scholar]
- Zhang K (2016) Gctf: Real‐time CTF determination and correction. J Struct Biol 193: 1–12 [DOI] [PMC free article] [PubMed] [Google Scholar]
- Zheng SQ, Palovcak E, Armache JP, Verba KA, Cheng Y, Agard DA (2017) MotionCor2: anisotropic correction of beam‐induced motion for improved cryo‐electron microscopy. Nat Methods 14: 331–332 [DOI] [PMC free article] [PubMed] [Google Scholar]
- Zhou J, Lancaster L, Donohue JP, Noller HF (2013) Crystal structures of EF‐G‐ribosome complexes trapped in intermediate states of translocation. Science 340: 1236086 [DOI] [PMC free article] [PubMed] [Google Scholar]
- Zhou J, Lancaster L, Donohue JP, Noller HF (2014) How the ribosome hands the A‐site tRNA to the P site during EF‐G‐catalyzed translocation. Science 345: 1188–1191 [DOI] [PMC free article] [PubMed] [Google Scholar]
- Zhou J, Lancaster L, Donohue JP, Noller HF (2019) Spontaneous ribosomal translocation of mRNA and tRNAs into a chimeric hybrid state. Proc Natl Acad Sci USA 116: 7813–7818 [DOI] [PMC free article] [PubMed] [Google Scholar]
- Zivanov J, Nakane T, Forsberg BO, Kimanius D, Hagen WJ, Lindahl E, Scheres SH (2018) New tools for automated high‐resolution cryo‐EM structure determination in RELION‐3. Elife 7: e42166 [DOI] [PMC free article] [PubMed] [Google Scholar]
Associated Data
This section collects any data citations, data availability statements, or supplementary materials included in this article.
Supplementary Materials
Expanded View Figures PDF
Table EV1
Table EV2
Review Process File
Data Availability Statement
The cryo‐EM density maps have been deposited in the Electron Microscopy Data Bank: accession number EMD‐10779 (https://www.ebi.ac.uk/pdbe/entry/emdb/EMD-10779) for the TiPOST state and EMD‐10778 (https://www.ebi.ac.uk/pdbe/entry/emdb/EMD-10778) for the POST state. Atomic models have been deposited in the Protein Data Bank (https://www.rcsb.org/): accession number PDB ID 6YDW for the TiPOST state and PDB ID 6YDP for the POST state. Requests for materials should be addressed to N.B. (ban@mol.biol.ethz.ch).