

Abstract
Microbial populations form intricate macroscopic colonies with diverse morphologies whose functions remain to be fully understood. Despite fungal colonies isolated from environmental and clinical samples revealing abundant intraspecies morphological diversity, it is unclear how this diversity impacts fungal fitness and disease progression. Here we observe a significant impact of oxygen tension on the macroscopic and biofilm morphotypes of the human fungal pathogen Aspergillus fumigatus. A hypoxia-typic morphotype is generated through the expression of a sub-telomeric gene cluster containing genes that alter the hyphal surface and perturb inter-hyphal interactions to disrupt in vivo biofilm and infection site morphologies. Consequently, this morphotype leads to increased host inflammation, rapid disease progression, and mortality in a murine model of invasive aspergillosis. Taken together, these data suggest filamentous fungal biofilm morphology impacts fungal-host interactions and should be taken into consideration when assessing virulence and host disease progression of an isolated strain.
Surface-dwelling microorganisms organize into macroscopic colonies of intricately structured populations that have intrigued scientists for decades1,2. For bacteria and yeast, the inter- and intra-species heterogeneity of these macroscopic morphologies in vitro are well appreciated 3,4; and microbial colony morphology (CM) variants are observed in clinical samples5,6. The challenge remains to determine how CM diversity reflects physiological variation and contributes to environmental fitness. CM is associated with changes in extracellular matrix (ECM)7, stress resistance8, reproduction9, and metabolism10; but it remains unclear, particularly for filamentous fungi, how CM impacts pathogenesis and what genetic factors play a role in fungal CM diversification.
Intraspecies CM variation can arise through accumulated genetic changes or through transcriptional rewiring resulting in phenotypic switching 11,12. The human pathogenic mold Aspergillus fumigatus exhibits phenotypic plasticity at 0.2% O2, where CM differs compared to 21% O2 growth and is variable across strains 13. Physiological changes and genetic mechanisms facilitating stable morphotype variants in A. fumigatus and other human pathogenic filamentous fungi are not well characterized, nor is their impact on pathogenesis and disease progression. Progress on understanding fungal CM and phenotypic variability has been limited in part by the underlying genetic complexity. Given the intraspecies CM variation found in A. fumigatus isolates and the impact of oxygen on CM, we sought to assess how a low oxygen CM variant impacts A. fumigatus pathogenesis and invasive aspergillosis (IA) disease progression and identify genetic factors involved in CM variation.
RESULTS
Oxygen tension significantly influences fungal colony morphology and biofilm architecture
A. fumigatus CM is heterogeneous in response to oxygen tension 13. A screen of 58 isolates at 0.2% O2 for two morphological features (1) colony furrowing and (2) percent vegetative mycelia (white, non-conidiating mycelia) (PVM) revealed abundant furrowing (mean: 5.30) and a high PVM (mean: 70.4%) (Fig. 1a, Supplementary Fig. 1a). Colonies at 21% O2 have significantly fewer furrows (mean: 1.85, p<0.0001) and significantly reduced PVM (mean: 32%, p<0.0001) (Fig. 1b). Oxygen tension is a significant source of variation for both colony furrowing (31.67%, p<0.0001) and PVM (55.77%, p<0.0001) (Fig. 1c, d). Most isolates screened have low furrowing and low PVM at normal oxygen (N-MORPH) and elevated furrowing and PVM at low oxygen (hypoxia) (H-MORPH) (Fig. 1e). We consider a strain to be H-MORPH if furrows are greater than 3 and PVM is greater than 40% when grown in our culture conditions. A subset of clinical strains adopt H-MORPH even at 21% O2 (filled circles Fig.1b, 1c, 1d, 1f). Three such strains, CDC20.2, F11698, and F16311, have significantly increased low oxygen fitness (H/N) relative to the N-MORPH reference AF293 (Fig. 1f, Supplementary Fig. 1b).
Figure 1. Macroscopic morphotypes and biofilm architecture of A. fumigatus are influenced by oxygen tension.
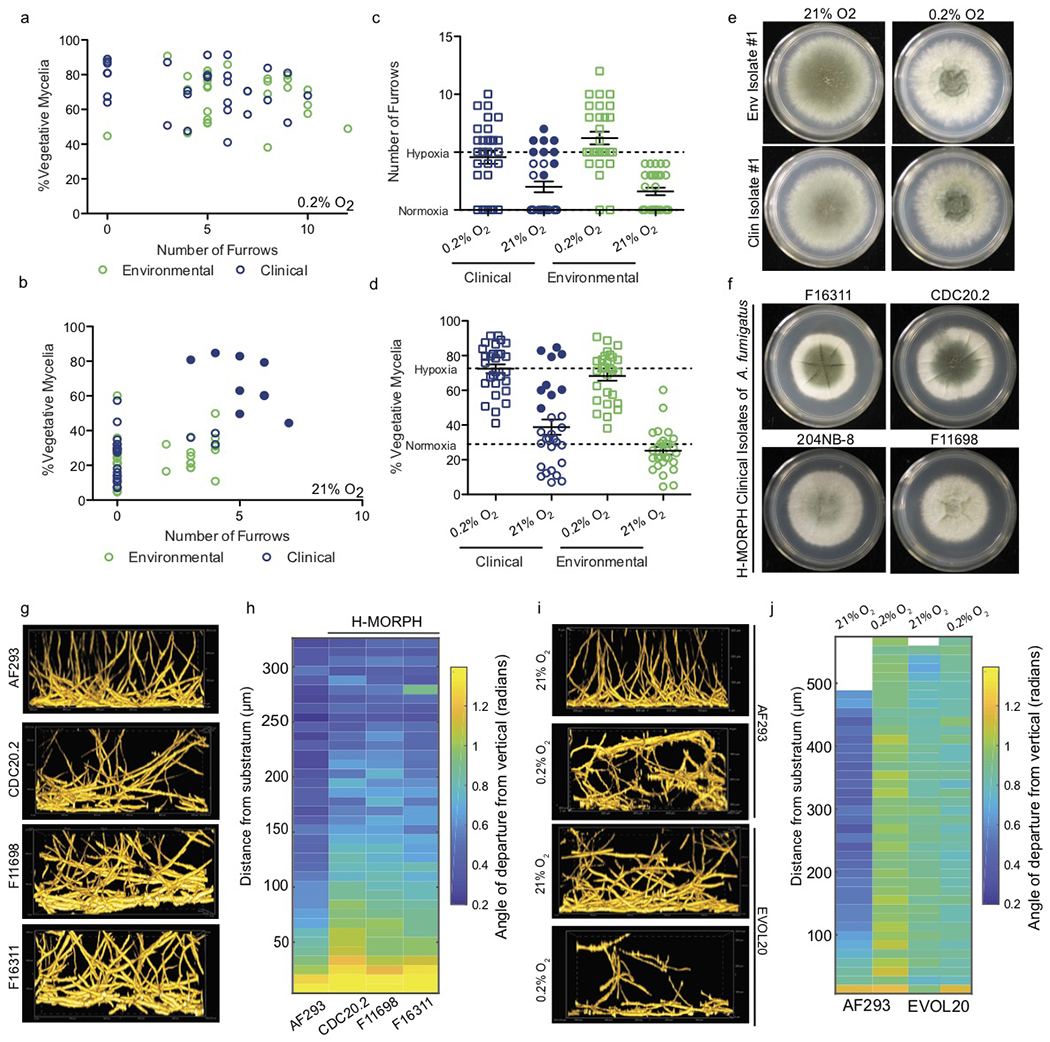
a. Environmental (n=29 biologically independent samples) and clinical (n=29 biologically independent samples) isolates of A. fumigatus strains plotted for morphotype characteristics (furrowing and percent vegetative mycelia) when grown at 0.2% O2 or 21% O2 (b). Two-way ANOVA shows oxygen tension significantly contributes to the variation of colony furrowing (31.67%, p<0.0001) (c) and percent vegetative mycelia (PVM) (55.77%, p<0.0001) (d) in clinical (n=29 biologically independent samples) and environment (n=29 biologically independent samples) strains. Dashed lines indicated the mean values per condition; error bars indicate standard error with measure of centre at the mean. e. Representative isolates with an increased PVM (white) and furrowing when cultured at 0.2% O2 vs. 21% O2. Images representative of three biologically independent experiments. f. Example clinical strains that adopt H-MORPH during growth at 21% O2 (closed blue circles in b, c, d). Images representative of three biologically independent replicates. g. Representative side-view slices of submerged fungal biofilms from A. fumigatus H-Morph clinical isolates in f. h. Quantification of vertical alignment of filaments as a function of biofilm depth. i. Representative side-view slices of submerged fungal biofilms of AF293 and the H-MORPH EVOL20 at 21% O2 (24 hours) and 0.2% O2 (36 hours) with (j) vertical alignment quantification. For h and j each lane is a representative alignment from a minimum of three independent biological replicates. Biofilm images are sample volumes of approximately 300 μm (h) X 500 μm (l) X 200 μm (w) and represent a minimum of 3 biologically independent experiments.
H-MORPH submerged fungal biofilms have altered biofilm architecture compared to AF293 (Fig. 1g). AF293 biofilms have a mat of filaments at the base perpendicular to the vertical axis. Above ~50 μm, filaments grow polarized toward the air liquid interface with little deviation from the vertical axis (Fig. 1h, Supplementary Video 1). Clinical H-MORPH strains are similar within the first ~50 μm, but the remaining volume contains filaments that deviate from the vertical axis (Fig. 1h, Supplementary Fig. 2). This pattern of altered architecture is similar to AF293 cultured at 0.2% O2 (Supplementary Video 2) and in the AF293 hypoxia-evolved H-MORPH strain EVOL20 independent of oxygen tension (Supplementary Video 3, Supplementary Video 4) (Fig. 1i, j, Supplementary Fig. 1c, 2). These data suggest that CM is an indicator of microscopic biofilm architecture impacted by oxygen.
H-MORPH occurs throughout genetically diverse strains of A. fumigatus
H-MORPH is not segregated by clade within the A. fumigatus phylogeny (Supplementary Fig. 3). Two H-MORPH clinical strains, F11698/NCPF-7816 and F13611, represent the abundant A. fumigatus genetic diversity with one present in each of the two major clades (Supplementary Fig. 3). Genetically similar, co-isolated, clinical strains, IFM 59356-3 and IFM 59356-1, have H-MORPH and N-MORPH respectively (Supplementary Fig. 4a) 6. Consistent with H-MORPH (Fig. 1g, h), IFM 59356-3 has a biofilm with greater filament deviation from the vertical relative to its N-MORPH counterpart IFM 59356-1 (Supplementary Fig. 4b, c). The lack of clustering of H-MORPH within the phylogeny and the ability to generate this CM suggest multiple genetic mechanisms likely exist through which A. fumigatus evolves these morphological features.
A sub-telomeric gene hrmA allele is sufficient to generate H-MORPH
An in vitro experimental evolution approach with AF293 in 0.2% O2 generated the strain EVOL20 that adopts H-MORPH independent of oxygen tension (Supplementary Fig. 1c, d) 13. Whole genome sequence analysis of EVOL20 revealed three non-synonymous mutations compared to AF293 (Supplementary Table 1), including a missense mutation in an uncharacterized hypothetical protein Afu5g14900. This single nucleotide polymorphism (SNP) (D304G) was only identified in H-MORPH EVOL20 from the passaged population (Supplementary Fig. 1f). RNA sequencing indicates that Afu5g14900 transcript is significantly elevated in EVOL20 relative to AF293 in both normal (p=0.0002) and low oxygen conditions (p<0.0001) (Supplementary Fig. 1e). Due to the generation of H-MORPH in EVOL20 the gene Afu5g14900 is named hypoxia responsive morphology factor A, hrmA.
In AF293, hrmA loss (ΔhrmAAF) does not alter in vitro CM in terms of furrowing and PVM, however, reconstitution of ΔhrmAAF with the EVOL20 allele of hrmA (hrmAR-EV) is sufficient to generate H-MORPH independent of oxygen tension (Fig. 2a, b). hrmAR-EV has hypoxia fitness equivalent to EVOL20 (Fig. 2c). Conversely, hrmA loss in EVOL20 (ΔhrmAEV) results in a loss of H-MORPH during growth at 21% O2 (Fig. 2a, b), and a reduction in hypoxia fitness (Fig. 2c). Similar to H-MORPH locked clinical isolates (Fig. 1g) and EVOL20, hrmAR-EV generates a biofilm with vertically misaligned filaments above the first ~50 μm (Fig. 2d,e). Loss of hrmA in EVOL20 restores AF293-like biofilm architecture (Figure 2f, g). Thus, the hypoxia-evolved allele of hrmA is sufficient and necessary to generate H-MORPH in AF293 and EVOL20, respectively.
Figure 2. The hypoxia-evolved allele of the sub-telomeric gene hrmA is sufficient to generate H-MORPH and collapse biofilm architecture.
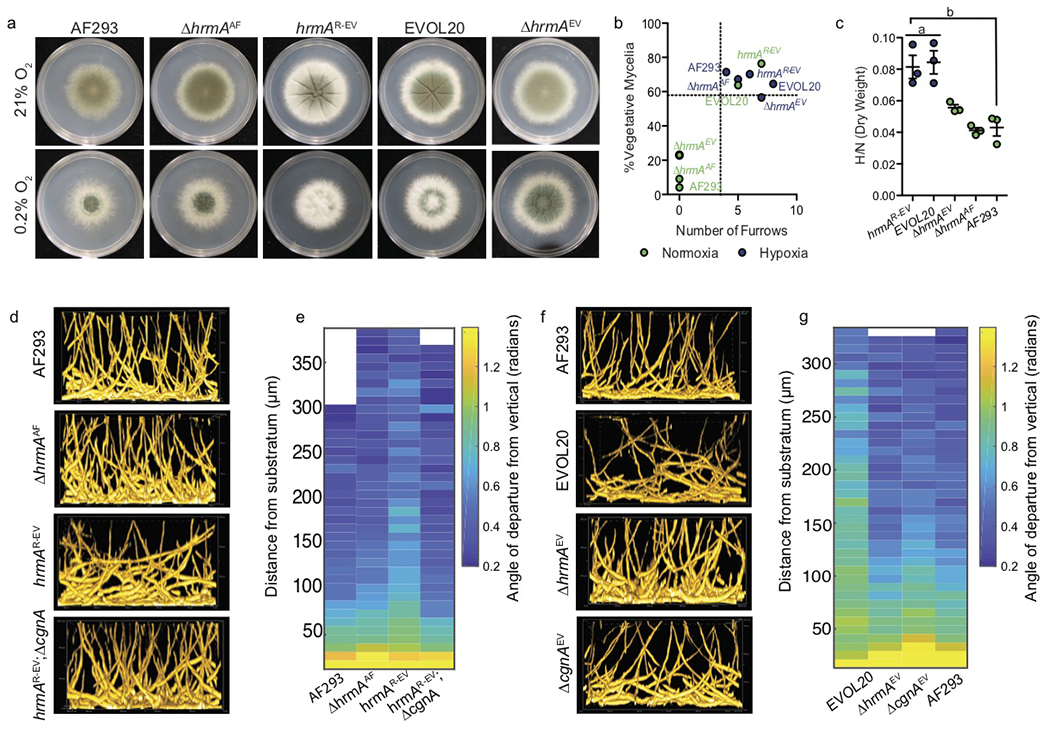
a. A hypoxia evolved allele of hrmA, from the hypoxia evolved strain EVOL20, is sufficient to generate H-MORPH in AF293 (hrmAR-EV) and necessary for H-MORPH in EVOL20. Images representative of three biologically independent experiments. b. Morphotype quantification indicates hrmAR-EV and EVOL20 are above the mean (dashed lines) for furrowing and PVM regardless of oxygen tension but dependent on hrmA/cgnA. c. hrmAR-EV (n=3 biologically independent samples per group) has increased fitness (a: p=0.9942, b: p=0.0033 by One-way ANOVA with Tukey’s Multiple Comparison test) in low oxygen as determined by dry weight. Error bars indicate standard error with the center at the mean. d. Representative side-view slices of submerged fungal biofilms reveal altered biofilm architecture in hrmAR-EV is dependent on cgnA and is quantified in e. f. Representative side-view slices of submerged fungal biofilms revealing hrmA and cgnA are necessary for the collapse in biofilm architecture observed with EVOL20 and is quantified in g. Colony and biofilm analysis are representative of three biological replicates. Biofilm images are sample volumes of approximately 300 μm (h) X 500 μm (l) X 200 μm (w).
H-MORPH coincides with the initiation of the hypoxia transcriptional response at ambient oxygen tensions
RNA sequencing was utilized to visualize broad consequences of H-MORPH at normal and low oxygen tensions. Hierarchical clustering of the transcriptomes reveals H-MORPHs hrmAR-EV and hrmAOE (over expression of the AF293 allele in AF293) cluster independently from N-MORPHs AF293 and ΔhrmAAF (Supplementary Fig. 5). Of the differentially expressed transcripts between hrmAR-EV and AF293 in 21% and 0.2% O2, 58% are oxygen-response genes in AF293 (Fig. 3a, Supplementary Table 3). The Gene Ontology Functional Categories GO:0016491 Oxidoreductase Activity (32/904) and GO:0005506 Iron Ion Binding (7/142) are significantly enriched in the differentially expressed genes between hrmAR-EV and AF293 (Supplementary Table 2); two categories shown previously to be enriched during the hypoxia response 14.
Figure 3. Transcriptional rewiring of the hypoxia response is dependent on the hypoxia-evolved allele of hrmA and primes for improved growth in low oxygen.
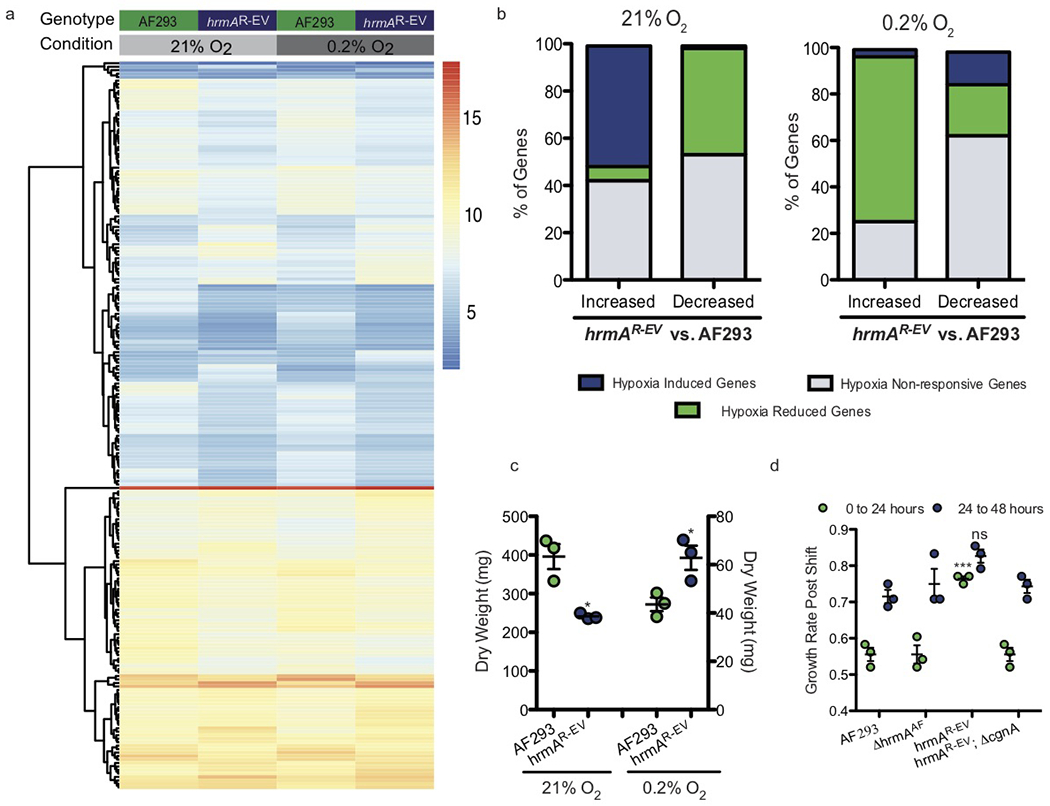
a. A heat map of collapsed biological replicates showing top genes with p<0.05 (two-sided) and log2 differential expression > 1 with a minimum FPMK of 5. Significance was determined with DESeq2 which utilizes DESeq2 which utilizes the Wald test for differential expression and adjustments for multiple comparisons using Benjamini and Hochberg procedures. Within this subset, hrmAR-EV vs. AF293 reveals large scale changes in both 21% and 0.2% O2 as a result of the hypoxia-evolved hrmA allele. b. Classification of all genes increased or decreased by 2-fold in hrmAR-EV/AF293 at 21% O2 or 0.2% O2 reveals activation of the hypoxia transcriptional response at ambient oxygen and reduction in this response at low oxygen in hrmAR-EV. c. The growth advantage of hrmAR-EV at 0.2% O2 (p=0.0282) coincides with a significant (p=0.0088) reduction in fungal growth at 21% O2. Two-tailed unpaired t test performed on n=3 independent biological replicates with error bars showing standard error centered at the mean. d. A transition from 48 hours of growth at 21% O2 to growth at 0.2% O2 shows an initial increase (p<0.0001) in growth rate during the first 24 hours at 0.2% O2 for hrmAR-EV that is not present (ns, p=0.0789) 24-48 hours post shift to 0.2% O2. One-way ANOVA with Tukey’s Multiple Comparison Test performed on n=3 biologically independent samples. Error bars indicate standard error around the mean (centre).
Transcripts with an increase or decrease of at least 4-fold between AF293 and hrmAR-EV were categorized as ‘Hypoxia Induced Genes’ (H/N > 4), ‘Hypoxia Reduced Genes’ (H/N < −4), or ‘Hypoxia Non-Responsive Genes’ ( 4 > H/N < −4) (Supplementary Table 4). At 21% O2, 51% of the transcripts increased in hrmAR-EV compared to AF293 are ‘Hypoxia Induced Genes’; conversely, 45% of the transcripts reduced in hrmAR-EV compared to AF293 are ‘Hypoxia Reduced Genes’ (Fig. 3b). Thus, H-MORPH strains, mediated by hrmA, activate the transcriptional hypoxic response despite oxygen replete conditions. At 0.2% O2 where hrmAR-EV is more fit than AF293, 71.8% of increased transcripts are ‘Hypoxia Reduced Transcripts’ further supporting an altered physiological response to hypoxic stress in H-MORPH strains (Fig. 3b). The inverted hypoxia response of hrmAR-EV coincides with reduced fungal biomass at 21% O2 and increased biomass at 0.2% O2 (Fig. 3c). However, following a shift from ambient oxygen to low oxygen the H-MORPH hrmAR-EV has increased growth rate compared to the N-MORPH AF293 (Fig. 3d).
HrmA is induced during murine pulmonary aspergillosis and facilitates the expression of a sub-telomeric gene cluster
Previous reports suggest increased hrmA expression in vivo in a triamcinolone murine model of IA 15. In that model, hrmA transcript levels significantly increase from 24 to 72 hours post fungal inoculation (hpi) (Fig. 4a). An increase in hrmA transcript in hrmAR-EV (at the native locus) is also observed (Fig. 4b). HrmA is a member of a sub-telomeric gene cluster that responds to nitrogen starvation, a laboratory condition that transcriptionally correlates with a host-adaptation transcriptional response 16. Consistent with the assignment of hrmA to a sub-telomeric gene cluster, we observe an influence of hrmA on transcript levels of genes surrounding its native locus, termed here the hrmA associated cluster (HAC). In ΔhrmAEV, the mRNA levels of three surrounding genes (Afu5g14880, Afu5g14890, Afu5g14910) are significantly reduced compared to EVOL20 (Fig.4c). Ectopic overexpression of the AF293 allele of hrmA (hrmAOE) acts in trans to facilitate an increase in transcripts of four HAC genes (Afu5g14880. Afu5g14890, Afu4g14910, Afu5g14920) (Fig. 4d).
Figure 4. HrmA localizes to the nucleus where it facilitates induction of a sub-telomeric gene cluster.
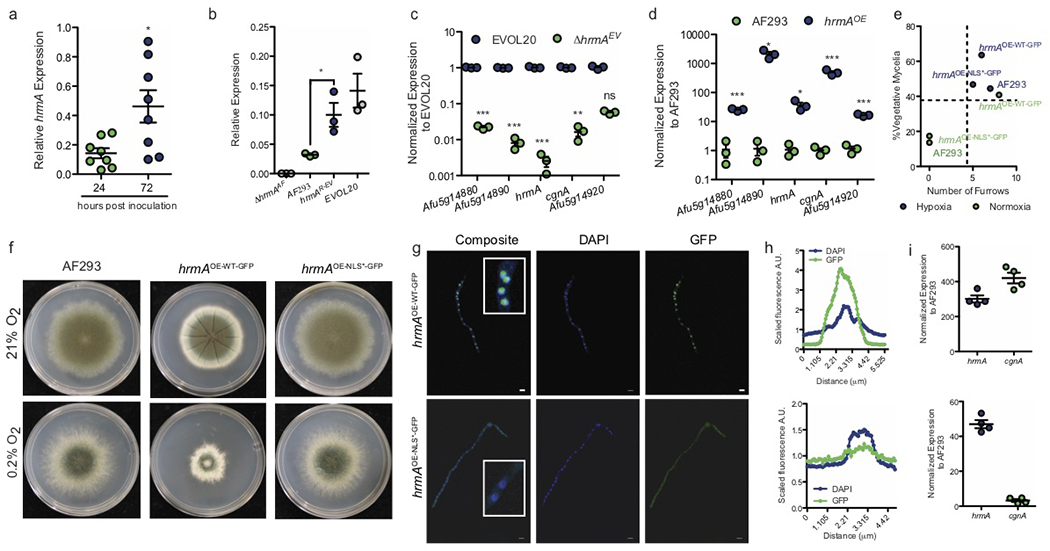
a. hrmA transcripts are detected in vivo during murine invasive disease with WT A. fumigatus and increase in abundance from 24 to 72 hours post inoculation (n=8 biologically independent animals, unpaired two-tailed students t-test, p=0.0151). b. Introduction of the evolved allele of hrmA (hrmAR-EV) is sufficient to induce significantly increased mRNA levels of hrmA compared to AF293 (p=0.0290), and similar to EVOL20 (p=0.3066) (n=3 biologically independent samples). Students unpaired two-tailed t test performed, error bars indicated standard error around the mean (centre). c. In the hypoxia-evolved EVOL20, loss of hrmA leads to a significant reduction in mRNA for the gene cluster surrounding the hrmA native locus (HAC: hrmA-associated cluster) (n=3 biologically independent samples). Unpaired students two-tailed t test performed between EVOL20 and ΔhrmAEV with error bars representing standard error around the mean (centre) (Afu5g14880: p<0.0001, Afu5g14890: p<0.0001, hrmA: p<0.0001, cgnA: p=0.0017, Afu5g14920: p=0.0604). d. Ectopic integration of a constitutively over expression WT allele of hrmA in AF293 acts in trans to significantly increase mRNA levels HAC (n=3 biologically independent samples). Unpaired students two-tailed t test performed between AF293 and hrmAOE with error bars representing standard error around the mean (centre) (Afu5g14880: p=0.0002, Afu5g14890: p=0.0184, hrmA: p=0.0371, cgnA: p=0.0009, Afu5g14920: p<0.0001). e. In a minimum of 3 independent experiments, overexpression of hrmA (hrmAOE-WT-GFP) generates H-MORPH independent of oxygen tension but dependent on an N-terminal NLS (f) and nuclear localization of HrmA (g, h). Scale bars = 5 μm. i. Localization to the nucleus is necessary for the induction of the HAC gene cgnA (Afu5g14900) (n=3 biologically independent samples). Error bars indicate standard error around the mean (centre).
Analysis of co-regulated transcripts from RNA-sequencing predicts that HAC extends from Afu5g14865 to Afu5g14920, and includes a putative unannotated ORF 3’ to Afu5g14910 (Supplementary Fig. 6a, c). The average gene size and % GC content of HAC is not different from the AF293 genomic average (Supplementary Fig. 6b) 17; but in the hypoxia-fit strain A116313, there is a sub-telomeric HAC that is syntenic to AF293 HAC and two additional putative homologous clusters that are not present in AF293 (Supplementary Fig. 6c). The presence of these potential homologous clusters in a distantly related A. fumigatus strain suggests intragenomic movement of this genomic region. The clusters share certain genic components including genes encoding a MyB/SANT domain, a kinase domain, a DUF2841 domain, and putative hrmA paralogs (hrmB: AFUB_044390, hrmC: AFUB_096600). Analysis of HAC across sequenced strains indicates heterogeneous abundance of the original and homologous gene clusters (Supplementary Fig. 3, alignment: https://github.com/stajichlab/Afum_hrmA_cluster_evolution; DOI: 10.5281/zenodo.3257606), potentially highlighting a role for these homologous clusters in H-MORPH generation where HAC is absent. Other Ascomycetes encode genes similar to hrmA, including the human fungal pathogens Histoplasma capsulatum and Coccidioides immitis (Supplementary Table 7; https://github.com/stajichlab/Afum_hrmA_cluster_evolution).
HrmA nuclear localization is necessary for the induction of HAC
The HrmA protein sequence reveals a predicted N-terminal bipartite nuclear localization signal (NLS) (http://nls-mapper.iab.keio.ac.jp/) and a weakly predicted RNA Recognition Motif (RRM) domain (E-value: 0.01) (Supplementary Fig. 7a). Overexpression of the parental allele of hrmA with a C-terminal GFP tag in AF293 generates oxygen-independent H-MORPH (Fig. 4e, f). In contrast, over expression of hrmA with a disrupted NLS is unable to generate H-MORPH (Fig. 4e, f) despite elevated levels of hrmA transcript (Fig. 4i). Confocal imaging reveals GFP signal enriched in the same location as the nuclear DAPI stain for the WT allele but a lack of this enrichment for the NLS mutant (Fig. 4g, h). Without localization to the nucleus or nuclear region, HrmA is unable to facilitate HAC induction as shown by the cluster gene cgnA (Afu5g14910) (Fig. 4i).
Despite low sequence similarity in the alignment to the RRM domain in HrmA, there are two conserved phenylalanine residues within this domain that are also present within hrmB and hrmC in strain A1163. When these conserved phenylalanine residues are each mutated to alanine, overexpression of this allele cannot generate H-MORPH despite observing hrmA nuclear region localization (Supplementary Fig. 7b, c, d). Aromatic residues are critical in many RRM protein structures for direct interaction with nucleic acids 18. Further studies are needed to determine the molecular function of hrmA in fungi.
H-MORPH is generated through HrmA-mediated induction of HAC
Loss of HAC induction abolishes H-MORPH indicating HAC is necessary for this morphotype and increased hypoxia fitness (Fig. 5, Supplementary Fig. 7). Expression of the HAC gene Afu5g14910, cgnA, is an indicator of HrmA downstream effects and encodes a predicted collagen-like protein (CLP), a class of proteins present but unstudied in other fungi (Supplementary Table 5). In A. fumigatus, CgnA has a tripeptide G-X-Y repeat of G-Q-I and G-Q-S, and lacks a canonical secretion signal. Despite induction of cgnA greater than 100-fold relative to AF293 in hrmAOE (Fig. 4d; morphology Supplementary Fig. 8e), comparative levels of cgnA over expression in the absence of elevated hrmA (cgnAOE) does not induce H-MORPH nor alter the hypoxic growth of AF293 (Supplementary Fig. 8). Loss of cgnA in the context of elevated HAC abolishes H-MORPH, indicating a role for cgnA, and possibly other HAC genes, in the generation of H-MORPH (Fig.5a, b; Supplementary Fig. 8e). Loss of cgnA in HAC-induced strains EVOL20, and hrmAR-EV reduces the hypoxia fitness of these strains (Fig. 5c, Supplementary Fig. 8f), and restores the N-MORPH biofilm architecture and filament alignment to that of AF293 (Fig. 2).
Figure 5. HrmA-facilitated induction of the surrounding sub-telomeric gene cluster leads to increased hypoxia fitness and a modified hyphal surface.
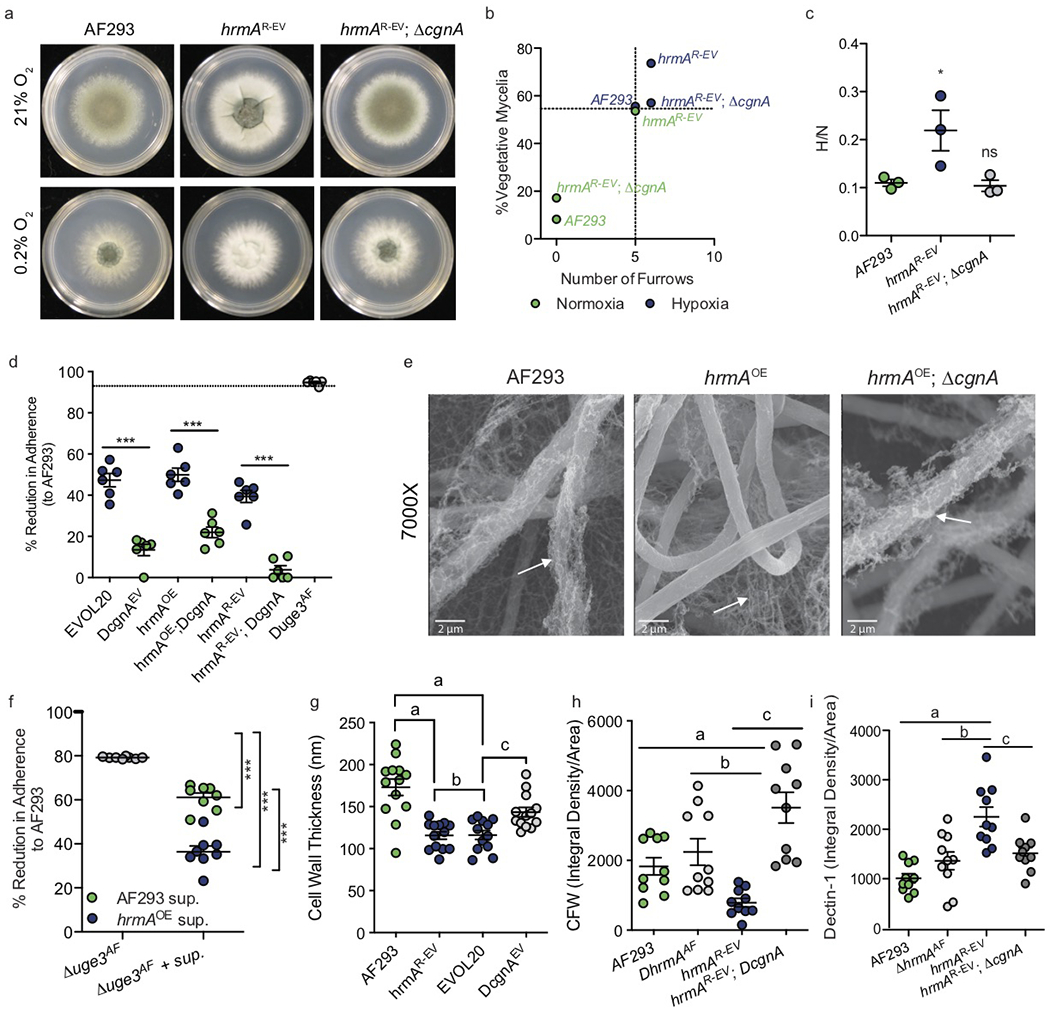
a. In a minimum of 3 independent experiments, loss of cgnA in hrmAR-EV abolishes H-MORPH generating a AF293-like oxygen-responsive morphotype in regards to furrows and PVM (b). c. Representative HAC gene cgnA is necessary for the elevated hypoxia fitness of hrmAR-EV (n=3 biological independent samples, One-way ANOVA with Dunnett’s Multiple Comparison test, *: p=0.0433 and ns: p=0.9847). d. Adherence to plastic is reduced in response to HAC induction (EVOL20, hrmAOE, hrmAR-EV) and is dependent on cgnA. n=6 biologically independent biological samples from 2 independent experimental repetitions. One-way ANOVA with Sidak’s Multiple Comparison test performed, ***: p<0.0001. Error bars indicate standard error around the mean (centre). e. SEM of 24 hour submerged fungal biofilms reveal detachment of extracellular matrix from hrmAOE hyphae that is dependent on cgnA. White arrows indicate extracellular matrix. Representative images of 3 replicates. f. Addition of culture supernatants with secreted ECM to the non-adherent strain Δuge3AF significantly (***: p<0.0001) rescues adherence. n=8 biologically independent samples with One-way ANOVA with Tukey’s Multiple Comparison Test. Error bars indicate standard error around the mean (centre). g. The cell walls of hrmAR-EV and EVOL20 are significantly (a: p<0.001, b: p>0.9999, c: p=0.0334) thinner than that of AF293 or ΔcgnAEV. n=13 independent biological samples with One-way ANOVA and Tukey’s Multiple Comparisons test. Error bars indicate standard error around the mean (centre). h hrmAR-EV has reduced total chitin staining by CFW fluorescence (n=10 independent biological samples, a: p=0.0492, b: p=0.0049, c: p<0.0001) and increased β-glucan staining by Dectin-1 (n=10 independent biological samples, a: p<0.0001, b: p=0.0006, c: p=0.0044) (g). One-way ANOVA with Sidak’s Multiple Comparison test for significant; error bars indicate standard error around the mean (centre) (f and g).
To further characterize the role of cgnA and HAC in the generation of H-MORPH, we assessed features of the hyphal surface, as surface alteration and adhesion are associated with other microbial CLPs19–21. Loss of cgnA and regeneration of N-MORPH increases surface adherence of H-MORPH strains (Fig. 5d), likely the consequence of ECM detachment from the H-MORPH strains (Supplementary Fig. 8g, Fig. 5e) that is dependent on cgnA. In the clinical strains IFM 59356-1 (N-MORPH) and IFM 59356-3 (H-MORPH), matrix detachment and reduced surface adherence is observed in H-MORPH (Supplementary Fig. 4d,e). Matrix detachment from the H-MORPH filaments is not a defect in ECM production as it is still visibly secreted into the biofilms (Fig. 5e). A significant component of the ECM is galactosaminogalactan (GAG), and loss of GAG through deletion of the UDP-Glucose-4-epimerase uge3 abolishes surface adherence 22,23. Chemical modifications of GAG also prevents attachment of matrix to the hyphae 23, so we investigated the ability of secreted GAG from hrmAOE to complement the adherence defect of the GAG deficient strain Δuge3AF. Culture supernatants containing secreted GAG from AF293 and hrmAOE were both able to significantly increase adherence of Δuge3AF (Fig. 5f). These data suggest that HAC/cgnA modifies the hyphal surface mediating matrix/GAG detachment. To determine if GAG secretion was necessary for H-MORPH, we generated uge3 deletions in hrmAOE and EVOL20; as a result, CM did not change but surface adherence was abolished (Supplementary Fig. 9 a, b). Loss of GAG production in AF293 does not impact hypoxia fitness nor the biofilm architecture (Supplementary Fig. 9d, e).
H-MORPHs hrmAR-EV and EVOL20 have significantly thinner cell walls than the N-MORPH AF293, and in EVOL20 this is dependent on cgnA (Fig. 5g, Supplementary Fig. 10). To determine if the cell wall architecture is altered, we imaged cell wall components through the use of calcofluor white (CFW) for chitin detection and soluble Dectin-1 for β-glucan detection 24. H-MORPH hrmAR-EV has reduced total chitin that is dependent on the induction of cgnA (Fig. 5h, Supplementary Fig. 11a). In contrast, hrmAR-EV has significantly increased cgnA-dependent β-glucan exposure (Fig. 5i, Supplementary Fig. 11b). hrmAR-EV is also more sensitive to growth on CFW in both normal and low oxygen compared to AF293, ΔhrmAAF, and hrmAR-EV; ΔcgnA (Supplementary Fig. 11c). No difference in sensitivity to the β-glucan synthase inhibitor caspofungin was observed (Supplementary Fig. 11d). We hypothesize that these surface changes alter matrix attachment and inter-hyphal interactions within the developing biofilms resulting in a loss of vertically aligned polarized growing filaments.
H-MORPH altered biofilm architecture occurs in vivo.
We next sought to determine if the altered filament surface influences the inter-filament interactions in vivo. We adopted the miPACT/PACT tissue clearing methods (microbial identification after passive clarity technique) to visualize in vivo fungal lesions in three dimensions using fluorescently labeled fungi (we term this technique: funPACT: fungal imaging after passive clarity technique) 25–27. At 4 dpi and 5 dpi large inflammatory foci with fungal elements are observed within the airways of animals challenged with AF293 or EVOL20. At both time points, AF293 lesions are dense at the center with filaments radiating from the foci of infection, becoming less dense away from the center (Fig. 6a, Supplementary Video 5). There is a high degree of connectivity between filaments in AF293 lesions but not in EVOL20 lesions. At 4 dpi and 5 dpi the EVOL20 lesions are visibly more diffuse than those of AF293 (Fig.6a, b; Supplementary Fig. 13). There are no dense foci within the EVOL20 lesions, and single filaments can be observed dispersed in distinct locations within the mass of host immune infiltrate (Fig. 6b, Supplementary Video 6).
Figure 6. H-MORPH contributes to increased virulence through increased inflammation and diffuse lesion morphology.
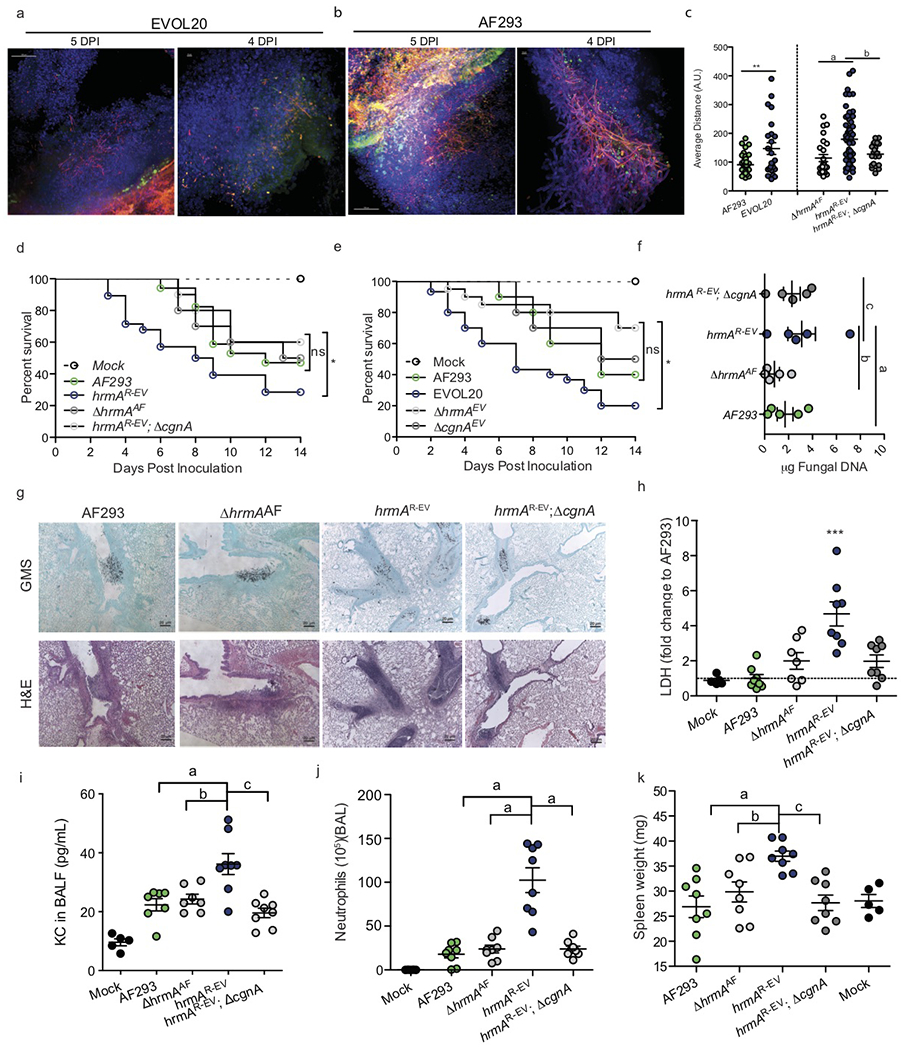
AF293tdtomato (a) or EVOL20tdtomato (b) murine lesions stained with DAPI and FITC-SBA. Scale bars: 4 DPI: 10 μm, 5 DPI: 100 μm. Represents 5 independent animals from 2 independent preparations. c. Nearest-neighbor algorithm shows significantly increased distances between intralesion filaments in AF293 and EVOL20 (**:p=0.0052) and hrmAR-EV (a: p=0.0003, b: p=0.0068) (AF293 n= 45, EVOL20 n= 24, ΔhrmA n= 25, hrmAR-EV n= 61, hrmAR-EV;ΔcgnA n= 22 biologically independent samples). One-way ANOVA with Sidak’s Multiple Comparison test. d. hrmAR-EV (n=28 independent animals) is significantly more virulent (p=0.0346 by Gehan-Breslow –Wilcoxon test (GBW)) than AF293 (n=16 independent animals) and hrmAR-EV; ΔcgnA (n=10 independent animals, p=0.0417 by GBW). AF293 and hrmAR-EV; ΔcgnA do not differ in virulence (ns: p=0.2087 by GBW). e. EVOL20 (n=30 independent animals) is significantly more virulent than ΔhrmAEV (n=20 independent animals, p=0.0008 by GBW), ΔcgnAEV (n=10 independent animals, p=0.0353 by GBW), and AF293 (n=10 independent animals, p=0.0465 by GBW). AF293, ΔhrmAEV (p= 0.1731 by GBW) nor ΔcgnAEV (p= 0.7812 by GBW) differ in virulence. f. hrmAR-EV does not increase fungal burden (a: p=0.4669, b: p=0.1322, c: p=0.7960, One-way ANOVA with Dunnett’s Multiple Comparison test, n=5 independent animals each). g Histopathology (n=6 independent animals each from 2 separate preparations) at 4 DPI indicate a cgnA-dependent increase in cellular infiltrate within hrmAR-EV lesions (Scale bar: 20 μm). h-k Mice inoculated with hrmAR-EV (n=8 independent animals per group) at 60 hours post-inoculation show elevated (h) LDH (a: p<0.0001, b: p=0.0013, c: p=0.0009), (i) chemoattractant KC (a: p=0.0013, b: p=0.0052, c: p=0.0001), (j) BALF neutrophils (a: p<0.0001), and (k) spleen weight (a: p=0.0009, b: p=0.0191, c: p=0.0021). One-way ANOVA with Dunnett’s Multiple Comparisons test for h-k. All Error bars indicate standard error centered at the mean.
To quantify differences in lesion architecture, we performed Gomori’s methenamine silver (GMS) stain and applied a nearest-neighbor algorithm to quantify the “compactness” of fungal lesions within the large airways. The more compact a fungal lesion is, the shorter the distance between each filament and its nearest neighbors; while more diffuse lesions have larger average distances between filaments. Qualitative analysis of the histopathology between N-MORPH AF293 and H-MORPH EVOL20 supported the hypothesis that H-MORPH fungal lesions are more diffuse, and quantification reveals significantly less compact lesions with EVOL20 than AF293 (Fig. 6c). Expansion of this algorithm to lesions of N-MORPHs ΔhrmAAF and hrmAR-EV; ΔcgnA and H-MORPH hrmAR-EV reveal significantly reduced compactness of hrmAR-EV compared to the N-MORPH strains (Fig. 6c, Supplementary Fig. 12, Supplementary Fig. 13c). The diffuse nature of the hrmAR-EV lesion is dependent on cgnA and only coincides with H-MORPH.
H-MORPH facilitate disease progression
H-MORPH F11698 (n=7) is significantly increased in murine virulence relative to AF293 (n=5) (p=0.0096) (Supplementary Fig. 4h, I). However, these are non-isogenic strains with an estimated 35759 SNPs between them that could contribute to differences in virulence and morphology. A second comparison between closely related clinical isolates N-MORPH IFM 59356-1 and H-MORPH IFM 59356-3 reveals a 40% increase in survival at 14 dpi, and a 5-day delay before the first mortality event in N-MORPH inoculated animals. By quantitative real-time PCR (qRT-PCR) no significant difference in mRNA levels of hrmA or the HAC gene cgnA is observed between these two strains that contain 51 nonsynonymous SNPs between them. (Supplementary Fig. 4g).
Loss of hrmA in AF293 does not impact murine mortality, however introduction of the hypoxia-evolved allele of hrmA (hrmAR-EV) and generation of H-MORPH significantly augments virulence in a cgnA-dependent manner (Fig. 6d). Loss of hrmA or cgnA in the H-MORPH EVOL20 significantly attenuates EVOL20 virulence (Fig.6e). Despite the H-MORPH strains increased virulence, there is no significant difference in fungal burden between AF293, hrmAR-EV, ΔhrmAAF, and hrmAR-EV;ΔcgnA at 4 dpi (Fig. 6f). Increased β-glucan exposure in the cell wall of H-MOPRH strains is consistent with observed increases in inflammation at 4 dpi (Fig. 6g, Supplementary Fig. 1h,i). The airways where H-MORPH hrmAR-EV is growing are full of immune cell infiltrate that is reduced around lesions of N-MORPH strains (Fig. 6g).
Host cell damage measured through lactate dehydrogenase (LDH) release in BALF after inoculation with hrmAR-EV indicates a significant increase in host cell damage (Fig. 6h). In both the airways and lung tissue, H-MORPH inoculum is associated with a significant increase in total cells (Supplementary Fig. 14a, e) and CD45+ leukocytes (Supplementary Fig. 14b, f). A significant increase in the neutrophil chemoattractant KC from BALF is detected (Fig. 6i) and corresponds with an increase in airway neutrophils (Fig. 6j). The elevated host response to inoculation with H-MORPH hrmAR-EV is dependent on HAC/cgnA, as loss of cgnA does not reduce hrmA transcripts (Supplementary Fig. 14h). These data indicate that localized pulmonary inflammation is elevated following inoculation with H-MORPH; but in addition systemic inflammation, as measured by spleen weight, is significantly increased 60 hpi with hrmAR-EV compared to AF293, ΔhrmAAF, and hrmAR-EV; ΔcgnA. (Fig. 6k). Together, these data suggest H-MORPH occurs in vivo and significantly impacts disease progression in part through an increase in immunopathogenesis.
Discussion
While morphological heterogeneity has been reported among filamentous fungi 6,13,28,29, there is an existing gap in knowledge that links CM with specific genetic determinants and disease outcomes. Here we discover an oxygen mediated mechanism of A. fumigatus CM that is associated with increased disease progression and fungal virulence. H-MORPH CM leads to increased hypoxia fitness and enhanced virulence through alterations in fungal biofilm architecture that promote increased host inflammation. It remains an open question how H-MOPRH confers a fitness benefit during low oxygen growth on a population scale, and on the microscale how the coinciding altered biofilms impact oxygen metabolism of individual filaments. Colony wrinkling or rugose CM has been characterized in a number of microorganisms, including Candida albicans, where increased oxygen penetration is observed within wrinkles30. Further investigation is necessary to address how the morphotype variant H-MORPH confers increased hypoxia fitness.
Our studies identified a sub-telomeric gene cluster likely regulated by the gene hrmA that is sufficient to drive H-MORPH when expressed (Supplementary Fig. 15). This cluster of genes is fascinating independent of its facilitation of H-MORPH for additional reasons including: (1) its location within the sub-telomeric region 16, (2) its mysterious origin and strain-dependent putative duplications (Supplementary Fig. 6), (3) its strain-specific occurrence across the A. fumigatus phylogeny (Supplementary Fig. 3), and (4) its genic content (Supplementary Fig. 6). Genetic variation within the cluster genes (Afu5g14865 and Afu5g14920) have also been observed in clinical strains 28. The evolutionary history of HAC and the putative homologous gene clusters and their molecular functions remains an intriguing area of future study. However, the isogenic set of morphotype variants generated herein will serve as tools to continue to interrogate the physiological consequences of CM on A. fumigatus pathogenesis. Understanding how fungal macroscopic morphotypes reflect in vivo phenotypic changes in human fungal pathogens may allow for morphotype indicators of disease progression and advancement of patient care.
Methods
Strains and growth conditions
A. fumigatus AF293 was used in the published experimental evolution approach that generated EVOL2013. Mutant strains were generated in AF293, the uracil/uridine auxotroph AF293.1, or EVOL20 (Supplementary Table 6). IFM 59356-1 and IFM 59356-3 were kindly provided by Dr. D. Hagiwara 6. Strains were cultured as described on 1% glucose minimal media (GMM)31, and collected for experimentation as previously described31.
Strain construction
Strain genotypes are provided in Supplementary Table 6. Gene replacement mutants were generated as previously described using overlap extension PCR32. The hrmA-GFP alleles were constructed through overlap extension PCR to tag HrmA at the C-terminus. Site-directed mutation of hrmA was carried out using QuikChange Site-Directed Mutagenesis (Agilent). Overexpression strains utilized the A. nidulans gpdA promoter for constitutive expression and was introduced ectopically. Fluorescent strains expressing tdtomato were transformed with linear constructs of gpdA-driven tdtomato. Protoplasting was done with Trichoderma harzianum (Sigma) lysing enzyme 33,34. Strains were confirmed by Southern blotting as described previously 33,34.
Growth and colony morphology assays
Growth assays were performed as previously described.13. Macroscopic morphology was quantified on GMM. 1000 spores were spotted at the center of the plates and grown for 72-96 hours at 21% O2 or 0.2% O2. Representative images are of 3 biological replicates. Statistics were performed with One-Way ANOVA with Tukey Post Test for multiple comparisons or two-tailed Students t-test. Error bars indicate standard error of the mean (StEM) centered at the mean. For shift experiments, cultures were started as described at 21% O2 for 48 hours then shifted to 0.2% O2 for 48 hours.
Macroscopic Morphology Quantification
Colonies were imaged with a Canon PowerShot SX40 HS. In Fiji (ImageJ) images were converted to 8-bit. Colony perimeter was selected and a Color Threshold was set to quantify percent of the colony that was ‘white’. Furrows were counted by selecting only those that radiated away from the point of inoculation. A ‘branched’ furrow counted as a single furrow (Figure S1). The influence of oxygen on morphology was measured with a Two-Way ANOVA (GraphPad Prism).
RNA extraction and qRT-PCR
Mycelia from liquid shaking cultures was flash frozen (~50mg) and bead beat for 1 minute with 2.3 mm beads in 200 μl of Trisure (Bioline Reagents). Homogenate was brought to a total volume of 1 mL Trisure and RNA was extracted as previously described 31. For details see supplemental methods. For RNA-sequencing and qRT-PCR, 50 mL cultures of 106 spores/mL were grown in normoxia (21% O2) at 37°C at 200 rpm for 18 hours before being shifted to low oxygen (0.2% O2). When necessary, 25 mL of the culture was collected at 18 hours for the normoxia samples. For qRT-PCR and RNA-sequencing, 5ug of RNA was DNAse treated with Ambion Turbo DNAse (Life Technologies) according to the manufacturer’s instruction. For qRT-PCR DNase treated-RNA was processed as previously described 31. mRNA levels were normalized to actA and tub2 for all qRT-PCR analyses. Statistical analysis for n>2 was performed with One-Way ANOVA with Dunnet Post Test for multiple comparisons. Error bards indicate StEM. qRT-PCR data was collected on a CFX Connect Real-Time PCR Detection System (Bio-Rad) with CFX Maestro Software (Bio-Rad)
RNA-sequencing and analysis
RNA-sequencing and RNA library preparation was carried out by SeqMatic LLC (Fremont, CA). Briefly, DNAse treated RNA (400-600 ng/L) were sent for QC using RNA Screen Tape Analysis (Agilent) and RNA library preparation using an Illumina TruSeq Standard mRNA library 35 preparation kit with Poly A mRNA enrichment. RNA-sequencing was performed as Illumina NextSeq High Output Run with single end reads at 1x75bp. Analysis of RNA-Seq was performed by aligning sequence reads to the annotated genome of A. fumigatus strain Af293 obtained from FungiDB (release 35) 36 with GSNAP (2018-02-12) with splice-aware, single-ended mode 37. The alignments were processed with Picard (v2.14.1) to clean, sort, and assign read groups (tools CleanSam, AddOrReplaceReadGroups) (http://broadinstitute.github.io/picard/). Sequence read counts overlapping genes were computed with featureCount tool in the Subread package (v1.6.2) 38. The read count table was processed in R using the DESeq2 (3.8) to identify differentially regulated genes and generate heat maps. Pipeline BASH scripts for the alignment, read count pipeline, and R analysis is available in github repository (https://github.com/stajichlab/Afum_RNASeq_hrmA; BioProject PRJNA551460). Heatmap in Figure 4 was drawn using collapsed replicates showing top DESeq2 with a P-value < 0.05 and log of differential expression > 1 and a minimum FPKM of 5. Heatmap in Figure 4 was drawn using collapsed replicates showing transcripts with computed expression value difference with an adjusted P-value < 0.05 and log of differential expression > 1 and a minimum FPKM of 5. Heatmap in SI was drawn showing all replicates and a P-value cutoff of 0.05 for genotype as an explaining variable for expression differences.
Surface attachment assays
Briefly, 104 spores seeded per well in a round-bottom 96-well polystyrene plate were incubated for 24 hours at 37°C at ambient oxygen in 1% GMM. Wells were washed 2X with water and stained for 10 min. with 0.1% (wt/vol) crystal violet. Following 2X washes with water, remaining crystal violet was dissolved in 100% ethanol and absorbance was quantified at 600 nm. For matrix complementation experiments, matrix donating strains were cultured in RPMI 1640 (Gibco) at 5x10⁷ spores/mL in 100 mL for 24 hours at 37°C at ambient oxygen. Cultures were filtered through Miracloth to remove fungus, and supernatants were further filtered through a 0.22μm PVDF sterile filter syringe. Filtered supernatants containing secreted GAG were diluted to 40% in fresh RPMI 1640 and used to perform the adherence assay with the attachment-deficient strain Δuge3.
Murine Virulence assays
Survival
Female CD-1 outbred mice (Charles River Laboratory, Raleigh, NC), 20-24 grams were immune-suppressed with a single dose of triamcinolone acetonide (Kenalong-10, Bristol-Myer Squibb) at 40 mg/kg 24 hours prior to inoculation. Mice were inoculated with 105 spores/40μL sterile PBS as previously described 13,31 and monitored for end-point criteria. Kaplan-Meier curves were generated and Log-rank Mantel-Cox tests and Gehan-Breslow-Wilcoxon tests performed.
Histopathology, fungal burden, and nearest neighbor calculation
Lungs from mice immune-suppressed as described were harvested on 4 days post-inoculation (dpi). Lungs were prepared for Gömöri methenamine silver (GMS) and hematoxylin and eosin (H&E) staining or fungal burden quantification as described31. A nearest neighbor calculation was applied to GMS images39. In Matlab (MathWorks Inc.), binary images were generated and filaments defined as objects. Lesions within airways were analyzed blindly. Mean distances between each object in a lesion and its 30 nearest neighbors was calculated. For nearest neighbor calculations four murine lungs were processed per experimental group with two histopathology slides prepared per animal. For fungal burden 4-5 animals were used per group.
FunPACT sample preparation
Lungs from mice immune-suppressed as described above were harvested on day 4 and day 5 post-inoculation. Lungs were harvested and perfused with 1% paraformaldehyde and fixed for 24 hours at room temperature. Following fixation, lobes of fixed lungs were separated with 1 lobe per 1.75 mL microcentrifuge tube. Lobes were washed with PBS and embedded in 4% (vol/vol) 29:1 acrylamide:bis-acrylamide (Bio-Rad) and 0.25% (wt/vol) VA-044 (Wako) in PBS 25. To facilitate polymerization, tubes were left open at 0.2% O2 at 37°C for 1 hour, and then closed and incubated at 37°C in a water bath for 4 hours. Embedded lobes were maintained at 4°C or were processed for PACT tissue clearing. To clear the lobes, embedded lobes were trimmed of excess polymer and cut into 1mm cubes using a stereomicroscope. Cubes were incubated in 20 mL of 8% (wt/vol) sodium dodecyl sulfate (SDS) in PBS shaking at 150 rpm at 37°C for 6-8 weeks in the dark. When cubes became transparent, they were processed for staining and imaging.
After clearing, the cubes were washed 3X with PBS for 1 hour each. A subset of cubes was then transferred to a 1.75 mL microcentrifuge tube and stained for 48 hours with FITC-Soy Bean Agglutinin at 20μg/mL (SBA) (Vector Labs). Lectin labeled cubes were washed in PBS for 24 hours to remove excess lectin, and cubes were placed in a refractive index matching solution (RIMS) (40g HistoDenz: Sigma, in 30 mL PBS 40) with DAPI (10 μg/mL). Stained cubes in RIMS+DAPI were mounted on standard 24X40X1.5 glass slides with a Press-to-Seal™ Silicone Isolator (Invitrogen: P24744).
Cellularity and Immunological Studies
Mice were immune suppressed and inoculated as described above with 8 mice per group. After 60 hpi, animals were sacrificed using a lethal dose of pentobarbital and bronchoalveolar lavage (BAL) was performed and BAL fluid (BALF) and cells, lungs and spleens were collected. Cells from BAL and lungs were prepared for staining. Lung tissue was minced and digested with 2.2 mg/mL Collagenase IV (Worthington), 1U/mL DNase1 (Zymo Research) and 5% FBS at 37°C for 45 minutes. BALF was centrifuged to isolate cells and suspended in red blood cell (RBC) lysis buffer. Re-suspended cells from lung homogenate were also treated for RBC lysis. Cell numbers were enumerated with Trypan Blue staining. For cellularity analysis, the cells were stained with Fixable Viability Dye (eFluor™ 780, eBioscience), anti-CD45 (Pacific orange, Invitrogen), anti-CD11b (PECy5, BioLegend), anti-Ly6G (FITC, BioLegend) anti-SiglecF (BV421, BD bioscience) and analyzed on a MacsQuant VYB cytometer. The neutrophils were identified as CD45+SiglecF−Ly6G+CD11b+ cells and alveolar macrophages as CD45+SigletF+CD11bdim cells. Methods adapted from Misharin et al 41. Samples were run on a MacsQuant VYB cytometer and analyzed with FlowJo version 9.9.6. Gating strategy provided in Supplementary Fig. 16. BALF was used to quantify host cell damage and KC through the use of LDH-Cytotoxicity Colorimetric assay (BioVision #K311) and Mouse CXCL1/KC DuoSet ELISA (R&D Systems #DY453), respectively.
Fungal Biofilm Sample Preparation
Biofilms for imaging were cultured in MatTek dishes (MatTek #P35G-1.0-14-C) by seeding 105 spores/mL of GMM with 2 mL per dish for 24 hours at 37°C with 5% CO2 at 21% O2 or 0.2% O2. Calcofluor white stain (CFW) (Sigma) was used to visualize the hyphae at a final concentration of 25 μg/mL for 15 minutes.
Fluorescent Microscopy
Fluorescent confocal microscopy was performed on an Andor W1 Spinning Disk Confocal with a Nikon Eclipse Ti inverted microscope stand with Perfect Focus, a Zeiss LSM880 with two multi-alkali photomultiplier tubes, GaAsP detector, and a transmitted light detector, or a Zeiss LSM800 AxioObserver.
HrmA Localization Studies
Fungi were cultured on coverslips in GMM at 30°C for 18 hours until short hyphae, were washed, UV fixed, stained with 5 μg/mL DAPI (Life Technologies), and mounted on slides. Images were acquired with a 100X oil immersion objective at 488 nm (GFP) and 405 nm (DAPI) on the Andor W1 Spinning Disk Confocal. Z-stacks were assembled in Fiji (ImageJ) with sum intensity projections. Images are representative of at least 10 images. Quantification was performed as previously described 42.
Fungal Biofilm Imaging and Quantification
Biofilms were imaged in MatTek dishes with a 20X multi-immersion objective (Nikon) or 10X multi-immersion objective (Zeiss, C-Apochromat 10X/0.45 W M27) using water. CFW biofilms were imaged at 405nm and tdtomato biofilms were imaged at 561 nm at depths from 300-500 nm. 3D projections were generated in Nikon NIS-Elements Viewer (Nikon) or Zeiss Blue (Zeiss). For quantification of biofilm architecture strains expressed tdtomato and were imaged on the Zeiss LSM880 AxioObserver with the exception of IFM 59356-1 and IFM 59356-3 which were stained with CFW (25 μg/mL). For quantification see supplemental methods. To quantify the branch length and branch density distribution of the hyphae network image stacks were processed in BiofilmQ (https://drescherlab.org/data/biofilmQ/) as follows: First, noise and background fluorescence where removed by local averaging, i.e. Tophat-filtering, respectively. Second, the hyphae structure was binarized by thresholding using Otsu’s method43. Third, the obtained data was skeletonized with a custom BiofilmQ analysis module and all branches above a threshold length were considered for further investigation. Visualization of branch features was performed in BiofilmQ.
FunPACT Imaging
Mounted samples for funPACT were imaged on the Andor W1 Spinning Disk Confocal with a 20X multi-immersion objective lens used with oil or a 40X oil-immersion objective. Areas of fungal growth were identified by manual scanning at 561 nm. Lesions were imaged at 405 nm, 488, and 561 nm at various depths. Images were processed in Nikon NIS-Elements Viewer for deconvolution and 3D rendering.
Cell wall staining
Hyphae were generated as described for localization studies. Filaments were stained with 25 μg/mL calcofluor white (Fluorescent Brightener 28 - Sigma) for 15 min. or soluble Dectin-1 as described previously44. 10 hyphae images were processed per strain.
Scanning and transmission electron microscopy
Fungal biofilms for scanning and transmission electron microscopy were grown on 12 mm sterile glass coverslips in 6-well plates for 24 hours at 37°C at 21% O2 with 106 spores/mL in RPMI 1640 (Gibco). Two coverslips were generated per sample. Samples were processed for SEM though a critical point drying method. Briefly, media was removed and replaced with fixative (2%GTA/2%PF in 0.05M NaCacodylate pH 7.4) for 15 minutes at room temperature. Fresh fixative was then added for 24 hours. Coverslips were then washed 3X (0.05M NaCacodylate pH 7.4 for 5 min) and then incubated for 1 hour at room temperature in 1% OsO4 in 0.05M NaCacodylate before 3X washings as before. Samples were then ethanol dehydrated for 10 min. in each 30%, 50%, 70%, and 85% ethanol, and were then washed 3X in 100% ethanol. Coverslips were then transferred to a CPD holder and incubated in 100% hexamethyldisilazane 2X for 10 min. each. Samples were then mounted on AI SEM stubs and coated with osmium plasma coater (4 nm) and were stored in a desiccator prior to imaging. SEM images were acquired on an FEI (Thermo Fisher Scientific) Scios2 LoVac dual bean FEG/FIB Scanning Electron Microscope with a Schottky emitter source. Images were acquired at 15.0 kV with 3 nm spot size.
Transmission electron microscopy and cell wall measurements
For transmission electron microscopy fungal biofilms were fixed in 5 mL 2X fixative (2%GTA/2%PF in 0.05M NaCacodylate pH 7.4) for 1 hour and then replaced with fresh fixative. Biofilms were scraped from coverslips and hyphae were pelleted and excess fixative removed. Hyphae were transferred to 100 μl 2% molten agar and solidified. Agar drops were trimmed to removed excess agar and transferred to 1 mL fresh fixative and rotated for 3 hours at room temperature then 48 hours at 4°C. Pellet was rinsed in 0.1M NaCac/01M Sucrose to remove GTA and then post-fix treated with 2% OsO4 in 0.1M NaCac/0.07M Sucrose for 2 hours. Soft agar pellet was then rinsed twice with dH2O and then transferred to En-bloc stain with 1% Uranyl Acetate for 2 hours at room temperature in the dark. Pellet was then dehydrated through ethanol series at room temperature with 30%, 50%, 70% for 30 minutes each, then on a rotator for two days, followed by further dehydration with 85% then 95% ethanol for 30 minutes and then 100% ethanol for 6 rinses over 6 hours. Samples were then left at 4°C for 48 hours. Samples were then incubated 2X in propylene oxide for 30 minutes each, then immersed in 1:1 LX112 (LADD, Inc. Burlington, VT):PO for 1 hour at room temperature and then in 1.5:1 LX112:PO for 18 hours. LX112 from LADD epoxy solution used in 6A:4B for medium hard block. Excess fluid was removed and samples were placed in vacuum desiccator for 24 hours before being transferred to BEEM capsules with fresh LX112, centrifuged for 30 min at 1500 rpm and returned to vacuum desiccator for 12 hours. Samples were polymerized at 45°C for 24 hours, 60°C for 24 hours, and then cooled and thin sectioned and places in 2% UAMeOH for 10 minutes followed by 3% Reynolds lead citrate for 2-3 minutes. Protocol was based on Burghardt & Droleskey45. Samples were imaged on JEOL JEM 1010 transmission electron microscope at 100.0 kV. To determine cell wall size, ImageJ was used to open images files and for each cross-section of a filament 10 measurements of cell wall thickness, disregarding the electron-dense ECM, were averaged per filament.
Statistics and Reproducibility
All statistical analysis was performed in GraphPad Prism 5, GraphPad Prism 8, and R. Unless otherwise noted, all statistical analyses were performed with a minimum of three biologically independent samples. All images are representative of a minimum of three biologically independent samples that represent a minimum of three independent experimentations unless otherwise noted. funPact images are representative of five independent animals, but to reduce the use of animals, samples for funPact images were generated from two independent sample preparations. For comparisons between two groups two-tailed unpaired t-tests were performed. For comparisons between greater than two groups One-Way ANOVA with Tukey, Sidak, or Dunnett post tests for multiple comparisons were performed. All error bars indicate standard error and are centered around the mean.
Ethics statement
The National Research Council Guide for the Care and Use of Laboratory Animals was strictly followed for all animal experiments. The animal experiment protocol was approved by Institutional Animal Care and Use Committee at Dartmouth College (protocol: cram.ra.1)
Data Availability
RNA sequencing data that support the findings of this study have been deposited under NCBI Gene Expression Omnibus with the identifier GSE133440 under the BioProject PRJNA551460. The genomic sequencing data for EVOL20 and reference AF293 have been deposited under BioProject identifier PRJNA417720. All strains and any other data used to support these findings will be made available upon reasonable request to the corresponding author.
Code Availability Statement
The custom scripts are available on https://github.com/stajichlab/Afum_RNASeq_hrmA, https://github.com/stajichlab/Afum_hrmA_cluster_evolution, https://github.com/stajichlab/Afum_popgenome, and (https://github.com/stajichlab/Afum_EVOL20 that were utilized in this study. The BiofilmQ software is available for public download at (https://drescherlab.org/data/biofilmQ/)). Other data that support the findings presented herein are available upon request from the corresponding author.
Supplementary Material
Acknowledgements
Special thanks to Dr. Joshua Obar (Dartmouth) for his helpful comments, Ann Lavanway and Louisa Howard (Dartmouth) for their microscopy expertise, Dr. T. Jarrod Smith for graphical model design and construction, Dr. Dominique Limoli for funPACT assistance, Dr. Sourabh Dhingra for tool development (plasmids), Derreck Carter-House for assistance with DNA extraction for WGS, and Dr. Shawn Lockhart and Dr. Daisuke Hagiwara for sharing A. fumigatus isolates.
This work was supported by the efforts of R.A.C. through funding by NIH National Institute of Allery and Infectious Diseases (NIAID) (R01AI130128 and 2R01AI081838). R.A.C holds an Investigators in Pathogenesis of Infectious Diseases Award from the Burroughs Wellcome Fund (BWF). C.H.K has been supported by the Molecular and Cellular Biology Training Grant at Dartmouth (5T32 GM 8704-20, PI: Duane Compton) from the National Institute of General Medical Sciences from 7/2016-6/2018, and the NIH NIAID Ruth L. Kirschstein National Research Service Award (F31AI138354) from 7/2018. CDN is supported by the National Science Foundation (MCB 1817342), a Burke Award from Dartmouth College, a pilot award from the Cystic Fibrosis Foundation (STANTO15RO), and NIH grant P20-GM113132 to the Dartmouth BioMT COBRE. Data analyses were performed on the UC Riverside High-Performance Computational Cluster supported by NSF DBI-1429826 and NIH S10-OD016290.
Footnotes
Declaration of Interests
The authors declare no competing interests.
References:
- 1.Slutsky B, Buffo J & Soll DR High-frequency switching of colony morphology in Candida albicans. Science 230, 666–669 (1985). [DOI] [PubMed] [Google Scholar]
- 2.Simpson LM, White VK, Zane SF & Oliver JD Correlation between virulence and colony morphology in Vibrio vulnificus. Infect Immun 55, 269–272 (1987). [DOI] [PMC free article] [PubMed] [Google Scholar]
- 3.Kuthan M et al. Domestication of wild Saccharomyces cerevisiae is accompanied by changes in gene expression and colony morphology. Mol Microbiol 47, 745–754 (2003). [DOI] [PubMed] [Google Scholar]
- 4.Workentine ML et al. Phenotypic heterogeneity of Pseudomonas aeruginosa populations in a cystic fibrosis patient. PLoS One 8, e60225, doi: 10.1371/journal.pone.0060225 (2013). [DOI] [PMC free article] [PubMed] [Google Scholar]
- 5.Haussler S et al. Highly adherent small-colony variants of Pseudomonas aeruginosa in cystic fibrosis lung infection. J Med Microbiol 52, 295–301, doi: 10.1099/jmm.0.05069-0 (2003). [DOI] [PubMed] [Google Scholar]
- 6.Hagiwara D et al. Whole-genome comparison of Aspergillus fumigatus strains serially isolated from patients with aspergillosis. J Clin Microbiol 52, 4202–4209, doi: 10.1128/JCM.01105-14 (2014). [DOI] [PMC free article] [PubMed] [Google Scholar]
- 7.Fong JC & Yildiz FH The rbmBCDEF gene cluster modulates development of rugose colony morphology and biofilm formation in Vibrio cholerae. J Bacteriol 189, 2319–2330, doi: 10.1128/JB.01569-06 (2007). [DOI] [PMC free article] [PubMed] [Google Scholar]
- 8.Drenkard E & Ausubel FM Pseudomonas biofilm formation and antibiotic resistance are linked to phenotypic variation. Nature 416, 740–743, doi: 10.1038/416740a (2002). [DOI] [PubMed] [Google Scholar]
- 9.Miller MG & Johnson AD White-opaque switching in Candida albicans is controlled by mating-type locus homeodomain proteins and allows efficient mating. Cell 110, 293–302 (2002). [DOI] [PubMed] [Google Scholar]
- 10.Workentine ML et al. Phenotypic and metabolic profiling of colony morphology variants evolved from Pseudomonas fluorescens biofilms. Environ Microbiol 12, 1565–1577, doi: 10.1111/j.1462-2920.2010.02185.x (2010). [DOI] [PubMed] [Google Scholar]
- 11.Jain N, Guerrero A & Fries BC Phenotypic switching and its implications for the pathogenesis of Cryptococcus neoformans. FEMS Yeast Res 6, 480–488, doi: 10.1111/j.1567-1364.2006.00039.x (2006). [DOI] [PMC free article] [PubMed] [Google Scholar]
- 12.Jain N, Hasan F & Fries BC Phenotypic Switching in Fungi. Curr Fungal Infect Rep 2, 180–188, doi: 10.1007/s12281-008-0026-y (2008). [DOI] [PMC free article] [PubMed] [Google Scholar]
- 13.Kowalski CH et al. Heterogeneity among Isolates Reveals that Fitness in Low Oxygen Correlates with Aspergillus fumigatus Virulence. MBio 7, doi: 10.1128/mBio.01515-16 (2016). [DOI] [PMC free article] [PubMed] [Google Scholar]
- 14.Barker BM et al. Transcriptomic and proteomic analyses of the Aspergillus fumigatus hypoxia response using an oxygen-controlled fermenter. BMC Genomics 13, 62, doi: 10.1186/1471-2164-13-62 (2012). [DOI] [PMC free article] [PubMed] [Google Scholar]
- 15.Kale SD et al. Modulation of Immune Signaling and Metabolism Highlights Host and Fungal Transcriptional Responses in Mouse Models of Invasive Pulmonary Aspergillosis. Sci Rep 7, 17096, doi: 10.1038/s41598-017-17000-1 (2017). [DOI] [PMC free article] [PubMed] [Google Scholar]
- 16.McDonagh A et al. Sub-telomere directed gene expression during initiation of invasive aspergillosis. PLoS Pathog 4, e1000154, doi: 10.1371/journal.ppat.1000154 (2008). [DOI] [PMC free article] [PubMed] [Google Scholar]
- 17.Fedorova ND et al. Genomic islands in the pathogenic filamentous fungus Aspergillus fumigatus. PLoS Genet 4, e1000046, doi: 10.1371/journal.pgen.1000046 (2008). [DOI] [PMC free article] [PubMed] [Google Scholar]
- 18.Law MJ, Chambers EJ, Katsamba PS, Haworth IS & Laird-Offringa IA Kinetic analysis of the role of the tyrosine 13, phenylalanine 56 and glutamine 54 network in the U1A/U1 hairpin II interaction. Nucleic Acids Res 33, 2917–2928, doi: 10.1093/nar/gki602 (2005). [DOI] [PMC free article] [PubMed] [Google Scholar]
- 19.Abdel-Nour M et al. The Legionella pneumophila collagen-like protein mediates sedimentation, autoaggregation, and pathogen-phagocyte interactions. Appl Environ Microbiol 80, 1441–1454, doi: 10.1128/AEM.03254-13 (2014). [DOI] [PMC free article] [PubMed] [Google Scholar]
- 20.Chen SM et al. Streptococcal collagen-like surface protein 1 promotes adhesion to the respiratory epithelial cell. BMC Microbiol 10, 320, doi: 10.1186/1471-2180-10-320 (2010). [DOI] [PMC free article] [PubMed] [Google Scholar]
- 21.Wang C & St Leger RJ A collagenous protective coat enables Metarhizium anisopliae to evade insect immune responses. Proc Natl Acad Sci U S A 103, 6647–6652, doi: 10.1073/pnas.0601951103 (2006). [DOI] [PMC free article] [PubMed] [Google Scholar]
- 22.Gravelat FN et al. Aspergillus galactosaminogalactan mediates adherence to host constituents and conceals hyphal beta-glucan from the immune system. PLoS Pathog 9, e1003575, doi: 10.1371/journal.ppat.1003575 (2013). [DOI] [PMC free article] [PubMed] [Google Scholar]
- 23.Lee MJ et al. Deacetylation of Fungal Exopolysaccharide Mediates Adhesion and Biofilm Formation. MBio 7, e00252–00216, doi: 10.1128/mBio.00252-16 (2016). [DOI] [PMC free article] [PubMed] [Google Scholar]
- 24.Brown GD & Gordon S Immune recognition. A new receptor for beta-glucans. Nature 413, 36–37, doi: 10.1038/35092620 (2001). [DOI] [PubMed] [Google Scholar]
- 25.DePas WH et al. Exposing the Three-Dimensional Biogeography and Metabolic States of Pathogens in Cystic Fibrosis Sputum via Hydrogel Embedding, Clearing, and rRNA Labeling. MBio 7, doi: 10.1128/mBio.00796-16 (2016). [DOI] [PMC free article] [PubMed] [Google Scholar]
- 26.Yang B et al. Single-cell phenotyping within transparent intact tissue through whole-body clearing. Cell 158, 945–958, doi: 10.1016/j.cell.2014.07.017 (2014). [DOI] [PMC free article] [PubMed] [Google Scholar]
- 27.Chung K et al. Structural and molecular interrogation of intact biological systems. Nature 497, 332–337, doi: 10.1038/nature12107 (2013). [DOI] [PMC free article] [PubMed] [Google Scholar]
- 28.Ballard E et al. In-host microevolution of Aspergillus fumigatus: A phenotypic and genotypic analysis. Fungal Genet Biol 113, 1–13, doi: 10.1016/j.fgb.2018.02.003 (2018). [DOI] [PMC free article] [PubMed] [Google Scholar]
- 29.Gago S, Denning DW & Bowyer P Pathophysiological aspects of Aspergillus colonization in disease. Med Mycol, doi: 10.1093/mmy/myy076 (2018). [DOI] [PubMed] [Google Scholar]
- 30.Morales DK et al. Control of Candida albicans metabolism and biofilm formation by Pseudomonas aeruginosa phenazines. MBio 4, e00526–00512, doi: 10.1128/mBio.00526-12 (2013). [DOI] [PMC free article] [PubMed] [Google Scholar]
- 31.Beattie SR et al. Filamentous fungal carbon catabolite repression supports metabolic plasticity and stress responses essential for disease progression. PLoS Pathog 13, e1006340, doi: 10.1371/journal.ppat.1006340 (2017). [DOI] [PMC free article] [PubMed] [Google Scholar]
- 32.Szewczyk E et al. Fusion PCR and gene targeting in Aspergillus nidulans. Nat Protoc 1, 3111–3120, doi: 10.1038/nprot.2006.405 (2006). [DOI] [PubMed] [Google Scholar]
- 33.Grahl N et al. In vivo hypoxia and a fungal alcohol dehydrogenase influence the pathogenesis of invasive pulmonary aspergillosis. PLoS Pathog 7, e1002145, doi: 10.1371/journal.ppat.1002145 (2011). [DOI] [PMC free article] [PubMed] [Google Scholar]
- 34.Willger SD et al. A sterol-regulatory element binding protein is required for cell polarity, hypoxia adaptation, azole drug resistance, and virulence in Aspergillus fumigatus. PLoS Pathog 4, e1000200, doi: 10.1371/journal.ppat.1000200 (2008). [DOI] [PMC free article] [PubMed] [Google Scholar]
- 35.Love MI, Huber W & Anders S Moderated estimation of fold change and dispersion for RNA-seq data with DESeq2. Genome Biol 15, 550, doi: 10.1186/s13059-014-0550-8 (2014). [DOI] [PMC free article] [PubMed] [Google Scholar]
- 36.Basenko EY et al. FungiDB: An Integrated Bioinformatic Resource for Fungi and Oomycetes. J Fungi (Basel) 4, doi: 10.3390/jof4010039 (2018). [DOI] [PMC free article] [PubMed] [Google Scholar]
- 37.Wu TD, Reeder J, Lawrence M, Becker G & Brauer MJ GMAP and GSNAP for Genomic Sequence Alignment: Enhancements to Speed, Accuracy, and Functionality. Methods Mol Biol 1418, 283–334, doi: 10.1007/978-1-4939-3578-9_15 (2016). [DOI] [PubMed] [Google Scholar]
- 38.Liao Y, Smyth GK & Shi W featureCounts: an efficient general purpose program for assigning sequence reads to genomic features. Bioinformatics 30, 923–930, doi: 10.1093/bioinformatics/btt656 (2014). [DOI] [PubMed] [Google Scholar]
- 39.Friedman JH, Bentely J, Finkel RA . An Algorithm for Finding Best Matches in Logarithmic Expected Time ACM Transcations on Mathematical Software 3, 209–226, doi: 10.1145/355744.355745 (1977). [DOI] [Google Scholar]
- 40.Treweek JB et al. Whole-body tissue stabilization and selective extractions via tissue-hydrogel hybrids for high-resolution intact circuit mapping and phenotyping. Nat Protoc 10, 1860–1896, doi: 10.1038/nprot.2015.122 (2015). [DOI] [PMC free article] [PubMed] [Google Scholar]
- 41.Misharin AV, Morales-Nebreda L, Mutlu GM, Budinger GR & Perlman H Flow cytometric analysis of macrophages and dendritic cell subsets in the mouse lung. Am J Respir Cell Mol Biol 49, 503–510, doi: 10.1165/rcmb.2013-0086MA (2013). [DOI] [PMC free article] [PubMed] [Google Scholar]
- 42.Danhof HA & Lorenz MC The Candida albicans ATO Gene Family Promotes Neutralization of the Macrophage Phagolysosome. Infect Immun 83, 4416–4426, doi: 10.1128/IAI.00984-15 (2015). [DOI] [PMC free article] [PubMed] [Google Scholar]
- 43.Liao PS, Chew TS & Chung PC A fast algorithm for multilevel thresholding. J Inf Sci Eng 17, 713–727 (2001). [Google Scholar]
- 44.Shepardson KM et al. Hypoxia enhances innate immune activation to Aspergillus fumigatus through cell wall modulation. Microbes Infect 15, 259–269, doi: 10.1016/j.micinf.2012.11.010 (2013). [DOI] [PMC free article] [PubMed] [Google Scholar]
- 45.Burghardt RC & Droleskey R Transmission electron microscopy. Curr Protoc Microbiol Chapter 2, Unit 2B 1, doi: 10.1002/9780471729259.mc02b01s03 (2006). [DOI] [PubMed] [Google Scholar]
Associated Data
This section collects any data citations, data availability statements, or supplementary materials included in this article.
Supplementary Materials
Data Availability Statement
RNA sequencing data that support the findings of this study have been deposited under NCBI Gene Expression Omnibus with the identifier GSE133440 under the BioProject PRJNA551460. The genomic sequencing data for EVOL20 and reference AF293 have been deposited under BioProject identifier PRJNA417720. All strains and any other data used to support these findings will be made available upon reasonable request to the corresponding author.