

Abstract
Compartmentalization of macromolecules is a ubiquitous molecular mechanism that drives numerous cellular functions. The appropriate organization of enzymes in space and time enables the precise transmission and integration of intracellular signals. Molecular scaffolds constrain signaling enzymes to influence the regional modulation of these physiological processes. Mitochondrial targeting of protein kinases and protein phosphatases provides a means to locally control the phosphorylation status and action of proteins on the surface of this organelle. Dual-specificity protein kinase A anchoring protein 1 (dAKAP1) is a multivalent binding protein that targets protein kinase A (PKA), RNAs, and other signaling enzymes to the outer mitochondrial membrane. Many AKAPs recruit a diverse set of binding partners that coordinate a broad range of cellular processes. Here, results of MS and biochemical analyses reveal that dAKAP1 anchors additional components, including the ribonucleoprotein granule components La-related protein 4 (LARP4) and polyadenylate-binding protein 1 (PABPC1). Local translation of mRNAs at organelles is a means to spatially control the synthesis of proteins. RNA-Seq data demonstrate that dAKAP1 binds mRNAs encoding proteins required for mitochondrial metabolism, including succinate dehydrogenase. Functional studies suggest that the loss of dAKAP1–RNA interactions reduces mitochondrial electron transport chain activity. Hence, dAKAP1 plays a previously unappreciated role as a molecular interface between second messenger signaling and local protein synthesis machinery.
Keywords: protein kinase A (PKA), A-kinase anchoring proteins (AKAPs), mitochondria, RNA–protein interaction, mitochondrial respiratory chain complex, translation regulation, protein kinases, local signaling complexes, intracellular compartmentalization, molecular scaffold
Spatial and temporal transmission of intracellular messages often involves anchoring and scaffolding proteins (1). These multivalent binding proteins sequester signaling enzymes with their activators, effectors, and preferred substrates. Prototypic examples are the A-kinase anchoring proteins (AKAPs), a family of proteins that anchors protein kinase A (PKA) with other kinases, phosphodiesterases, small GTPases, and phosphatases (2–7). To date, 48 AKAP genes have been identified in the human genome (8). Although structurally diverse, each member of this growing gene family contains a PKA anchoring helix that binds with high affinity to docking and dimerization domains of the regulatory subunits of the PKA holoenzyme (9–11). These protein–protein interactions not only enable the local modulation of substrates by phosphorylation, but also facilitate their preferential dephosphorylation by AKAP-associated phosphatases.
Subcellular localization of individual AKAP signaling complexes is mediated by unique targeting domains on each anchoring protein that direct kinase/phosphatase assemblies to membranes, the cytoskeleton, and organelles (8, 12, 13). For example, a 30-amino-acid mitochondrial targeting domain (MTD) directs the dual-specificity anchoring protein dAKAP1 (also called sAKAP84, AKAP149; gene AKAP1) to outer mitochondrial membranes (14, 15). Recent evidence suggests that other domains on dAKAP1 contribute to its various biological roles (16). Association with RNA is thought to proceed through a K homology (KH) domain (17). Accordingly, dAKAP1 association with mRNA for steroidogenic acute regulator (StAR) protein is thought to enhance cAMP-responsive regulation of steroid hormone synthesis (18). Similarly, the Tudor domain of dAKAP1 is thought to recruit argonaute 2 (Ago2), a member of the RNA-induced silencing complex (19). Thus, these molecular interactions may be necessary for posttranscriptional regulation of selected dAKAP1-associated RNAs.
In this report, we show that dAKAP1 interacts with several components of ribonucleoprotein granules, the intracellular substructures composed of RNA and proteins that participate in mRNA translation, storage, and decay. Subsequent RNA-Seq analyses uncover that dAKAP1 anchors RNAs that encode electron transport chain and tricarboxylic acid cycle (TCA) components at the outer mitochondrial membrane. These results imply that dAKAP1 not only anchors second messenger signaling enzymes, but also sequesters RNA regulatory and cotranslation machinery at the outer mitochondrial membrane.
Results
KH-Tudor domains on dAKAP1 interact with regulatory RNA-binding proteins
A common feature of anchoring proteins is a modular organization in which structured protein interaction domains are linked by regions of intrinsic disorder (1, 20, 21). dAKAP1 contains four identifiable domains: a mitochondrial targeting domain (MTD; residues 1–29); the PKA-anchoring helix (residues 348–359); a KH domain (residues 607–671) that binds RNA; and a Tudor domain (residues 707–817), a module that is known to recognize methylated arginine residues (22) (Fig. 1A). Whereas the mitochondrial targeting and signaling enzyme binding properties of dAKAP1 have been thoroughly investigated, much less is known about how this anchoring protein interfaces with RNA or proteins that contain methylated arginine (7, 23, 24).
Figure 1.
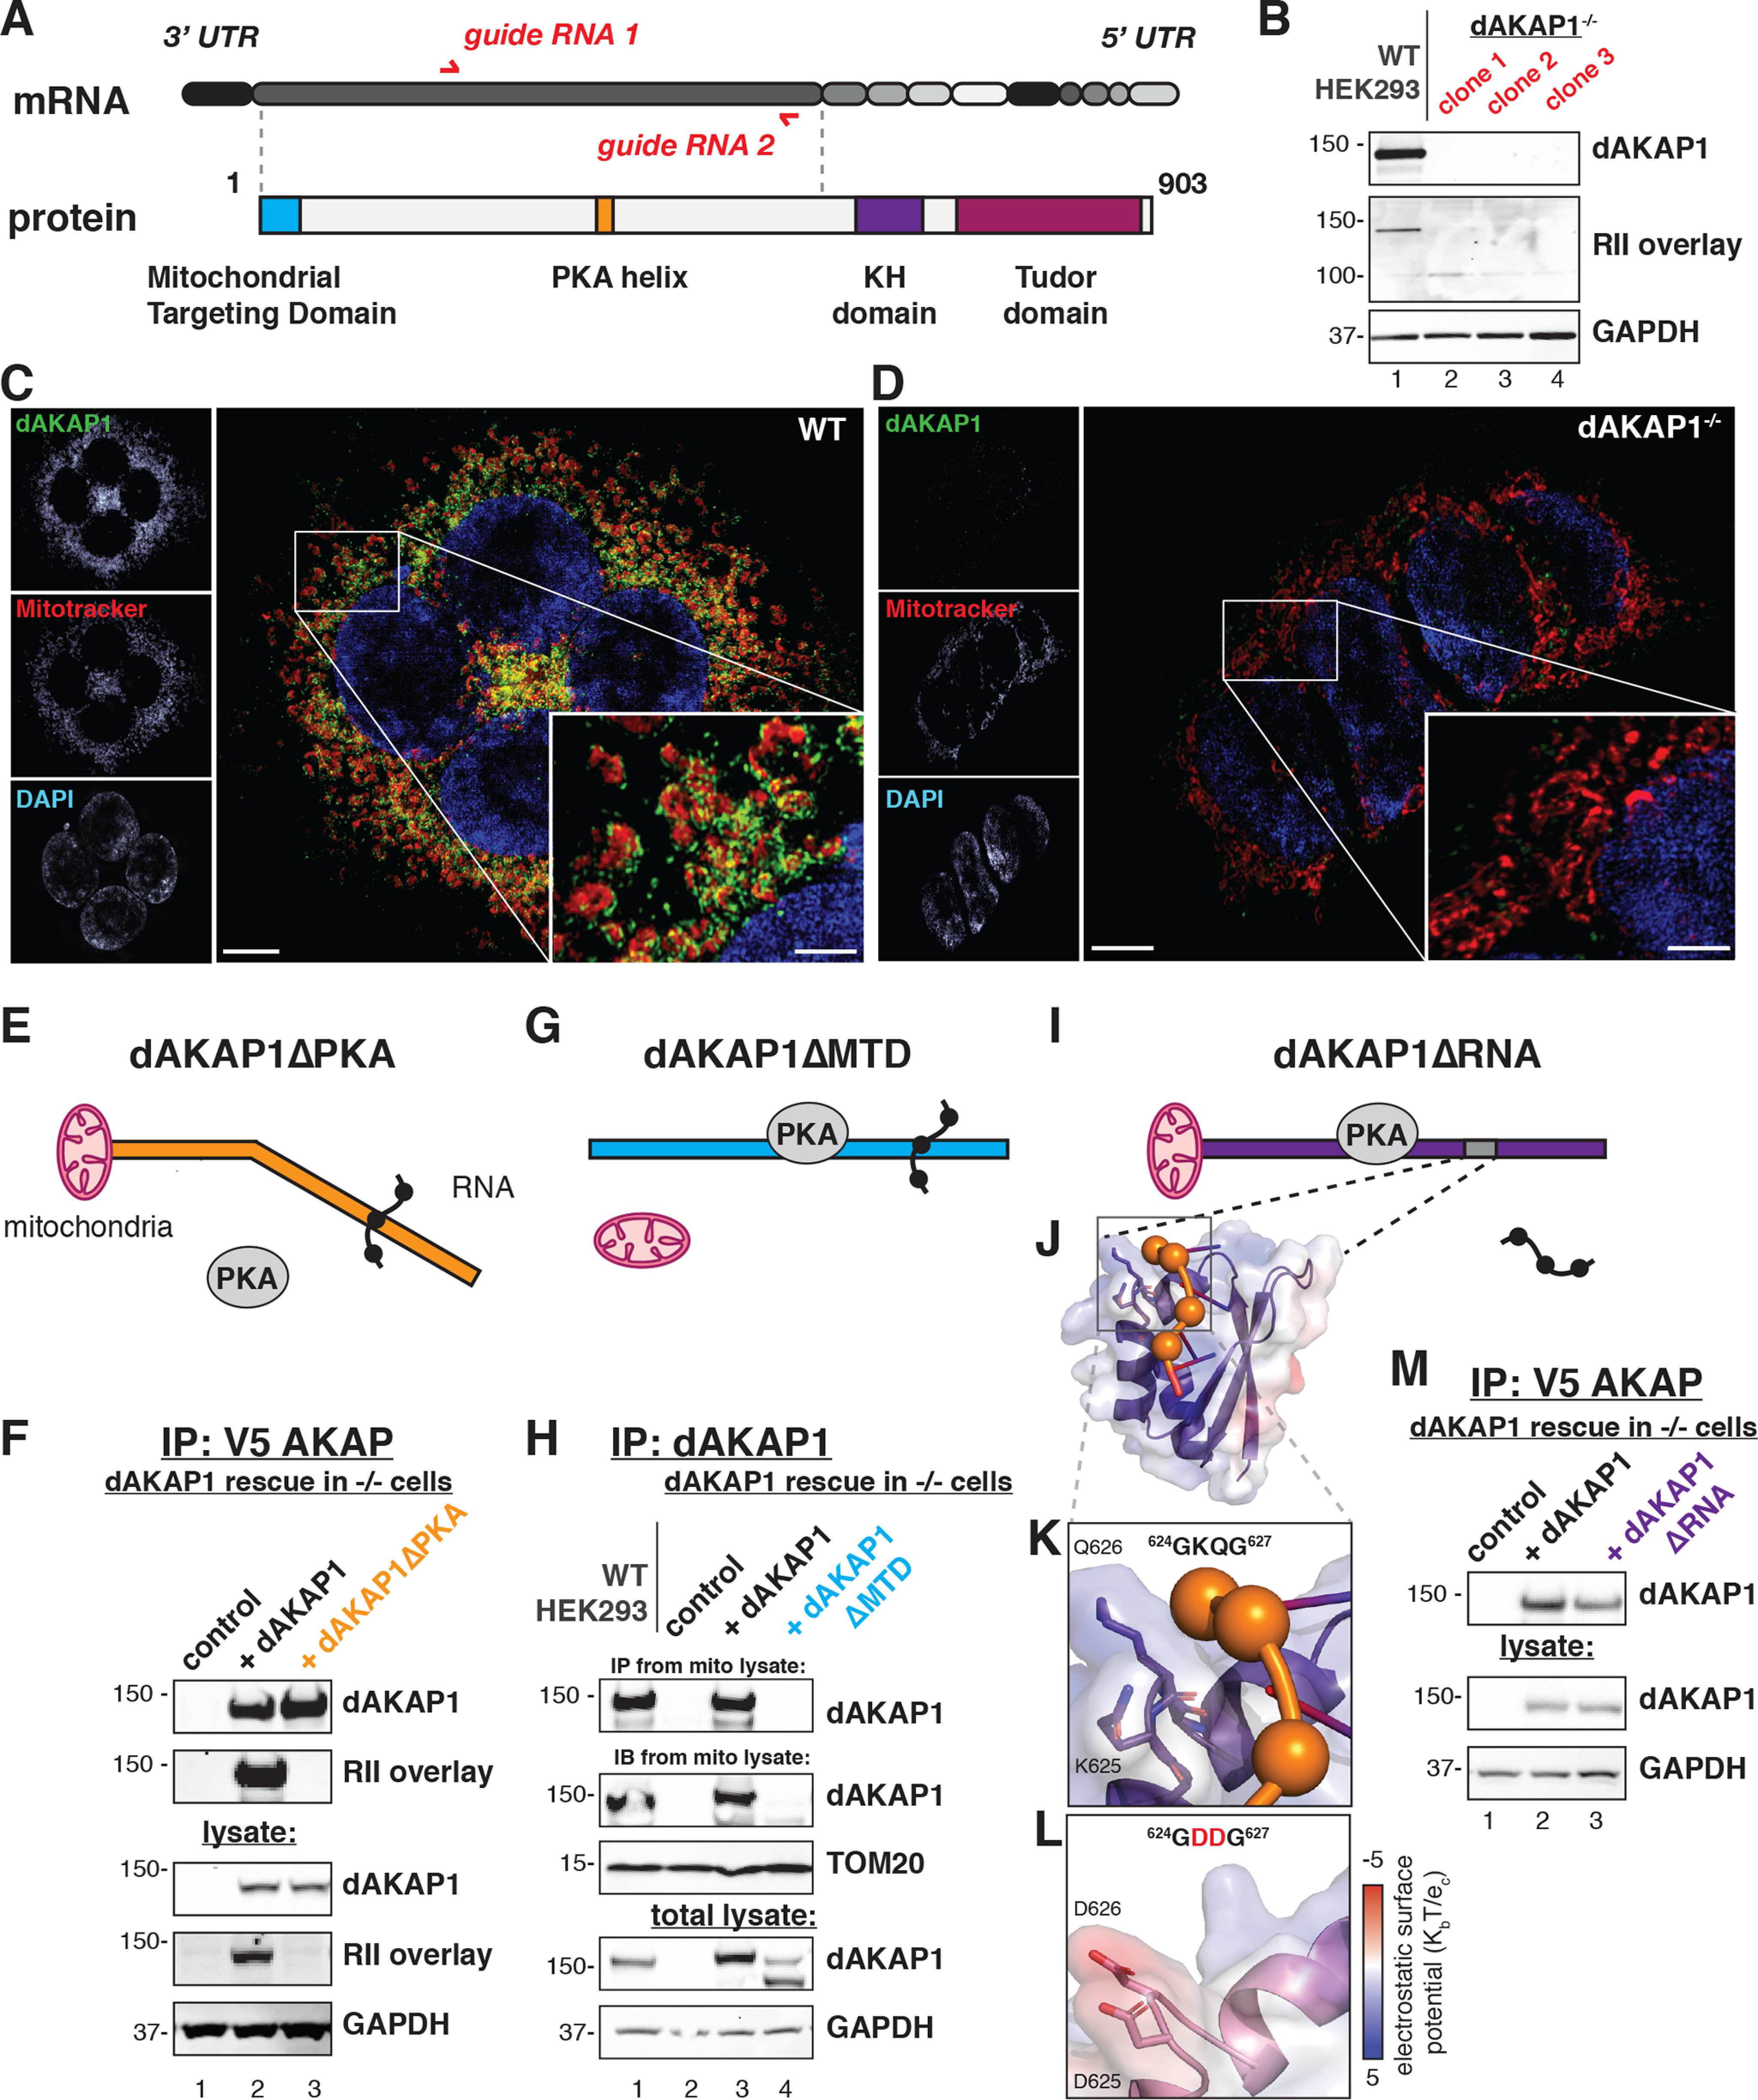
Characterization of functional domains on dAKAP1. A, schematic of dAKAP1 gene structure and protein architecture. Upper, CRISPR-Cas9 gene editing introduced mutations at two sites in exon 2 of dAKAP1, with guide RNA sites indicated on mRNA by red arrows. Bottom, functional domains on dAKAP1. Filled boxes delineate the mitochondrial targeting domain, PKA anchoring helix, KH, and Tudor domains. B, validation of HEK dAKAP1−/− cell lines. Upper, immunoblot detection of dAKAP1. Middle, RII overlay analysis of PKA anchoring in three dAKAP1−/− clonal lines. Bottom, GAPDH as a loading control. C and D, immunostaining and superresolution imaging shows dAKAP1 (green), mitochondrial marker MitoTracker (red), and nuclei (blue) in WT (C) and dAKAP1−/− (D) cells. Scale bar, 5 μm. Inset, 2.5× magnification of the boxed region. E, schematic of rescue dAKAP1ΔPKA that is unable to anchor PKA. F, validation of loss of PKA anchoring in dAKAP1ΔPKA constructs. dAKAP1 immune complexes were analyzed by immunoblotting for dAKAP1 (upper) and RII overlay (upper-middle) in dAKAP1−/− cells (lane 1), dAKAP1 rescue (lane 2), and rescue with dAKAP1ΔPKA (lane 3). Loading controls include immunoblot for dAKAP1 (middle), RII overlay for loss of PKA anchoring (lower-middle), and immunoblot for GAPDH (bottom). G, schematic of the mitochondrial targeting-defective dAKAP1ΔMTD. H, analysis of dAKAP1ΔMTD. dAKAP1 immune complexes from mitochondrial lysate were analyzed by immunoblotting for dAKAP1 (upper) in WT HEK293T (lane 1), dAKAP1−/− cells (lane 2), dAKAP1 rescue (lane 3), and dAKAP1ΔMTD rescue (lane 4). Mitochondrial lysate loading controls included immunoblotting for dAKAP1 (upper-middle) and TOM20. Total lysate loading controls included immunoblot for dAKAP1 (lower-middle) and GAPDH (bottom). I, schematic of dAKAP1ΔRNA. J, ribbon diagram model of human dAKAP1 KH domain structure (purple), overlaid with electrostatic potential map. RNA is depicted as ball and stick (orange). K, magnification of GxxG loop of dAKAP1. Positive charge from K625 and Q626 (labeled, residues as licorice sticks) stabilize the phosphate backbone of RNA. L, structural model dAKAP1 KH domain with two aspartic acids in the GxxG loop (GDDG, pink). This additional negative surface renders interaction with RNA unstable. M, characterization of dAKAP1ΔRNA. dAKAP1 immune complexes were analyzed by immunoblotting for dAKAP1 (upper) in dAKAP1−/− cells (lane 1), dAKAP1 rescue (lane 2), and dAKAP1ΔPKA rescue (lane 3). Loading controls included immunoblot for dAKAP1 (lower-middle) and GAPDH (bottom).
As a prelude to investigation of these uncharacterized macromolecular interactions, we disrupted the AKAP1 gene in HEK293T cells. CRISPR-Cas9 genome editing was performed with guide RNAs that target exon 2, upstream of the KH and Tudor domains (Fig. 1A). Interruption of the AKAP1 gene was validated by nucleotide sequencing (Fig. S1A). Immunoblots and RII overlays confirmed that expression of dAKAP1 protein was eliminated (Fig. 1B). Three clonal dAKAP1 null cell lines were derived (Fig. 1B, top, lanes 2–4). Immunofluorescent staining of WT cells revealed a distribution of dAKAP1 (green) signal that localized to the mitochondria (as indicated by the mitochondrial marker MitoTracker, deep red; Fig. 1C and the higher magnification inset). DAPI staining (blue) detected nuclei (Fig. 1C). The dAKAP1 signal was absent from dAKAP1−/− cells, although mitochondrial morphology remained intact (Fig. 1D and higher magnification inset). Similar results were obtained upon validation of the other dAKAP1−/− clonal cell lines (Fig. S1, B–D). Hence, these dAKAP1−/− cells served as a valuable reference reagent for rescue experiments that monitored how modified dAKAP1 forms alter scaffolding and ribonucleotide binding of the anchoring protein.
Interaction with PKA was abrogated via site-directed mutagenesis of two residues in the PKA binding helix (9) (Fig. 1E). Transfection of a V5-tagged ΔPKA dAKAP1 construct restored protein expression as assessed by immunoblot analysis (Fig. 1F, top, lane 2). Loss of PKA anchoring was validated by RII overlay (Fig. 1F, middle, lane 3). Equivalent expression of both proteins was evident in cell lysates, and detection of GAPDH served as a loading control (Fig. 1F, lower). Similarly, a nontargeting form of dAKAP1 was created by deleting the mitochondrial targeting domain (dAKAP1ΔMTD; Fig. 1G). V5-tagged forms of the anchoring protein were immunoprecipitated from mitochondrial fractions. The full-length anchoring protein was present in mitochondrial fractions, as detected by immunoblotting (Fig. 1H, top, lane 2). Importantly, the faster migrating dAKAP1ΔMTD form (seen as a doublet because of proteolysis) was only detected in total lysates (Fig. 1H, lower-middle, lane 3). Immunoblot detection of TOM20 served as a mitochondrial marker (Fig. 1H, lower-middle). These rescue experiments indicate that dAKAP1ΔMTD is excluded from mitochondria.
Homology modeling of the KH domain in dAKAP1 revealed which residues were important for RNA binding and stabilization (Fig. 1, I and J). Whereas the structural basis for specificity in KH domain–RNA interactions has yet to be completely elucidated, a GxxG motif forms a binding loop for RNA in many KH domains (25). This corresponds to glycine 624 to glycine 627 (Gly624-Lys-Gln-Gly627) in human dAKAP1 (Fig. 1K). These residues form an electrostatically positive surface that interfaces with the negatively charged phosphate backbone of RNA (Fig. 1K, orange). Substituting aspartic acids in the GxxG loop introduces an electrostatically negative surface that hinders RNA binding but does not alter the stability of the anchoring protein (26) (Fig. 1, L and M). This mutant anchoring protein, designated dAKAP1ΔRNA, is utilized as a control in later phases of this study.
Because the KH domain in dAKAP1 engages mRNAs, we hypothesized that the tandem KH-Tudor moiety could serve as a platform for recruitment of RNA-binding proteins. To investigate this at the molecular level, the KH-Tudor moiety (designated KHT) was bacterially expressed as a maltose-binding protein (MBP) fusion (Fig. 2, A and B). The mouse Leydig cell line MA10 was chosen because of abundant expression of Star mRNA and protein. Star mRNA is known to interact with dAKAP1 (18). Thus, MA10 cells provided a consistent source of material for our proteomic and RNA interaction analyses (18). Purified KHT was used as bait to capture interacting partners from MA10 cell lysates (Fig. 2C, lane 1). Control pulldowns were performed with MBP alone (Fig. 2C, lane 2). Analysis by LC-MS/MS identified 1181 putative interacting proteins (Fig. 2, D and E, light gray). Peptides corresponding to 487 of these proteins (≥2 per hit) were present in all five replicates (Fig. 2E, dark gray). Of these, 40 proteins were enriched with a normalized intensity of 5-fold in the KHT pulldown over the MBP control (Fig. 2, D and E, red; p < 0.05). Using the Gene Ontology (GO) database, we probed for possible functions of these high-stringency KHT-binding partners (27, 28) (Fig. 2F). Gene Ontology molecular functions with a p value of <0.001 included RNA-binding functions, such as mRNA coding sequence (CDS) binding, pre-mRNA 3′ splice site binding, and poly(A) RNA binding (Fig. 2F). In parallel, we queried the STRING database to identify prospective protein–protein interactions among our cohort of KHT-binding partners (29). As depicted in Fig. 2G, three subcomplexes were predicted: components of the spliceosome (green), the ribosome (magenta), and ribonucleoprotein (RNP) granules (blue). Because the latter group was most enriched in our proteomic screen, we further investigated the association of two key RNP components, PABPC1 and LARP4, with the full-length anchoring protein.
Figure 2.

KH–Tudor domain interaction with RNA binding proteins. A, upper, schematic of KHT fusion protein, consisting of 6× His tag and MBP domain fused to mouse dAKAP1 KH and Tudor domains. Lower, structural model of tandem KH (purple) and Tudor (dark magenta) domains. B, recombinant expression of bait protein KHT and MBP control. Left, SDS-PAGE gel of KHT and MBP stained with Coomassie blue. The migration KHT and MBP is indicated (arrows). Middle, immunoblot detection of MBP. Right, immunoblot detection of dAKAP1. C, silver stain of representative pulldowns from MA10 lysate, with KHT (lane 1) or MBP (lane 2) as bait protein. Bait proteins are indicated with arrows. D, volcano plot of MS data depicting the KHT interactome. Individual proteins are plotted as log2 enrichment score versus significance (negative log of p value; n = 5 biological replicates). Proteins enriched 5-fold or more in KHT/MBP (yellow) and high-stringency interactors (p < 0.05, FDR < 0.5; red) are indicated. E, Euler diagram representation of MS data. Area within each section is proportional to the number of proteins identified. F, Gene Ontology (GO) molecular process terms enriched in the KHT interactome. Length of bar corresponds to log-fold overrepresentation; color represents log p value for significance (Fisher's test; FDR < 0.05). G, schematized STRING database depiction of protein–protein interactions within KHT interactome. Size of circle indicates level of enrichment. Line width indicates strength of evidence of protein–protein interaction. Manual annotation of GO terms is indicated by color.
dAKAP1 localizes LARP4 to influence local protein translation
Validation of the interaction between dAKAP1 and the ribonucleoprotein components PABPC1 and LARP4 at mitochondria proceeded in several phases (Fig. 3A). Rescue experiments in the dAKAP1−/− genetic background revealed that PABPC1 associates with V5-tagged dAKAP1 (Fig. 3B, top, lane 2). Antibody compatibility issues required immunoprecipitation of V5-tagged dAKAP1 rather than the native human anchoring protein. Immunoblotting of cell lysates monitored expression levels of endogenous PABPC1, V5-dAKAP1 rescue, and GAPDH loading controls (Fig. 3B, lower).
Figure 3.

dAKAP1 recruits ribonucleoprotein complexes to mitochondria. A, schematic depicting the findings. dAKAP1 association with the RNA binding proteins PABPC1 (cyan) and LARP4 (blue). Interaction with mRNA (orange) is necessary to position ribosomes (magenta) at the outer mitochondrial membrane. B, validation of dAKAP1-PABPC1 interaction. dAKAP1 immune complexes were analyzed by immunoblotting for PAPBC1 (upper) in dAKAP1−/− cells (lane 1) and upon dAKAP1 rescue (lane 2). Immunoprecipitation was validated by immunoblot detection of dAKAP1 (upper-middle). Immunoblot detection of PAPBC1 (middle), dAKAP1 (lower-middle), and GAPDH loading control (bottom) in cell lysates is shown. C, validation of dAKAP1-LARP4 interaction. dAKAP1 immune complexes were analyzed by immunoblotting for LARP4 (upper) in dAKAP1−/− cells (lane 1) and upon dAKAP1 rescue (lane 2). Immunoprecipitation was validated by immunoblot detection of dAKAP1 (upper-middle). Immunoblot detection of LARP4 (middle), dAKAP1 (lower-middle), and GAPDH loading control (bottom) in cell lysates is shown. D, structured illumination microcopy (3D SIM) depicting codistribution of LARP4 (green) with dAKAP1 (magenta), MitoTracker (cyan), and nuclei (blue). Images represent a slice taken from a Z stack. Scale bar, 2 μm. E–G, Imaris image analysis software created a magnified 3D surface rendering of boxed region in D (white). Single-channel images are of dAKAP1 (magenta) (E), LARP4 (green) (F), and composite (G). Scale bar, 0.5 μm. H, additional images depicting the codistribution of LARP4 (green) with dAKAP1 (magenta). Integrated fluorescence intensity from 3D SIM stacks was used to build codistribution channels (white). Yellow line denotes 8-μm section used for line plot analysis in I. I, evaluation of LARP4/dAKAP1 signal overlap by line plot profiling of fluorescence intensity across an 8-μm section of mitochondria (LARP4, green; dAKAP1, magenta). J, immunoblot analysis of dAKAP1 and LARP4 levels in enriched mitochondria and crude lysates from WT HEK293T (lane 1) and two independent dAKAP1−/− clones (lanes 2–3). K, rescue of LARP4 mitochondrial localization in dAKAP1−/− cells. Mitochondria were isolated from WT HEK293T (lane 1) and dAKAP1−/− cells mock transfected (lane 2) or expressing dAKAP1 (lane 3) or dAKAP1ΔMTD (lane 4). Immunoblotting detects LARP4 (upper), dAKAP1 (upper-middle), and VDAC (middle) in mitochondrial fractions. Loading controls included immunoblot of LARP4 (lower-middle) and dAKAP1 (bottom) in total lysate. L, staining pattern of MitoTracker (cyan) and LARP4 (green) in dAKAP1−/− cells. Yellow line denotes 8-μm section used for line plot analysis. M, evaluation of MitoTracker/LARP4 signal overlap by line plot profiling of fluorescence intensity (LARP4, green; dAKAP1, cyan) in dAKAP1−/− cells. N, LARP4 interaction with dAKAP1 requires RNA. dAKAP1 immune complexes were analyzed by immunoblotting for LARP4 (upper) in dAKAP1−/− cells (lane 1) and upon dAKAP1 rescue (lane 2) and dAKAP1ΔRNA rescue (lane 3). Immunoprecipitation was validated by immunoblot detection of dAKAP1 (upper-middle). Loading controls included immunoblot of LARP4 (middle), dAKAP1 (lower-middle), and GAPDH (bottom). O, dAKAP1 augments local synthesis at mitochondria. Actively translating ribosomes were labeled by 10 µg/ml puromycin treatment for 10 min. Immunoblot detection of puromycin (upper) in mitochondrial lysates from WT (lane 1) and dAKAP1−/− (lane 2) cells. Controls include immunoblot of dAKAP1 (middle) and TOM20 (bottom) for loading and mitochondrial enrichment. P, quantification of puromycin and TOM20 staining. Selected fields of view from WT (gray) and dAKAP1−/− (red) cells were analyzed. The numbers of fields of view are indicated. Data were normalized within biological replicates (****, genotype p < 0.0001, F = 26.34; ****, drug p < 0.0001, F = 38.78; interaction p = 0.003, F = 8.827; determined by 2-way ANOVA; error bars indicate S.E.M.). Individual means of columns were compared post hoc by Tukey's test as indicated (***, p < 0.001, ****, p < 0.0001; error bars indicate S.E.M.).
Related analyses focused on the LARP4-dAKAP1 interface. Coimmunoprecipitation studies confirmed that rescue with dAKAP1 restores capture of LARP4 (Fig. 3C, top, lane 2) in the context of the dAKAP1−/− genetic background (Fig. 3C, top, lane 1). Immunoblot analysis of cell lysates monitored expression levels of LARP4, dAKAP1, and GAPDH loading controls (Fig. 3C, lower). Reciprocal experiments captured endogenous dAKAP1 upon immunoprecipitation of LARP4 (Fig. S2A).
Structured illumination (SIM) immunofluorescent microscopy revealed that the intracellular distribution of LARP4 (green) and dAKAP1 (magenta) correlated with the mitochondrial marker MitoTracker (cyan; Fig. 3D, insets and composite image). Three-dimensional reconstruction and surface rendering of mitochondria (boxed region, Fig. 3D) verify that dAKAP1 (magenta) and LARP4 (green) signals adopt similar topologies as they decorate these organelles (Figs. 3, E–G). Colocalization of the LARP4 and dAKAP1 signals in an independent sample is shown (Fig. 3H). Regions of signal overlap are indicated in white (Fig. 3H). The extent of LARP4/dAKAP1 signal overlap was evaluated by line plot intensity profiling (Figs. 3H, yellow line, and I). The LARP4 (green) and dAKAP1 (magenta) signals exhibit comparable intensity profiles (Fig. 3I). These findings support the notion that these proteins form complexes at the mitochondria.
Additional biochemical analyses were conducted in dAKAP1−/− cells. Subcellular fractionation revealed that LARP4 protein was depleted from mitochondrial fractions in two independent dAKAP1−/− clonal cell lines (Fig. 3J, middle, lanes 2 and 3). Immunoblot detection of TOM20 served as a control marker for mitochondrial enrichment (Fig. 3J, lower-middle). In contrast, immunoblot analysis of crude lysates revealed that total cellular LARP4 levels were unchanged in both genotypes (Fig. 3J, bottom).
Further confirmation of this result was provided by rescue experiments where overexpression of WT dAKAP1 restored accumulation of LARP4 to mitochondrial fractionations (Fig. 3K, top, lane 3). Importantly, enrichment of mitochondrial LARP4 was not observed when rescue experiments were conducted with dAKAP1ΔMTD (Fig. 3K, top, lane 4). Immunoblot analysis of VDAC expression served as a marker for mitochondrial enrichment and a control, unaltered protein (Fig. 3K, middle). Taken together, these biochemical studies indicate that dAKAP1 facilitates mitochondrial accumulation of the RNP-associated factor LARP4.
Attempts to detect this phenomenon by superresolution imaging were less conclusive. LARP4 signal (green) was regionally distributed at perinuclear sites reminiscent of mitochondria (Fig. 3L). However, line plot intensity profiles of LARP4 (green) and MitoTracker (blue) signals were not well correlated (Fig. 3M). Thus, loss of dAKAP1 reduces LARP4 recruitment to mitochondria but does not cause total exclusion of this RNP protein from these organelles.
The next phase of investigation was to establish if RNP proteins were recruited to dAKAP1 through association with RNA. To test this hypothesis, we used a coimmunoprecipitation approach in dAKAP1−/− cells. We evaluated LARP4 interaction upon rescue with the RNA binding-defective dAKAP1ΔRNA form. Capture of LARP4 was reduced in the presence of dAKAP1ΔRNA compared with experiments conducted with the WT anchoring protein (Fig. 3N, top, lanes 2 and 3, and Fig. S2B). Immunoblot analysis of cell lysates monitored expression levels of V5-dAKAP1 and LARP4, as well as GAPDH loading controls (Fig. 3N, lower). These studies demonstrate that association with RNA is a factor in the recruitment of LARP4 to dAKAP1 (Fig. 3A).
The LARP4–dAKAP1 interaction is especially intriguing, because LARP4 is predicted to be a PKA substrate (30). In vitro phosphorylation studies revealed that LARP4 robustly incorporated 32P in the presence of exogenous PKA, as assessed by PhosphorImager analysis (Fig. S3A, lane 4). We further examined this phosphorylation event within the context of intact dAKAP1-PKA signaling assemblies. Immune complexes of dAKAP1 were secondarily fractionated by a phospho-PKA substrate antibody. Increased levels of LARP4 were detected by immunoblotting in the presence of full-length dAKAP1 (Fig. S3B, top, lane 2). This signal was reduced upon rescue with the kinase anchoring-defective dAKAP1ΔPKA form (Fig. S3B, top, lane 3). Immunoblot analysis of cell lysates monitored expression levels of dAKAP1 and LARP4 as well as GAPDH loading controls (Fig. S3B, lower). Collectively, these studies validate our proteomic data and indicate that the RNP component PABPC1 and the PKA substrate LARP4 are elements of dAKAP1 signaling islands (Fig. 3A).
A biological role for anchored PABPC1/LARP4 subcomplexes could be to promote local translation of dAKAP1-associated mRNAs. To test this idea, we utilized SUrface SEnsing of Translation (SUnSET), a puromycin-based technique that monitors nascent protein synthesis (31). Cells were transiently treated with puromycin (10 µg/ml), an antibiotic that is incorporated into polypeptide chains (32). Immunoblot detection of puromycin labeling in isolated mitochondrial fractions served as an index of local translation (Fig. 3O, top). The puromycin signal was more pronounced in mitochondrial lysates prepared from WT cells than dAKAP1−/− cells (Fig. 3O, top, lane 1). Controls included immunoblot detection of dAKAP1 and TOM20, as well as treatment with the protein synthesis inhibitor cycloheximide to globally block translation (Fig. 3O, lower, and Fig. S4A). Immunoblot quantification of puromycin labeling was performed by line plots and area under the curve measurement (Fig. S4B). Analysis of in situ puromycin labeling revealed that mitochondrial signal was reduced in dAKAP1−/− cells compared with that of the WT (Fig. 3P, red column). Additional controls included analysis of cells pretreated with cycloheximide (Fig. S4C). Together, the findings in Fig. 3 imply that dAKAP1 serves as a platform for the assembly of RNA translation machinery. Loss of dAKAP1 precludes mitochondrial tethering of PABPC1 and LARP4, thereby attenuating local protein synthesis.
dAKAP1 anchors mRNAs that encode mitochondrial proteins
A logical extension of our working hypothesis was to query which mRNAs are incorporated into dAKAP1 signaling complexes. RNA-Seq was used to catalog RNAs that associate with the KH-Tudor moiety (Fig. 4A). Purified total RNA from MA10 cells was incubated with KHT protein. This mouse Leydig cell line was chosen for abundant expression of the Star mRNA (18). RT-PCR analyses probed for exon 2 of the Star mRNA. This mRNA was strongly amplified in the KHT fraction (Fig. 4B, lane 5 and graph, and Fig. S5). Negligible signal was detected with empty bead, MBP, and KHTΔRNA mutant controls (Fig. 4B, lanes 3, 7, and 9 and graph).
Figure 4.

dAKAP1 enriches for mRNAs encoding TCA cycle enzymes. A, schematic of RNA immunoprecipitation/sequencing strategy. B, RNA immunoprecipitation strategy is specific for KHT bait. Upper, RT-PCR detection of exon 2 of Star mRNA as a standard. To control for amplification, reactions were incubated with (+) or without (−) reverse transcriptase (RT). Bottom, quantification by densitometry. Data were normalized to KHT signal (n = 3; ****, p < 0.0001, unpaired t test; error bars show S.E.M.). C, volcano plot of RNA-Seq data. Corresponding genes are plotted as log2 enrichment score (KHT/negative controls) versus significance (negative log of p value; n = 4–5 biological replicates). Genes enriched 5-fold over background are indicated (red; p < 0.05). D, Venn diagram of KHT-associated RNAs (315; red) and mitochondrial proteins (1482; blue). Inset, gene names of KHT-associated RNAs encoding mitochondrial proteins (57; purple). E, GO biological process terms enriched in the KHT RNA interactome. The length of the bar corresponds to log fold overrepresentation; color represents log p value for significance (Fisher's test, FDR < 0.05). F, schematic of the TCA cycle. Blue, metabolites; black, enzymes. Enzymes encoded by KHT-interacting mRNAs (red) are indicated. G, loss of dAKAP1 correlates with reduced SDHA protein. Immunoblot detection of dAKAP1 (upper) in mitochondrial lysates from WT (lane 1) and dAKAP1−/− cells (lane 2). TCA cycle enzymes were detected by immunoblotting: ACO2 (upper-middle), IDH1 (middle), and SDHA (lower-middle). Immunoblot of TOM20 (bottom) served as a loading control. H, quantification of immunoblot signal by densitometry. Signal was normalized to TOM20 signal and the average of WT signal across three biological replicates. (n = 3; **, p < 0.001, unpaired t test; error bars indicate S.E.M.).
Next, purification was scaled up and RNA–protein complexes were depleted of ribosomal rRNA. The remaining material was sequenced. Four independent experimental replicates were performed for each sample. Sequence reads were pseudoaligned to the mouse transcriptome, and transcript abundances were estimated using the Kallisto package (33). The DESeq2 package was used to identify a pool of 315 KHT-associated RNAs that were significantly enriched over pooled negative controls representing empty beads, MBP alone, and KHTΔRNA (34) (Fig. 4C, red). Of these, 57 RNAs encoded mitochondrial proteins as designated in the MitoCarta 2.0 and GO databases (27, 28, 35) (Fig. 4D, purple). Gene names for each dAKAP1-associated RNA are listed (Fig. 4D, inset). Bioinformatic scrutiny by GO enrichment analysis revealed enrichment of mRNAs for proteins involved in key mitochondrial processes (Fig. 4E). These include the TCA cycle enzymes aconitase, isocitrate dehydrogenase, α-ketoglurate dehydrogenase, and succinate dehydrogenase (Fig. 4, D–F).
To determine whether dAKAP1 anchoring of these RNAs contributes to local translation, we prepared mitochondrial lysates from WT and dAKAP1−/− cells. Immunoblot detection monitored protein levels of aconitase (ACO2), isocitrate dehydrogenase 1 (IDH1), and succinate dehydrogenase A subunit (SDHA) (Fig. 4G). Immunoblot detection of TOM20 validated mitochondrial enrichment (Fig. 4G, bottom). Quantification by densitometry revealed no difference in the levels of ACO2 or IDH1 in either genotype. In contrast, SDHA protein levels were significantly reduced in dAKAP1−/− cells (Fig. 4H, red column, n = 3) compared to those with the WT (Fig. 4H, gray column, n = 3). This prompted further investigation of how dAKAP1 influences the metabolic action of succinate dehydrogenase.
dAKAP1 signaling impacts the electron transport chain complexes I and II
In mitochondria, succinate dehydrogenase participates in both the TCA cycle and the electron transport chain (Fig. 5A). The A subunit (SDHA) encodes an enzyme that oxidizes succinate to fumarate in the TCA cycle and combines with the SDHB, SDHC, and SDHD subunits to form mitochondrial electron transport chain complex II (36) (Fig. 5A, inset). We reasoned that loss of dAKAP1 could impact the local translation of electron transport complexes I–V. Immunoblot detection confirmed protein components of complex I (NDUF8) and complex II (SDHA and SDHB) were reduced in mitochondrial fractions from dAKAP1−/− cells compared with those of WT controls (Fig. 5B, lane 2, orange and red labels). This reduction in mitochondrial SDHA was confirmed in two independent dAKAP1−/− cell lines (Fig. S6). In contrast, protein levels of representative proteins from electron transport complexes III, IV, and V were equivalent in both genotypes (Fig. 5B, middle). Immunoblot detection of TOM20 served as a loading control (Fig. 5B, bottom). Further validation was provided by immunofluorescence. In WT cells, SDHA signal was prominent at the mitochondria, as denoted by TOM20 staining (Fig. 5C and inset). Conversely, the SDHA signal (green) was reduced in dAKAP1−/− cells (Fig. 5D and inset). This allows us to conclude that deletion of dAKAP1 is linked to reduced mitochondrial electron transport complex II.
Figure 5.

Loss of dAKAP1 alters TCA cycle and electron transport activity. A, schematic diagram of electron transport chain complexes I–V. Inset, complex II (succinate dehydrogenase) participates in both the TCA cycle and electron transport. The A subunit (SDHA; red) catalyzes oxidation of succinate to fumarate. B, immunoblot detection (upper) of representative proteins from electron transport chain complexes I–V in mitochondrial lysates from WT (lane 1) or dAKAP1−/− (lane 2) cells. Immunoblot detection of dAKAP1 (second from bottom) and the mitochondrial marker TOM20 (bottom) serve as controls. C and D, immunostaining of SDHA (green), mitochondrial marker TOM20 (red), and nuclear counterstain (blue) in WT (C) and dAKAP1−/− (D) cells. Scale bar, 10 μm. Inset, 2× magnification of selected square. E, complex II function assayed by mitochondrial calcium uptake. WT (gray) or dAKAP1−/− (red) cells were permeabilized in buffer containing 10 mm succinate to permit uptake of the calcium indicator Oregon Green BAPTA 6F. Upon addition of CaCl2 (50 μm), mitochondrial calcium uptake was measured continually for 60 s. Rotenone (500 μm) was used as a control to inhibit complex I. Changes in the rate of fluorescent signal decay were derived by linear regression (n = 10; ****, genotype p < 0.0001, F = 179.7; ****, rotenone p < 0.0001, F = 32.89; interaction p = 0.0014, F = 12.04; 2-way ANOVA; error bars indicate S.E.M). F, complex I function was assayed as above except in buffer containing 5 mm glutamate and malate. (n = 9; ****, genotype p = 0.0001, F = 18.59; ****, rotenone p < 0.0001, F = 131.5; interaction p =0.0499, F = 4.153; 2-way ANOVA; error bars indicate S.E.M.). E and F, individual means of columns were compared post hoc by Tukey's test as indicated. (**, p < 0.01; ***, p < 0.001; ****, p < 0.0001; error bars indicate S.E.M.).
Next, we measured mitochondrial calcium uptake as a functional readout of complex II activity (37). Oregon Green BAPTA 6F calcium indicator dye was applied to cells in buffer containing the complex II substrate succinate (10 mm). Mitochondrial calcium uptake was robust in WT cells (Fig. 5E, gray; n = 10) but was attenuated when experiments were performed in dAKAP1−/−cells (Fig. 5E, red; n = 10). Addition of the complex I inhibitor rotenone had a minimal effect on mitochondrial calcium uptake in WT cells. In contrast, rotenone further abrogated calcium uptake in dAKAP1−/− cells (Fig. 5E). This result infers that loss of dAKAP1 also impairs electron transport chain complex I. To further test this notion, calcium uptake experiments were conducted in cells resuspended in buffer containing 5 mm glutamate and malate. These TCA metabolites feed into complex I (38). Higher rates of calcium uptake were measured in WT than in dAKAP1−/− cells (Fig. 5F, gray and red bars; n = 9). As expected, calcium uptake was abolished upon the addition of rotenone (Fig. 5F; n = 9). We hypothesize that dAKAP1 assemblies contribute to the stability of NADH dehydrogenase (complex I) and succinate dehydrogenase (complex II). Thus, these local translation events constrained by dAKAP1 may help to maintain proton relay and facilitate ATP production.
Discussion
Production of proteins at their immediate sites of action lies at the heart of most metabolic and developmental aspects of cellular behavior (39–41). Compartmentalization of mRNAs is a key element of this process that coordinates protein production at membranes and organelles in response to environmental cues (42, 43). Our study points toward a new role for dAKAP1 as a molecular interface with local protein synthesis machinery. Regional translation of mRNAs is particularly relevant at mitochondria, a multipurpose organelle that mediates crucial cellular processes, including ATP production, metabolite trafficking, calcium signaling, and apoptosis (37, 44–47). The dual-specificity protein kinase A anchoring protein dAKAP1 (originally named S-AKAP84) has been implicated in targeting signaling enzymes that modulate these mitochondrial events (7, 14, 15, 23, 24). Here, we provide new mechanistic insight as to how dAKAP1 organizes appropriate combinations of signaling enzymes with RNA-binding proteins and mRNAs (7, 23, 24). These signaling units enhance local synthesis of metabolic enzymes that operate the TCA cycle and promote mitochondrial electron transport.
Anchoring proteins such as dAKAP1 typically have a modular organization composed of distinct functional domains (1). Proteomic and RNA-Seq analyses in Fig. 2 and 4 show that the KH and Tudor domain moiety of dAKAP1 binds numerous RNA species and anchors a collection of RNA binding proteins. The latter group includes PABPC1 and LARP4, protein components of RNP granules (48–51). This recently defined collection of liquid-phase separated organelles is often subdivided into three major classes (52): (i) stress granules that accumulate from stalled attempts to make protein from mRNA (53, 54); (ii) processing bodies that consist of enzymes involved in mRNA degradation (55–57); and (iii) glycolytic bodies that are enriched in signaling enzymes, such as AMP kinase, a metabolic sensor of increased glucose consumption (58). Although the latter studies have been primarily performed in yeast, they are consistent with evidence from mammalian cells suggesting that AMP kinase phosphorylation of dAKAP1 enhances mitochondrial respiration and oxygen consumption (59). Hence, modulation of RNPs by phosphorylation may be a recurring theme (60). In keeping with this notion, data presented in Fig. S3 show that LARP4 is a PKA substrate that is phosphorylated by the dAKAP1-associated pool of this kinase. Conversely, dAKAP1-tethered protein phosphatase 1 (PP1) may facilitate local signal termination by dephosphorylating LARP4. Interestingly, the Drosophila melanogaster ortholog of dAKAP1 (called MDI) was reported to associate with a LARP4-like protein, Larp, at the mitochondrial surface (61). Thus, in a variety of contexts dAKAP1 seems to provide a molecular framework to efficiently transduce second messenger signals to RNP complexes.
In addition to these protein-protein interactions, dAKAP1 association with RNA may augment the structural integrity of these RNP complexes. This underscores the notion that RNAs serve not only as messengers of the genetic code but also as structural elements that shape RNP granules (62). Our work reveals that dAKAP1 can interact with a broad range of RNA species. However, further work will be necessary to define whether there are cryptic cues that govern the specificity of these interactions. A third of the dAKAP1-associated mRNAs, identified in Fig. 4D, that encode mitochondrial proteins were also present in a recently published topological atlas of RNA populations (63). The latter study defined two modes of RNA compartmentalization: ribosome-directed targeting and ribosome-independent attachment to organelles.
Our work adds an additional layer of complexity to the ribosome-dependent targeting model by showing that dAKAP1 acts as an intermediary that scaffolds mRNAs required for local protein translation. Our data support this notion in two ways. First, studies with puromycin show that loss of dAKAP1 reduces the number of active ribosomes at the mitochondrial surface (31) (Fig. 3N). A caveat of this labeling approach is that puromycin can trigger premature release of peptides from actively translating ribosomes (32). However, we consistently detect mitochondrially localized puromycin signal, which likely represents locally translated proteins. Second, mRNA for the A subunit of the metabolic enzyme succinate dehydrogenase associates with dAKAP1 (Fig. 4D), and protein levels of this essential electron transport chain component are reduced in dAKAP1−/− cells (Fig. 4G). Thus, local translation of dAKAP1-associated mRNAs at the mitochondrial surface ensures that newly synthesized proteins are optimally positioned for translocation to their sites of action.
Mutations in the TCA cycle enzymes cause buildup of dicarboxylic acid intermediates (64). Importantly, loss-of-function mutations in genes encoding the four subunits of mitochondrial succinate dehydrogenase have been reported in several cancers, including testicular seminomas and renal and thyroid tumors (65–67). The resulting shift from oxidative phosphorylation to glycolysis drives these tumors toward a pseudohypoxic state, a phenomenon known as the Warburg effect (68–70). Biochemical and functional experiments presented in Fig. 5 show that loss of dAKAP1 depletes protein levels of succinate dehydrogenase subunits A and B and reduces activity through the electron transport chain. Prior studies demonstrated that succinate accumulation alters mitochondrial dynamics and morphology (71, 72). This is consistent with our previous finding that dAKAP1 depletion is linked to impaired mitochondrial function and dynamics in breast cancer cell lines (12). Fragmented mitochondrial networks correlate with increased glycolytic potential and invasiveness (12, 73). Furthermore, analysis of clinical samples showed that the expression of dAKAP1 is reduced in metastatic breast cancers. This led to the notion that elimination of dAKAP1 is a pathological development that alters the mitochondrial signaling terrain as breast cancers progress toward metastasis (12). The current study expands on this concept by showing that dAKAP1 physically links second messenger signaling, local protein synthesis, and energy production. Thus, dAKAP1 may further contribute to a switch from an oxidative to glycolytic metabolism through de novo synthesis of proteins at outer mitochondrial membranes.
Experimental procedures
Antibodies and reagents
Antibodies and reagents included rabbit polyclonal anti-AKAP1 (Sigma, HPA008691; AB_1078119); rabbit monoclonal anti-AKAP1 (Cell Signaling Technology, 5203; AB_10828202); rabbit polyclonal anti-PABP (Abcam, ab21060; AB_777008); rabbit polyclonal anti-LARP4 (a gift from Richard Maraia, NICHHD); rabbit polyclonal anti-LARP4 (Thermo Fisher, PA5-58727; AB_2643284); rabbit monoclonal anti-phospho-PKA substrate (Cell Signaling Technology, 9624; AB_331817); rabbit monoclonal anti-VDAC (Cell Signaling Technology, 4661; AB_10557420); rabbit monoclonal anti-ACO2 (Cell Signaling Technology, 6571; AB_2797630); rabbit polyclonal anti-IDH1 (Cell Signaling Technology, 3997; AB_1904011); mouse monoclonal OXPHOS rodent antibody mixture (Abcam, ab110413; AB_2629281); rabbit monoclonal anti-SDHA (Cell Signaling Technology,11998; AB_2750900); mouse monoclonal anti-puromycin (Millipore Sigma, MABE343; AB_2566826); rabbit polyclonal anti-TOM20 (Santa Cruz Biotechnology, sc-11415; AB_2207533); rabbit monoclonal anti-TOM20 (Cell Signaling Technology, 42406; AB_2687663); mouse monoclonal anti-FLAG M2 (Millipore Sigma, F1804; AB_262044); rabbit polyclonal anti-FLAG tag (Millipore Sigma, F7425; AB_439687); mouse monoclonal anti-V5 tag (Thermo Fisher, R960CUS; AB_2792973); rabbit monoclonal anti-GAPDH-HRP (Novus Biologicals, NB110-40405); mouse monoclonal anti-MBP-HRP (New England Biolabs, E8038S); and anti-MBP magnetic beads (New England Biolabs E8037S).
Recombinant protein purification
N-terminal MBP-6 × His-tagged fusion constructs of AKAP1 domains were cloned into a modified pMAL c5x backbone (NEB). BL21(DE3) pLys cells (ThermoFisher) were grown to an optical density at 600 nm of ∼0.5 before being induced with 1 μm IPTG for 16 h at 16 °C. Bacterial pellets were lysed in 50 ml buffer A (50 mm sodium phosphate buffer, 100 mm NaCl, 5 mm imidazole, pH 7.6) supplemented with 2 mm tris(2-carboxyethyl)phosphine (TCEP), 2 mm MgCl2, 4 mg/ml lysozyme, protease inhibitors (1 mm AEBSF, 2 μg/ml leupeptin, and 16 μg/ml benzamidine), 0.5% final concentration of Triton X-100 buffer, and 1/10,000× dilution of Benzonase. Lysate was cleared by centrifugation (15,000 × g, 20 min, 4 °C). Clarified lysate was incubated with nickel affinity resin (Roche) for 1 h at 4 °C. Beads were collected by gravity on disposable columns (Bio-Rad, Econopak 7321010). Three washes in buffer B (50 mm sodium phosphate buffer, 500 mm NaCl, pH 7.6) and 50 mm imidazole were performed. Protein was eluted in five successive fractions in buffer B containing 500 mm imidazole. Fractions were analyzed by SDS-PAGE (Any kDa TGX stain-free, Bio-Rad). Appropriate fractions were combined, concentrated by spin centrifugation (Amicon Ultra 3K, Millipore) to a volume of <5 ml, and separated by size exclusion chromatography on a HiLoad 16/600 Superdex 200 gel filtration column in buffer C (20 mm Tris-HCl, 200 mm NaCl, pH 7.6) at 0.5 ml/min. Peaks corresponding to soluble protein were pooled, flash-frozen in liquid nitrogen, and stored at −80 °C.
AKAP1 knockout generation
Guide RNAs were designed to target two sites in exon 1 of dAKAP1. Guide RNA 1 targeted the coding strand, corresponding to residues K166–S172 (5′-GCAAGATTCCCCCTTCAGCA-3′), and guide RNA 2 targeted the noncoding strand, corresponding to residues P534–T540 (5′-AGTACTTCTGGCAGTGGCG-3′). Constructs containing both guide RNAs and Cas9 were transfected into HEK293T cells by Lipofectamine 2000 (Thermo Fisher) according to the manufacturer's instructions. Cells were subjected to 2 µg/ml puromycin (Sigma) selection 72 h posttransfection before clonal selection. Single-cell-derived colonies were picked by hand with cloning disks (3.2-mm diameter, Sigma-Aldrich) soaked with 0.25% trypsin-EDTA and plated into single wells of a 96-well plate. Genomic DNA was extracted (GeneJET Genomic DNA purification kit, Thermo Fisher) to screen clonal lines.
Plasmid constructs
The human dAKAP1 ORF was purchased from OriGene (RC200506; Rockville, MD). Plasmid encoding mito-dsRed was a gift from the laboratory of Suzanne Hoppins (University of Washington). The LARP4 CDS was amplified from total HEK293 cDNA using the following primers: F (5′-ATGTTGCTTTTCGTGGAGCAG-3′) and R (5′-GGGGACCACTTTGTACAAGAAAGCTGGGTT-3′). Cloning was generally performed by PCR amplification of appropriate insert with Gateway attB sites and assembled by Gateway cloning (ThermoFisher). Mutant constructs were generated by site-directed mutagenesis (QuikChange II XL kit, Agilent). Constructs were verified by Sanger sequencing.
Protein pulldown experiments
MA10 cells were grown to confluence on 150-mm plates (Falcon), rinsed once with PBS, lifted by 0.25% Trypsin-EDTA (Gibco), and pelleted at 500 × g. Pellets were lysed in 2 ml of IP lysis buffer (20 mm HEPES, pH 7.4, 150 mm NaCl, 1 mm EDTA, 1% Triton X-100) supplemented with protease inhibitors and incubated on ice for 15 min before being cleared at 15,000 × g, 4 °C. Protein concentrations were determined by BCA assay (Pierce). 2 mg cell lysate was incubated with 25 µg protein bait with gentle rocking for 1 h at 4 °C; bait-prey complexes were recaptured by incubation with 30 μl 50% amylose bead suspension (NEB). Beads were washed, with a 1-ml volume in each wash, twice in high-salt IP lysis buffer (IP lysis buffer, 250 mm NaCl), three times in IP lysis buffer, and finally once in PBS. Washes were performed by incubating samples in wash buffer ∼1 min with rocking, followed by centrifugation at 500 × g for 1 min at 4 °C. Samples were processed for MS as described below.
MS
Proteins were eluted from amylose beads in 1× NuPAGE LDS sample buffer (Thermo Fisher) with 1 mm TCEP and 2 mm chloroacetamide. The eluents were resolved by electrophoresis, and gel lanes corresponding to each pulldown condition were excised and cut into 8 separate sections. In-gel protein digestion was performed as previously described (74). For LC-MS/MS analysis, samples were loaded to self-pulled (P2000 Sutter laser puller, Sutter Instrument, Novato, CA) 360-μm outer diameter × 100-μm inner diameter, 10-cm columns with a 7-μm tip and packed with 3 μm Reprosil C18 resin (Dr. Maisch, Germany) using a pressure cell (NextAdvance, Averill Park, NY). Peptides were analyzed with 90-min gradients of 8–35% acetonitrile at 300 nl/min nanoLC-MS (Thermo Dionex RSLCnano, Sunnyvale, CA) on an LTQ Orbitrap Elite (Thermo, Bremen Germany). Orbitrap FTMS spectra (r = 30,000 at 400 m/z; m/z 350–1600; 3e6 target; max 500-ms ion injection time) and Top15 data-dependent collision-induced dissociation MS/MS spectra (1e4 target; max 250-ms injection time) were collected with dynamic exclusion for 30 s and an exclusion list size of 50. The normalized collision energy applied for collision-induced dissociation was 35% for 10 ms. Default MaxQuant (ver. 1.5.7.4) parameter settings were used for the peptide search unless stated otherwise: Trypsin/P, max 2 miscleavages;carbamidomethyl (C) as a fixed modification; oxidation (M) and acetyl (protein N-term) as variable modifications; precursor mass tolerance was 20 ppm for the first search and 6 ppm for the main search; 0.5-Da tolerance for fragment ions; PSM and protein false discovery rate (FDR) were set to 1% and estimated by Maxquant using “Revert” decoy mode. The database used was Uniprot_Mouse.fasta (July 2016; 22,226 entries). Quantification data from MaxQuant were further processed using the Perseus software. Proteins quantified in >50% of replicates in each group were retained. Missing values were imputed in Perseus using a downshift of 2.5 and a width of 0.3 sd. Significant hits and FDR were determined using a permutation-based t test in Perseus.
RNA purification
MA10 cells were grown to confluence and total RNA was purified by TRIzol (Invitrogen), followed by two chloroform extractions. For immunoprecipitation experiments, RNA was eluted from beads by TRIzol, followed by two chloroform extractions. 10 µg glycogen was added to the aqueous phase as a carrier, followed by isopropanol precipitation and resuspension in ddH2O. RNA was quantified by NanoDrop (ThermoFisher).
RIP
Protein bait was preincubated with anti-MBP antibody magnetic beads (NEB) (∼10 µg; >10-fold molar excess protein to bead binding capacity) in RNA immunoprecipitation (RIP) buffer (20 mm Tris, pH 7.4, 150 mm NaCl, 1 mm EDTA, 0.5% IPEGAL, 100 units/ml RNase OUT), 100 μl total reaction volume, with gentle rocking for 1 h at 4 °C. Total RNA in ddH2O from MA10 cells was heated to 90 °C on a thermal cycler (Bio-Rad) for 2 min, cooled rapidly on ice for 2 min, and shifted to room temperature for 20 min to allow for proper secondary structure formation. Beads were washed three times in RIP buffer to remove excess bait protein prior to pulldowns. Beads were then incubated with 15 nm total RNA from MA10 cells in 100 μl RIP buffer with gentle rocking for 1 h at 4 °C. Beads were washed 5 times in RIP buffer, and RNA was eluted as described above.
In vitro transcription
The Star CDS, including 5′ and 3′ UTR, was amplified from MA10 total cDNA using the following primers: 5′ UTR (5′-ACTCAGGACCTTGAAAGGCTCAGG-3′) and 3′ UTR (5′-GATGCCCTCTTCTGGAGTATCTGAGG-3′). The resulting PCR product was cloned under a T7 promoter using the Zero Blunt TOPO PCR cloning kit (ThermoFisher), and orientation was verified by sequencing. RNA was transcribed using a MAXIscript T7 transcription kit (ThermoFisher) and purified by TRIzol, as above.
RT-PCR and qPCR
cDNA was generated from RNA using the SuperScript IV kit (ThermoFisher) and random hexamer priming. RNA reactions minus RT were carried throughout subsequent reactions as controls. Following first-strand synthesis and RNase digestion, PCR amplification for Star exon2 was performed using the following primers: F (5′-AGCTCAACTGGAGAGCACTG-3′) and R (5′-AGCTCAACTGGAGAGCACTG-3′). qPCR was performed using TaqMan Fast Universal PCR Master Mix, No AmpErase UNG, and the associated protocol (ThermoFisher); Taqman probes for Star (Probe number: Mm00441558_m1; ThermoFisher) and GAPDH (Probe Mm99999915_g1; ThermoFisher) were used.
RNA-Seq and analysis
Prior to RNA-Seq, integrity of RNA isolated from RNA pulldowns was analyzed by BioAnalyzer using RNA 6000 Pico chips according to the manufacturer's protocol (Agilent). Libraries were generated using a TruSeq stranded total RNA kit with Ribo Zero Depletion (Illumina); each biological replicate was barcoded individually. Libraries were sequenced on Illumina NextSeq 500. Sequencing reads were pseudoaligned to the mouse GRCm38 reference transcriptome, and the gene transcript abundances were quantified using Kallisto and the mouse transcriptome build GRCm38 (33). Differentially expressed genes between conditions were determined using DESeq2 (34).
Cell lines and culture
HEK293T (Horizon/GE Lifesciences, HCL4517) cell lines were grown in Dulbecco's modified Eagle's medium (DMEM; Gibco) supplemented with 10% fetal bovine serum (FBS; Gibco) and 1% penicillin-streptomycin (PS; Gibco). MA10 cells were a generous gift from Dr. Joseph Beavo (University of Washington) and were grown in RPMI 1640 (Gibco) supplemented with 10% horse serum (HS; Gibco) and 1% PS. HEK293T cells were transfected at 50% confluence with TransIT-LT1 (Mirus; 1:4 µg DNA:µl TransIT reagent ratio per 10-cm dish) and incubated for 48 h before further experiments were performed.
Immunofluorescence
Cells were grown on poly-l-lysine-coated 10-mm No. 1.5 glass coverslips for 12–18 h preceding transfection using TransIT-LT1 as described. Following transfection, cells were fixed for 15 min at room temperature using 4% paraformaldehyde in PBS (EMS, 15710). Permeabilization and blocking were performed for 1 h at room temperature in 0.0005% Saponin–PBS plus 10% normal goat serum, followed by three 5-min PBS washes. Cells were incubated overnight at 4°C in primary antibodies diluted (1:200) in 1% BSA plus 0.0005% Saponin–PBS. Primary incubation was followed by three 5-min PBS washes. Cells were incubated for 1 h at room temperature in secondary antibodies diluted (1:500) in 1% BSA plus 0.0005% Saponin-PBS. Finally, cells were washed three times in PBS (10 min each) and mounted onto slides using Prolong Diamond antifade medium. Coverslips were cured at room temperature overnight before being sealed and imaged.
Image acquisition
3D SIM images were acquired using a DeltaVision OMX superresolution microscope with PlanApo N 60× oil immersion objective (numeric aperture [NA], 1.42). 3D SIM images were reconstructed and aligned using Deltavision softWoRx software. Representative 3D surface renderings were created using Imaris image analysis software. Colocalization was assessed using maximum intensity projections. Fluorescence intensity profiles were created with the ImageJ “plot profile” module using lines drawn arbitrarily across the mitochondrial network. Fluorescence intensity was compared between channels along the same line. Widefield images were acquired either using the Deltavision OMX superresolution microscope with PlanApo N 60× oil immersion objective (NA, 1.42), or a Keyence BZ-× 710 microscope with PlanApo_l 100xH oil immersion objective (NA, 1.45). Widefield images acquired on the OMX were deconvolved and aligned using Deltavision softWorx software, and colocalization was assessed from line profiles as described above. Within experiments, all images were acquired with the same magnification, exposure time, and illumination intensity. Images were processed and quantified using ImageJ software.
Immunoprecipitation
Cells were harvested on ice in PBS by scraping, followed by pelleting at 1000 × g, and washed once in cold PBS. Cell pellets were suspended in RIPA buffer (50 mm Tris-HCl, pH 7.4, 150 mm NaCl, 1% Triton X-100, 0.5% sodium deoxycholate, 0.1% SDS, 1 mm EDTA, 50 mm NaF; 500 μl per 10-cm plate) supplemented with protease and phosphatase inhibitors (1 mm AEBSF, 2 μg/ml leupeptin, 16 μg/ml benzamidine, 100 nm okadaic acid, 1 mm sodium orthovandanate) and incubated on ice for 15 min, with occasional vortexing, before being cleared at 15,000 × g at 4 °C. Supernatants were collected and protein concentrations were determined by BCA assay (Pierce). For most IP reactions, 1 µg of appropriate antibody was incubated with 1 mg lysate per reaction in a 1-ml total volume. Depending on the antibody, reactions were carried out at 4 °C with rocking for either 1 h or overnight. Following primary antibody incubation, 15 μl 50% 1:1 Protein A:G agarose suspension (mixed from components; Millipore, 16-156/16-266) was used to isolate immune complexes by incubation for 1 h with rocking at 4 °C. Captured complexes were washed five times as described above. Beads were resuspended in 1 ml RIPA and pelleted by centrifugation at 500 × g for 1 min, and supernatant was aspirated. Following the final wash, beads were resuspended in 15 μl 1× NuPAGE LDS sample buffer (Thermo Fisher) supplemented with 5% 2-mercaptoethanol (Sigma-Aldrich) and boiled for 5 min at 95 °C before resolution by SDS-PAGE.
For serial co-IP experiments, the first IP reaction was carried out as described above with anti-V5 antibody, followed by an additional wash in 1 ml PBS. A small volume (5 μl) of beads was saved as input. V5-dAKAP1 immune complexes were eluted from beads by incubation with 3 column volumes (30 μl) of V5 peptide (2.5 mg/ml) in PBS (Millipore Sigma, V7754-4MG; ∼0.25 M) with gentle rocking for 5 min at room temperature. Beads were pelleted at 1000 × g, 1 min, 4 °C, and the supernatant was used as the input for secondary IP reaction, supplemented with additional RIPA without SDS to a total volume of 100 μl. A small volume (5 μl) was saved as the input. Secondary co-IP reactions were performed with anti-phosphoPKA substrate antibody (CST) (2 μl; 1:50) in 0.5-ml Eppendorf tubes; all subsequent steps were carried out as above.
In vitro phosphorylation
In vitro phosphorylation experiments were performed as previously described (75, 76). Briefly, following immunoprecipitation of substrate, beads were resuspended in kinase reaction kinase assay buffer supplemented with 0.2 µg PKAc for 30 min at 30 °C. Reactions were stopped by resuspension in 2× Laemmli sample buffer and resolved by SDS-PAGE before transfer to nitrocellulose membrane. Membranes were exposed to a phosphor screen (Molecular Dynamics) for up to 48 h before imaging on a Personal Molecular Imager (Bio-Rad).
Immunoblotting
Lysed samples were boiled for 5 min at 95 °C in 1× NuPAGE LDS sample buffer (Thermo Fisher) supplemented with 5% 2-mercaptoethanol (Sigma-Aldrich). Samples were resolved on Bolt 4–12% Bis-Tris Plus gels (Invitrogen), and proteins were transferred to nitrocellulose for immunoblotting using standard techniques. Membranes were blocked for 1 h in 5% nonfat dry milk and 1% BSA in Tris-buffered saline (50 mm Tris-Cl, pH 7.5, 150 mm NaCl) with 0.05% Tween (TBST). They were incubated with primary antibodies according to the manufacturer's instructions (either room temperature for 1–2 h or overnight at 4 °C). Blots were washed three times at room temperature, with gentle rocking for 10 min each, in TBST. Detection was achieved by incubation with an HRP-conjugated secondary antibody (1:10,000 in 5% NFDM; GE Healthcare), followed by washing as above and enhanced chemiluminescence detection with SuperSignal West Pico or Dura extended-duration substrate (Thermo Fisher). Densitometry was performed using NIH ImageJ (Fiji) software.
Subcellular fractionation and mitochondrion isolation
Cells were grown to confluence and harvested in cold PBS by scraping, followed by pelleting at 1000 × g. Cell pellets were washed once in PBS, and 1/10 of the total cell pellet was saved for whole-cell lysate. Mitochondria were isolated by following published methods (77). Whole-cell and mitochondrial lysates were suspended in RIPA buffer and incubated on ice for 15 min, with occasional vortexing, before being cleared at 15,000 × g at 4 °C. Pellets were resuspended in RIPA as above. Protein concentrations were determined by BCA assay.
Puromycin labeling of ribosomes
Puromycin labeling protocols were adapted from published methods (31). Cells were passaged into antibiotic-free media and grown to confluence. Treatments included puromycin (10 µg/ml puromycin), cycloheximide (100 μm cycloheximide), and both cycloheximide and puromycin. Cells were pretreated with cycloheximide for 10 min before addition of puromycin or vehicle and subsequent incubation for an additional 10 min. After treatment, cells were harvested by scraping in PBS and washed once with PBS before subsequent analysis. Independent experiments consisting of immunofluorescent detection of puromycin labeling were performed and quantified as described above.
Statistical analyses
Generally, data were analyzed in Prism 8 (Graphpad). Statistically significant differences between samples were calculated as indicated in the figure legends, using Student's two-tailed t test or analysis of variance (ANOVA) with post hoc multiple comparisons by Tukey's test for groups of 3 or more. All results are presented as the mean ± S.E.M. unless otherwise indicated. Sample size (n) indicated the number of independent experiments represented in amalgamated data. p values of <0.05 were considered statistically significant.
Data availability
All RNA-Seq and proteomic data referenced in this work will be made publicly available. RNA-Seq data were deposited in GEO with accession number GSE138277. Raw MS data have been uploaded to MassIVE, an NIH-supported MS data repository (MSV000085087).
Supplementary Material
This article contains supporting information.
Author contributions—L. G., F. D. S., and J. D. S. conceptualization; L. G., S. A., L. M. S., H.-T. L., Y. S., C. T., S.-E. O., F. D. S., and J. D. S. resources; L. G., L. M. S., and H.-T. L. data curation; L. G., K. B. C., L. M. S., and H.-T. L. formal analysis; L. G., S. A., L. M. S., C. T., S.-E. O., and J. D. S. funding acquisition; L. G. validation; L. G., K. B. C., S. A., L. M. S., H.-T. L., and D. S. investigation; L. G. and K. B. C. visualization; L. G., K. B. C., Y. S., S.-E. O., F. D. S., and J. D. S. methodology; L. G., F. D. S., and J. D. S. writing-original draft; K. B. C. writing-review and editing; C. T. software; F. D. S. supervision; J. D. S. project administration.
Funding and additional information—L. G., S. A., and L. M. S. were supported in part by PHS NRSA T32GM007270 from NIGMS. L. G. and L. M. S. were supported in part by the Department of Molecular and Cellular Biology at the University of Washington. C. T. is supported by NIH DP2 HD088158, Paul G. Allen Frontiers Group-Allen Discovery Center grant, W. M. Keck Foundation Grant, and the Alfred P. Sloan Foundation Research Fellowship. S.-E. O., H.-T. L., and F. D. S. were supported by DOD CA150370 and NIH NIAMS AR065459. J. D. S. is supported by DK105542 and DK119192 from the NIH. The content is solely the responsibility of the authors and does not necessarily represent the official views of the National Institutes of Health.
Conflict of interest—The authors declare that they have no conflicts of interest with the contents of this article.
- SIM
- structured illumination
- FDR
- false discovery rate
- NA
- numeric aperture
- ANOVA
- analysis of variance
- CDS
- coding sequence.
References
- 1. Scott J. D., and Pawson T. (2009) Cell signaling in space and time: where proteins come together and when they're apart. Science 326, 1220–1224 10.1126/science.1175668 [DOI] [PMC free article] [PubMed] [Google Scholar]
- 2. Wong W., and Scott J. D. (2004) AKAP signalling complexes: focal points in space and time. Nat. Rev. Mol. Cell Biol. 5, 959–971 10.1038/nrm1527 [DOI] [PubMed] [Google Scholar]
- 3. Means C. K., Lygren B., Langeberg L. K., Jain A., Dixon R. E., Vega A. L., Gold M. G., Petrosyan S., Taylor S. S., Murphy A. N., Ha T., Santana L. F., Tasken K., and Scott J. D. (2011) An entirely specific type I A-kinase anchoring protein that can sequester two molecules of protein kinase A at mitochondria. Proc. Natl. Acad. Sci. U S A 108, E1227–E1235 10.1073/pnas.1107182108 [DOI] [PMC free article] [PubMed] [Google Scholar]
- 4. Tingley W. G., Pawlikowska L., Zaroff J. G., Kim T., Nguyen T., Young S. G., Vranizan K., Kwok P. Y., Whooley M. A., and Conklin B. R. (2007) Gene-trapped mouse embryonic stem cell-derived cardiac myocytes and human genetics implicate AKAP10 in heart rhythm regulation. Proc. Natl. Acad. Sci. U S A 104, 8461–8466 10.1073/pnas.0610393104 [DOI] [PMC free article] [PubMed] [Google Scholar]
- 5. Pidoux G., Witczak O., Jarnæss E., Myrvold L., Urlaub H., Stokka A. J., Küntziger T., and Taskén K. (2011) Optic atrophy 1 is an A-kinase anchoring protein on lipid droplets that mediates adrenergic control of lipolysis. EMBO J. 30, 4371–4386 10.1038/emboj.2011.365 [DOI] [PMC free article] [PubMed] [Google Scholar]
- 6. Dodge K. L., Khouangsathiene S., Kapiloff M. S., Mouton R., Hill E. V., Houslay M. D., Langeberg L. K., and Scott J. D. (2001) mAKAP assembles a protein kinase A/PDE4 phosphodiesterase cAMP signaling module. EMBO J. 20, 1921–1930 10.1093/emboj/20.8.1921 [DOI] [PMC free article] [PubMed] [Google Scholar]
- 7. Steen R. L., Martins S. B., Tasken K., and Collas P. (2000) Recruitment of protein phosphatase 1 to the nuclear envelope by A- kinase anchoring protein AKAP149 is a prerequisite for nuclear lamina assembly. J. Cell Biol. 150, 1251–1262 10.1083/jcb.150.6.1251 [DOI] [PMC free article] [PubMed] [Google Scholar]
- 8. Smith F. D., Omar M. H., Nygren P. J., Soughayer J., Hoshi N., Lau H. T., Snyder C. G., Branon T. C., Ghosh D., Langeberg L. K., Ting A. Y., Santana L. F., Ong S. E., Navedo M. F., and Scott J. D. (2018) Single nucleotide polymorphisms alter kinase anchoring and the subcellular targeting of A-kinase anchoring proteins. Proc. Natl. Acad. Sci. U S A 115, E11465–E11474 10.1073/pnas.1816614115 [DOI] [PMC free article] [PubMed] [Google Scholar]
- 9. Carr D. W., Stofko-Hahn R. E., Fraser I. D., Bishop S. M., Acott T. S., Brennan R. G., and Scott J. D. (1991) Interaction of the regulatory subunit (RII) of cAMP-dependent protein kinase with RII-anchoring proteins occurs through an amphipathic helix binding motif. J. Biol. Chem. 266, 14188–14192 [PubMed] [Google Scholar]
- 10. Gold M. G., Lygren B., Dokurno P., Hoshi N., McConnachie G., Tasken K., Carlson C. R., Scott J. D., and Barford D. (2006) Molecular basis of AKAP specificity for PKA regulatory subunits. Mol. Cell 24, 383–395 10.1016/j.molcel.2006.09.006 [DOI] [PubMed] [Google Scholar]
- 11. Smith F. D., Esseltine J. L., Nygren P. J., Veesler D., Byrne D. P., Vonderach M., Strashnov I., Eyers C. E., Eyers P. A., Langeberg L. K., and Scott J. D. (2017) Local protein kinase A action proceeds through intact holoenzymes. Science 356, 1288–1293 10.1126/science.aaj1669 [DOI] [PMC free article] [PubMed] [Google Scholar]
- 12. Aggarwal S., Gabrovsek L., Langeberg L. K., Golkowski M., Ong S. E., Smith F. D., and Scott J. D. (2019) Depletion of dAKAP1-protein kinase A signaling islands from the outer mitochondrial membrane alters breast cancer cell metabolism and motility. J. Biol. Chem. 294, 3152–3168 10.1074/jbc.RA118.006741 [DOI] [PMC free article] [PubMed] [Google Scholar]
- 13. Lefkimmiatis K., and Zaccolo M. (2014) cAMP signaling in subcellular compartments. Pharmacol. Ther. 143, 295–304 10.1016/j.pharmthera.2014.03.008 [DOI] [PMC free article] [PubMed] [Google Scholar]
- 14. Huang L. J., Durick K., Weiner J. A., Chun J., and Taylor S. S. (1997) Identification of a novel protein kinase A anchoring protein that binds both type I and type II regulatory subunits. J. Biol. Chem. 272, 8057–8064 10.1074/jbc.272.12.8057 [DOI] [PubMed] [Google Scholar]
- 15. Lin R. Y., Moss S. B., and Rubin C. S. (1995) Characterization of S-AKAP84, a novel developmentally regulated A kinase anchor protein of male germ cells. J. Biol. Chem. 270, 27804–27811 10.1074/jbc.270.46.27804 [DOI] [PubMed] [Google Scholar]
- 16. Ginsberg M. D., Feliciello A., Jones J. K., Avvedimento E. V., and Gottesman M. E. (2003) PKA-dependent binding of mRNA to the mitochondrial AKAP121 protein. J. Mol. Biol. 327, 885–897 10.1016/S0022-2836(03)00173-6 [DOI] [PubMed] [Google Scholar]
- 17. Rogne M., Landsverk H. B., Van Eynde A., Beullens M., Bollen M., Collas P., and Kuntziger T. (2006) The KH-Tudor domain of a-kinase anchoring protein 149 mediates RNA-dependent self-association. Biochemistry 45, 14980–14989 10.1021/bi061418y [DOI] [PubMed] [Google Scholar]
- 18. Grozdanov P. N., and Stocco D. M. (2012) Short RNA molecules with high binding affinity to the KH motif of A-kinase anchoring protein 1 (AKAP1): implications for the regulation of steroidogenesis. Mol. Endocrinol. 26, 2104–2117 10.1210/me.2012-1123 [DOI] [PMC free article] [PubMed] [Google Scholar]
- 19. Merrill R. A., and Strack S. (2014) Mitochondria: a kinase anchoring protein 1, a signaling platform for mitochondrial form and function. Int. J Biochem. Cell Biol. 48, 92–96 10.1016/j.biocel.2013.12.012 [DOI] [PMC free article] [PubMed] [Google Scholar]
- 20. Nygren P. J., Mehta S., Schweppe D. K., Langeberg L. K., Whiting J. L., Weisbrod C. R., Bruce J. E., Zhang J., Veesler D., and Scott J. D. (2017) Intrinsic disorder within AKAP79 fine-tunes anchored phosphatase activity toward substrates and drug sensitivity. eLife 6, e30872 10.7554/eLife.30872 [DOI] [PMC free article] [PubMed] [Google Scholar]
- 21. Smith F. D., Reichow S. L., Esseltine J. L., Shi D., Langeberg L. K., Scott J. D., and Gonen T. (2013) Intrinsic disorder within an AKAP-protein kinase A complex guides local substrate phosphorylation. eLife 2, e01319 10.7554/eLife.01319 [DOI] [PMC free article] [PubMed] [Google Scholar]
- 22. Chen C., Nott T. J., Jin J., and Pawson T. (2011) Deciphering arginine methylation: Tudor tells the tale. Nat. Rev. Mol. Cell Biol. 12, 629–642 10.1038/nrm3185 [DOI] [PubMed] [Google Scholar]
- 23. Cardone L., Carlucci A., Affaitati A., Livigni A., DeCristofaro T., Garbi C., Varrone S., Ullrich A., Gottesman M. E., Avvedimento E. V., and Feliciello A. (2004) Mitochondrial AKAP121 binds and targets protein tyrosine phosphatase D1, a novel positive regulator of src signaling. Mol. Cell. Biol. 24, 4613–4626 10.1128/MCB.24.11.4613-4626.2004 [DOI] [PMC free article] [PubMed] [Google Scholar]
- 24. Merrill R. A., Dagda R. K., Dickey A. S., Cribbs J. T., Green S. H., Usachev Y. M., and Strack S. (2011) Mechanism of neuroprotective mitochondrial remodeling by PKA/AKAP1. PLoS Biol. 9, e1000612 10.1371/journal.pbio.1000612 [DOI] [PMC free article] [PubMed] [Google Scholar]
- 25. Valverde R., Edwards L., and Regan L. (2008) Structure and function of KH domains. FEBS J. 275, 2712–2726 10.1111/j.1742-4658.2008.06411.x [DOI] [PubMed] [Google Scholar]
- 26. Hollingworth D., Candel A. M., Nicastro G., Martin S. R., Briata P., Gherzi R., and Ramos A. (2012) KH domains with impaired nucleic acid binding as a tool for functional analysis. Nucleic Acids Res. 40, 6873–6886 10.1093/nar/gks368 [DOI] [PMC free article] [PubMed] [Google Scholar]
- 27. Ashburner M., Ball C. A., Blake J. A., Botstein D., Butler H., Cherry J. M., Davis A. P., Dolinski K., Dwight S. S., Eppig J. T., Harris M. A., Hill D. P., Issel-Tarver L., Kasarskis A., Lewis S., et al. (2000) Gene ontology: tool for the unification of biology. Nat. Genet. 25, 25–29 10.1038/75556 [DOI] [PMC free article] [PubMed] [Google Scholar]
- 28. The Gene Ontology Consortium, (2019) The Gene Ontology Resource: 20 years and still GOing strong. Nucleic Acids Res. 47, D330–D338 10.1093/nar/gky1055 [DOI] [PMC free article] [PubMed] [Google Scholar]
- 29. Szklarczyk D., Franceschini A., Wyder S., Forslund K., Heller D., Huerta-Cepas J., Simonovic M., Roth A., Santos A., Tsafou K. P., Kuhn M., Bork P., Jensen L. J., and von Mering C. (2015) STRING v10: protein-protein interaction networks, integrated over the tree of life. Nucleic Acids Res. 43, D447–D452 10.1093/nar/gku1003 [DOI] [PMC free article] [PubMed] [Google Scholar]
- 30. Blom N., Sicheritz-Ponten T., Gupta R., Gammeltoft S., and Brunak S. (2004) Prediction of post-translational glycosylation and phosphorylation of proteins from the amino acid sequence. Proteomics 4, 1633–1649 10.1002/pmic.200300771 [DOI] [PubMed] [Google Scholar]
- 31. Schmidt E. K., Clavarino G., Ceppi M., and Pierre P. (2009) SUnSET, a nonradioactive method to monitor protein synthesis. Nat Methods 6, 275–277 10.1038/nmeth.1314 [DOI] [PubMed] [Google Scholar]
- 32. David A., Dolan B. P., Hickman H. D., Knowlton J. J., Clavarino G., Pierre P., Bennink J. R., and Yewdell J. W. (2012) Nuclear translation visualized by ribosome-bound nascent chain puromycylation. J. Cell Biol. 197, 45–57 10.1083/jcb.201112145 [DOI] [PMC free article] [PubMed] [Google Scholar]
- 33. Bray N. L., Pimentel H., Melsted P., and Pachter L. (2016) Near-optimal probabilistic RNA-seq quantification. Nat. Biotechnol. 34, 525–527 10.1038/nbt.3519 [DOI] [PubMed] [Google Scholar]
- 34. Love M. I., Huber W., and Anders S. (2014) Moderated estimation of fold change and dispersion for RNA-seq data with DESeq2. Genome Biol. 15, 550 10.1186/s13059-014-0550-8 [DOI] [PMC free article] [PubMed] [Google Scholar]
- 35. Calvo S. E., Clauser K. R., and Mootha V. K. (2016) MitoCarta2.0: an updated inventory of mammalian mitochondrial proteins. Nucleic Acids Res. 44, D1251–D1257 10.1093/nar/gkv1003 [DOI] [PMC free article] [PubMed] [Google Scholar]
- 36. Hwang M. S., Rohlena J., Dong L. F., Neuzil J., and Grimm S. (2014) Powerhouse down: complex II dissociation in the respiratory chain. Mitochondrion 19(Pt A), 20–28 10.1016/j.mito.2014.06.001 [DOI] [PubMed] [Google Scholar]
- 37. Sancak Y., Markhard A. L., Kitami T., Kovacs-Bogdan E., Kamer K. J., Udeshi N. D., Carr S. A., Chaudhuri D., Clapham D. E., Li A. A., Calvo S. E., Goldberger O., and Mootha V. K. (2013) EMRE is an essential component of the mitochondrial calcium uniporter complex. Science 342, 1379–1382 10.1126/science.1242993 [DOI] [PMC free article] [PubMed] [Google Scholar]
- 38. Schwerzmann K., Hoppeler H., Kayar S. R., and Weibel E. R. (1989) Oxidative capacity of muscle and mitochondria: correlation of physiological, biochemical, and morphometric characteristics. Proc. Natl. Acad. Sci. U S A 86, 1583–1587 10.1073/pnas.86.5.1583 [DOI] [PMC free article] [PubMed] [Google Scholar]
- 39. Jung H., Gkogkas C. G., Sonenberg N., and Holt C. E. (2014) Remote control of gene function by local translation. Cell 157, 26–40 10.1016/j.cell.2014.03.005 [DOI] [PMC free article] [PubMed] [Google Scholar]
- 40. Chekulaeva M., and Landthaler M. (2016) Eyes on translation. Mol. Cell 63, 918–925 10.1016/j.molcel.2016.08.031 [DOI] [PubMed] [Google Scholar]
- 41. Besse F., and Ephrussi A. (2008) Translational control of localized mRNAs: restricting protein synthesis in space and time. Nat. Rev. Mol. Cell Biol. 9, 971–980 10.1038/nrm2548 [DOI] [PubMed] [Google Scholar]
- 42. Lecuyer E., Yoshida H., Parthasarathy N., Alm C., Babak T., Cerovina T., Hughes T. R., Tomancak P., and Krause H. M. (2007) Global analysis of mRNA localization reveals a prominent role in organizing cellular architecture and function. Cell 131, 174–187 10.1016/j.cell.2007.08.003 [DOI] [PubMed] [Google Scholar]
- 43. Kaewsapsak P., Shechner D. M., Mallard W., Rinn J. L., and Ting A. Y. (2017) Live-cell mapping of organelle-associated RNAs via proximity biotinylation combined with protein-RNA crosslinking. eLife 6, e29224 10.7554/eLife.29224 [DOI] [PMC free article] [PubMed] [Google Scholar]
- 44. Lesnik C., Golani-Armon A., and Arava Y. (2015) Localized translation near the mitochondrial outer membrane: an update. RNA Biol. 12, 801–809 10.1080/15476286.2015.1058686 [DOI] [PMC free article] [PubMed] [Google Scholar]
- 45. Nunnari J., and Suomalainen A. (2012) Mitochondria: in sickness and in health. Cell 148, 1145–1159 10.1016/j.cell.2012.02.035 [DOI] [PMC free article] [PubMed] [Google Scholar]
- 46. Murphy M. P. (2009) How mitochondria produce reactive oxygen species. Biochem. J. 417, 1–13 10.1042/BJ20081386 [DOI] [PMC free article] [PubMed] [Google Scholar]
- 47. Yu S. B., and Pekkurnaz G. (2018) Mechanisms orchestrating mitochondrial dynamics for energy homeostasis. J. Mol. Biol. 430, 3922–3941 10.1016/j.jmb.2018.07.027 [DOI] [PMC free article] [PubMed] [Google Scholar]
- 48. Markmiller S., Soltanieh S., Server K. L., Mak R., Jin W., Fang M. Y., Luo E. C., Krach F., Yang D., Sen A., Fulzele A., Wozniak J. M., Gonzalez D. J., Kankel M. W., Gao F. B., et al. (2018) Context-dependent and disease-specific diversity in protein interactions within stress granules. Cell 172, 590–604 10.1016/j.cell.2017.12.032 [DOI] [PMC free article] [PubMed] [Google Scholar]
- 49. Balagopal V., and Parker R. (2009) Polysomes, P bodies and stress granules: states and fates of eukaryotic mRNAs. Curr. Opin. Cell Biol. 21, 403–408 10.1016/j.ceb.2009.03.005 [DOI] [PMC free article] [PubMed] [Google Scholar]
- 50. Kozlov G., Safaee N., Rosenauer A., and Gehring K. (2010) Structural basis of binding of P-body-associated proteins GW182 and ataxin-2 by the Mlle domain of poly(A)-binding protein. J. Biol. Chem. 285, 13599–13606 10.1074/jbc.M109.089540 [DOI] [PMC free article] [PubMed] [Google Scholar]
- 51. Stavraka C., and Blagden S. (2015) The La-related proteins, a family with connections to cancer. Biomolecules 5, 2701–2722 10.3390/biom5042701 [DOI] [PMC free article] [PubMed] [Google Scholar]
- 52. Boeynaems S., Alberti S., Fawzi N. L., Mittag T., Polymenidou M., Rousseau F., Schymkowitz J., Shorter J., Wolozin B., Van Den Bosch L., Tompa P., and Fuxreiter M. (2018) Protein phase separation: a new phase in cell biology. Trends Cell Biol. 28, 420–435 10.1016/j.tcb.2018.02.004 [DOI] [PMC free article] [PubMed] [Google Scholar]
- 53. Khong A., Matheny T., Jain S., Mitchell S. F., Wheeler J. R., and Parker R. (2017) The stress granule transcriptome reveals principles of mRNA accumulation in stress granules. Mol. Cell 68, 808–820.e805 10.1016/j.molcel.2017.10.015 [DOI] [PMC free article] [PubMed] [Google Scholar]
- 54. Jain S., Wheeler J. R., Walters R. W., Agrawal A., Barsic A., and Parker R. (2016) ATPase-modulated stress granules contain a diverse proteome and substructure. Cell 164, 487–498 10.1016/j.cell.2015.12.038 [DOI] [PMC free article] [PubMed] [Google Scholar]
- 55. Teixeira D., Sheth U., Valencia-Sanchez M. A., Brengues M., and Parker R. (2005) Processing bodies require RNA for assembly and contain nontranslating mRNAs. RNA 11, 371–382 10.1261/rna.7258505 [DOI] [PMC free article] [PubMed] [Google Scholar]
- 56. Eulalio A., Behm-Ansmant I., and Izaurralde E. (2007) P bodies: at the crossroads of post-transcriptional pathways. Nat. Rev. Mol. Cell Biol. 8, 9–22 10.1038/nrm2080 [DOI] [PubMed] [Google Scholar]
- 57. Kershaw C. J., and Ashe M. P. (2017) Untangling P-bodies: dissecting the complex web of interactions that enable tiered control of gene expression. Mol. Cell 68, 3–4 10.1016/j.molcel.2017.09.032 [DOI] [PubMed] [Google Scholar]
- 58. Jin M., Fuller G. G., Han T., Yao Y., Alessi A. F., Freeberg M. A., Roach N. P., Moresco J. J., Karnovsky A., Baba M., Yates J. R. 3rd, Gitler A. D., Inoki K., Klionsky D. J., and Kim J. K. (2017) Glycolytic enzymes coalesce in G bodies under hypoxic stress. Cell Rep. 20, 895–908 10.1016/j.celrep.2017.06.082 [DOI] [PMC free article] [PubMed] [Google Scholar]
- 59. Hoffman N. J., Parker B. L., Chaudhuri R., Fisher-Wellman K. H., Kleinert M., Humphrey S. J., Yang P., Holliday M., Trefely S., Fazakerley D. J., Stockli J., Burchfield J. G., Jensen T. E., Jothi R., Kiens B., et al. (2015) Global phosphoproteomic analysis of human skeletal muscle reveals a network of exercise-regulated kinases and AMPK substrates. Cell Metab. 22, 922–935 10.1016/j.cmet.2015.09.001 [DOI] [PMC free article] [PubMed] [Google Scholar]
- 60. Wang J. T., Smith J., Chen B. C., Schmidt H., Rasoloson D., Paix A., Lambrus B. G., Calidas D., Betzig E., and Seydoux G. (2014) Regulation of RNA granule dynamics by phosphorylation of serine-rich, intrinsically disordered proteins in C. elegans. eLife 3, e04591 10.7554/eLife.04591 [DOI] [PMC free article] [PubMed] [Google Scholar]
- 61. Zhang Y., Chen Y., Gucek M., and Xu H. (2016) The mitochondrial outer membrane protein MDI promotes local protein synthesis and mtDNA replication. EMBO J. 35, 1045–1057 10.15252/embj.201592994 [DOI] [PMC free article] [PubMed] [Google Scholar]
- 62. Van Treeck B., Protter D. S. W., Matheny T., Khong A., Link C. D., and Parker R. (2018) RNA self-assembly contributes to stress granule formation and defining the stress granule transcriptome. Proc. Natl. Acad. Sci. U S A 115, 2734–2739 10.1073/pnas.1800038115 [DOI] [PMC free article] [PubMed] [Google Scholar]
- 63. Fazal F. M., Han S., Parker K. R., Kaewsapsak P., Xu J., Boettiger A. N., Chang H. Y., and Ting A. Y. (2019) Atlas of subcellular RNA localization revealed by APEX-Seq. Cell 178, 473–490e426 10.1016/j.cell.2019.05.027 [DOI] [PMC free article] [PubMed] [Google Scholar]
- 64. He W., Miao F. J., Lin D. C., Schwandner R. T., Wang Z., Gao J., Chen J. L., Tian H., and Ling L. (2004) Citric acid cycle intermediates as ligands for orphan G-protein-coupled receptors. Nature 429, 188–193 10.1038/nature02488 [DOI] [PubMed] [Google Scholar]
- 65. Bardella C., Pollard P. J., and Tomlinson I. (2011) SDH mutations in cancer. Biochim. Biophys. Acta 1807, 1432–1443 10.1016/j.bbabio.2011.07.003 [DOI] [PubMed] [Google Scholar]
- 66. Lussey-Lepoutre C., Hollinshead K. E., Ludwig C., Menara M., Morin A., Castro-Vega L. J., Parker S. J., Janin M., Martinelli C., Ottolenghi C., Metallo C., Gimenez-Roqueplo A. P., Favier J., and Tennant D. A. (2015) Loss of succinate dehydrogenase activity results in dependency on pyruvate carboxylation for cellular anabolism. Nat. Commun. 6, 8784 10.1038/ncomms9784 [DOI] [PMC free article] [PubMed] [Google Scholar]
- 67. Galera-Ruiz H., Gonzalez-Campora R., Rey-Barrera M., Rollon-Mayordomo A., Garcia-Escudero A., Fernandez-Santos J. M., DeMiguel M., and Galera-Davidson H. (2008) W43X SDHD mutation in sporadic head and neck paraganglioma. Anal. Quant. Cytol. Histol. 30, 119–123 [PubMed] [Google Scholar]
- 68. Cardaci S., and Ciriolo M. R. (2012) TCA cycle defects and cancer: when metabolism tunes redox state. Int J. Cell Biol. 2012, 161837 10.1155/2012/161837 [DOI] [PMC free article] [PubMed] [Google Scholar]
- 69. Warburg O. (1956) On the origin of cancer cells. Science 123, 309–314 10.1126/science.123.3191.309 [DOI] [PubMed] [Google Scholar]
- 70. Warburg O. (1956) On respiratory impairment in cancer cells. Science 124, 269–270 10.1126/science.124.3215.267 [DOI] [PubMed] [Google Scholar]
- 71. Wu B., Luo H., Zhou X., Cheng C. Y., Lin L., Liu B. L., Liu K., Li P., and Yang H. (2017) Succinate-induced neuronal mitochondrial fission and hexokinase II malfunction in ischemic stroke: therapeutical effects of kaempferol. Biochim. Biophys. Acta Mol. Basis Dis. 1863, 2307–2318 10.1016/j.bbadis.2017.06.011 [DOI] [PubMed] [Google Scholar]
- 72. Lu Y. T., Li L. Z., Yang Y. L., Yin X., Liu Q., Zhang L., Liu K., Liu B., Li J., and Qi L. W. (2018) Succinate induces aberrant mitochondrial fission in cardiomyocytes through GPR91 signaling. Cell Death Dis. 9, 672 10.1038/s41419-018-0708-5 [DOI] [PMC free article] [PubMed] [Google Scholar]
- 73. Srinivasan S., Guha M., Kashina A., and Avadhani N. G. (2017) Mitochondrial dysfunction and mitochondrial dynamics–the cancer connection. Biochim. Biophys. Acta Bioenerg. 1858, 602–614 10.1016/j.bbabio.2017.01.004 [DOI] [PMC free article] [PubMed] [Google Scholar]
- 74. Lau H. T., Suh H. W., Golkowski M., and Ong S. E. (2014) Comparing SILAC- and stable isotope dimethyl-labeling approaches for quantitative proteomics. J. Proteome Res. 13, 4164–4174 10.1021/pr500630a [DOI] [PMC free article] [PubMed] [Google Scholar]
- 75. Carnegie G. K., Smith F. D., McConnachie G., Langeberg L. K., and Scott J. D. (2004) AKAP-Lbc nucleates a protein kinase D activation scaffold. Mol. Cell 15, 889–899 10.1016/j.molcel.2004.09.015 [DOI] [PubMed] [Google Scholar]
- 76. Carnegie G. K., Soughayer J., Smith F. D., Pedroja B. S., Zhang F., Diviani D., Bristow M. R., Kunkel M. T., Newton A. C., Langeberg L. K., and Scott J. D. (2008) AKAP-Lbc mobilizes a cardiac hypertrophy signaling pathway. Mol. Cell 32, 169–179 10.1016/j.molcel.2008.08.030 [DOI] [PMC free article] [PubMed] [Google Scholar]
- 77. Clayton D. A., and Shadel G. S. (2014) Isolation of mitochondria from tissue culture cells. Cold Spring Harb. Protoc. 2014, pdb.prot080002. 10.1101/pdb.prot080002 [DOI] [PubMed] [Google Scholar]
Associated Data
This section collects any data citations, data availability statements, or supplementary materials included in this article.
Supplementary Materials
Data Availability Statement
All RNA-Seq and proteomic data referenced in this work will be made publicly available. RNA-Seq data were deposited in GEO with accession number GSE138277. Raw MS data have been uploaded to MassIVE, an NIH-supported MS data repository (MSV000085087).