

Abstract
Prenatal testosterone (T)-treated female sheep manifest peripheral insulin resistance and tissue specific changes in insulin sensitivity with liver and muscle manifesting insulin resistance accompanied by inflammatory, oxidative and lipotoxic state. In contrast, visceral (VAT) and subcutaneous (SAT) adipose tissues are insulin sensitive in spite of VAT manifesting changes in inflammatory and oxidative state. We hypothesized that prenatal T-induced changes in tissue-specific insulin resistance arise from disrupted lipid storage and metabolism gene expression driven by changes in DNA and histone modifying enzymes. Changes in gene expression were assessed in liver, muscle and 4 adipose (VAT, SAT, epicardiac [ECAT] and perirenal [PRAT]) depots collected from control (n=7) and prenatal T-treated (n=6) female sheep. Prenatal T-treatment increased lipid droplet and metabolism genes PPARA and PLIN1 in liver, SREBF and PLIN1 in muscle and a trend for decrease in PLIN2 in PRAT. Among epigenetic modifying enzymes, prenatal T-treatment increased expression of 1) DNMT1 in liver and DNMT3A in VAT, PRAT, muscle and liver; 2) HDAC1 in ECAT, HDAC2 in muscle with decrease in HDAC3 in VAT; 3) EP300 in VAT and ECAT; and 4) KDM1A in VAT with increases in liver histone acetylation. Increased lipid storage and metabolism genes in liver and muscle are consistent with lipotoxicity in these tissues with increased histone acetylation likely contributing to increased liver PPARA. These findings are suggestive that metabolic defects in prenatal T-treated sheep may arise from changes in key genes mediated, in part, by tissue specific changes in epigenetic modifying enzymes.
Keywords: PCOS, histone modifications, DNA methylation, gene expression, sheep, Insulin resistance
Graphical Abstract

INTRODUCTION
Formation and maturation of organ systems during critical periods of development involves coordinated biological processes that are subject to modulation by endogenous and exogenous factors (1). Considering they play a critical role in the organ development and differentiation (2) and inappropriate exposure during the perinatal period are associated with inadvertent health outcomes (3–6) steroids are of receiving considerable attention as programming agents. Epidemiological and experimental studies showing inappropriate exposure to either native or environmental steroids during critical periods of development programs cardiometabolic disorders (1,7–9) are consistent with the developmental origin of health and disease (DOHaD) hypothesis.
Specifically, gestational exposure to native steroid testosterone (T), for instance, compromises metabolic functions leading to peripheral insulin resistance and adipose tissue defects in rhesus macaques (8,10), sheep (9), rat (7,11), and the mouse (12). The peripheral metabolic defects in prenatal T-treated sheep (9), the model used in this study, has also been found to extend to metabolic organs with tissue-specific changes manifested as insulin resistance (13) and ectopic lipid accumulation in liver and muscle (14), along with hepatic oxidative stress (14) and metabolic disruptions (15). Ectopic lipid accumulation is driven by genes that promote lipogenesis and lipid droplet formation. Lipogenesis are promoted by transcription factors belonging to the peroxisome proliferator-activated receptor (PPAR) and sterol regulatory element-binding transcription factor (SREBF) family, which show strong associations with development of hepatic and muscular lipotoxicity (16,17). On the other hand, lipases namely hormone-sensitive lipase (HSL/LIPE) and hepatic lipase (LIPC), and lipid droplet surface protein, perilipin (PLIN) are essential for release of fatty acid release and optimal storage of lipids. These genes have also been shown to be associated with pathological states. For example, upregulation of PLIN has been noted in liver of non-alcoholic fatty liver disease (NAFLD) patients as well as muscle of obese sedentary people (18,19). Similarly, lipases are involved in the development of hepatic steatosis in mice with ablation of LIPC augmenting (20) and overexpression of LIPE protecting from development of hepatic steatosis (21). The contribution of these regulators in prenatal T-programmed increase in lipid accumulation in the liver and muscle are not known.
At the level of adipose tissue, the visceral adipose tissue (VAT) maintains insulin sensitivity (13) in spite of increases in inflammatory and oxidative stress status (14), reduction in adipocyte size (13,22), and disruptions in adipocyte differentiation markers (23). Interestingly, prenatal T-treatment induced adipose tissue-specific disruptions extended to subcutaneous (SAT), epicardiac (ECAT) and perirenal (PRAT) depots although they differed in grades of inflammatory and oxidative states and depot-specific expression of markers of adipocyte differentiation, thermogenesis, inflammation, oxidative stress and insulin signaling (14,15,24,25). As a main function of adipose tissue is to store lipids, if depot-specific differences in expression of regulators of lipid metabolism (26) contribute to the diversity in prenatal T-induced metabolic defects is of interest.
One way through which developmental exposures induce programmed changes in gene expression involves epigenetic modifications (27,28). Epigenetic modification involve DNA methylation (29), histone modification (30) and expression of non-coding RNA (31). Methylation of DNA is carried out by members of DNA methyltransferases (DNMT), while epigenomic changes to chromatin involve posttranscriptional histone modification brought by enzymes that regulate the histone acetylation and/or methylation. Dysregulated expression of these enzymes are linked to various disease states (32) and developmental exposures (33–35). Additionally, as steroids are powerful programming agents (28) and regulators of epigenetic machinery (36), it is intuitive to expect inappropriate exposure to excess steroids to induce epigenomic changes, reprogram gene expression, and contribute to tissue and adipose depot specific changes in insulin sensitivity.
The objective of this study is two-fold: 1) to address if prenatal T-treatment induced changes in lipases, lipid droplet related proteins, and the transcriptional factors involved in regulation of lipid metabolism are contributors to the dyslipidemia, adipose defects, and ectopic lipid accumulation seen in this model; and 2) to understand the contribution of tissue-specific changes in epigenetic mediators in development of the metabolic phenotype of prenatally T-treated sheep.
METHODS
Animals and Prenatal Treatment
All animal procedures involved are performed as per the National Research Council’s recommendations under the approved protocol of the University of Michigan Institutional Animal Care and Use Committee. Details on animal housing, breeding, general husbandry, nutrition provided and the prenatal treatments have been described previously (37). Prenatal T- treated animals were generated by intramuscular administration of 100mg T propionate (1.2mg/kg; Sigma-Aldrich St. Louis, MO) to pregnant ewes twice weekly from days 30 to 90 of gestation (37). Only one offspring from each mother was used in the study if twins were involved. Number of animals used were controls n = 4–5 and prenatal T-treated n = 5 for all studies.
Tissue Collection
All animals were ovariectomized at the end of the second breeding season (21 months) to avoid confounding effects from differing steroid background. Before collection, sex steroid environment simulating estrous cycle was artificially induced by sequentially implanting progesterone release vaginal implants to mimic luteal phase followed by estradiol implants to mimic follicular phase as described previously (38). Animals were euthanized by barbiturate overdose (Fatal Plus; Vortech Pharmaceuticals, Dearborn, MI) 18 hours after removal of progesterone implants during the artificial follicular phase and tissues were harvested. Liver was obtained from the tip of the left lobe, skeletal muscle sampled from the vastus lateralis, SAT from the sternal region, VAT from the around the omentum, PRAT from around the kidney and ECAT from around the heart after opening the pericardium. Tissues were flash-frozen and stored at −80°C until processed. Only one offspring was used in the study if they were not singleton births. Studies showing effects of prenatal T treatment on reproductive attributes, insulin sensitivity, adipocyte size distribution and adipose depots-specific changes in inflammatory, oxidative stress, and adipocyte differentiation markers from this cohort have been published (13,14,39,40).
RNA Isolation and Real time RT-PCR Analysis
RNA extraction was performed using Trizol reagent (Invitrogen, Carlsbad, CA), DNAse treated, and purified using the RNAeasy kit (Qiagen, Germantown, MD) following the manufacturer’s guidelines. About 500ng RNA from each tissue was reverse transcribed into cDNA using the SuperScript Vilo cDNA synthesis kit (Invitrogen). Expression of lipid related genes PPARA, SREBF1, PLIN1, PLIN2, lipases LIPE and LIPC, epigenetic enzymes DNA methyltrasnferases: DNMT1, DNMT3A, DNMT3B, histone methylases [SET and MYND domain containing 3 (SMYD3), suppressor of variegation 3–9 homolog 1 (SUV39H1) and enhancer of zeste 2 polycomb repressive complex 2 subunit (EZH2)], histone demethylase lysine-specific demethylase 1 (LSD1 / KDM1A), histone deacetylases [HDAC1, 2 and 3] and histone acetyltransferases [EP300] were measured. Gene expression was assessed by real time RT-PCR on a BioRad myiQ iCycler instrument using SYBRgreen based technique as described previously (14). Sequences for oligonucleotide primers for the different epigenetic enzymes under study were from either previous reports or designed using Primer Express software (Life Technologies) and their sequences are shown in Table 1. The relative fold change for each transcript was calculated using the ΔΔCT method following normalization to the endogenous reference gene ribosomal protein L19 (RPL19).
Table 1.
Oligonucleotide primers used for RT-PCR
| Gene ID | Forward primer | Reverse primer | Accession Number |
|---|---|---|---|
| DNMT1 | ACCTCATTTGCCGAGTATATCTTGA | TGAGCATACAAGGAGGAACAGTG | XM_012177594.2 |
| DNMT3A | GAATAGCCAAGTTCAGCAAAGTGA | TTGGAGACGTCGGTATAGTGGAC | XM_012166041.2 |
| DNMT3B | ATTGCAACAGGGTACTTGGT | ATATTTGATGTTGCCCTCGT | XM_012189044.2 |
| HDAC1 | GGAGATGTTCCAGCCCAGTG | CCTCCCAGCATCAGCATAGG | XM_004005023.3 |
| HDAC2 | ATGGAAAAGATAAAACAG | CTATTCGTTTGTGTGATGCT | XM_012166904.1 |
| HDAC3 | GATGACCAGAGTTACAAGCAC | CCAGTAGAGGGATATTGAAGC | XM_004008901.4 |
| SIRT1 | ATACACTGGAGCAGGTT | TTCATCAGCTGGGCATCTAG | XM_027962451.1 |
| EP300 | CCAGAGGAGAGTATACATATCATACCTCG | TCTTGACATATTCCAAATATCCAATTAGG | XM_004007010.3 |
| SUV39H1 | CGCTACGACCTCTGCATCTTC | GTAATGATCTCGCCCACGTACTC | XM_015104703.1 |
| SMYD3 | ATCCTTTGGCGTACACGGTG | ATTCGGCATTGAGAGCATCG | XM_027976324.1 |
| EZH2 | CGGTGTCAAACGCCAATAAA | CCGCTCCACTCCACATTCTC | XM_027968913.1 |
| KDM1A | CACATTGCAGTTGTGGTTGGA | TGTGAACTCGGTGGACAAGC | XM_012152419.2 |
| PLIN1 | GATCGCCTCTGAGCTGAAGG | AGAGCGGCCCCTAGGATTT | XM_015101761.2 |
| PLIN2 | AGTGAACCTTGCCAGGAAGAATG | TTCATCTGTATCATCGTAGCCG | XM_015092734.2 |
| LPL | AGGACACTTGCCACCTCATTC | TTGGAGTCCGGTTCCTCTTGTA | XM_027963889.1 |
| LIPE | GGAGCACTACAAACGCAACGAGAC | GTGTGGGCCAGCGGGGGTGAGAT | NM_001128154.1 |
| LIPC | GAACTGATCATGATCAAGTTCAAGTG | GGCTGGGTGAAGTACTAGATCAT | XM_004010566.4 |
| SREBF1 | CTGCTGACCGACATAGAAGACAT | GTAGGGCGGGTCAAACAGG | XM_027974784.1 |
| PPARA | CATGTGAGGGCTGCAAGGGTTTCT | CTCGGCCATACACAGCGTCTCCAT | XM_027968213.1 |
| RPL19 | CCTTGGCTCGCCGGA | CATGTGGCGGTCAATCTTCTTA | XM_012186026.1 |
Western blot
Since most of the changes observed in RT-PCR analyses were in enzymes that regulate acetylation, only acetylated histone status was examined by western blot in all metabolic tissues. Flash-frozen tissues were homogenized in radioimmuno precipitation assay buffer (Pierce RIPA buffer; Thermo Scientific) containing protease inhibitors (Roche Diagnostics) and phosphatase inhibitors (Roche Diagnostics). Tissue homogenates were centrifuged at 10,000g for 15 minutes at 4°C, and the whole-cell protein extract was used for the analysis. Equal amounts of protein (40μg) from both control and prenatal T-treated animals were resolved on two SDS-PAGE gels that were processed together for adipose depots, and one gel for liver and muscle. Resolved proteins were transferred onto a nitrocellulose membrane (Bio-Rad). Membranes for each tissue, if two were involved, were incubated together in blocking buffer (5%BSA or nonfat milk diluted in Tris-buffered saline) for 60 minutes and incubated overnight (4°C) with primary antibodies rabbit anti-histone H3K27ac (ab4729, Abcam, Cambridge, MA), rabbit anti-histone H3K9ac (9649S, Abcam, Cambridge, MA) or mouse anti beta-tubulin (Sc-101527, Santa Cruz, Dallas, TX). Protein bands from blots for each tissue were simultaneously visualized using enhanced chemiluminescence (Pierce ECL Western Blotting Substrate; Thermo Scientific), on ProteinSimple FluorChem E system (San Jose, CA). For each of the acetylated histone immunoblotted, beta-tubulin levels were also determined after reblotting the same membrane and the relative band density for acetylated histone were normalized to the respective beta-tubulin to minimize potential variation occurring during sample preparation and loading, as is conventional for immunoblot analysis (41). Density of the bands were determined using the ImageJ software (National Institutes of Health). The specificity of the antibodies was confirmed by visualization of protein bands of the correct size.
Statistical Analyses
Changes in gene expression and immunofluorescence between control and prenatal T-treated groups were analyzed by Student’s t test using Prism software (version 7.0, GraphPad Software, La Jolla, CA). A p < 0.05 value was considered significant. Additionally, data were also analyzed by Cohen’s effect size analysis and effect size with Cohen’s d value of 0.8 and above considered as large magnitude differences are reported (39,42,43). This additional approach was used as lack of significance may not be adequate to reject the null hypothesis with studies involving small sample sizes (44).
RESULTS
Effect of prenatal T-treatment on expression of genes in metabolic tissues:
Prenatal T-treatment induced a significant large magnitude increase in lipid droplet-associated proteins PLIN1 in the liver and muscle, and PLIN2 in the muscle (Figure 1, left panel) and a trend for a large magnitude decrease in PLIN2 (d = 1.7) expression in liver. Among the adipose depots, prenatal T-treatment did not alter the expression of PLIN1 and 2 in VAT, SAT and ECAT but resulted in a non-significant large magnitude decrease in expression PLIN1 (d = 0.8) and trend (p = 0.08) for a large magnitude decrease in PLIN2 expression (d = 1.3) in PRAT (Figure 1, right panel).
Figure 1:
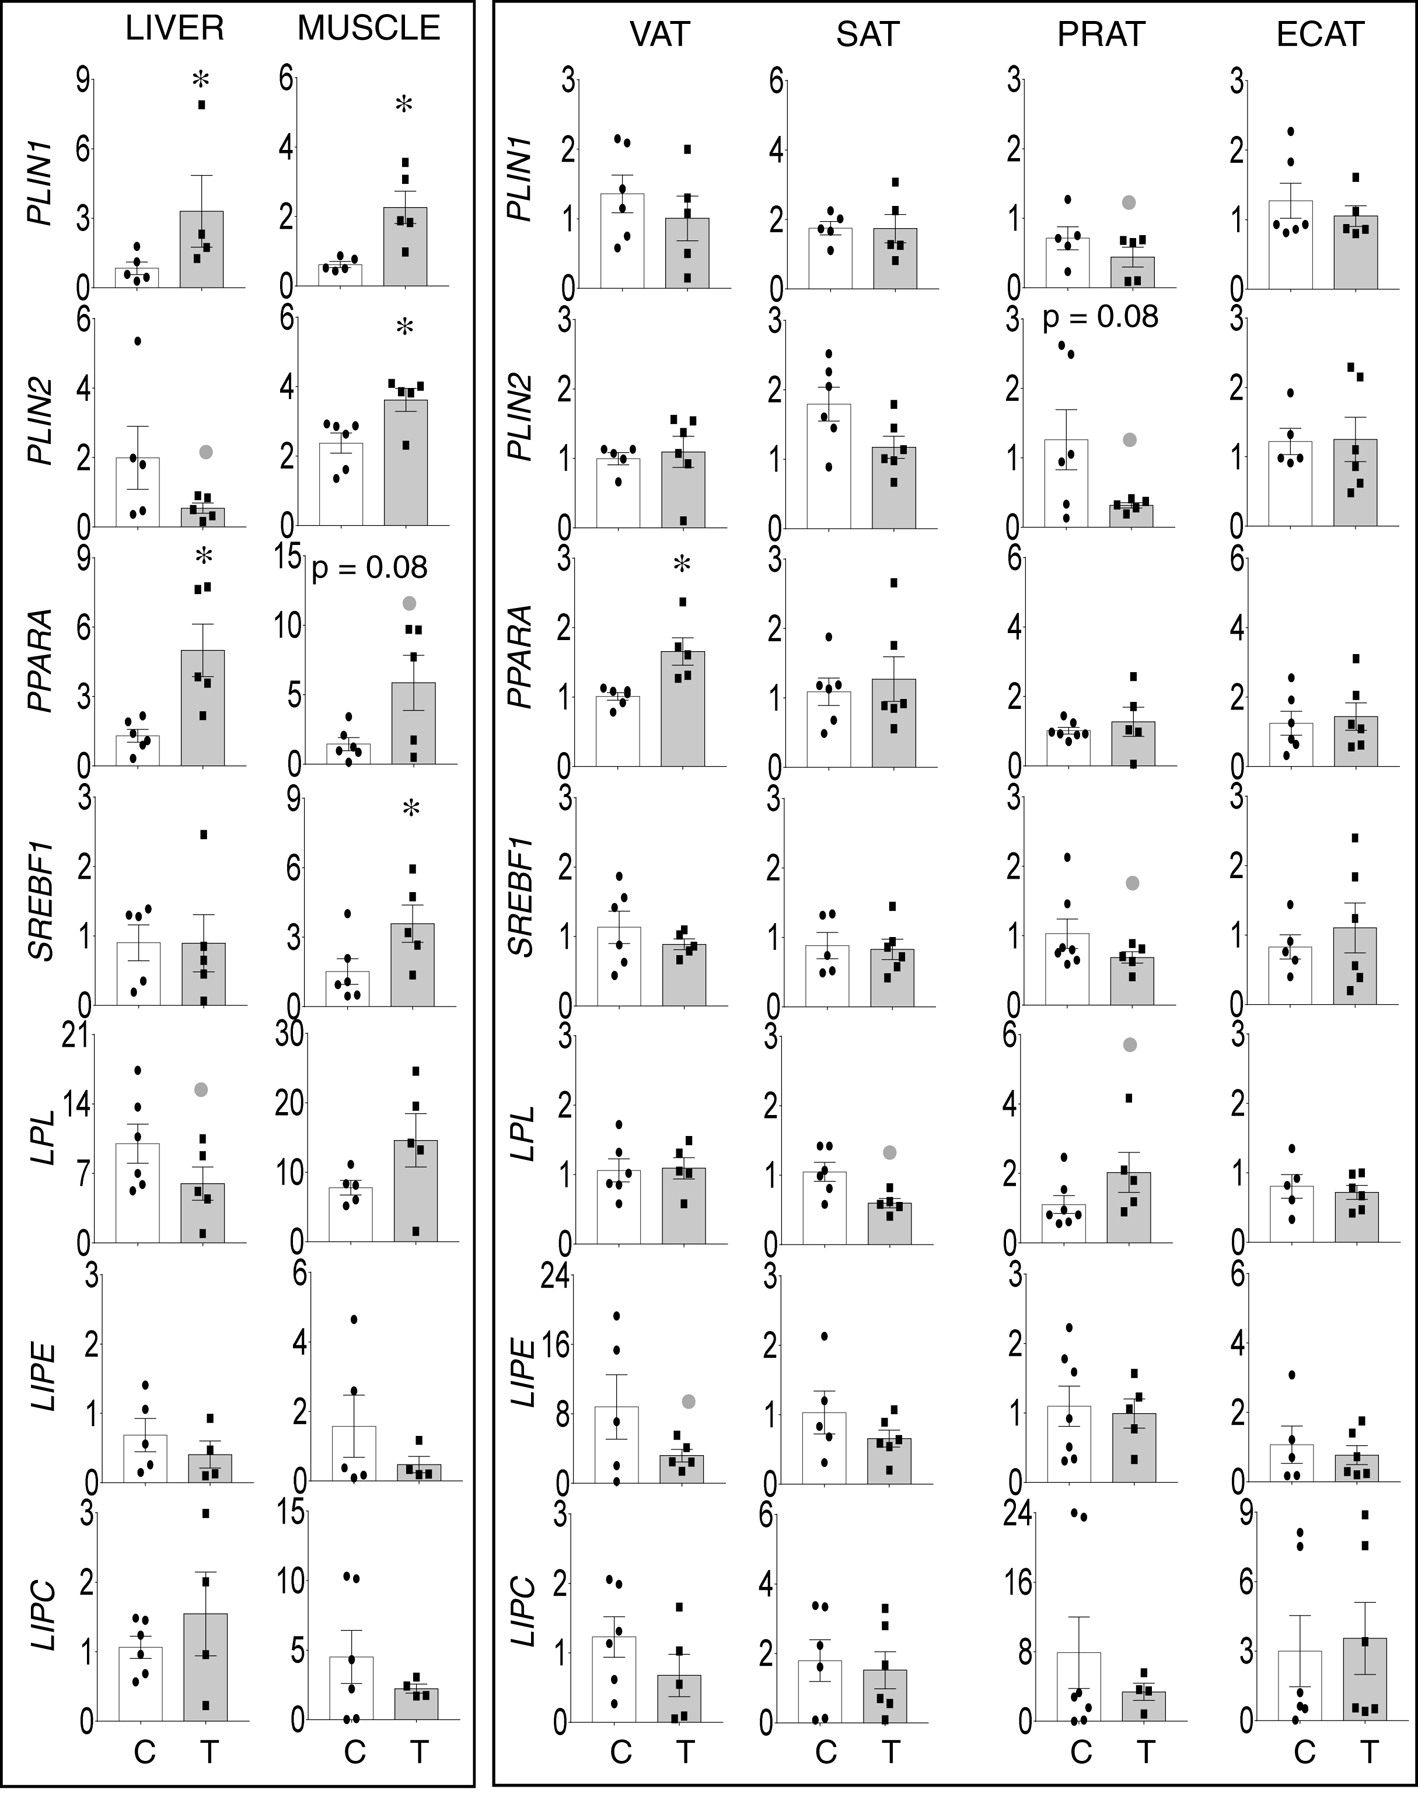
Prenatal T-treatment induced change in expression of genes involved in lipid storage (PLIN1 and PLIN2), lipid related transcription factors (PPARA and SREBF) and lipases (LPL, LIPE and LIPC) in the VAT, SAT, PRAT, ECAT, liver, and muscle tissues of control (open bars) and prenatal T (solid bars) groups. Data are presented as scatter plot with the mean ± standard error of the mean of the fold change in mRNA levels. Superscript asterisk indicates significant changes by student t test with * p<0.05 vs control. Grey closed circle above the histogram indicate large effect size by Cohen’s effect size analysis (d ≥ 0.8).
Among the lipid metabolism transcription factors, prenatal T treatment induced significant large magnitude increase in PPARA expression in liver and a trend (p = 0.08) towards a large magnitude increase in muscle (Figure 1, left panel) and a significant large magnitude increase in in VAT but not in other adipose depots. Prenatal T treatment induced a significant large magnitude increase in SREBF1 in the muscle (Figure 1, left panel) and non-significant large magnitude decrease in SREBF1 expression in PRAT (d = 0.8) (Figure 1, right panel). Among the lipases, prenatal T-treatment induced non-significant large magnitude decrease in LPL in liver (d = 0.8) (Figure 1, left panel) and a non-significant large magnitude decreases in LPL in the SAT (d = 1.8) and the opposite, namely a non-significant large magnitude increase in LPL expression in PRAT (d = 0.9) (Figure 1, right panel). Prenatal T treatment had no effect on LIPE and LIPC in liver and muscle but resulted in a non-significant large magnitude decrease in LIPE in the VAT (d = 1.0) depot (Figure 1, right panel).
Effect of prenatal T-treatment on expression of epigenetic modifying enzymes in metabolic tissues:
DNA methyltransferases:
Prenatal T treatment induced significant large magnitude increases in DNMT1 (d =2.2) and DNMT3A expression in the liver (d =1.9) and only DNMT3A expression in the muscle (d =1.3) (Figure 2, left panel). DNMT1 and DNMT3B were below detection limit by the real time RT-PCR technique employed in the skeletal muscle.
Figure 2:
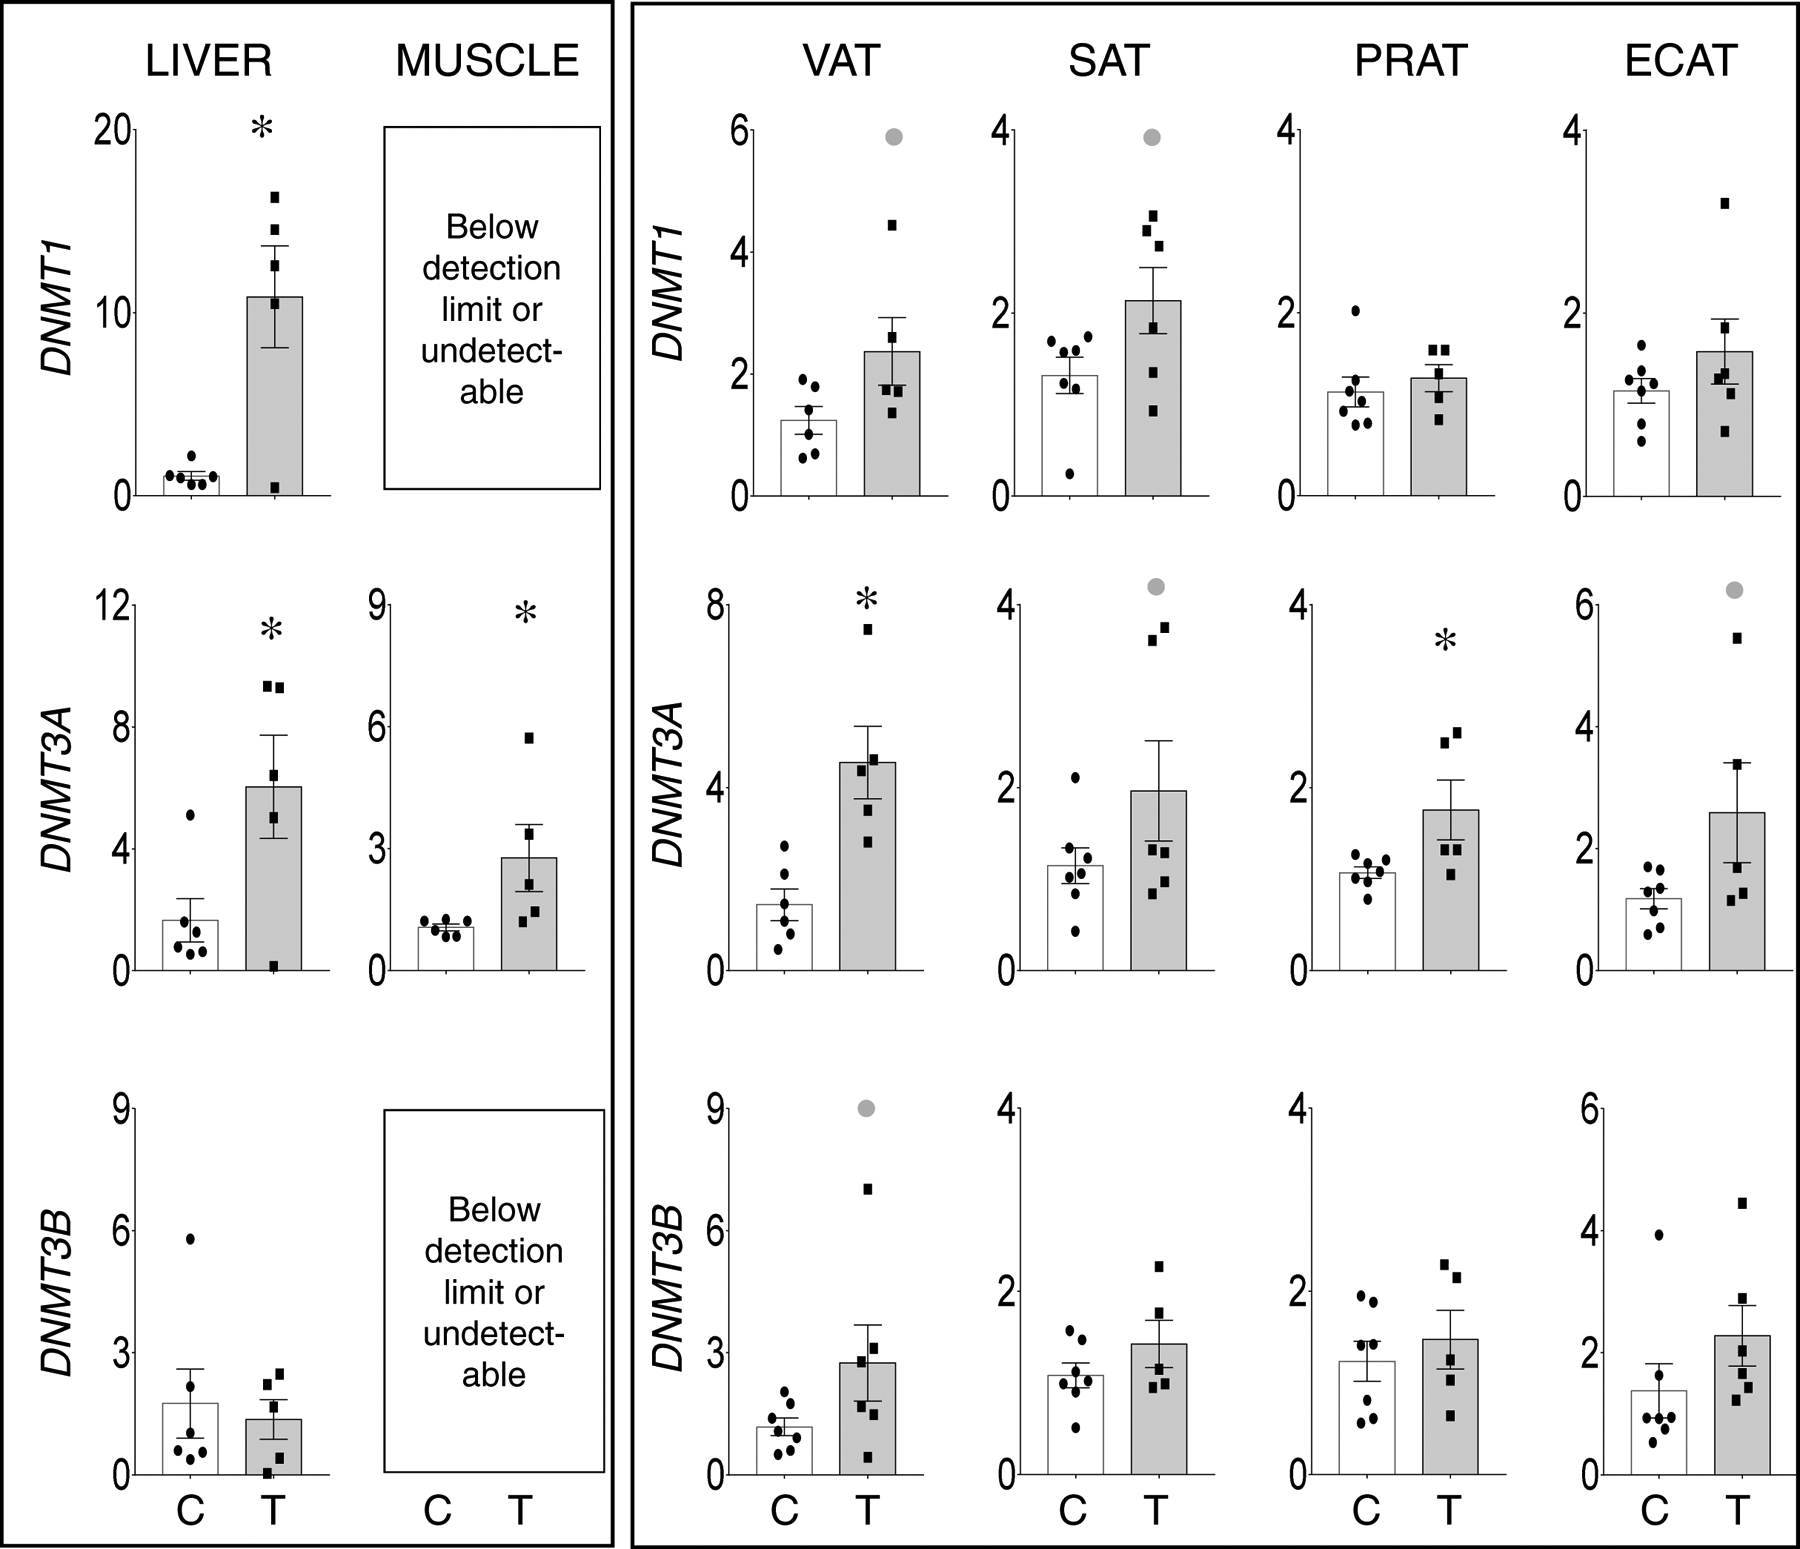
Prenatal T-treatment induced change in expression of DNA methyltrasferases DNMT1 (top panels), DNMT3A (middle panels), and DNMT3B (bottom panels) in the VAT, SAT, PRAT, ECAT, liver, and muscle tissues of control (open bars) and prenatal T (solid bars) groups. Data are presented as scatter plot with the mean ± standard error of the mean of the fold change in mRNA levels. Superscript asterisk indicates significant changes by student t test with * p<0.05 vs control. Grey closed circle above the histogram indicate large effect size by Cohen’s effect size analysis (d ≥ 0.8).
Prenatal T treatment induced: 1) large magnitude albeit non-significant increase in DNMT1 expression in VAT (d=1.2) and SAT (d=1.1); 2) significant large magnitude increase in the expression of DNMT3A in VAT (d =2.2) and PRAT (d =1.3) and a non-significant large magnitude increase in SAT (d=0.8) and ECAT (d=1.1); and 3) a large magnitude non-significant increase in DNMT3B expression only in the VAT (d = 0.9) (Figure 2, right panel).
Histone de/acetylases:
Prenatal T-treatment induced a non-significant large magnitude decrease in HDAC1 expression (d=1.1) in the liver, significant large magnitude increase in expression of HDAC2 (d = 1.5) and a non-significant large magnitude increase in HDAC3 (d = 0.8) in the muscle (Figure 3, left panel). While there was no effect of prenatal T on SIRT1 in liver or muscle, a significant increase in EP300 (d = 0.8) was evident only in the muscle of prenatal T-treated female sheep.
Figure 3:
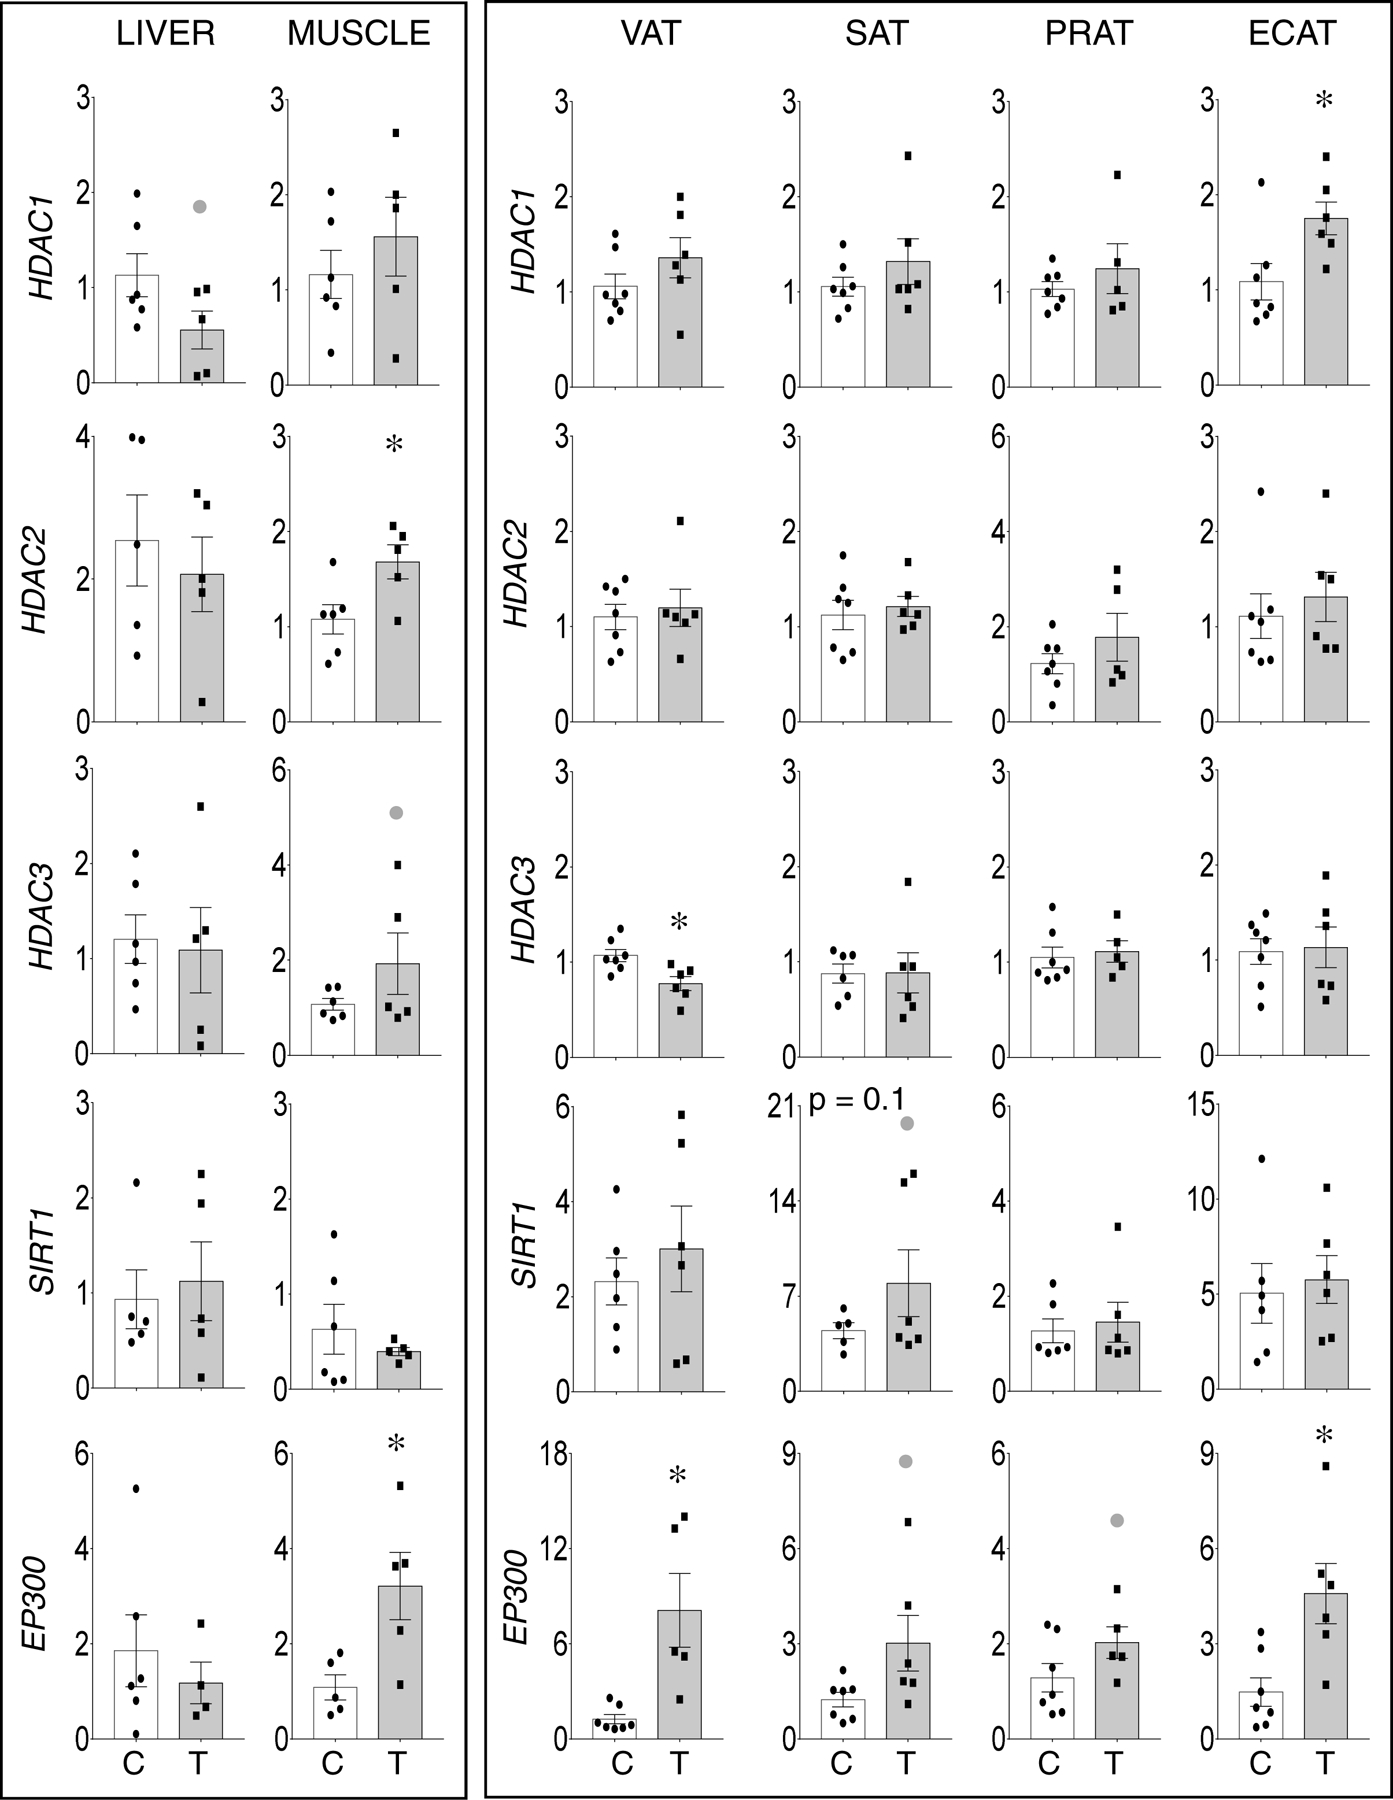
Prenatal T-treatment induced change in expression of histone deacetylases HDAC1 (top panels), HDAC2 (top-middle panels), and HDAC3 (bottom-middle panels), and histone acetyltransferases EP300 (bottom panels) in the VAT, SAT, PRAT, ECAT, liver, and muscle tissues of control (open bars) and prenatal T (solid bars) groups. Data are presented as scatter plot with the mean ± standard error of the mean of the fold change in mRNA levels. Superscript asterisk indicates significant changes by student t test with * p<0.05 vs control. Grey closed circle above the histogram indicate large effect size by Cohen’s effect size analysis (d ≥ 0.8).
Relative to the adipocytes, significant large magnitude increase in expression of HDAC1 (d = 1.3) in ECAT, lack of effect of HDAC2 in all adipose depots, and significant large magnitude decrease in HDAC3 (d =1.7) in VAT were evident in the prenatal T-treated animals (Figure 3, right panel). Prenatal T-treatment also induced a trend (p = 0.1) towards increase in histone deacetylase SIRT1 expression in the SAT but not in other adipose depots (Figure 3, right panel). In addition, prenatal T-treatment induced significant large magnitude increase in the expression of EP300 in VAT (d = 1.8) and ECAT (d =1.7) as opposed to a non-significant large magnitude increase in EP300 expression in SAT (d = 1.1) and PRAT (d = 1.0).
Histone de/methyltransferases:
Relative to liver and muscle, only change among histone de/methyltransferase was the non-significant large magnitude increase in SMYD3 the muscle (d=1.0) (Figure 4, left panel). In adipose depots, changes were mostly restricted to the VAT. This was evident as non-significant large magnitude increases in expression of SMYD3 (d=0.9) and EZH2 (d=0.9) and a significant large magnitude increase (d =1.9) in demethylase KDM1A. Among other adipose depots, a non-significant increase (d=1.2) in the PRAT of prenatal T treated animals was also evident (Figure 4, right panel).
Figure 4:
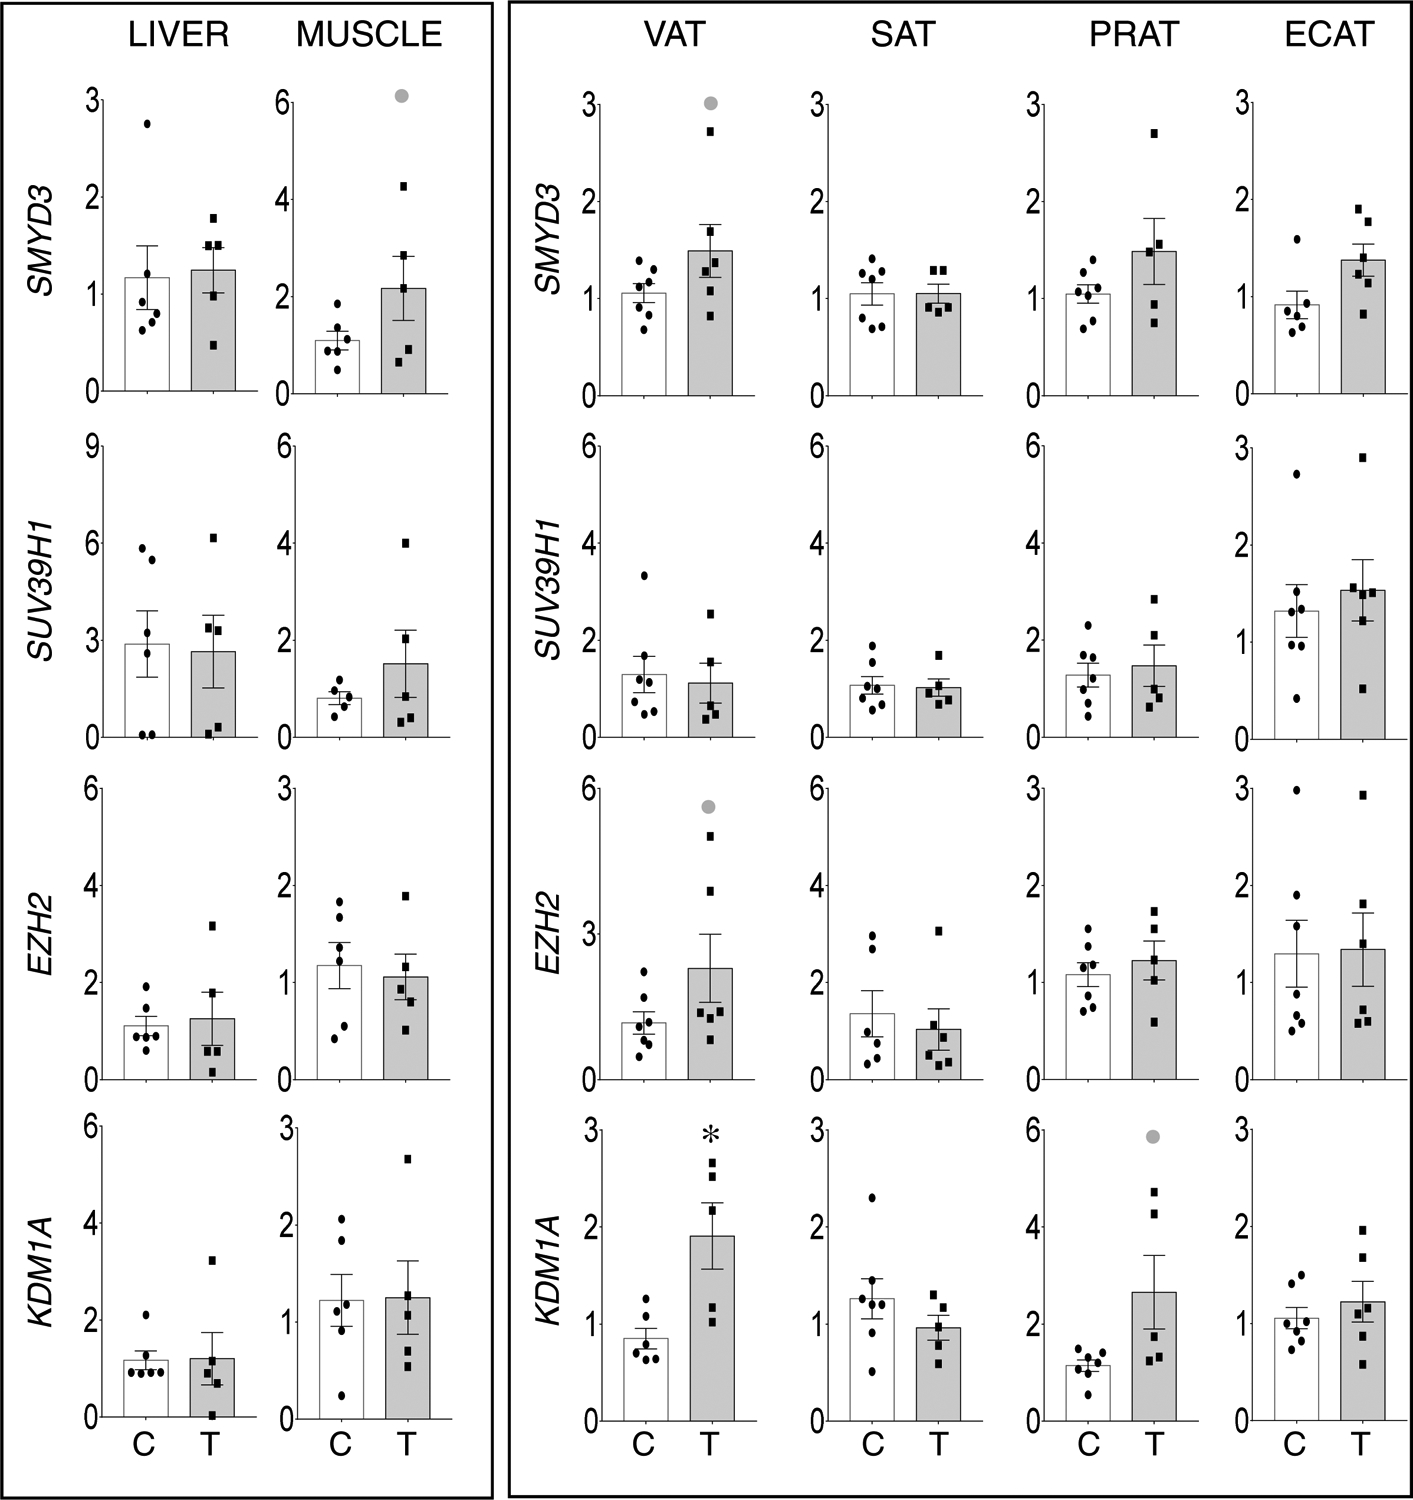
Prenatal T-treatment induced change in expression of histone methyltransferases SMYD3 (top panels), SUV39H1 (top-middle panels), and EZH2 (bottom-middle panels), and histone demethylase KDM1A (bottom panels) in the VAT, SAT, PRAT, ECAT, liver, and muscle tissues of control (open bars) and prenatal T (solid bars) groups. Data are presented as scatter plot with the mean ± standard error of the mean of the fold change in mRNA levels. Superscript asterisk indicates significant changes by student t test with * p<0.05 vs control. Grey closed circle above the histogram indicate large effect size by Cohen’s effect size analysis (d ≥ 0.8).
Histone acetylation:
Examination of histone acetylation at histone 3 lysine 9 (H3K9ac) and 27 (H3K27ac) showed a significant increase in both H3K9ac and H3k27ac induced by prenatal T-treatment in the liver (Figure 5). In the muscle only H3K9ac was detectable with no change in the acetylation induced by prenatal T-treatment. Among the adipose depots, barring a large magnitude non-significant decrease in H3K9ac (d=1.1) and H3K27ac (d=1.2) in PRAT, prenatal T-treatment had no effect in VAT, SAT and ECAT depots. (Figure 5).
Figure 5:
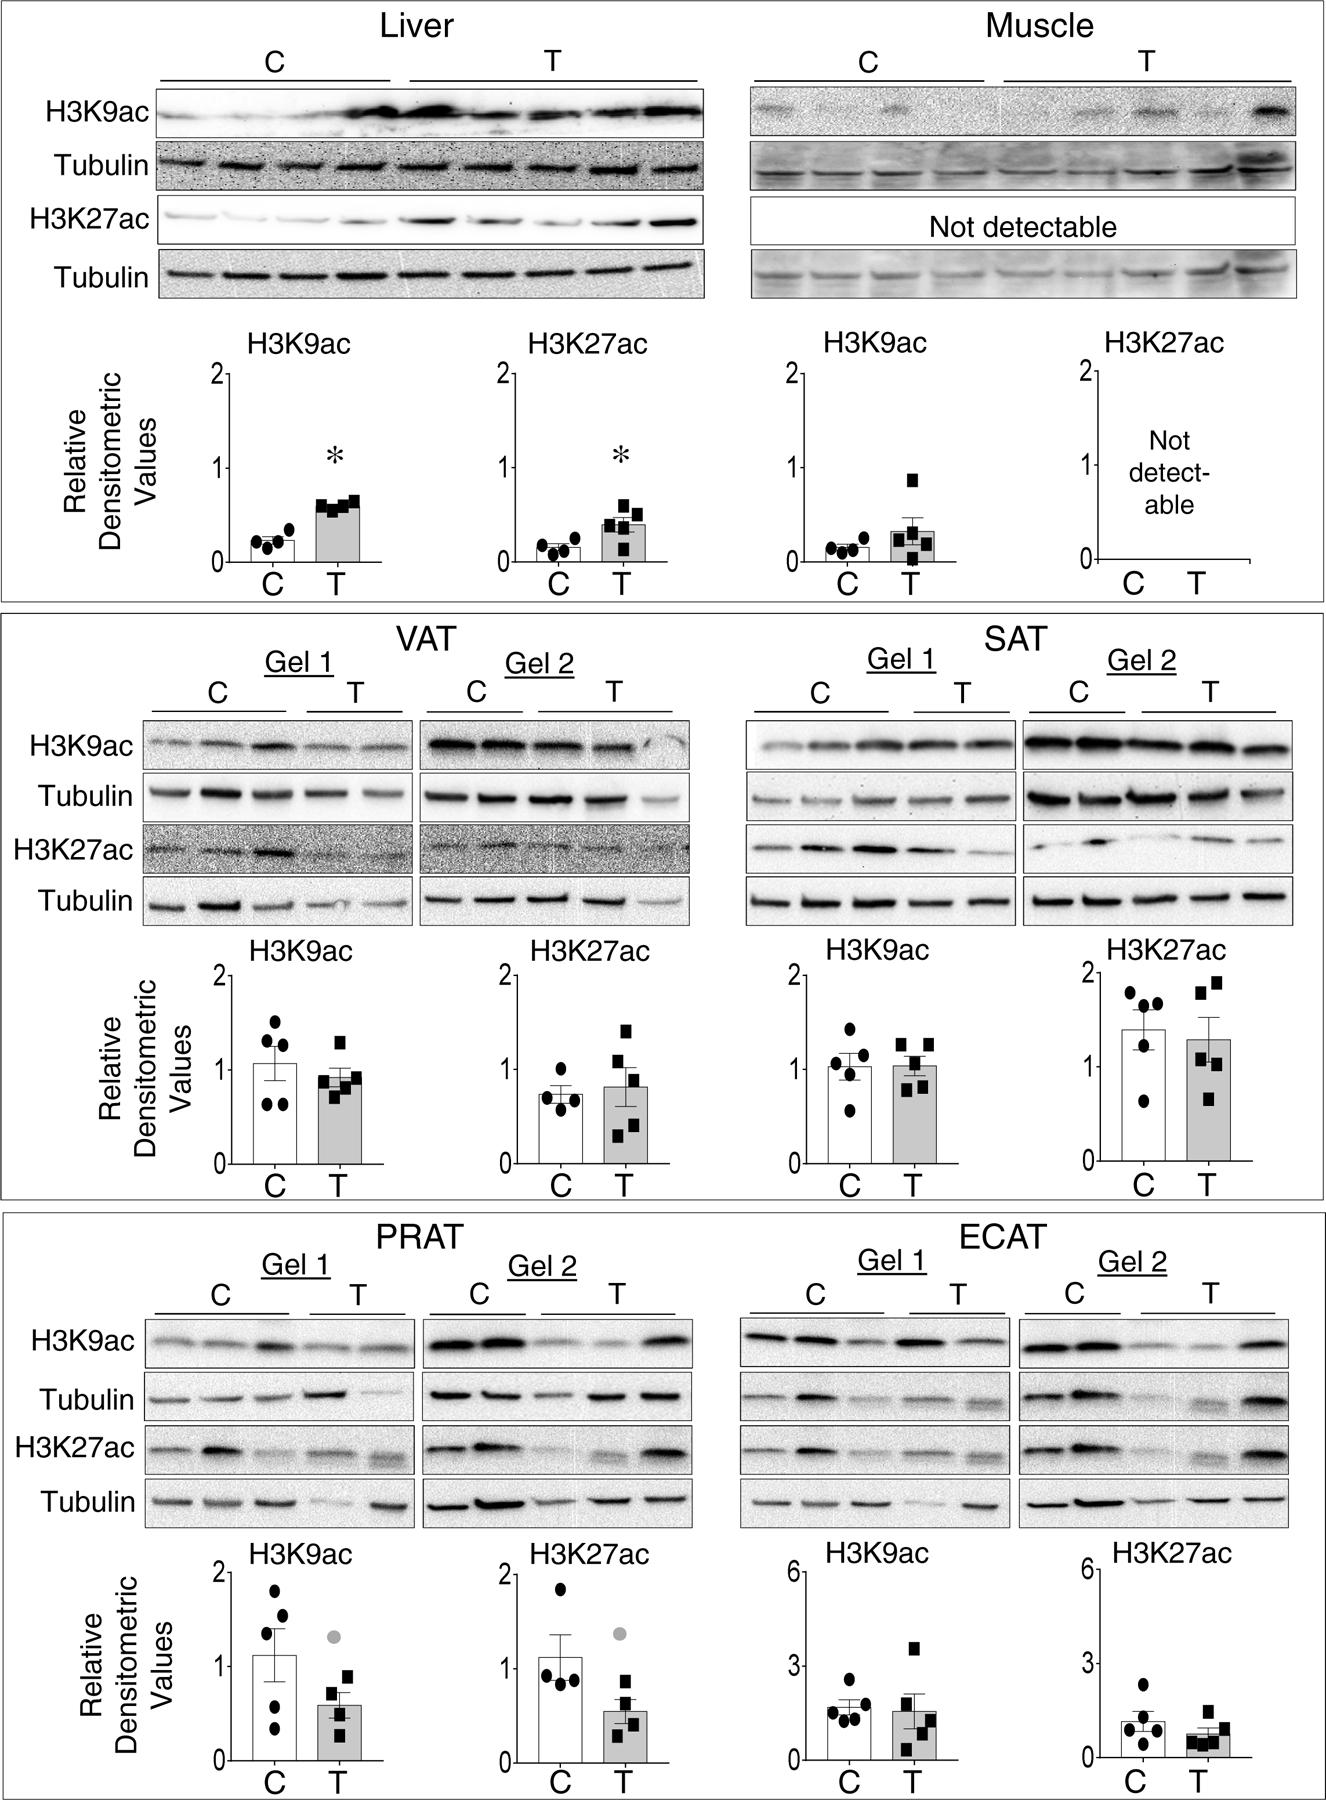
Status of prenatal T-treatment induced changes in histone H3K9 and H3K27 acetylation in the liver, muscle, and different adipose depots from control (open bars) and prenatal T (solid bars) groups. For each tissue, top panels show western blots for H3K9ac (17KDa) and β tubulin (55KDa) and middle panels show H3K27ac (17KDa) and β tubulin (55KDa) between C and T groups. Note all samples for liver and muscle were processed in a single gel, while adipose tissues were processed on two gels that were processed in parallel along with two other treatment groups (not included in this study and hence cut out). Bottom panels show scatter plot with the mean ± standard error of the mean of density ratios between C and T of H3K9ac and H3K27ac. * p<0.05 vs control. Grey closed circle above the histogram indicate large effect size by Cohen’s effect size analysis (d ≥ 0.8) comparing C vs T.
Discussion
Supportive of our hypothesis, prenatal T excess induced a tissue and adipose depot-specific dysregulation in the expression of lipid metabolism, lipid storage and epigenetic regulatory genes. The observed changes in lipid metabolism and storage genes are consistent with the dyslipidemia and ectopic lipid accumulation observed in this model (14). On the other hand, the directionality of observed changes in tissue and adipose-depot specific changes in epigenetic modifying enzymes are not consistent with the observed changes in expression of genes involved in lipid metabolism and lipid storage, but likely underlie the other observed tissue and adipose depot specific disruptions in genes regulating inflammation, oxidative stress and thermogenesis (14,24). The implications of these tissue and adipose depot-specific findings in the pathogenesis and manifestation of metabolic defects in prenatal T-treated female sheep are discussed below.
Our previous studies with the same cohort of Suffolk sheep found that prenatal T treatment induced tissue and adipose depot specific changes in gene expression (Supplemental Table 1) manifested as 1) increase in the expression of inflammation related genes tumor necrosis factor alpha (TNF) and interleukin 1 beta (IL1B) in VAT (14), 2) increase in insulin sensitivity related genes namely adiponectin (ADIPOQ) in SAT (24) and opposing effects on insulin receptor substrate 2 (IRS2) reflected as a decrease in VAT and increase in the liver (24,25), 3) increase in thermogenic gene uncoupled protein 1 (UCP1) in the VAT and PRAT depots (24) and 4) increase in steroid biosynthetic and receptor genes namely elevated aromatase (CYP19A1) and estrogen receptor beta (ESR2) expressions in the VAT (23). Other studies involving a different breed of sheep found T treatment from gestational days 62–102 increased expression of androgen receptor, glucocorticoid receptor, UDP- glucose ceramide glucosyltransferase and insulin like growth factor 1 in the liver (15). Lack of changes in perilipins barring a large magnitude decrease in PRAT depot and increased expression of PLIN1 in liver and muscle along with increased expression of lipid related transcription factors PPARA in liver and muscle and SREBF in the muscle evidenced in the current study is indicative of adipose lipid storage defect and consistent with the observed dyslipidemia and ectopic lipid accumulation (14). Increased expression of perilipins in liver and muscle are also features of conditions associated with ectopic lipid accumulation in the liver and muscle such as obesity, sedentary lifestyle and NAFLD (18,19). While the increase in SREBF1 is consistent with the lipid accumulation seen in muscle of prenatal T-treated sheep (14), the increase in liver PPARA is not consistent with hepatic steatosis evidenced in prenatal T-treated sheep (14) and considering mouse null for PPARA develop hepatic steatosis (45). Considering that increased expression of LPL in adipose (PRAT) promotes lipolysis (46) and reduced expression in SAT aids in SAT’s role in sequestering lipids (47), the large magnitude increase in LPL in PRAT and decrease in SAT point to their potential involvement in the development of dyslipidemia in this model, a premise requiring validation using larger sample sizes. The findings that prenatal T-treatment failed to induce a significant change in LIPE expression in the liver and VAT contrasts with our earlier findings, where we found prenatal T-treatment resulted in a decrease LIPE in in the liver as opposed to an increase in the VAT (25). These differences may reflect differences in the genetic background between the two cohorts of animals, a premise that needs to be tested in future studies.
Consistent with changes in gene expression being driven by changes in epigenetic DNA and histone modifying enzymes that regulates gene expression, prenatal T-treatment induced tissue specific changes in DNA and histone modifying enzymes. For instance, DNMT1 the DNMT involved in maintenance of DNA methylation state was increased significantly in liver as opposed to non-significant large magnitude increases in VAT and SAT. In contrast, the de novo DNMT, DNMT3A showed large magnitude increase in all the tissues studied albeit achieving significance only in liver, muscle, VAT and PRAT. These differences in these two DNMTs may drive the prenatal T treatment induced tissue-specific epigenetic reprogramming as DNMT3A and 3B are capable of methylating previously unmethylated DNA unlike DNMT1 which preferentially methylates hemimethylated DNA (48). Increases in DNMT3A were also found in adipose tissues of diet induced obese mouse (49,50) and human subjects with type 2 diabetes (49). The increase in liver and muscle DNMTs may contribute to the hepatic and muscle lipid accumulation (14) and insulin resistance (51) observed in prenatal T-treated sheep. Similar increases in DNMTs have been found in mice and humans with steatohepatitis (52–54) and skeletal muscle of subjects with diabetes (55). Increases in liver DNMTs have been shown to be associated with hypermethylation and reduced expression of glucokinase in rat liver (56) and PPAR-gamma coactivator one alpha (PPARC1A) in liver and muscle in NAFLD and diabetic patients, respectively (55,57). These findings suggest increases in DNMTs in liver and muscle have the potential to affect hepatic metabolism and contribute to development of insulin resistance in prenatal T-treated sheep.
Post-translational modifications of the histones bring changes in chromatin structure thereby regulating gene expression. Aberrant histone modifications have indeed been observed in conditions associated with insulin resistance and NAFLD (58,59). Histone modifications appear to be critical for gene expression changes that drive adipogenesis, and adipocyte differentiation and function (60,61). Although VAT depot showed significant increase in HAT EP300 and non-significant large magnitude increase in HMT SMYD3 and EZH2, they appear to be countered by significant increases in HDAC3 and KDM1A, enzymes that remove these modifications. The finding of reduced adipogenesis and adipocyte differentiation in VAT from prenatal T-treated sheep (23) are suggestive that the balance between histone modifiers and histone modification erasers are shifted towards the erasers nullifying any histone modification. Such a possibility is supported by the observations of lack of changes in histone acetylation at H3K9 and H3K27 in VAT (Fig. 5).
Although significant changes in histone modifying enzymes were not observed in the liver, significant increases in histone acetylation at H3K9 and H3K27 was evident in prenatal T-treated animals. Since prenatal T-treated sheep manifests hepatic steatosis (14), the increase in histone acetylation may mean decrease activity of histone deacetylase enzymes despite lack of changes in their mRNA expression. The observations that conditions associated with hepatic steatosis due to alcohol intake (62) and obesity (63) have decreased levels of histone deacetylase enzymes supports for such a possibility. Surprisingly, absence of an increase in SIRT1 in prenatal T-treated sheep despite evidence indicating liver-specific deletion of SIRT1 leads to fatty liver disease in mouse fed high fat diet and SIRT1 over-expression protects against steatohepatitis and insulin resistance (64,65), point to absence of SIRT1-mediated protection in overcoming the development of hepatic lipid accumulation in prenatal T-treated sheep. In contrast to lack of effect in liver, significant increases in HAT EP300 and HDAC2 and large magnitude increase in HMT SMYD3 were observed in the muscle. However, no changes in the histone acetylation was evident indicating that the increases in EP300 and HDAC2 likely neutralizes each other’s actions.
Dysregulated metabolic tissue gene expression contributing to development of adipose, hepatic and skeletal muscle defects and insulin resistance in humans and various animal models have been shown to have epigenetic basis (Supplemental Table 2). DNA methylation dependent epigenetic regulation seems to be a major player in regulation of genes involved in insulin signaling, inflammation, adipocyte differentiation and lipid metabolism. For example, the large magnitude reduction in PLIN1 expression in PRAT may be driven by increased expression of DNMT3A such as that observed in SAT from obese women (66) or in visceral adipocytes (67). Similarly, lower expression of insulin signaling pathway constituents in liver of prenatal T-treated sheep (25) may be driven by higher expression of DNMT1 and 3A in agreement with the observations in PCOS women (68), whose metabolic attributes the sheep model mimics. This relationship may not apply to the VAT and muscle, which show higher expression of insulin signaling members along with DNMT3A expression. However, the increase in inflammatory cytokine chemokine ligand 2 (CCL2) in adipose depots from prenatal T-treated sheep (14,24) is in line with the upregulated DNMT3A expression. DNA methylation associated increase in CCL2 have been found in the epididymal adipose tissue in obese mice (69) and SAT from obese subjects (70). Together these findings are consistent with epigenetic regulation through DNA methylation being gene- and tissue-specific. In contrast, the significant increase in hepatic expression of PPARA in the prenatal T-treated sheep may be mediated by increase in acetylation at H3K9 and H3K27 (Figure 5). This possibility is supported by the observation that inhibition of HDACs, enzymes responsible for histone deacetylation in mice treated with grape seed procyanidin extract leads to increased expression of Ppara in the liver (71).
The findings of this study may be of translational significance because prenatal T-treated sheep manifest metabolic defects like insulin resistance, dyslipidemia and hepatic steatosis, similar to women with PCOS (72,73). Global epigenetic changes such as DNA methylation and increased levels of histone deacetylases HDAC3 have been documented in peripheral blood mononuclear cells from PCOS women (68,74–77) lending support to epigenetic basis for pathogenesis of PCOS. Similarly, tissue-specific changes such as increase in global DNA methylation in abdominal SAT (76) and muscle (78) from PCOS women are in line with the upregulation of DNMTs in adipose depots and muscle in prenatal T-treated sheep. These observations support the translational value of prenatal T-treated sheep, a precocial species with similar developmental timeline and metabolic tissue physiology as in humans (79,80). These observations point to directions and should be interpreted with caution in defining causality considering the limitations such as small sample size that restricted achievement of significance with some of the large magnitude changes suggested by effect size analysis, potential variability in protein loading in western blots in view of protein extraction from the lipid-rich adipose depots, lack of measure of epigenetic enzyme activity, and lack of information on the status of DNA and histone methylation status. In addition, considering steroids are known to influence not only expression of genes involved in lipid metabolism (81) but also epigenetic enzymes (36), to what extent the findings from the artificial follicular phase model will apply to ovary-intact animals and if it is cycle stage specific remains to be determined.
In summary, the finding from this study provide evidence that prenatal exposure to excess T leads to tissue-specific changes in different epigenetic enzymes and histone acetylation. These changes may potentially drive the adipose-depot and tissue-specific changes in gene expression that may underlie the abnormal insulin sensitivity and metabolic state observed in prenatal T-treated sheep. The similarities observed between the prenatal T-treated sheep and women with PCOS raise the possibility the disturbance of these epigenetic enzymes may be a contributor in the development of insulin resistance in pregnancies associated with hyperandrogenic states.
Supplementary Material
Highlights.
Prenatal T induces tissue-specific changes in genes involved in lipid metabolism.
Prenatal T induces tissue-specific changes in genes involved in lipid storage.
Prenatal T induces tissue-specific changes in DNA and histone modifying enzymes.
Epigenetic enzyme changes may underlie tissue-specific metabolic changes.
ACKNOWLEDGEMENT
We thank Mr. Douglas Doop and Gary McCalla for their valuable assistance in breeding, lambing, and careful animal care; Dr. Almudena Veiga-Lopez, Dr. Bachir Abi Salloum, Mr. Evan Beckett, Mrs. Carol Herkimer and students supported through the Undergraduate Research Opportunity Program (University of Michigan) for the help provided with administration of treatments and tissue collection.
This work was supported by National Institutes of Health grant P01 HD44232. Dr. Guo is recipient of international exchange funding from XiangYa Famous Doctor Central South University
Footnotes
Publisher's Disclaimer: This is a PDF file of an unedited manuscript that has been accepted for publication. As a service to our customers we are providing this early version of the manuscript. The manuscript will undergo copyediting, typesetting, and review of the resulting proof before it is published in its final form. Please note that during the production process errors may be discovered which could affect the content, and all legal disclaimers that apply to the journal pertain.
REFERENCES
- 1.Padmanabhan V, Cardoso RC, Puttabyatappa M. Developmental Programming, a Pathway to Disease. Endocrinology. 2016;157(4):1328–1340 [DOI] [PMC free article] [PubMed] [Google Scholar]
- 2.Markey CM, Coombs MA, Sonnenschein C, Soto AM. Mammalian development in a changing environment: exposure to endocrine disruptors reveals the developmental plasticity of steroid-hormone target organs. Evol Dev. 2003;5(1):67–75. [DOI] [PubMed] [Google Scholar]
- 3.Padmanabhan V, Sarma HN, Savabieasfahani M, Steckler TL, Veiga-Lopez A. Developmental reprogramming of reproductive and metabolic dysfunction in sheep: native steroids vs. environmental steroid receptor modulators. Int J Androl. 2010;33(2):394–404. [DOI] [PMC free article] [PubMed] [Google Scholar]
- 4.Diamanti-Kandarakis E, Dunaif A. Insulin resistance and the polycystic ovary syndrome revisited: an update on mechanisms and implications. Endocr Rev. 2012;33(6):981–1030. [DOI] [PMC free article] [PubMed] [Google Scholar]
- 5.Yusuf S, Reddy S, Ôunpuu S, Anand S. Global burden of cardiovascular diseases part I: general considerations, the epidemiologic transition, risk factors, and impact of urbanization. Circulation. 2001;104(22):2746–2753. [DOI] [PubMed] [Google Scholar]
- 6.Diamanti-Kandarakis E, Bourguignon JP, Giudice LC, Hauser R, Prins GS, Soto AM, Zoeller RT, Gore AC. Endocrine-disrupting chemicals: an Endocrine Society scientific statement. Endocr Rev. 2009;30(4):293–342. [DOI] [PMC free article] [PubMed] [Google Scholar]
- 7.Demissie M, Lazic M, Foecking EM, Aird F, Dunaif A, Levine JE. Transient prenatal androgen exposure produces metabolic syndrome in adult female rats. Am J Physiol Endocrinol Metab. 2008;295(2):E262–268. [DOI] [PMC free article] [PubMed] [Google Scholar]
- 8.Eisner JR, Dumesic DA, Kemnitz JW, Abbott DH. Timing of prenatal androgen excess determines differential impairment in insulin secretion and action in adult female rhesus monkeys. J Clin Endocrinol Metab. 2000;85(3):1206–1210. [DOI] [PubMed] [Google Scholar]
- 9.Puttabyatappa M, Padmanabhan V. Prenatal Testosterone Programming of Insulin Resistance in the Female Sheep. Adv Exp Med Biol. 2017;1043:575–596. [DOI] [PubMed] [Google Scholar]
- 10.Bruns CM, Baum ST, Colman RJ, Dumesic DA, Eisner JR, Jensen MD, Whigham LD, Abbott DH. Prenatal androgen excess negatively impacts body fat distribution in a nonhuman primate model of polycystic ovary syndrome. Int J Obes (Lond). 2007;31(10):1579–1585. [DOI] [PMC free article] [PubMed] [Google Scholar]
- 11.Lazic M, Aird F, Levine JE, Dunaif A. Prenatal androgen treatment alters body composition and glucose homeostasis in male rats. J Endocrinol. 2011;208(3):293–300. [DOI] [PMC free article] [PubMed] [Google Scholar]
- 12.Roland AV, Nunemaker CS, Keller SR, Moenter SM. Prenatal androgen exposure programs metabolic dysfunction in female mice. J Endocrinol. 2010;207(2):213–223. [DOI] [PMC free article] [PubMed] [Google Scholar]
- 13.Lu C, Cardoso RC, Puttabyatappa M, Padmanabhan V. Developmental Programming: Prenatal Testosterone Excess and Insulin Signaling Disruptions in Female Sheep. Biology of reproduction. 2016;94(5):113. [DOI] [PMC free article] [PubMed] [Google Scholar]
- 14.Puttabyatappa M, Andriessen V, Mesquitta M, Zeng L, Pennathur S, Padmanabhan V. Developmental Programming: Impact of Gestational Steroid and Metabolic Milieus on Mediators of Insulin Sensitivity in Prenatal Testosterone-Treated Female Sheep. Endocrinology. 2017;158(9):2783–2798. [DOI] [PMC free article] [PubMed] [Google Scholar]
- 15.Hogg K, Wood C, McNeilly AS, Duncan WC. The in utero programming effect of increased maternal androgens and a direct fetal intervention on liver and metabolic function in adult sheep. PLoS One. 2011;6(9):e24877. [DOI] [PMC free article] [PubMed] [Google Scholar]
- 16.Shimano H, Sato R. SREBP-regulated lipid metabolism: convergent physiology - divergent pathophysiology. Nat Rev Endocrinol. 2017;13(12):710–730. [DOI] [PubMed] [Google Scholar]
- 17.Silva AKS, Peixoto CA. Role of peroxisome proliferator-activated receptors in non-alcoholic fatty liver disease inflammation. Cell Mol Life Sci. 2018;75(16):2951–2961. [DOI] [PMC free article] [PubMed] [Google Scholar]
- 18.Carr RM, Ahima RS. Pathophysiology of lipid droplet proteins in liver diseases. Exp Cell Res. 2016;340(2):187–192. [DOI] [PMC free article] [PubMed] [Google Scholar]
- 19.Zacharewicz E, Hesselink MKC, Schrauwen P. Exercise counteracts lipotoxicity by improving lipid turnover and lipid droplet quality. J Intern Med. 2018;284(5):505–518. [DOI] [PubMed] [Google Scholar]
- 20.Andres-Blasco I, Herrero-Cervera A, Vinue A, Martinez-Hervas S, Piqueras L, Sanz MJ, Burks DJ, Gonzalez-Navarro H. Hepatic lipase deficiency produces glucose intolerance, inflammation and hepatic steatosis. J Endocrinol. 2015;227(3):179–191. [DOI] [PubMed] [Google Scholar]
- 21.Haemmerle G, Zimmermann R, Hayn M, Theussl C, Waeg G, Wagner E, Sattler W, Magin TM, Wagner EF, Zechner R. Hormone-sensitive lipase deficiency in mice causes diglyceride accumulation in adipose tissue, muscle, and testis. J Biol Chem. 2002;277(7):4806–4815. [DOI] [PubMed] [Google Scholar]
- 22.Veiga-Lopez A, Moeller J, Patel D, Ye W, Pease A, Kinns J, Padmanabhan V. Developmental programming: impact of prenatal testosterone excess on insulin sensitivity, adiposity, and free fatty acid profile in postpubertal female sheep. Endocrinology. 2013;154(5):1731–1742. [DOI] [PMC free article] [PubMed] [Google Scholar]
- 23.Puttabyatappa M, Lu C, Martin JD, Chazenbalk G, Dumesic D, Padmanabhan V. Developmental Programming: Impact of Prenatal Testosterone Excess on Steroidal Machinery and Cell Differentiation Markers in Visceral Adipocytes of Female Sheep. Reprod Sci. 2017:1933719117746767. [DOI] [PMC free article] [PubMed] [Google Scholar]
- 24.Puttabyatappa M, Ciarelli JN, Chatoff AG, Singer K, Padmanabhan V. Developmental programming: Adipose depot-specific changes and thermogenic adipocyte distribution in the female sheep. Mol Cell Endocrinol. 2019;503:110691. [DOI] [PMC free article] [PubMed] [Google Scholar]
- 25.Nada SE, Thompson RC, Padmanabhan V. Developmental programming: differential effects of prenatal testosterone excess on insulin target tissues. Endocrinology. 2010;151(11):5165–5173. [DOI] [PMC free article] [PubMed] [Google Scholar]
- 26.Kimmel AR, Sztalryd C. The Perilipins: Major Cytosolic Lipid Droplet-Associated Proteins and Their Roles in Cellular Lipid Storage, Mobilization, and Systemic Homeostasis. Annu Rev Nutr. 2016;36:471–509. [DOI] [PubMed] [Google Scholar]
- 27.Jimenez-Chillaron JC, Diaz R, Martinez D, Pentinat T, Ramon-Krauel M, Ribo S, Plosch T. The role of nutrition on epigenetic modifications and their implications on health. Biochimie. 2012;94(11):2242–2263. [DOI] [PubMed] [Google Scholar]
- 28.Skinner MK, Manikkam M, Guerrero-Bosagna C. Epigenetic transgenerational actions of environmental factors in disease etiology. Trends Endocrinol Metab. 2010;21(4):214–222. [DOI] [PMC free article] [PubMed] [Google Scholar]
- 29.Chen ZX, Riggs AD. Maintenance and regulation of DNA methylation patterns in mammals. Biochem Cell Biol. 2005;83(4):438–448. [DOI] [PubMed] [Google Scholar]
- 30.Turner BM. Histone acetylation as an epigenetic determinant of long-term transcriptional competence. Cell Mol Life Sci. 1998;54(1):21–31. [DOI] [PMC free article] [PubMed] [Google Scholar]
- 31.Moss EG. Non-coding RNA’s: lightning strikes twice. Curr Biol. 2000;10(12):R436–439. [DOI] [PubMed] [Google Scholar]
- 32.Copeland RA, Olhava EJ, Scott MP. Targeting epigenetic enzymes for drug discovery. Curr Opin Chem Biol. 2010;14(4):505–510. [DOI] [PubMed] [Google Scholar]
- 33.Foulds CE, Trevino LS, York B, Walker CL. Endocrine-disrupting chemicals and fatty liver disease. Nat Rev Endocrinol. 2017;13(8):445–457. [DOI] [PMC free article] [PubMed] [Google Scholar]
- 34.Lee J, Kim Y, Friso S, Choi SW. Epigenetics in non-alcoholic fatty liver disease. Mol Aspects Med. 2017;54:78–88. [DOI] [PubMed] [Google Scholar]
- 35.Smith CJ, Ryckman KK. Epigenetic and developmental influences on the risk of obesity, diabetes, and metabolic syndrome. Diabetes Metab Syndr Obes. 2015;8:295–302. [DOI] [PMC free article] [PubMed] [Google Scholar]
- 36.Forger NG. Past, present and future of epigenetics in brain sexual differentiation. J Neuroendocrinol. 2018;30(2):e12492. [DOI] [PubMed] [Google Scholar]
- 37.Manikkam M, Steckler TL, Welch KB, Inskeep EK, Padmanabhan V. Fetal programming: prenatal testosterone treatment leads to follicular persistence/luteal defects; partial restoration of ovarian function by cyclic progesterone treatment. Endocrinology. 2006;147(4):1997–2007. [DOI] [PubMed] [Google Scholar]
- 38.Goodman RL, Legan SJ, Ryan KD, Foster DL, Karsch FJ. Importance of variations in behavioural and feedback actions of oestradiol to the control of seasonal breeding in the ewe. J Endocrinol. 1981;89(2):229–240. [DOI] [PubMed] [Google Scholar]
- 39.Padmanabhan V, Veiga-Lopez A, Herkimer C, Abi Salloum B, Moeller J, Beckett E, Sreedharan R. Developmental Programming: Prenatal and Postnatal Androgen Antagonist and Insulin Sensitizer Interventions Prevent Advancement of Puberty and Improve LH Surge Dynamics in Prenatal Testosterone-Treated Sheep. Endocrinology. 2015;156(7):2678–2692. [DOI] [PMC free article] [PubMed] [Google Scholar]
- 40.Abi Salloum B, Herkimer C, Lee JS, Veiga-Lopez A, Padmanabhan V. Developmental programming: prenatal and postnatal contribution of androgens and insulin in the reprogramming of estradiol positive feedback disruptions in prenatal testosterone-treated sheep. Endocrinology. 2012;153(6):2813–2822. [DOI] [PMC free article] [PubMed] [Google Scholar]
- 41.Dennis-Sykes CA, Miller WJ, McAleer WJ. A quantitative Western Blot method for protein measurement. J Biol Stand. 1985;13(4):309–314. [DOI] [PubMed] [Google Scholar]
- 42.Cohen J A power primer. Psychol Bull. 1992;112(1):155–159. [DOI] [PubMed] [Google Scholar]
- 43.Nakagawa S, Cuthill IC. Effect size, confidence interval and statistical significance: a practical guide for biologists. Biol Rev Camb Philos Soc. 2007;82(4):591–605. [DOI] [PubMed] [Google Scholar]
- 44.Amrhein V, Greenland S, McShane B. Scientists rise up against statistical significance. Nature. 2019;567(7748):305–307. [DOI] [PubMed] [Google Scholar]
- 45.Costet P, Legendre C, More J, Edgar A, Galtier P, Pineau T. Peroxisome proliferator-activated receptor alpha-isoform deficiency leads to progressive dyslipidemia with sexually dimorphic obesity and steatosis. J Biol Chem. 1998;273(45):29577–29585. [DOI] [PubMed] [Google Scholar]
- 46.Iqbal J, Al Qarni A, Hawwari A, Alghanem AF, Ahmed G. Metabolic Syndrome, Dyslipidemia and Regulation of Lipoprotein Metabolism. Curr Diabetes Rev. 2018;14(5):427–433. [DOI] [PubMed] [Google Scholar]
- 47.Saely CH, Geiger K, Drexel H. Brown versus white adipose tissue: a mini-review. Gerontology. 2012;58(1):15–23. [DOI] [PubMed] [Google Scholar]
- 48.Okano M, Bell DW, Haber DA, Li E. DNA methyltransferases Dnmt3a and Dnmt3b are essential for de novo methylation and mammalian development. Cell. 1999;99(3):247–257. [DOI] [PubMed] [Google Scholar]
- 49.You D, Nilsson E, Tenen DE, Lyubetskaya A, Lo JC, Jiang R, Deng J, Dawes BA, Vaag A, Ling C, Rosen ED, Kang S. Dnmt3a is an epigenetic mediator of adipose insulin resistance. Elife. 2017;6(pii):e30766. [DOI] [PMC free article] [PubMed] [Google Scholar]
- 50.Xia L, Wang C, Lu Y, Fan C, Ding X, Fu H, Qi K. Time-specific changes in DNA methyltransferases associated with the leptin promoter during the development of obesity. Nutr Hosp. 2014;30(6):1248–1255. [DOI] [PubMed] [Google Scholar]
- 51.Padmanabhan V, Veiga-Lopez A, Abbott D, Recabarren S, Herkimer C. Developmental programming: impact of prenatal testosterone excess and postnatal weight gain on insulin sensitivity index and transfer of traits to offspring of overweight females. Endocrinology. 2010;151(2):595–605. [DOI] [PMC free article] [PubMed] [Google Scholar]
- 52.Pirola CJ, Gianotti TF, Burgueno AL, Rey-Funes M, Loidl CF, Mallardi P, Martino JS, Castano GO, Sookoian S. Epigenetic modification of liver mitochondrial DNA is associated with histological severity of nonalcoholic fatty liver disease. Gut. 2013;62(9):1356–1363. [DOI] [PubMed] [Google Scholar]
- 53.Pogribny IP, Tryndyak VP, Bagnyukova TV, Melnyk S, Montgomery B, Ross SA, Latendresse JR, Rusyn I, Beland FA. Hepatic epigenetic phenotype predetermines individual susceptibility to hepatic steatosis in mice fed a lipogenic methyl-deficient diet. J Hepatol. 2009;51(1):176–186. [DOI] [PMC free article] [PubMed] [Google Scholar]
- 54.Zhao F Dysregulated Epigenetic Modifications in the Pathogenesis of NAFLD-HCC. Adv Exp Med Biol. 2018;1061:79–93. [DOI] [PubMed] [Google Scholar]
- 55.Barres R, Osler ME, Yan J, Rune A, Fritz T, Caidahl K, Krook A, Zierath JR. Non-CpG methylation of the PGC-1alpha promoter through DNMT3B controls mitochondrial density. Cell Metab. 2009;10(3):189–198. [DOI] [PubMed] [Google Scholar]
- 56.Jiang MH, Fei J, Lan MS, Lu ZP, Liu M, Fan WW, Gao X, Lu DR. Hypermethylation of hepatic Gck promoter in ageing rats contributes to diabetogenic potential. Diabetologia. 2008;51(8):1525–1533. [DOI] [PubMed] [Google Scholar]
- 57.Sookoian S, Rosselli MS, Gemma C, Burgueno AL, Fernandez Gianotti T, Castano GO, Pirola CJ. Epigenetic regulation of insulin resistance in nonalcoholic fatty liver disease: impact of liver methylation of the peroxisome proliferator-activated receptor gamma coactivator 1alpha promoter. Hepatology. 2010;52(6):1992–2000. [DOI] [PubMed] [Google Scholar]
- 58.Del Campo JA, Gallego-Duran R, Gallego P, Grande L. Genetic and Epigenetic Regulation in Nonalcoholic Fatty Liver Disease (NAFLD). Int J Mol Sci. 2018;19(3). [DOI] [PMC free article] [PubMed] [Google Scholar]
- 59.Ling C, Groop L. Epigenetics: a molecular link between environmental factors and type 2 diabetes. Diabetes. 2009;58(12):2718–2725. [DOI] [PMC free article] [PubMed] [Google Scholar]
- 60.Yuan Y, Liu C, Wan D, Huang K, Zheng L. DNA/Histone Methylation and Adipocyte Differentiation: Applications to Obesity. Handbook of Nutrition, Diet, and Epigenetics. 2019:665–682. [Google Scholar]
- 61.Kasinska MA, Drzewoski J, Sliwinska A. Epigenetic modifications in adipose tissue - relation to obesity and diabetes. Arch Med Sci. 2016;12(6):1293–1301. [DOI] [PMC free article] [PubMed] [Google Scholar]
- 62.Shukla SD, Lim RW. Epigenetic effects of ethanol on the liver and gastrointestinal system. Alcohol Res. 2013;35(1):47–55. [PMC free article] [PubMed] [Google Scholar]
- 63.Mikula M, Majewska A, Ledwon JK, Dzwonek A, Ostrowski J. Obesity increases histone H3 lysine 9 and 18 acetylation at Tnfa and Ccl2 genes in mouse liver. Int J Mol Med. 2014;34(6):1647–1654. [DOI] [PubMed] [Google Scholar]
- 64.Escande C, Chini CC, Nin V, Dykhouse KM, Novak CM, Levine J, van Deursen J, Gores GJ, Chen J, Lou Z, Chini EN. Deleted in breast cancer-1 regulates SIRT1 activity and contributes to high-fat diet-induced liver steatosis in mice. J Clin Invest. 2010;120(2):545–558. [DOI] [PMC free article] [PubMed] [Google Scholar]
- 65.Purushotham A, Schug TT, Xu Q, Surapureddi S, Guo X, Li X. Hepatocyte-specific deletion of SIRT1 alters fatty acid metabolism and results in hepatic steatosis and inflammation. Cell Metab. 2009;9(4):327–338. [DOI] [PMC free article] [PubMed] [Google Scholar]
- 66.Bialesova L, Kulyte A, Petrus P, Sinha I, Laurencikiene J, Zhao C, Wright KD, Arner P, Dahlman I. Epigenetic Regulation of PLIN 1 in Obese Women and its Relation to Lipolysis. Sci Rep. 2017;7(1):10152. [DOI] [PMC free article] [PubMed] [Google Scholar]
- 67.Andersen E, Ingerslev LR, Fabre O, Donkin I, Altintas A, Versteyhe S, Bisgaard T, Kristiansen VB, Simar D, Barres R. Preadipocytes from obese humans with type 2 diabetes are epigenetically reprogrammed at genes controlling adipose tissue function. Int J Obes (Lond). 2019;43(2):306–318. [DOI] [PubMed] [Google Scholar]
- 68.Jones MR, Brower MA, Xu N, Cui J, Mengesha E, Chen YD, Taylor KD, Azziz R, Goodarzi MO. Systems Genetics Reveals the Functional Context of PCOS Loci and Identifies Genetic and Molecular Mechanisms of Disease Heterogeneity. PLoS Genet. 2015;11(8):e1005455. [DOI] [PMC free article] [PubMed] [Google Scholar]
- 69.Kamei Y, Suganami T, Ehara T, Kanai S, Hayashi K, Yamamoto Y, Miura S, Ezaki O, Okano M, Ogawa Y. Increased expression of DNA methyltransferase 3a in obese adipose tissue: studies with transgenic mice. Obesity (Silver Spring). 2010;18(2):314–321. [DOI] [PubMed] [Google Scholar]
- 70.Petrus P, Bialesova L, Checa A, Kerr A, Naz S, Backdahl J, Gracia A, Toft S, Dahlman-Wright K, Heden P, Dahlman I, Wheelock CE, Arner P, Mejhert N, Gao H, Ryden M. Adipocyte Expression of SLC19A1 Links DNA Hypermethylation to Adipose Tissue Inflammation and Insulin Resistance. J Clin Endocrinol Metab. 2018;103(2):710–721. [DOI] [PubMed] [Google Scholar]
- 71.Downing LE, Ferguson BS, Rodriguez K, Ricketts ML. A grape seed procyanidin extract inhibits HDAC activity leading to increased Pparalpha phosphorylation and target-gene expression. Mol Nutr Food Res. 2017;61(2):1600347. [DOI] [PMC free article] [PubMed] [Google Scholar]
- 72.Padmanabhan V, Veiga-Lopez A. Sheep models of polycystic ovary syndrome phenotype. Molecular and cellular endocrinology. 2013;373(1–2):8–20. [DOI] [PMC free article] [PubMed] [Google Scholar]
- 73.Anagnostis P, Tarlatzis BC, Kauffman RP. Polycystic ovarian syndrome (PCOS): Long-term metabolic consequences. Metabolism. 2018;86:33–43. [DOI] [PubMed] [Google Scholar]
- 74.Sagvekar P, Kumar P, Mangoli V, Desai S, Mukherjee S. DNA methylome profiling of granulosa cells reveals altered methylation in genes regulating vital ovarian functions in polycystic ovary syndrome. Clin Epigenetics. 2019;11(1):61. [DOI] [PMC free article] [PubMed] [Google Scholar]
- 75.Xu N, Azziz R, Goodarzi MO. Epigenetics in polycystic ovary syndrome: a pilot study of global DNA methylation. Fertil Steril. 2010;94(2):781–783 e781. [DOI] [PMC free article] [PubMed] [Google Scholar]
- 76.Kokosar M, Benrick A, Perfilyev A, Fornes R, Nilsson E, Maliqueo M, Behre CJ, Sazonova A, Ohlsson C, Ling C, Stener-Victorin E. Epigenetic and Transcriptional Alterations in Human Adipose Tissue of Polycystic Ovary Syndrome. Sci Rep. 2016;6:22883. [DOI] [PMC free article] [PubMed] [Google Scholar]
- 77.Sathishkumar C, Prabu P, Balakumar M, Lenin R, Prabhu D, Anjana RM, Mohan V, Balasubramanyam M. Augmentation of histone deacetylase 3 (HDAC3) epigenetic signature at the interface of proinflammation and insulin resistance in patients with type 2 diabetes. Clin Epigenetics. 2016;8:125. [DOI] [PMC free article] [PubMed] [Google Scholar]
- 78.Nilsson E, Benrick A, Kokosar M, Krook A, Lindgren E, Kallman T, Martis MM, Hojlund K, Ling C, Stener-Victorin E. Transcriptional and Epigenetic Changes Influencing Skeletal Muscle Metabolism in Women With Polycystic Ovary Syndrome. J Clin Endocrinol Metab. 2018;103(12):4465–4477. [DOI] [PubMed] [Google Scholar]
- 79.Padmanabhan V, Veiga-Lopez A. Reproduction Symposium: developmental programming of reproductive and metabolic health. J Anim Sci. 2014;92(8):3199–3210. [DOI] [PMC free article] [PubMed] [Google Scholar]
- 80.Clarke IJ. Models of ‘obesity’ in large animals and birds. Front Horm Res. 2008;36:107–117. [DOI] [PubMed] [Google Scholar]
- 81.Hamosh M, Hamosh P. The effect of estrogen on the lipoprotein lipase activity of rat adipose tissue. J Clin Invest. 1975;55(5):1132–1135. [DOI] [PMC free article] [PubMed] [Google Scholar]
Associated Data
This section collects any data citations, data availability statements, or supplementary materials included in this article.