

Abstract
Background & aims
Analysis of volatile organic compounds (VOCs) in exhaled breath, ‘volatomics’, provides opportunities for non-invasive biomarker discovery and novel mechanistic insights into a variety of diseases. The purpose of this pilot study was to compare breath VOCs in an initial cohort of patients with non-alcoholic fatty liver disease (NAFLD) and healthy controls.
Methods
Breath samples were collected from 15 participants with Child-Pugh class A NAFLD cirrhosis, 14 with non-cirrhotic NAFLD, and 14 healthy volunteers. Exhaled breath samples were collected using an established methodology and VOC profiles were analysed by gas chromatography-mass spectrometry. The levels of 19 VOCs previously associated with cirrhosis were assessed. Peaks of the VOCs were confirmed and integrated using Xcalibur® software, normalised to an internal standard. Receiver-operating characteristic (ROC) curves were used to determine the diagnostic accuracy of the candidate VOCs.
Results
Terpinene, dimethyl sulfide, and D-limonene provided the highest predictive accuracy to discriminate between study groups. Combining dimethyl sulfide with D-limonene led to even better discrimination of patients with NAFLD cirrhosis from healthy volunteers (AUROC 0.98; 95% CI 0.93–1.00; p <0.001) and patients with NAFLD cirrhosis from those with non-cirrhotic NAFLD (AUROC 0.91; 95% CI 0.82–1.00; p <0.001). Breath terpinene concentrations discriminated between patients with non-cirrhotic NAFLD and healthy volunteers (AUROC 0.84; 95% CI 0.68–0.99; p = 0.002).
Conclusion
Breath terpinene, dimethyl sulfide, and D-limonene are potentially useful volatomic markers for stratifying NAFLD; in addition, a 2-stage approach enables the differentiation of patients with cirrhosis from those without. However, these observations require validation in a larger NAFLD population. (ClinicalTrials.gov Identifier: NCT02950610).
Lay summary
Breath malodour has been associated with a failing liver since the ancient Greeks. Analytical chemistry has provided us an insight into ubiquitous volatile organic compounds associated with liver (and other) diseases. This has vastly improved our understanding of the mechanistic processes of liver damage. Our study aims to identify volatile organic compounds which are specific to non-alcoholic fatty liver disease and that can be exploited for rapid diagnostics.
Keywords: Volatile organic compounds, Non-alcoholic fatty liver disease, Volatomics, Terpinene, D-limonene, Dimethyl sulfide
Abbreviations: ALT, alanine aminotransaminase; APRI, aminotransferase:platelet ratio index; ARFI, acoustic radiation force impulse; AST, aspartate aminotransferase; AUROC, area under the receiver-operating characteristics curve; BMI, body mass index; GAVE, gastric antral vascular ectasia; GC-MS, gas chromatography mass spectrometry; GGT, gamma-glutamyltransferase; HA, hyaluronic acid; HOMA, homeostatic model assessment; NAFLD, non-alcoholic fatty liver disease; NASH, non-alcoholic steatohepatitis; PHG, portal hypertensive gastropathy; QC, quality control; T2DM, type 2 diabetes mellitus; TE, transient elastography; VOCs, volatile organic compounds
Graphical abstract
Highlights
-
•
Metabolic dysfunction in liver disease is reflected in the biocomposition of exhaled breath.
-
•
Specific volatile organic compounds can be measured in breath samples (volatomics) and have diagnostic potential in chronic liver disease.
-
•
Levels of alfa-terpinene, dimethyl sulfide, and D-limonene in exhaled breath can be used to stratify patients with non-alcoholic fatty liver disease.
Introduction
Non-alcoholic fatty liver disease (NAFLD) has emerged as the leading cause of chronic liver disease worldwide, affecting up to 25% of the global population. Its prevalence is expected to escalate in parallel with the inexorable rise of obesity and diabetes. It is estimated that nearly 35% among those with steatosis will progress to non-alcoholic steatohepatitis (NASH) and, in turn, a considerable proportion of those with NASH will continue insidiously to advanced liver disease. The severity of hepatic fibrosis has been shown to correlate with all-cause and disease-specific mortality in NAFLD.1
Given the potential burden associated with NAFLD, identifying those at high risk of adverse outcomes is crucial. Various imaging techniques and biomarkers have been used to monitor NAFLD progression, but none can match the sensitivity and specificity achieved with a percutaneous liver biopsy for detection of early stages of liver disease. However, liver biopsy is invasive, prone to sampling error, and impractical for disease monitoring.2 Thus, there is a need to develop a sensitive, specific, and non-invasive diagnostic tool that can accurately characterise patients across the entire spectrum of NAFLD.
In recent years, several studies have explored the use of volatile organic compounds (VOCs) in exhaled breath as a non-invasive diagnostic tool in chronic liver disease.[3], [4], [5], [6], [7], [8] The underpinning concept is that perturbed metabolic pathways can alter the pattern of breath VOC composition. An example commonly encountered in a clinical setting is fetor hepaticus, which can occur with metabolic derangements in cirrhosis. Similarly, NAFLD is associated with myriad metabolic changes that can influence the composition and concentration of VOCs. Although studies have shown changes in VOC composition in obese individuals with NAFLD, correlations with the different stages of NAFLD have not been established.4 Alterations in gut microbiota have been shown to contribute to the pathogenesis of NAFLD through metabolic mediators.9 More recently, a mechanistic study implicated high-alcohol-producing Klebsiella pneumoniae (so-called ‘auto-brewery’) as a potential causative factor in some patients with NAFLD.10
In this pilot study, we examined the pattern of exhaled breath VOCs in patients with cirrhosis and non-cirrhotic NAFLD to identify specific biomarker signals with potential utility for the stratification of NAFLD.
Methods
Study population
This study was conducted as a substudy of a larger study: Breath analysis using an electronic nose in non-alcoholic fatty liver disease (‘BEN’; ClinicalTrials.gov Identifier: NCT02950610), a single-centre prospective observational study that aimed to examine exhaled VOC patterns in NAFLD using an electronic nose (eNose). Of the total 90 participants, exhaled breath for gas chromatography mass spectrometry (GC-MS) was collected from the first 45 consecutive participants. This included 30 participants with NAFLD with or without cirrhosis (based on histological or clinical criteria) and 15 healthy volunteer controls.
The sample size was based on the following consideration: if molecular compounds are to be used in clinical practice, their association should be considerable. We defined the association to be potentially useful if the correlation coefficient was >0.6/0.7. For correlations to be statistically significant (p <0.05) with 80% power, ∼15 participants in each group were required. Given contamination issues, one sample each from the non-cirrhotic NAFLD and healthy volunteer groups was excluded. Male and female adult participants were recruited from the liver outpatient clinics at the Royal Infirmary of Edinburgh (Edinburgh, UK) between March 2016 and February 2017. Exclusion criteria were as follows: known respiratory disease; severe obesity [body mass index (BMI) >40]; use of antibiotics for preceding 4 weeks; ongoing alcohol use of >21 units for men and 14 units for women; inability to give informed consent; and NAFLD cirrhosis with Child-Pugh score >7.
Participants with NAFLD were divided into: NAFLD without cirrhosis or NAFLD Child-Pugh class A cirrhosis. This was based on the most recent liver biopsy and/or gastroscopy (performed at least within 1 year of breath test and other investigations); ultrasound, transient elastography (Fibroscan®, Echosens, France), and/or Acoustic Radiation Force Impulse (AFRI) using the Siemens ultrasound system (Siemens AG, Erlangen, Germany), and serum hyaluronic acid (HA) measured using a radiometric assay (Pharmacia, Uppsala, Sweden), performed within 6 months of breath test.
NAFLD cirrhosis was diagnosed by liver biopsy in 2 participants, endoscopic features of portal hypertension in 12 participants, and radiological features in one participant.
Non-cirrhotic NAFLD was diagnosed by liver biopsy (in 5 participants) and the remaining 9 participants were diagnosed by clinical and radiological features, non-invasive scores, such as the Fibrosis-4 (Fib-4) score, aspartate aminotransferase:platelet ratio index (APRI), NAFLD fibrosis and BARD scores, serum HA, and transient elastography measurements.[11], [12], [13], [14]
Greater diagnostic weight was given to histological or endoscopic diagnoses (in the case of cirrhosis); in patients who had a definitive diagnosis of cirrhosis, the non-invasive markers were not considered. The healthy control group comprised self-declared healthy participants. They were recruited through word-of-mouth and advertising posters in the institution. They were screened using questionnaire, physical examination, and reported absence of any medical illness and use of any regular medication.
Measures were taken to mitigate against the effect of diet, environmental factors, and medication. All participants attended a single study visit at Edinburgh Clinical Research Facility after an overnight fast. Written informed consent was taken from all participants. Although no strict diet was enforced, both overnight fasting and careful oral hygiene with unchlorinated water preparation were undertaken. Participants refrained from using any perfumes or deodorants on the day of their visit. Smoking and alcohol consumption were restricted for 48 h preceding the visit. Reconciliation of concomitant medication was ascertained at screening. Drugs were categorised as inducers, inhibitors, and substrates.15 Participants taking enzyme-inducing drugs were excluded. A dedicated room was used for breath sample collection. Only the participant and the investigator were allowed to enter the room for the purpose of breath collection. Upon breath collection, the room was again secured. The interval between 2 consecutive participants was at least 4 h.
Anthropometric measurement and venous sample collection were completed before breath sample collection. Central obesity was defined as a waist circumference >94 cm for men and >78 cm for women taken midway between the lowest rib and the iliac crest.16 Homeostatic model assessment (HOMA) was performed in participants without a known diagnosis of diabetes.17
Exhaled breath collection
Participants were given unchlorinated water to rinse their mouth before breathing through a mouthpiece with their nose clipped into a 2-way non-rebreathing valve (Hans Rudolph 1410, Hans Rudolph, Kansas City, KS, USA) with an inspiratory VOC filter (A2, North Safety, Middelburg, NL, USA) and an expiratory silica reservoir to dry the expired air. The breathing manoeuvres have been previously described.18 After 5 min of equilibration by tidal breathing with VOC-filtered air, the expiratory port was connected to a 10 L Tedlar sampling bag (SKC Inc., Eighty Four, PA, USA). Participants then performed an inspiratory capacity manoeuvre and exhaled the full expiratory vital capacity into the bag with an expiratory resistance of 20 cmH2O to close the soft palate and to obtain an expiratory flow of 0.1–0.2 L/s.
The sampling method for VOCs has been described previously.[18], [19], [20], [21] This sampling procedure incorporates inspiratory VOC filtering to minimise any external influence on the VOCs.22 The combination of targeted analyses concerning 19 VOCs and an additional stable factor of a dedicated climate-controlled room, reduces dramatically the change of a false discovery. Every conceivable effort was undertaken to minimise contamination and external influence.
Although we did not capture consecutive breath samples for the same group of participants to monitor variation in VOCs over time, the authors have previously studied variations within a study group and found little variation.23
GC-MS sample analysis
GC-MS analysis was performed as previously described.22 Briefly, the content of the Tedlar bags was transferred into stainless-steel adsorption tubes (Gerstel Steel Tenax® GR Sorbent Tubes, closed by Teflon Ferrules and Swagelok Stainless Steel Tube Caps, Philips, Eindhoven, The Netherlands) by a peristaltic pump (flow rate 200 mL/min) within 30 min of collection. Adsorption tubes were stored in an airtight package at 4°C and transported to Philips Innovation Services (Eindhoven, The Netherlands) for analysis using methodology previously described20 (see the supplementary data online).
GC-MS QC
GC-MS was performed by an established commercial laboratory (www.philips.com/a-w/research/locations/eindhoven.html) with a strong reputation in Europe as a reference measurement centre. Accordingly, our commercial collaborators confirmed through their internal analyses and quality control (QC), that the signals had not changed within 28 days of storage. Furthermore, they also confirmed that there was negligible background signal from the Tedlar bags (which can add N,N-dimethylacetamide and phenol to the breath signal). After receipt of the Tenax tubes, the tubes were dried and stored in the fridge until analysis.
Chemical identification
Owing to the complex nature of untargeted GC-MS data, we performed a semitargeted non-quantitative ubiquity analysis of VOCs in the study groups of 19 VOCs. This set of 19 compounds were selected based on previous supportive literature and biological plausibility in our study population. The studied VOCs as listed by the International Union of Pure and Applied Chemistry (IUPAC) were: butane; 2-butanone; 3-methylpentane; octane; styrene; decane; acetone; isoprene; dimethyl sulfide; cyclopentane; methyl vinyl ketone (3-buten-2-one); dimethyl sulfoxide; benzaldehyde; phenol (hydroxybenzene); D-limonene; acetophenone; undecane (n-undecane); tetradecane; and alfa-terpinene (terpinene).
We used Xcalibur version 3.0 (Thermo Fisher Scientific, Waltham, MA, USA) to assess the data. Files were converted to .raw files. Reconstructed ion chromatograms of each of the 19 compounds were generated. The mass spectra of each discernible peak were assessed using the National Institute of Science and Technology (NIST) library database in the Thermo Library manager section of Xcalibur 3.0. The putative chemical identity was determined by examining representative mass spectral data and m/z ion patterns. A match with a probability >80% according to the NIST library was used to confirm the compound. This was further confirmed using AMDIS freeware (Automated Mass Spectral Deconvolutional & Identification System, www.amdis.net/index.html).
In our experience, general automated peak picking is faster than manual peak selection and integration, especially for large data sets. Our previous published work was performed using this technique, where all data analysis was done automatically, but tailored to the specific data.21,24
These compounds have been previously shown to be associated with cirrhosis.6,8 Within the samples, we identified these compounds based on the mass spectra and an identifiable peak at consistent retention time. The peak of the extracted ion chromatograms of each compound were integrated using Xcalibur 3.0. The peak was recorded as not detected if the ion count was <500 ion counts at the assigned retention time. All compound peak areas were normalised to the peak area of toluene-d8 in each sample, because this was added to all samples when analysed by GC-MS as an internal standard.
Statistical analysis
Statistical analyses were performed using IBM SPSS Statistics for Macintosh version 21.0 (IBM Corp., Armonk, NY, USA) and GraphPad Prism version 5.0a (San Diego, CA, USA). Data were presented as mean [standard deviation (SD)] or median [interquartile range (IQR)] for continuous variables. Categorical variables were presented as frequency and percentage. Data were analysed using ANOVA with Bonferroni correction to minimise false discovery. Multivariable logistic regression analysis was performed to build a model for the prediction of cirrhosis and non-cirrhotic liver disease; all breath compounds were considered for inclusion. Discrimination was used for internal model validation; that is, measuring the ability to rank patients by risk of cirrhosis, such that patients with a higher predicted risk were more likely to have cirrhosis. Discrimination was measured by the Area Under the Receiver Operating Characteristics curve (AUROC). All individual compounds with AUROCs of 0.80 or above were further assessed to find the combination of any 2 that provided the highest AUROC. After choosing the final model, Harrell's method was used to compute the validation metric with over-fitting bias correction through bootstrap resampling.25 A thousand bootstrap samples (B = 1,000) were drawn from the original data set and a new model with the same model settings was built on each bootstrap resample. Prediction based on patients who were not chosen in the resample was calculated. An optimism factor was calculated over the 1,000 new models and the bias-corrected validation metric was obtained by subtracting this optimism value from the AUROC directly measured from the original model. Bonferroni correction was applied to decrease the false discovery rate and a p value <0.01 was considered significant. AUROC curves were used to calculate the performance of diagnostic tests and for calculating the best point of separation between sensitivity and specificity. Given the sample size and to reduce any possibility of beta error, a p value <0.01 was considered significant and clinically valuable.
Ethics permission
The clinical study was conducted according to the ethical principles of the Declaration of Helsinki 2013 and following approval from the East of Scotland Research Ethics Committee (REC reference: 15/ES/0207) and the National Health Service (NHS) Lothian Research and Development Department (Ref: E151593).
Results
Baseline characteristics
Baseline characteristics of the study population are summarised in Table 1. Two samples (1 patient with non-cirrhotic NAFLD and 1 healthy control participant) had to be excluded for technical reasons. Participants in the healthy control group were significantly younger [median 39 (IQR 20–59) years] than those with NAFLD without cirrhosis [median 60 (IQR 29–75) years] or with cirrhosis [median 69 (IQR 44–76) years]. Similarly, BMI and waist circumference were lower in healthy controls compared with those with NAFLD.
Table 1.
Baseline characteristics of study participants.
| Characteristics | NAFLD cirrhosis (n = 15) | Non-cirrhotic NAFLD (n = 14) | Healthy controls (n = 14) | p value |
|---|---|---|---|---|
| Women (%) | 4 (27) | 5 (36) | 9 (64) | 0.70 |
| Age (years) | 69 (44–76) | 60 (29–75) | 39 (20–59) | <0.001 |
| Height (m) | 1.73 (1.56–1.81) | 1.72 (1.50–1.87) | 1.72 (1.54–1.84) | 0.93 |
| Weight (kg) | 96.4 (76–118) | 103.8 (73.4–126.8) | 61.45 (48.7–74.7) | <0.001 |
| BMI (kg/m2) | 34.2 (25.4–37.8) | 35 (30.9–39.8) | 21.6 (18.6–24.7) | <0.001 |
| Waist circumference (cm) | <0.001 | |||
| Women | 110 (100–119) | 106 (95–126) | 74 (64.5–80) | |
| Men | 110 (96–130) | 110 (106–136) | 80 (73–85) | |
| Smoking status (%) | 0.16 | |||
| Current smoker | 1 (7) | 2 (14) | 1 (7) | |
| Ex-smoker | 5 (33) | 2 (14) | 0 (0) | |
| Non-smoker | 9 (60) | 10 (72) | 13 (93) | |
| Alcohol (units/week) | 0 (0–10) | 1 (0–7) | 2.5 (0–10) | 0.20 |
| Coffee consumption(cups/day) | 3 (0–7) | 2 (0–7) | 2 (0–4) | 0.15 |
| Modality of diagnosis | 0.16 | |||
| Histology | 2 (13) | 5 (35) | ||
| Non-invasive | 13 (87) | 9 (65) | ||
| Elastography | ||||
| TE | 17 (8.6)† | 8.9 (5.1) | – | <0.001 |
| ARFI | 3.2 (1.3)‡ | – | – | |
| Hyaluronic acid (μg/L) | 200 (241)± | 40 (30) | – | <0.001 |
| Fibrosis score | ||||
| APRI score | 0.42 (0.33) | 0.24 (0.15) | 0.007 | |
| NAFLD fibrosis score | 1.54 (1.17) | –0.38 (1.66) | 0.017 | |
| Fib-4 score | 2.31 (1.15) | 1.39 (0.77) | 0.004 | |
| BARD Score | 4 (1) | 3 (3) | 0.082 | |
| Laboratory parameters | ||||
| HbA1c (IFCC) | 54 (36–103) | 49 (32–94) | – | 1.00 |
| HOMA | 4.45 (2.7–6.2)ˆ | 5.35 (1.7–6.9)ˆˆ | – | 0.91 |
| GGT (U/L) | 147 (44–843) | 61 (22–387) | – | 0.07 |
| Albumin (g/L) | 36 (31–40) | 39 (35–44) | – | 0.02 |
| AST (U/L) | 32 (25–71) | 27 (21–78) | – | 0.27 |
| ALT (U/L) | 55 (14–69) | 44 (16–115) | – | 0.14 |
| Platelets (109/L) | 210 (61–271) | 229 (108–289) | – | 0.14 |
Data presented as median and IQR or frequency (n) and percentage where appropriate. Student’s t test or Mann-Whitney U test were used to compare normally distributed continuous variables and non-parametrically distributed data, respectively.
ALT, alanine aminotransaminase; ARFI, acoustic radiation force impulse; AST, aspartate aminotransferase; BMI, body mass index; GGT, gamma-glutamyltransferase; HOMA, homeostatic model assessment; NAFLD, non-alcoholic fatty liver disease; TE, transient elastography.
n = 10.
n = 3.
n = 13.
n = 2.
n = 6.
Among participants with NAFLD cirrhosis, 80% had endoscopic evidence of portal hypertension [6 (40%) varices, 4 (27%) portal hypertensive gastropathy (PHG), and 1 (6%) each for gastric antral vascular ectasia (GAVE) and dilated azygous vein on endoscopic ultrasound]. Of the remaining 4 (20%) who did not have endoscopic evidence of portal hypertension, 2 had coarse liver echotexture with splenomegaly on ultrasound and 2 had coarse liver echotexture alone.
Quantification of exhaled VOCs in the study population
Of the 19 VOCs studied in the exhaled breath samples, 7 compounds (styrene, acetone, isoprene, DMS, D-limonene, acetophenone, and terpinene) were significantly different between the groups (Fig. 1). There was no correlation between age and VOCs in line with previous findings.7,8,26 However, acetone, isoprene, DMS, and D-limonene were correlated with BMI. Given the lower BMI in the control group than in those with NAFLD, and because some compounds, such as breath acetone, have been shown to correlate with body weight, we adjusted each compound for BMI.27 This was achieved by dividing the intensity of VOC by the corresponding BMI, before inclusion into the statistical modelling.27 Significant differences persisted between the group with cirrhosis and the healthy control group for styrene, acetone, isoprene, DMS, D-limonene, acetophenone, and terpinene. Isoprene is a by-product of cholesterol biosynthesis. However, similar to other authors, we found no correlation between serum cholesterol and isoprene [rho = 0.87 (−0.32, 0.48) p = 0.654].3
Fig. 1.

Levels of volatile organic compounds in exhaled breath in study participants.
Healthy (healthy controls; n = 14), NC NAFLD (n = 14) and NAFLD C (n = 15). Levels were adjusted for a unit toluene-d8 (internal standard reference) and BMI. Data expressed as mean with standard error of mean. A one-way ANOVA was performed with post-test Bonferroni correction. Significance is denoted as ∗p <0.05, ∗∗p <0.01, and ∗∗∗p <0.001. BMI, body mass index; NAFLD C, non-alcoholic fatty liver disease with cirrhosis; NC NAFLD, non-cirrhotic non-alcoholic fatty liver disease.
In our study, D-limonene was inversely correlated with serum albumin (Pearson's r = 0.7, p <0.001). By contrast, APRI score correlated positively with D-limonene (Pearson's r = 0.6, p <0.01). No significant correlation was found between the detected VOCs and serum HA or transient elastography data (data not shown).
Effect of diabetes on VOC production
In the group with cirrhosis, 13 participants (87%) had type 2 diabetes mellitus with HbA1c International Federation of Clinical Chemistry and Laboratory Medicine (IFCC) ranging from 44 mmol/mol to 103 mmol/mol measured within 3 months of breath sampling. Two participants had insulin resistance as evidenced by HOMA-IR score (2.7 and 6.2). In the non-cirrhotic NAFLD group, 8 participants (57%) had type 2 diabetes mellitus (T2DM) with HbA1c (IFCC) ranging from 45 mmol/mol to 94 mmol/mol and 6 (43%) participants had insulin resistance with HOMA of Insulin Resistance (HOMA-IR) ranging from 1.7 to 6.9. It is conceivable that insulin resistance and/or T2DM had contributed to the high level of acetone, particularly in the group with cirrhosis. We also noted that the actual differences in breath acetone were probably bigger than measured here because the concentration of acetone recorded was outside the linear range of the instrument.
Differentiating patients with non-cirrhotic NAFLD from healthy control participants
Levels of isoprene, acetophenone, and terpinene were significantly lower in patients with non-cirrhotic NAFLD than in healthy controls. Of these, terpinene had the highest AUROC for predicting non-cirrhotic NAFLD (0.84; 95% CI 0.68–0.99; p = 0.002) (Table 2 and Fig. 2). Combining terpinene with isoprene and/or acetophenone did not improve the diagnostic accuracy.
Table 2.
AUROC for different volatile organic compounds for classifying patients with non-cirrhotic NAFLD vs. healthy participants.
| Volatile organic compound | AUROC (95% CI) | p value |
|---|---|---|
| Isoprene | 0.75 (0.57–0.94) | 0.022 |
| Acetophenone | 0.80 (0.63–0.97) | 0.007 |
| Terpinene | 0.84 (0.68–0.99) | 0.002 |
Discrimination used for internal model validation - ranking patient with non-cirrhotic NAFLD was measured by AUROC. AUROC, area under receiver operating characteristic; NAFLD, non-alcoholic fatty liver disease.
Fig. 2.

AUROC curve for breath terpinene in classifying patients with non-cirrhotic NAFLD (n = 14) vs. healthy participants (n = 14). Discrimination used for internal model validation - ranking patient with non-cirrhotic NAFLD was measured by AUROC.
AUROC, area under the receiver operating curve; NAFLD, non-alcoholic fatty liver disease.
Differentiating patients with NAFLD cirrhosis from healthy control participants
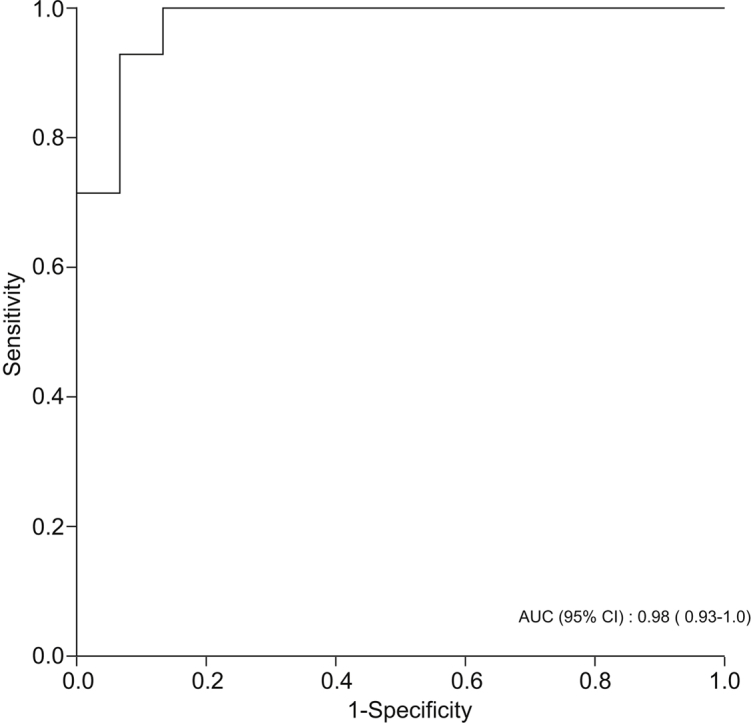
Levels of styrene, isoprene, acetophenone, and terpinene were significantly lower in participants with NAFLD cirrhosis compared with healthy individuals. By contrast, levels of DMS and D-limonene were significantly higher in patients with NAFLD cirrhosis compared with healthy controls. DMS and D-limonene had the highest predictive accuracy for predicting NAFLD cirrhosis, with AUROCs of 0.94 (95% CI 0.86–1.00, p <0.001) and 0.91 (95% CI 0.79–1.00, p <0.001), respectively (Table 3). However, combining DMS and D-limonene had even higher predictive accuracy for diagnosing NAFLD cirrhosis, with AUROC of 0.98 (95% CI 0.93–1.00, p <0.001) (Fig. 3).
Table 3.
AUROC for different volatile organic compounds for classifying patients with NAFLD cirrhosis vs. healthy participants.
| Volatile organic compound | AUROC (95% CI) | p value |
|---|---|---|
| Styrene | 0.37 (0.16–0.58) | 0.239 |
| Acetone | 0.77 (0.58–0.95) | 0.015 |
| Isoprene | 0.49 (0.27–0.72) | 0.965 |
| Dimethyl sulfide | 0.94 (0.86–1.00) | <0.001 |
| D-limonene | 0.91 (0.79–1.00) | 0.002 |
| Acetophenone | 0.40 (0.12–0.61) | 0.36 |
| Terpinene | 0.34 (0.13–0.54) | 0.13 |
Discrimination used for internal model validation - ranking patient with NAFLD cirrhosis was measured by AUROC. AUROC, area under receiver operating characteristic; NAFLD, non-alcoholic fatty liver disease.
Fig. 3.

AUROC curve for a combination of D-limonene and dimethyl sulfide in classifying patients with NAFLD cirrhosis (n = 15) vs. healthy participants (n = 14). Discrimination used for internal model validation - ranking patient with NAFLD cirrhosis was measured by AUROC.
AUROC, area under the receiver operating curve; NAFLD, non-alcoholic fatty liver disease.
Differentiating patients with non-cirrhotic NAFLD from those with NAFLD cirrhosis
Levels of DMS and D-limonene were significantly higher in patients with NAFLD cirrhosis compared with those with non-cirrhotic NAFLD. DMS and D-limonene had the highest predictive accuracy for NAFLD cirrhosis, with AUROCs of 0.87 (95% CI 0.74–1.00, p <0.001) and 0.83 (95% CI 0.68–0.98, p = 0.002), respectively (Table 4). However, combining DMS and D-limonene had even higher predictive accuracy for diagnosing NAFLD cirrhosis, with AUROC of 0.91 (95%CI 0.82–1.00, p <0.001) (Fig. 4).
Table 4.
AUROC for different volatile organic compounds for classifying patients with NAFLD cirrhosis vs. those with non-cirrhotic NAFLD.
| Volatile organic compounds | AUROC (95% CI) | p value |
|---|---|---|
| Dimethyl sulfide | 0.87 (0.74–1.00) | <0.001 |
| D-limonene | 0.83 (0.68–0.98) | 0.002 |
| Acetone | 0.81 (0.63–0.99) | 0.005 |
Discrimination used for internal model validation - ranking patient with NAFLD cirrhosis was measured by AUROC. AUROC, area under receiver operating characteristic; NAFLD, non-alcoholic fatty liver disease.
Fig. 4.

AUROC curve for a combination of D-limonene and dimethyl sulfide in classifying patients with NAFLD cirrhosis (n = 15) vs. non-cirrhotic NAFLD (n = 14).
AUROC, area under the receiver operating curve; NAFLD, non-alcoholic fatty liver disease.
Discussion
In this pilot study, we examined the concentration of VOCs in exhaled breath in adult patients with NAFLD with cirrhosis and those with non-cirrhotic NAFLD. We highlighted 3 compounds (acetone, DMS, and D-limonene) that differentiated between patients with cirrhosis and healthy controls. More importantly, we showed that DMS and D-limonene can discriminate between patients with NAFLD and with or without cirrhosis. From a clinical standpoint, the findings are important because these compounds could serve as biomarkers for the stratification of NAFLD.
There have been previous studies that have shown differences in VOC concentrations between chronic liver disease and healthy liver.6,8 These differences were identified using GC-MS in patients with liver disease of various aetiologies. In our study, we focussed solely on patients with NAFLD. Furthermore, we adjusted the measured VOC to BMI to provide a more accurate reflection of the metabolic profile because acetone, breath isoprene, 1-decene, 1-octene, ammonia, and hydrogen sulfide have been found to be influenced by body weight.27
Changes in cellular metabolism, insulin resistance, and oxidative stress in NAFLD are dynamic processes. It is possible that there is a distinct VOC profile for the stages of NAFLD and that the pattern is influenced by a complex interaction between oxidative stress, mitochondrial impairment, and metabolic pathways. Additionally, the onset of fibrosis can limit the capacity of metabolic and degradation pathways, which can affect VOCs. It is also noteworthy that, as NAFLD progresses, the presence of mitochondrial impairment can limit oxidative capacity, thus promoting the diversion of acetyl-CoA towards nonoxidative pathways, including ketogenesis, hence the higher formation of acetone in cirrhosis.28,29 This could also explain lower levels of isoprene in advanced liver disease.
Ketogenesis and levels of acetone can also be induced by fasting. In our study, breath sampling was obtained from all participants after overnight fasting to minimise the known physiological effects of food intake on exhaled VOC concentrations. Although fasting might have influenced the overall levels of acetone, we showed that the levels of acetone were substantially higher in patients with cirrhosis than in healthy controls. Furthermore, our finding is consistent with previous studies.8,30
Similarly, a higher concentration of D-limonene in NAFLD cirrhosis could reflect either inefficient metabolism (reduced levels of Cytochrome P450 enzymes; CYP2C9 and CYP2C19) that results in bioaccumulation or an adaptation to insulin resistance.6,7,26,31 D-limonene is a monoterpene that has been shown to have an antidiabetic effect and modulates lipid metabolism.32,33 Although elevated D-limonene levels have previously been reported in the context of cirrhosis, our study is the first to confirm its presence in exhaled breath in the context of NAFLD cirrhosis.6,8,26,28 D-limonene is also a major constituent in citrus essential oil, which is used in various foods as a flavouring agent. Although a food diary was not recorded in the present study, we applied strict environmental and participant preparation measures to minimise dietary influence or any other contamination. Additionally, previous work did not find any correlation between diet and breath limonene concentration.26 Therefore, taken together, this suggests that our findings are specific for liver disease.
It has long been considered that methyl-mercaptans and DMS are responsible for fetor hepaticus. DMS, being a derivative of methanethiol, has also been implicated in hepatic encephalopathy.34 DMS breath levels are elevated in cirrhosis and correlate with the degree of portosystemic shunting.[34], [35], [36] Our findings support this notion because 80% of the participants with NAFLD cirrhosis in our study had signs of portal hypertension on gastroscopy. All of the participants with cirrhosis were Child-Pugh class A without clinical signs of encephalopathy. We speculate that a probable source of DMS is the microbiota, given that previous studies have linked this to oral as well as gut dysbiosis.37,38 Methanethiol can be converted to hydrogen sulfide and oxidised to sulfate for detoxification, which can be utilised by sulfate-reducing bacteria, a process predominantly occurring in caecal tissue.39 Pyrosequencing or next-generation sequencing studies to establish an association of VOCs with microbiota would require a higher number of well-characterised participants with a specific preparation. This is beyond the scope of our present feasibility study.
Another abundant isomeric monoterpene detected in the exhaled breath in our study was terpinene. Consistent with previous studies, terpinene was able to discriminate patients with cirrhosis and NAFLD or with non-cirrhotic NAFLD from healthy controls.7 There is little in the published literature about terpinenes, and their role in NAFLD pathophysiology is unknown. However, they have been implicated in oxidative stress pathways.40 Thus, it is possible that the differences in the levels of alpha-terpinene between healthy controls and participants with NAFLD reflect the presence of oxidative stress in NAFLD.
Although we cannot totally exclude the possibility that medication might have influenced the breath concentrations of terpinenes, we mitigated this through medication reconciliation at screening. We speculated from the outset that CYP activity would be impaired and drug metabolism (and interactions) would be complex. Therefore, attempts were made to maintain the homogeneity of medication use in our participants by careful selection. Drugs were categorised either as ‘inducers’, ‘inhibitors’, or ‘substrates’, as previously described. None of the participants were taking enzyme inducers or inhibitors. Therefore, it is unlikely that any of the concomitant medication used by the participants could have influenced the terpenes, either directly or indirectly.
There were some limitations to our study. First, the participants were primarily selected based on clinical characterisation rather than exclusively on histological criteria, because this was a pragmatic observational pilot study. As such, it is likely that the non-cirrhotic NAFLD group comprised participants with a variable degree of disease activity and fibrosis. NAFLD is a dynamic process and compensated advanced chronic liver disease (cACLD) is a continuum. The mean annual fibrosis progression rate in patients with NASH is 0.14 stages, compared with 0.07 stages in patients with NAFLD.41 Therefore, although our study groups were as well characterised as possible, it is feasible that there was some overlap between participants with Child-Pugh A cirrhosis and participants with advanced fibrosis in the non-cirrhotic group. Similarly, healthy controls in our study did not undergo clinical phenotyping. It is conceivable that some of the participants in this group might have had hepatic steatosis or even NASH.42 The small sample size and case selection limitations mean that the findings might not be generalisable to the wider population with NAFLD.
Second, although the participants underwent an overnight fast, the potential impact of diet and dietary preferences on the breath VOCs cannot be completely excluded. Third, our data were cross-sectional and derived from a single-centre. Our findings will require further validation in external (longitudinal) cohorts of patients with NAFLD. Finally, we performed semitargeted rather than untargeted analysis; thus, selection bias cannot be completely excluded. However, there is a risk in ‘omics data that the lowest responders are lost because the sensitivity of untargeted analysis is not the strength of the technique. Therefore, our approach was to principally focus on specific compounds, and we interrogated 19 different compounds that have previously been described in the literature as having an association with liver disease. However, because we studied a semitargeted analysis of VOCs in the context of NAFLD, it is possible that some VOCs with a pathogenic role in the NAFLD were missed in our analysis.
We intentionally did not study alcoholic liver disease because the pathogenesis and difference in the impact of metabolic dysregulation would have introduced a substantial heterogeneity. However, it would be interesting to compare the VOC profiles of the 2 aetiologies to identify novel (and possibly shared) pathogenetic mechanisms, as indicated by intriguing observations in a murine NAFLD model.10
Conclusion
In conclusion, our study revealed breath VOCs as a potential non-invasive diagnostic tool in NAFLD. We showed that VOCs, such as DMS and D-limonene, can differentiate NAFLD cirrhosis from healthy liver. Furthermore, isoprene and terpinene concentrations can distinguish between patients with NAFLD with and without cirrhosis. Correlation of VOCs with histological stages of liver disease is now required, which can facilitate non-invasive stratification of NAFLD. It will also be of interest to perform a larger study to determine the contribution of portal hypertension to VOCs production. Through our pilot study, we have highlighted potential biomarkers that now require further external validation in larger populations of patients with NAFLD with histologically defined disease. In addition, a parallel study of VOCs and gut microbiome profiling would provide further mechanistic insights. The emerging artificial intelligence methodology with sophisticated algorithms could also generate new stage-specific breath signatures for the diagnosis and monitoring of disease progression in NAFLD.
Financial support
The study was funded by the Edinburgh and Lothian Health Foundation - Diabetes Clinical Research Fund.
Authors' contributions
RS, JNP, PCH: study concept and design; RS, EB, NZMH, HH, AL: analysis and interpretation of data; RS, AL, JAF, JP: drafting of manuscript; RS, AL, NZMH, JAF, HK, PB, AJ, PCH, JP: critical revision of manuscript for important intellectual content.
Conflicts of interest
The authors have no conflicts of interest pertaining to this study to declare.
Please refer to the accompanying ICMJE disclosure forms for further details.
Footnotes
Author names in bold designate shared co-first authorship
Supplementary data to this article can be found online at https://doi.org/10.1016/j.jhepr.2020.100137.
Supplementary data
References
- 1.Angulo P., Kleiner D.E., Dam-Larsen S., Adams L.A., Bjornsson E.S., Charatcharoenwitthaya P. Liver fibrosis, but no other histologic features, is associated with long-term outcomes of patients with nonalcoholic fatty liver disease. Gastroenterology. 2015;149:389–397. doi: 10.1053/j.gastro.2015.04.043. [DOI] [PMC free article] [PubMed] [Google Scholar]
- 2.Rockey D.C., Caldwell S.H., Goodman Z.D., Nelson R.C., Smith A.D., American Association for the Study of Liver Disease Liver biopsy. Hepatology. 2009;49:1017–1044. doi: 10.1002/hep.22742. [DOI] [PubMed] [Google Scholar]
- 3.Alkhouri N., Singh T., Alsabbagh E., Guirguis J., Chami T., Hanouneh I. Isoprene in the exhaled breath is a novel biomarker for advanced fibrosis in patients with chronic liver disease: a pilot study. Clin Transl Gastroenterol. 2015;6:e112. doi: 10.1038/ctg.2015.40. [DOI] [PMC free article] [PubMed] [Google Scholar]
- 4.Alkhouri N., Eng K., Cikach F., Patel N., Yan C., Brindle A. Breathprints of childhood obesity: changes in volatile organic compounds in obese children compared with lean controls. Pediatr Obes. 2015;10:23–29. doi: 10.1111/j.2047-6310.2014.221.x. [DOI] [PMC free article] [PubMed] [Google Scholar]
- 5.Hanouneh I.A., Zein N.N., Cikach F., Dababneh L., Grove D., Alkhouri N. The breathprints in patients with liver disease identify novel breath biomarkers in alcoholic hepatitis. Clin Gastroenterol Hepatol. 2014;12:516–523. doi: 10.1016/j.cgh.2013.08.048. [DOI] [PMC free article] [PubMed] [Google Scholar]
- 6.Dadamio J., Van den Velde S., Laleman W., Van Hee P., Coucke W., Nevens F. Breath biomarkers of liver cirrhosis. J Chromatogr B Analyt Technol Biomed Life Sci. 2012;905:17–22. doi: 10.1016/j.jchromb.2012.07.025. [DOI] [PubMed] [Google Scholar]
- 7.Morisco F., Aprea E., Lembo V., Fogliano V., Vitaglione P., Mazzone G. Rapid “breath-print” of liver cirrhosis by proton transfer reaction time-of-flight mass spectrometry. A pilot study. PLoS One. 2013;8:e59658. doi: 10.1371/journal.pone.0059658. [DOI] [PMC free article] [PubMed] [Google Scholar]
- 8.Van den Velde S., Nevens F., Van Hee P., van Steenberghe D., Quirynen M. GC-MS analysis of breath odor compounds in liver patients. J Chromatogr B Analyt Technol Biomed Life Sci. 2008;875:344–348. doi: 10.1016/j.jchromb.2008.08.031. [DOI] [PubMed] [Google Scholar]
- 9.Boursier J., Mueller O., Barret M., Machado M., Fizanne L., Araujo-Perez F. The severity of nonalcoholic fatty liver disease is associated with gut dysbiosis and shift in the metabolic function of the gut microbiota. Hepatology. 2016;63:764–775. doi: 10.1002/hep.28356. [DOI] [PMC free article] [PubMed] [Google Scholar]
- 10.Yuan J., Chen C., Cui J., Lu J., Yan C., Wei X. Fatty liver disease caused by high-alcohol-producing Klebsiella pneumoniae. Cell Metab. 2019;30:675–688. doi: 10.1016/j.cmet.2019.08.018. [DOI] [PubMed] [Google Scholar]
- 11.Lin Z.H., Xin Y.N., Dong Q.J., Wang Q., Jiang X.J., Zhan S.H. Performance of the aspartate aminotransferase-to-platelet ratio index for the staging of hepatitis C-related fibrosis: an updated meta-analysis. Hepatology. 2011;53:726–736. doi: 10.1002/hep.24105. [DOI] [PubMed] [Google Scholar]
- 12.Sterling R.K., Lissen E., Clumeck N., Sola R., Correa M.C., Montaner J. Development of a simple noninvasive index to predict significant fibrosis in patients with HIV/HCV coinfection. Hepatology. 2006;43:1317–1325. doi: 10.1002/hep.21178. [DOI] [PubMed] [Google Scholar]
- 13.Angulo P., Hui J.M., Marchesini G., Bugianesi E., George J., Farrell G.C. The NAFLD fibrosis score: a noninvasive system that identifies liver fibrosis in patients with NAFLD. Hepatology. 2007;45:846–854. doi: 10.1002/hep.21496. [DOI] [PubMed] [Google Scholar]
- 14.Harrison S.A., Oliver D., Arnold H.L., Gogia S., Neuschwander-Tetri B.A. Development and validation of a simple NAFLD clinical scoring system for identifying patients without advanced disease. Gut. 2008;57:1441–1447. doi: 10.1136/gut.2007.146019. [DOI] [PubMed] [Google Scholar]
- 15.Cozza K.L., Armstrong S.C., Oesterheld J.R. Second Edition. American Psychiatric Press; Washington: 2003. Concise Guide to Drug Interaction Principles for Medical Practice: Cytochrome P450s, UGTs, P-glycoproteins. [Google Scholar]
- 16.Williams R., Aspinall R., Bellis M., Camps-Walsh G., Cramp M., Dhawan A. Addressing liver disease in the UK: a blueprint for attaining excellence in health care and reducing premature mortality from lifestyle issues of excess consumption of alcohol, obesity, and viral hepatitis. Lancet. 2014;384:1953–1997. doi: 10.1016/S0140-6736(14)61838-9. [DOI] [PubMed] [Google Scholar]
- 17.Matthews D.R., Hosker J.P., Rudenski A.S., Naylor B.A., Treacher D.F., Turner R.C. Homeostasis model assessment: insulin resistance and beta-cell function from fasting plasma glucose and insulin concentrations in man. Diabetologia. 1985;28:412–419. doi: 10.1007/BF00280883. [DOI] [PubMed] [Google Scholar]
- 18.Dragonieri S., Schot R., Mertens B.J., Le Cessie S., Gauw S.A., Spanevello A. An electronic nose in the discrimination of patients with asthma and controls. J Allergy Clin Immunol. 2007;120:856–862. doi: 10.1016/j.jaci.2007.05.043. [DOI] [PubMed] [Google Scholar]
- 19.Fens N., van der Schee M.P., Brinkman P., Sterk P.J. Exhaled breath analysis by electronic nose in airways disease. Established issues and key questions. Clin Exp Allergy. 2013;43:705–715. doi: 10.1111/cea.12052. [DOI] [PubMed] [Google Scholar]
- 20.Fens N., de Nijs S.B., Peters S., Dekker T., Knobel H.H., Vink T.J. Exhaled air molecular profiling in relation to inflammatory subtype and activity in COPD. Eur Respir J. 2011;38:1301–1309. doi: 10.1183/09031936.00032911. [DOI] [PubMed] [Google Scholar]
- 21.Brinkman P., Ahmed W.M., Gomez C., Knobel H.H., Weda H., Vink T.J. Exhaled volatile organic compounds as markers for medication use in asthma. Eur Respir J. 2020;200:444–453. doi: 10.1183/13993003.00544-2019. [DOI] [PubMed] [Google Scholar]
- 22.Fens N., Zwinderman A.H., van der Schee M.P., de Nijs S.B., Dijkers E., Roldaan A.C. Exhaled breath profiling enables discrimination of chronic obstructive pulmonary disease and asthma. Am J Respir Crit Care Med. 2009;180:1076–1082. doi: 10.1164/rccm.200906-0939OC. [DOI] [PubMed] [Google Scholar]
- 23.Phillips M. Variation in volatile organic compounds in the breath of normal humans. J Chromatogr B Biomed Sci Appl. 1999;729:75–88. doi: 10.1016/s0378-4347(99)00127-9. [DOI] [PubMed] [Google Scholar]
- 24.Ahmed W.M., Brinkman P., Weda H., Knobel H.H., Xu Y., Nijsen T.M. Methodological considerations for large-scale breath analysis studies: lessons from the U-BIOPRED severe asthma project. J Breath Res. 2018;13:016001. doi: 10.1088/1752-7163/aae557. [DOI] [PubMed] [Google Scholar]
- 25.Harrell F.E., Jr., Califf R.M., Pryor D.B., Lee K.L., Rosati R.A. Evaluating the yield of medical tests. JAMA. 1982;247:2543–2546. [PubMed] [Google Scholar]
- 26.Fernandez Del Rio R., O'Hara M.E., Holt A., Pemberton P., Shah T., Whitehouse T. Volatile biomarkers in breath associated with liver cirrhosis - comparisons of pre- and post-liver transplant breath samples. EBioMedicine. 2015;2:1243–1250. doi: 10.1016/j.ebiom.2015.07.027. [DOI] [PMC free article] [PubMed] [Google Scholar]
- 27.Boshier P.R., Fehervari M., Markar S.R., Purkayastha S., Spanel P., Smith D. Variation in exhaled acetone and other ketones in patients undergoing bariatric surgery: a prospective cross-sectional study. Obes Surg. 2018;28:2439–2446. doi: 10.1007/s11695-018-3180-5. [DOI] [PubMed] [Google Scholar]
- 28.Cortez-Pinto H., Chatham J., Chacko V.P., Arnold C., Rashid A., Diehl A.M. Alterations in liver ATP homeostasis in human nonalcoholic steatohepatitis: a pilot study. JAMA. 1999;282:1659–1664. doi: 10.1001/jama.282.17.1659. [DOI] [PubMed] [Google Scholar]
- 29.Perez-Carreras M., Del Hoyo P., Martin M.A., Rubio J.C., Martin A., Castellano G. Defective hepatic mitochondrial respiratory chain in patients with nonalcoholic steatohepatitis. Hepatology. 2003;38:999–1007. doi: 10.1053/jhep.2003.50398. [DOI] [PubMed] [Google Scholar]
- 30.Alkhouri N., Cikach F., Eng K., Moses J., Patel N., Yan C. Analysis of breath volatile organic compounds as a noninvasive tool to diagnose nonalcoholic fatty liver disease in children. Eur J Gastroenterol Hepatol. 2014;26:82–87. doi: 10.1097/MEG.0b013e3283650669. [DOI] [PubMed] [Google Scholar]
- 31.Miyazawa M., Shindo M., Shimada T. Metabolism of (+)- and (-)-limonenes to respective carveols and perillyl alcohols by CYP2C9 and CYP2C19 in human liver microsomes. Drug Metab Dispos. 2002;30:602–607. doi: 10.1124/dmd.30.5.602. [DOI] [PubMed] [Google Scholar]
- 32.Murali R., Karthikeyan A., Saravanan R. Protective effects of D-limonene on lipid peroxidation and antioxidant enzymes in streptozotocin-induced diabetic rats. Basic Clin Pharmacol Toxicol. 2013;112:175–181. doi: 10.1111/bcpt.12010. [DOI] [PubMed] [Google Scholar]
- 33.Tan X.C., Chua K.H., Ravishankar Ram M., Kuppusamy U.R. Monoterpenes: novel insights into their biological effects and roles on glucose uptake and lipid metabolism in 3T3-L1 adipocytes. Food Chem. 2016;196:242–250. doi: 10.1016/j.foodchem.2015.09.042. [DOI] [PubMed] [Google Scholar]
- 34.Tangerman A., Meuwese-Arends M.T., Jansen J.B. Cause and composition of foetor hepaticus. Lancet. 1994;343:483. doi: 10.1016/s0140-6736(94)92729-4. [DOI] [PubMed] [Google Scholar]
- 35.Kaji H., Hisamura M., Saito N., Murao M. Gas chromatographic determination of volatile sulfur compounds in the expired alveolar air in hepatopathic subjects. J Chromatogr. 1978;145:464–468. doi: 10.1016/s0378-4347(00)81377-8. [DOI] [PubMed] [Google Scholar]
- 36.Chen S., Zieve L., Mahadevan V. Mercaptans and dimethyl sulfide in the breath of patients with cirrhosis of the liver. Effect of feeding methionine. J Lab Clin Med. 1970;75:628–635. [PubMed] [Google Scholar]
- 37.Ling Z., Liu X., Cheng Y., Jiang X., Jiang H., Wang Y. Decreased diversity of the oral microbiota of patients with hepatitis B virus-induced chronic liver disease: a pilot project. Sci Rep. 2015;5:17098. doi: 10.1038/srep17098. [DOI] [PMC free article] [PubMed] [Google Scholar]
- 38.Rey F.E., Gonzalez M.D., Cheng J., Wu M., Ahern P.P., Gordon J.I. Metabolic niche of a prominent sulfate-reducing human gut bacterium. Proc Natl Acad Sci U S A. 2013;110:13582–13587. doi: 10.1073/pnas.1312524110. [DOI] [PMC free article] [PubMed] [Google Scholar]
- 39.Furne J., Springfield J., Koenig T., DeMaster E., Levitt M.D. Oxidation of hydrogen sulfide and methanethiol to thiosulfate by rat tissues: a specialized function of the colonic mucosa. Biochem Pharmacol. 2001;62:255–259. doi: 10.1016/s0006-2952(01)00657-8. [DOI] [PubMed] [Google Scholar]
- 40.Foti M.C., Ingold K.U. Mechanism of inhibition of lipid peroxidation by gamma-terpinene, an unusual and potentially useful hydrocarbon antioxidant. J Agric Food Chem. 2003;51:2758–2765. doi: 10.1021/jf020993f. [DOI] [PubMed] [Google Scholar]
- 41.Singh S., Allen A.M., Wang Z., Prokop L.J., Murad M.H., Loomba R. Fibrosis progression in nonalcoholic fatty liver vs nonalcoholic steatohepatitis: a systematic review and meta-analysis of paired-biopsy studies. Clin Gastroenterol Hepatol. 2015;13:643–654. doi: 10.1016/j.cgh.2014.04.014. quiz e639–40. [DOI] [PMC free article] [PubMed] [Google Scholar]
- 42.Denkmayr L., Feldman A., Stechemesser L., Eder S.K., Zandanell S., Schranz M. Lean patients with non-alcoholic fatty liver disease have a severe histological phenotype similar to obese patients. J Clin Med. 2018;7:562. doi: 10.3390/jcm7120562. [DOI] [PMC free article] [PubMed] [Google Scholar]
Associated Data
This section collects any data citations, data availability statements, or supplementary materials included in this article.