

Abstract
Rationale: Growth and development during adolescence may modify the respiratory and vascular differences seen among extremely preterm (EP) individuals in childhood and early adolescence.
Objectives: To assess the trajectory of respiratory and cardiovascular outcomes during transition to adulthood in a national longitudinal cohort study of births before 26 weeks of gestation in the United Kingdom and Ireland.
Methods: A total of 129 EP participants and 65 control subjects attended for a center-based evaluation at 19 years of age. Standardized measures of spirometry, hemodynamics, functional capacity, and markers of inflammation were obtained from EP subjects with and without neonatal bronchopulmonary dysplasia and term-born control subjects at 19 years of age and compared with previous assessments.
Measurements and Main Results: Compared with the control group, the EP group was significantly impaired on all spirometric parameters (mean FEV1 z-score, −1.08 SD [95% confidence interval, −1.40 to −0.77]) and had lower fractional exhaled nitric oxide concentrations (13.9 vs. 24.4 ppb; P < 0.001) despite a higher proportion with bronchodilator reversibility (27% vs. 6%). The EP group had significantly impaired exercise capacity. All respiratory parameters were worse after neonatal bronchopulmonary dysplasia, and respiratory function differences were similar at 11 and 19 years. The augmentation index was 6% higher in the EP group and associated with increased total peripheral resistance (difference in means, 96.4 [95% confidence interval, 26.6–166.2] dyne/s/cm−5) and elevation in central, but not peripheral, blood pressure. Central systolic and diastolic blood pressures increased more quickly during adolescence in the EP group than in the control group.
Conclusions: Clinicians should address both cardiovascular and respiratory risks in adult survivors of extremely preterm birth.
Keywords: extreme prematurity, adult outcomes, lung function, cardiovascular function
At a Glance Commentary
Scientific Knowledge on the Subject
Survivors of extremely preterm birth have high levels of respiratory morbidity in childhood and adolescence.
What This Study Adds to the Field
We describe trajectories of respiratory and vascular parameters showing that cardiorespiratory function remains constant throughout adolescence to 19 years of age. The importance of cardiorespiratory monitoring and preventive strategies is emphasized.
There are over 2,400 births before 26 weeks each year in the UK and survival is increasing (1). Adult physicians are increasingly faced with people who were born prematurely and may have life-long consequences of their preterm birth and neonatal treatment. Most reports of long-term outcomes have considered the excess neuromorbidity manifest from childhood, but the cardiorespiratory consequences of a preterm birth are increasingly being recognized in adults. A high proportion of these individuals will have had neonatal bronchopulmonary dysplasia (BPD), defined as chronic oxygen-dependent lung disease persisting beyond 36 weeks postmenstrual age, and associated with a complex mix of developmental arrest of lung development and tissue injury (2). Significant deficits in lung function in school-age children born extremely premature have been documented, which may be associated with markers of increased cardiovascular risk (3).
In a national cohort study of births before 26 weeks of gestation (extremely preterm [EP]) in the British Isles during 1995 (the EPICure study), we identified a clinically significant deficit (SD = 1.5) in FEV1 at 11 years of age, which was greatest in those with neonatal BPD, and a doubling of reported diagnoses of asthma (4). We also found impaired cardiovascular health including significantly increased supine diastolic blood pressure (DBP) and, in a subset, increased aortic augmentation index (AIx), a measure of arterial pressure wave reflections that is associated with the presence of cardiovascular risk factors in younger individuals (5) and is independently related to future cardiovascular disease events in older individuals (6, 7). Moreover, the elevation in AIx correlated with the severity of lung impairment as assessed by FEV1 (3). The presence of irreversible airflow obstruction of this degree in adults would meet spirometric criteria for chronic obstructive pulmonary disease (COPD) (8). Whether the airflow obstruction in adults born EP (9) represents damaged but quiescent airways or the presence of an active inflammatory process, which may progress but also be tractable, remains a key unanswered question.
Based on the knowledge that peak lung function is attained in early adulthood and that there appeared to be an intrinsic relationship between respiratory and vascular measures, we investigated whether development during adolescence had modified the respiratory and vascular differences seen among EP individuals earlier in childhood, whether the posited relationship between the two persists, and if there was evidence for ongoing inflammation.
Methods
Participants
EPICure is a well characterized, geographically based, UK/Ireland national cohort of individuals who were born at ≤25 completed weeks of gestation between March and December 1995. Cardiorespiratory outcomes have been reported for this cohort at 11 years of age (3, 4, 10), and respiratory outcomes and seated brachial blood pressure have been reported at 6 years (11, 12).
The 307 young adults from the original EPICure study cohort who were alive at 16 years were contacted and individual consent was obtained to continue on the study. All responders were invited to participate in the following assessments at 19 years, alongside 153 term-born, normal-birthweight control subjects without neonatal illness recruited from classmates matched for sex and age, previously evaluated at 11 years, re-consented in the same way. There were no exclusion criteria.
Assessments
Clinical respiratory and cardiovascular assessments were conducted as part of a 2-day assessment at the University College London Hospitals Clinical Research Facility. Participants who requested home assessment undertook similar cardiovascular and respiratory evaluations but not the full 2-day assessment. Participants and parents completed questionnaires about health and relevant family information. Evaluations were undertaken by a single pediatrician (J.B.) who was trained in the protocols used for the study and blinded to the results of previous investigations. Participants were given a brief explanation of their results by the study pediatrician and any clinically significant results were communicated to their responsible primary care doctor in writing.
Further details of the methodology used are given in the online supplement.
Respiratory evaluations
Fractional exhaled nitric oxide (FeNO) (Bedfont NObreath) levels were measured before baseline spirometry. A portable spirometer (Easy on-PC; New Diagnostic Design Medical Technologies) was used to measure FEV1, mean forced expiratory flow between 25% and 75% of the FVC, and FVC, and repeated after administering a bronchodilator (400 mcg salbutamol via a spacer). Spirometry data were converted to z-scores adjusted for height, age, sex, and ethnicity (2, 13). Functional exercise capacity was assessed using a standardized incremental shuttle walk test (3, 14).
Cardiovascular evaluations
Seated and supine blood pressure was measured using an oscillometric sphygmomanometer (Omron 705 CP; Omron Corp.). Radial artery waveforms recorded using a high-fidelity tonometer were transformed into a corresponding central (ascending aortic) waveform using pulse wave analysis and a generalized transfer function (SphygmoCor; AtCor Medical). This allowed identification of the first and second systolic pressure peaks, corresponding to the systolic pressure resulting from ventricular ejection and that resulting from return of the reflected pressure wave to the ascending aorta, respectively. The central systolic blood pressure (SBP; the overall peak systolic blood pressure), pulse pressure, and heart rate were then determined. The central augmentation pressure (AP) was calculated as the difference between the second and first systolic peaks, and Aix was calculated as the AP expressed as percentage of the central pulse pressure, whereas nonaugmented systolic pressure corresponded to the first systolic peak of the central waveform, thus indicating the influence of cardiac ejection characteristics on systolic pressure in the ascending aorta.
Aortic pulse wave velocity was calculated from recordings at the carotid and femoral arteries, using the same device. AIx data were converted to z-scores adjusted for age, height, mean arterial pressure, and heart rate (15). and stroke volume were measured using a noninvasive bioreactance technique (NICOM; Cheetah Medical) that has been validated against invasive gold standard techniques (16).
Anthropometry and physical examination
Height without footwear and weight were measured using standardized equipment.
Biological
Fasting blood and urine samples were processed at an on-site pathology laboratory to measure serum CRP (C-reactive protein) and creatinine, and urine albumin:creatinine ratio using a standard, automated laboratory analyzer, with calculation of estimated glomerular filtration rate (eGFR) using the four-variable Modification of Diet in Renal Disease study equation. Plasma desmosine levels as a marker of elastin turnover were measured from stored frozen samples using liquid chromatography with mass spectrometry (4, 17).
Data Management and Statistical Analysis
Data were encoded for computer analysis using double entry and checked for outliers before combination with the main study dataset for analysis. Electronic data from SphygmoCor, NICOM and Easy on-PC were extracted and merged with the database to avoid transcription errors. Data were verified for accuracy and analyzed using Stata SE, version 15.1 (Stata Corp).
Mean values and SDs of parameters were calculated and unadjusted/adjusted mean differences with 95% confidence intervals (CIs) using linear regression models were reported for the EP and control groups and for EP participants with and without BPD. Trajectories of lung and cardiovascular function from childhood to early adulthood were investigated using multilevel modeling, treating the data as having a hierarchical structure with observations at each time point nested within each individual. This allows adjustment for missing values where individuals were not assessed.
The study was approved by the South Central Hampshire Health Research Authority Committee (UK). Written informed consent was obtained from study participants, or in the case of those with severe learning difficulties, assent was provided by appointed consultees, according to the UK Mental Capacity Act 2005.
Results
Of 306 EP subjects known to be alive at 19 years, 129 attended for evaluation, 59% of those evaluated at 11 years of age (see Table E1 in online supplement). Those assessed were representative of the whole cohort, with similar distributions of gestational age (mean, 24.9 wk) and birthweight (mean, 741 g) but with lower birthweight for gestation (mean z-score, −0.21) compared with the whole cohort (24.9 wk, 747 g, and −0.18, respectively). Similar proportions were receiving oxygen at 36 weeks postmenstrual age (72% vs. 74%) and had received steroids for weaning from neonatal ventilation (76% vs. 73%). Compared with the cohort evaluated at 11 years, participants assessed at 19 years of age had lower birthweight for gestation but similar distributions of gestational age and proportions receiving oxygen at 36 weeks postmenstrual age and postnatal steroids (Table E1). Participants aged 19 also had similar distributions of baseline and post-bronchodilator FEV1 z-scores, blood pressure, and adjusted AIx at 11 years, but had a slightly higher proportion with a diagnosis of asthma at 11 years (29% vs. 25%).
Of the 129 EP participants, 127 completed the cardiovascular and 123 the respiratory protocol. One hundred eleven consented to venesection. Of the control group, 65/153 control subjects seen at 11 years attended for evaluation, 64 completed the cardiorespiratory evaluation, and 61 consented to venesection.
Respiratory Outcomes at 19 Years
Compared with the control group, the EP group was significantly impaired on all spirometric parameters (Table 1). The difference in mean post-bronchodilator FVC z-score between EP and control subjects was −0.64 SD (95% CI, −0.94 to −0.35), equivalent to 470 ml, and the mean difference in FEV1 z-scores was −1.08 SD (95% CI, −1.40 to −0.77), equivalent to 600 ml. Bronchodilator reversibility (defined as a >12% change in FEV1) was more common in the EP group (26.5%) than in the control group (6.3%; odds ratio, 5.39 [95% CI, 1.81–16.04]), but the EP group were not significantly more likely to have had a formal clinical diagnosis (18) of asthma 41% versus 34% (made by the participant’s usual clinician, and as reported by the participant). Nineteen percent of the EP group had irreversible airflow obstruction (FEV1/VC < lower limit of normal) at age 19, the same proportion observed at age 11. The EP group had significantly lower FeNO concentrations than the control group (13.9 vs. 24.4 ppb; P < 0.001), and significantly more control participants had a FeNO concentration above the threshold of 40 ppb (19). In multivariable analysis controlling for height, a clinical diagnosis of asthma, and the presence of bronchodilator reversibility, EP status remained associated with significantly lower FeNO (adjusted difference in means = −10.3 [95% CI −15.9 to −4.7; P < 0.001]).
Table 1.
Respiratory Evaluations in Extremely Preterm Participants and Full-Term Control Subjects at 19 Years of Age
| All EP (n = 123) | Control Subjects (n = 64) | EP with BPD (n = 87) | EP with No BPD (n = 36) | EP vs. Control Subjects [Difference in Means (95% CI)] | BPD vs. No BPD [Difference in Means (95% CI)] | ||
|---|---|---|---|---|---|---|---|
| Prebronchodilator | |||||||
| FEV1, L | 2.87 ± 0.72 (1.29 to 4.66) | 3.56 ± 0.65 (2.30 to 5.29) | 2.77 ± 0.69 (1.29 to 4.35) | 3.10 ± 0.73 (1.56 to 4.66) |
−0.69 (−0.90 to −0.48)* | −0.33 (−0.60 to −0.06)† | |
| FEV1z-score | −1.61 ± 1.17 (−5.06 to 0.68) | −0.29 ± 0.89 (−2.24 to 1.92) | −1.83 ± 1.17 (−5.06 to 0.68) | −1.05 ± 0.99 (−3.87 to 0.26) |
−1.31 (−1.64 to −0.98)* | −0.78 (−1.19 to −0.37)† | |
| FVC, L | 3.71 ± 0.89 (1.31 to 6.09) | 4.25 ± 0.87 (2.35 to 6.09) | 3.68 ± 0.87 (1.31 to 5.55) | 3.79 ± 0.93 (2.20 to 6.09) |
−0.53 (−0.80 to −0.27)* | −0.11 (−0.45 to 0.24) | |
| FVC z-score | −0.76 ± 1.06 (−4.45 to 1.59) | −0.00 ± 0.93 (−2.24 to 1.82) | −0.84 ± 1.07 (−4.45 to 1.59) | −0.59 ± 1.02 (−2.84 to 0.87) |
−0.76 (−1.07 to −0.45)* | −0.24 (−0.64 to 0.15) | |
| FEV1/FVC% | 0.78 ± 0.10 (0.52 to 1.00) | 0.85 ± 0.08 (0.60 to 0.99) | 0.76 ± 0.10 (0.52 to 1.00) | 0.82 ± 0.08 (0.65 to 1.00) |
−0.07 (−0.10 to −0.04)* | −0.07 (−0.10 to −0.03)* | |
| FEV1/FVC z-score | −1.33 ± 1.24 (−3.95 to 2.28) | −0.42 ± 1.13 (−3.06 to 2.21) | −1.57 ± 1.21 (−3.95 to 2.28) | −0.75 ± 1.14 (−2.62 to 2.18) |
−0.91 (−1.28 to −0.55)* | −0.83 (−1.29 to −0.37)* | |
| FEF25–75, L/min | 2.62 ± 1.03 (0.58 to 6.71) | 3.88 ± 1.09 (1.56 to 6.95) | 2.41 ± 0.97 (0.58 to 6.71) | 3.14 ± 0.98 (1.18 to 6.01) |
−1.26 (−1.58 to −0.94)* | −0.73 (−1.13 to −0.33)* | |
| FEF25–75z-score | −1.86 ± 1.22 (−5.21 to 1.75) | −0.44 ± 1.11 (−2.64 to 2.08) | −2.14 ± 1.19 (−5.21 to 1.75) | −1.17 ± 1.02 (−3.66 to 0.91) |
−1.41 (−1.77 to −1.05)* | −0.97 (−1.41 to −0.53)* | |
| Post-bronchodilator | |||||||
| Oxygen saturation, % | 97.49 ± 1.23 (93.00 to 100.00) (n = 120) | 97.80 ± 1.16 (94.00 to 100.00) (n = 64) | 97.45 ± 1.36 (93.00 to 100.00) (n = 86) | 97.59 ± 0.82 (96.00 to 99.00) (n = 34) |
−0.31 (−0.67 to 0.06) | −0.13 (−0.62 to 0.35) | |
| Post-FEV1, L | 3.12 ± 0.70 (1.47 to 4.90) (n = 121) | 3.71 ± 0.73 (2.36 to 5.58) (n = 64) | 3.04 ± 0.68 (1.47 to 4.63) (n = 86) | 3.32 ± 0.70 (1.93 to 4.90) (n = 35) |
−0.60 (−0.81 to −0.38)* | −0.28 (−0.56 to 0.00)† | |
| Post-FEV1z-score | −1.04 ± 1.08 (−4.29 to 1.13) (n = 121) | 0.05 ± 0.90 (−2.08 to 2.37) (n = 64) | −1.23 ± 1.12 (−4.29 to 0.94) (n = 86) | −0.54 ± 0.98 (−2.72 to 0.88) (n = 35) |
−1.08 (−1.40 to −0.77)* | −0.66 (−1.06 to −0.27)‡ | |
| Percentage change in FEV1 | 8.83 ± 7.98 (−7.40 to 35.52) (n = 121) | 4.34 ± 5.59 (−7.38 to 20.38) (n = 64) | 9.60 ± 7.50 (−6.47 to 35.52) (n = 86) | 6.93 ± 8.87 (−7.40 to 35.19) (n = 35) |
4.49 (2.28 to 6.69)* | 2.66 (−0.19 to 5.51) | |
| Change in FEV1 > 12% | 32/121 (26.5%) | 4/64 (6.3%) | 28/86 (32.6%) | 4/35 (11.4%) |
5.39 (1.81 to 16.04)‡§ | 3.74 (1.20 to 11.64)†§ | |
| Post-FVC, L | 3.76 ± 0.85 (2.00 to 6.19) (n = 121) | 4.23 ± 0.90 (2.37 to 6.14) (n = 64) | 3.74 ± 0.82 (2.00 to 5.39) (n = 86) | 3.83 ± 0.93 (2.26 to 6.19) (n = 35) |
−0.47 (−0.73 to −0.21)* | −0.09 (−0.43 to 0.25) | |
| Post-FVC z-score | −0.68 ± 0.96 (−3.52 to 1.48) (n = 121) | −0.04 ± 0.98 (−2.30 to 2.16) (n = 64) | −0.74 ± 0.94 (−3.52 to 1.48) (n = 86) | −0.54 ± 0.98 (−2.72 to 0.88) (n = 35) |
−0.64 (−0.94 to −0.35)* | −0.19 (−0.58 to 0.19) | |
| Post-FEV1/FVC | 0.83 ± 0.09 (0.54 to 1.00) (n = 121) | 0.88 ± 0.07 (0.67 to 1.00) (n = 64) | 0.82 ± 0.10 (0.54 to 1.00) (n = 86) | 0.87 ± 0.07 (0.69 to 1.00) (n = 35) |
−0.05 (−0.08 to −0.02)* | −0.06 (−0.09 to −0.02)* | |
| Post-FEV1/FVC z-score | −0.56 ± 1.27 (−4.27 to 2.37) (n = 121) | 0.15 ± 1.06 (−2.56 to 2.27) (n = 64) | −0.79 ± 1.29 (−4.27 to 2.37) (n = 86) | −0.00 ± 1.03 (−2.24 to 2.15) (n = 35) |
−0.71 (−1.08 to −0.35)* | −0.79 (−1.25 to −0.33)* | |
| Post–FEF25–75, L/min | 3.29 ± 1.12 (0.73 to 7.19) (n = 121) | 4.47 ± 1.18 (2.06 to 7.22) (n = 64) | 3.10 ± 1.14 (0.73 to 7.19) (n = 86) | 3.76 ± 0.94 (1.48 to 6.73) (n = 35) |
−1.17 (−1.52 to −0.83)* | −0.66 (−1.10 to −0.22)‡ | |
| Post–FEF25–75z-score | −1.03 ± 1.23 (−4.58 to 2.07) (n = 121) | 0.16 ± 1.06 (−2.33 to 2.54) (n = 64) | −1.28 ± 1.28 (−4.58 to 2.07) (n = 86) | −0.44 ± 0.85 (−2.55 to 1.46) (n = 35) |
−1.19 (−1.55 to −0.84)* | −0.84 (−1.29 to −0.39)* | |
| FeNO | |||||||
| FeNO, ppb | 13.9 ± 11.1 (0.0 to 56.7) (n = 117) | 24.4 ± 24.7 (0.0 to 133.7) (n = 62) | 13.4 ± 10.0 (0.0 to 51.3) (n = 83) | 15.2 ± 13.5 (0.0 to 56.7) (n = 34) |
−10.47 (−15.77 to −5.18)* | −1.77 (−8.64 to 5.10) | |
| FeNO > 40 ppb | 6/117 (5.1%) | 9/62 (14.5%) | 3/83 (3.6%) | 3/34 (8.8%) |
0.32 (0.11 to 0.94)†§ | 0.39 (0.07 to 2.02)§ | |
| Clinical symptoms (self-report questionnaire) | |||||||
| Asthma diagnosis ever | 50/121 (41.3%) | 21/61 (34.3%) | 43/87 (49.4%) | 7/34 (20.6%) |
1.34 (0.71 to 2.54)§ | 3.80 (1.49 to 9.57)‡§ | |
| Symptoms in the last year | 24/121 (19.8%) | 17/62 (27.4%) | 19/87 (21.8%) | 5/34 (14.7%) |
0.65 (0.32 to 1.34)§ | 1.62 (0.55 to 4.76)§ | |
| Wheeze during or after exercise | 32/121 (26.5%) | 19/61 (31.2%) | 25/87 (28.7%) | 7/34 (20.6%) |
0.79 (0.40 to 1.56)§ | 1.56 (0.60 to 4.03)§ | |
| Treated in the last year for respiratory or chest problems | 16/121 (13.2%) | 12/60 (20.0%) | 13/87 (14.9%) | 3/34 (8.8%) |
0.61 (0.27 to 1.39)§ | 1.82 (0.48 to 6.82)§ | |
| Currently using inhalers | 28/126 (22.2%) | 11/64 (17.2%) | 24/90 (26.7%) | 4/36 (11.1%) |
1.38 (0.64 to 2.98)§ | 2.91 (0.93 to 9.09)§ | |
| Hospital admission for “breathing difficulties” (last 12 m) | 1/119 (0.8%) | 1/62 (1.6%) | 1/87 (1.2%) | 0/32 (0.0%) | 0.52 (0.03 to 8.41)§ | — | |
Definition of abbreviations: BPD = bronchopulmonary dysplasia; CI = confidence interval; EP = extremely preterm; FEF25–75 = mean forced expiratory flow between 25% and 75% of the FVC; FeNO = fractional exhaled nitric oxide.
Data are shown as mean ± SD (range) or n (%).
P < 0.001.
P < 0.05.
P < 0.01.
The odds ratio (95% CI) was reported for categorical variables.
There was no difference in post-bronchodilator FVC between the EP group with and without BPD, but the mean difference in FEV1 z-scores was −0.66 SD (95% CI, −1.06 to −0.27), equivalent to 280 ml (Figure 1A). Bronchodilator reversibility in those with neonatal BPD (33%) was more common than in those without (11%; P < 0.05; Figure 1B). A prior clinical diagnosis of asthma was more common in the EP group with neonatal BPD compared with those without (odds ratio, 3.80 [95% CI, 1.49–9.57]), but there was no difference in FeNO between these two groups.
Figure 1.

(Left panel) FEV1 z-score before and (right panel) percent change after bronchodilator in term-born control subjects and extremely preterm (EP) participants (with and without neonatal bronchopulmonary dysplasia [BPD]) at 19 years of age.
Blood Pressure and Hemodynamic Parameters at 19 Years
Although there were no significant differences in peripheral blood pressure between the EP and control groups (Table 2), calculated central blood pressure was significantly higher among EP participants by 4.5 mm Hg (systolic) and 3.6 mm Hg (diastolic). did not differ significantly between groups but stroke volume was significantly lower in the EP group, allied to a higher heart rate, even after adjusting for differences in body size.
Table 2.
Blood Pressure and Vascular Evaluations in Extremely Preterm Participants and Full-Term Control Subjects at 19 Years of Age
| All EP (n = 127) [Mean ± SD (Range)] | Control Subjects (n = 64) [Mean ± SD (Range)] | EP with BPD (n = 91) [Mean ± SD (Range)] | EP with No BPD (n = 36) [Mean ± SD (Range)] | EP – C: Unadjusted [Difference in Means (95% CI)] | EP – C: Adjusted* [Difference in Means (95% CI)] | |
|---|---|---|---|---|---|---|
| Seated brachial BP | ||||||
| SBP, mm Hg | 119.5 ± 10.1 (93.7 to 149.0) | 117.9 ± 9.8 (99.3 to 152.3) | 119.3 ± 10.1 (93.7 to 140.7) | 120.0 ± 10.4 (99.0 to 149.0) | 1.6 (−1.4 to 4.6) | 0.7 (−1.9 to 3.4) |
| DBP, mm Hg | 73.2 ± 7.9 (54.7 to 97.7) | 71.6 ± 6.0 (58.0 to 93.7) | 73.7 ± 8.3 (54.7 to 97.7) | 72.1 ± 6.6 (54.7 to 90.7) | 1.6 (−0.6 to 3.8) | 1.6 (−0.6 to 3.8) |
| Supine brachial BP | ||||||
| SBP, mm Hg | 119.1 ± 10.0 (94.3 to 148.3) | 116.1 ± 10.0 (95.7 to 149.0) | 119.4 ± 10.3 (94.3 to 142.3) | 118.4 ± 9.4 (102.3 to 148.3) | 3.0 (0.0 to 6.1)† | 2.0 (−0.5 to 4.5) |
| DBP, mm Hg | 69.4 ± 7.4 (52.0 to 93.3) | 65.9 ± 5.8 (54.0 to 84.0) | 69.9 ± 7.6 (55.0 to 90.3) | 68.2 ± 7.0 (52.0 to 93.3) | 3.5 (1.4 to 5.6)‡ | 3.5 (1.4 to 5.6)‡ |
| Pulse pressure, mm Hg | 49.7 ± 8.9 (29.3 to 78.7) | 50.2 ± 9.3 (36.0 to 80.0) | 49.6 ± 8.9 (29.3 to 78.7) | 50.2 ± 9.0 (32.3 to 72.3) | −0.4 (−3.2 to 2.3) | −1.5 (−3.6 to 0.6) |
| Central BP | ||||||
| SBP§, mm Hg | 101.2 ± 8.0 (81.0 to 125.3) | 96.7 ± 7.8 (78.0 to 126.3) | 101.8 ± 8.4 (81.0 to 120.7) | 99.8 ± 6.8 (87.7 to 125.3) | 4.5 (2.1 to 6.9)‖ | 3.9 (1.7 to 6.1)‖ |
| Nonaugmented SBP§, mm Hg | 99.0 ± 8.0 (79.3 to 124.0) | 96.5 ± 7.5 (79.7 to 122.0) | 99.5 ± 8.2 (79.3 to 120.7) | 97.9 ± 7.4 (85.0 to 124.0) | 2.5 (0.2 to 4.9)† | 1.9 (−0.2 to 4.0) |
| Pulse pressure§, mm Hg | 30.6 ± 6.3 (15.0 to 53.3) | 29.7 ± 5.9 (21.0 to 50.0) | 30.6 ± 6.4 (15.0 to 53.3) | 30.7 ± 6.3 (17.0 to 49.3) | 0.9 (−1.0 to 2.7) | 0.2 (−1.3 to 1.7) |
| Mean arterial BP§, mm Hg | 84.9 ± 7.5 (69.3 to 109.3) | 80.8 ± 6.5 (66.0 to 105.3) | 85.4 ± 7.8 (69.3 to 107.0) | 83.5 ± 6.6 (70.0 to 109.3) | 4.1 (1.9 to 6.2)‖ | 3.9 (1.7 to 6.1)‖ |
| Heart rate§, bpm | 71.2 ± 12.0 (44.3 to 102.0) | 66.8 ± 8.7 (47.7 to 92.3) | 72.1 ± 12.3 (49.2 to 102.0) | 68.9 ± 11.0 (44.3 to 89.8) | 4.4 (1.1 to 7.7)§ | 4.9 (1.7 to 8.1)‡ |
| Hemodynamic measures | ||||||
| Aortic augmentation pressure§, mm Hg | 2.2 ± 3.1 (−5.0 to 11.0) | 0.2 ± 2.5 (−4.7 to 5.0) | 2.3 ± 3.1 (−3.3 to 11.0) | 1.9 ± 2.9 (−5.0 to 9.7) | 2.0 (1.1 to 2.9)‖ | 2.0 (1.2 to 2.8)‖ |
| Aortic augmentation index§, % | 6.6 ± 9.0 (−14.0 to 28.7) | 0.4 ± 8.2 (−14.0 to 20.3) | 6.9 ± 9.3 (−11.3 to 28.7) | 6.0 ± 8.2 (−14.0 to 24.7) | 6.2 (3.5 to 8.8)‖ | 6.0 (3.5 to 8.5)‖ |
| Aortic pulse wave velocity§, m/s | 5.1 ± 0.7 (3.1 to 7.6) | 4.9 ± 0.5 (4.1 to 6.8) | 5.2 ± 0.6 (3.8 to 6.5) | 4.9 ± 0.7 (3.1 to 7.6) | 0.2 (−0.0 to 0.3) | −0.0 (−0.2 to 0.1) |
| , L/min | 7.3 ± 1.7 (3.4 to 19.2) | 7.7 ± 1.6 (3.7 to 11.1) | 7.5 ± 1.8 (3.4 to 19.2) | 6.9 ± 1.3 (3.9 to 9.5) | −0.4 (−0.9 to 0.1) | −0.5 (−1.0 to −0.0)† |
| Cardiac index§, L/min/m2 | 4.4 ± 0.9 (2.2 to 12.0) | 4.3 ± 0.7 (2.4 to 5.3) | 4.4 ± 1.0 (2.5 to 12.0) | 4.2 ± 0.7 (2.2 to 5.4) | 0.0 (−0.2 to 0.3) | 0.0 (−0.2 to 0.3) |
| Stroke volume, ml | 99.9 ± 23.1 (46.5 to 173.4) | 113.6 ± 25.8 (52.0 to 170.6) | 100.4 ± 23.8 (53.6 to 173.4) | 98.8 ± 21.4 (46.5 to 146.9) | −13.7 (−20.9 to −6.4)‖ | −15.3 (−22.1 to −8.6)‖ |
| Stroke volume index§, ml/m2 | 59.4 ± 10.4 (32.6 to 85.1) | 63.4 ± 11.4 (341.6 to 858.6) | 59.2 ± 10.5 (37.6 to 85.1) | 59.8 ± 10.5 (32.6 to 78.4) | −4.0 (−7.3 to −0.7)† | −4.3 (−7.6 to −1.1)‡ |
| Total peripheral resistance§, dyne/s/cm−5 | 972.0 ± 234.4 (339.9 to 2,153.8) | 875.5 ± 222.7 (518.1 to 1,773.0) | 956.2 ± 224.9 (339.9 to 2,153.8) | 1,011.3 ± 255.7 (679.4 to 1,786.7) | 96.4 (26.6 to 166.2)‡ | 100.6 (30.8 to 170.5)‡ |
Definition of abbreviations: BP = blood pressure; BPD = neonatal bronchopulmonary dysplasia; bpm = beats per minute; C = control subjects; CI = confidence interval; DBP = diastolic blood pressure; EP = extremely preterm; SBP = systolic blood pressure.
Adjusted BP parameters, , cardiac index, stroke volume, stroke volume index, and total peripheral resistance for sex; adjusted aortic augmentation pressure and aortic augmentation index for sex, heart rate, height, and mean arterial pressure; and adjusted aortic pulse wave velocity for sex and mean arterial pressure.
P < 0.05.
P < 0.01.
EP with BPD: n = 90; EP: n = 126.
P < 0.001.
Total peripheral vascular resistance was significantly higher in the EP group (difference in means = 96.4 [95% CI, 26.6–166.2] dyne/s/cm−5). Aortic AP was on average 2.0 mm Hg higher and AIx was 6% higher in the EP group, being of an order similar to that found at 11 years (4.9% [95% CI, 2.0–7.8]).
In contrast to the respiratory findings, there were no consistent differences in cardiovascular measures between the EP subjects who did and did not have neonatal BPD.
Relationships between Cardiovascular and Respiratory Parameters at 19 Years
In multiple regression analysis, aortic AIx was significantly associated with EP and BPD status but not independently with FEV1 or FVC (Table 3). AIx was also significantly lower among EP participants with bronchodilator reversibility (mean AIx = 2.8% [SD = 10.4]) compared with those without reversibility (7.9% [8.2], P = 0.004; difference in means after adjustment for covariates = −6.0% [95% CI, −9.8 to −2.1]; P = 0.003).
Table 3.
Multiple Regression with the Aortic Augmentation Index as the Dependent Variable (All Participants, N = 174)
| Aortic AIx, Model 1 |
Aortic AIx, Model 2 |
|||
|---|---|---|---|---|
| B (95% CI) | P Value | B (95% CI) | P Value | |
| Post-bronchodilator FEV1 | ||||
| FEV1 | 0.40 (−2.54 to 3.33) | 0.790 | 0.69 (−1.90 to 3.29) | 0.599 |
| EP without BPD (ref., control group) | 5.66 (1.68 to 9.64) | 0.006 | 5.69 (2.16 to 9.21) | 0.002 |
| EP with BPD (ref., control group) | 6.31 (2.64 to 9.98) | 0.001 | 7.4 (4.08 to 10.72) | <0.001 |
| Heart rate, bpm | — | — | −0.41 (−0.53 to −0.29) | <0.001 |
| MAP, mm Hg | — | — | 0.29 (0.11 to 0.48) | 0.002 |
| Post-bronchodilator FVC | ||||
| FVC | −0.10 (−2.67 to 2.47) | 0.939 | −0.12 (−2.41 to 2.18) | 0.921 |
| EP without BPD (ref., control group) | 5.51 (1.57 to 9.45) | 0.006 | 5.43 (1.93 to 8.93) | 0.003 |
| EP with BPD (ref., control group) | 6.02 (2.67 to 9.37) | 0.001 | 6.92 (3.85 to 9.98) | <0.001 |
| Heart rate, bpm | — | — | −0.41 (−0.53 to −0.29) | <0.001 |
| MAP, mm Hg | — | — | 0.29 (0.11 to 0.48) | 0.002 |
| Bronchodilator reversibility (>12% change in FEV1) |
||||
| Reversible FEV1 | −5.58 (−8.96 to −2.20) | 0.001 | −4.56 (−7.58 to −1.54) | 0.003 |
| EP without BPD (ref., control group) | 5.48 (1.73 to 9.23) | 0.004 | 5.42 (2.08 to 8.76) | 0.002 |
| EP with BPD (ref., control group) | 7.29 (4.12 to 10.47) | <0.001 | 7.93 (5.04 to 10.83) | <0.001 |
| Heart rate, bpm | — | — | −0.39 (−0.51 to −0.27) | <0.001 |
| MAP, mm Hg | — | — | 0.28 (0.10 to 0.46) | 0.002 |
Definition of abbreviations: AIx = augmentation index; B = effect size; BPD = neonatal bronchopulmonary dysplasia; bpm = beats per minute; CI = confidence interval; EP = extremely preterm; MAP = mean arterial pressure; ref. = reference to control group.
Variables entered in model 1: group variable (EP with BPD, EP without BPD, and control subjects), age at testing (years), height (cm), weight (kg), sex, ethnicity, regular exposure to smoking, and maternal smoking during pregnancy. Model 2 was further adjusted for MAP (mm Hg) and heart rate (bpm).
Trajectory between 11 and 19 Years
Post-bronchodilator FEV1
Changes in mean (SEM) FEV1 z-scores are illustrated in Figure 2A. The data show a slight fall in measured values across all groups but no evidence of “catch up” by EP participants. Multilevel modeling indicated that, on average, at 19 years the FEV1 z-scores of EP participants with and without BPD were 1.71 SD (95% CI, −1.95 to −1.47; P < 0.001) and 0.92 SD (95% CI, −1.23 to −0.60; P < 0.001), respectively, below those of the term-born control subjects.
Figure 2.
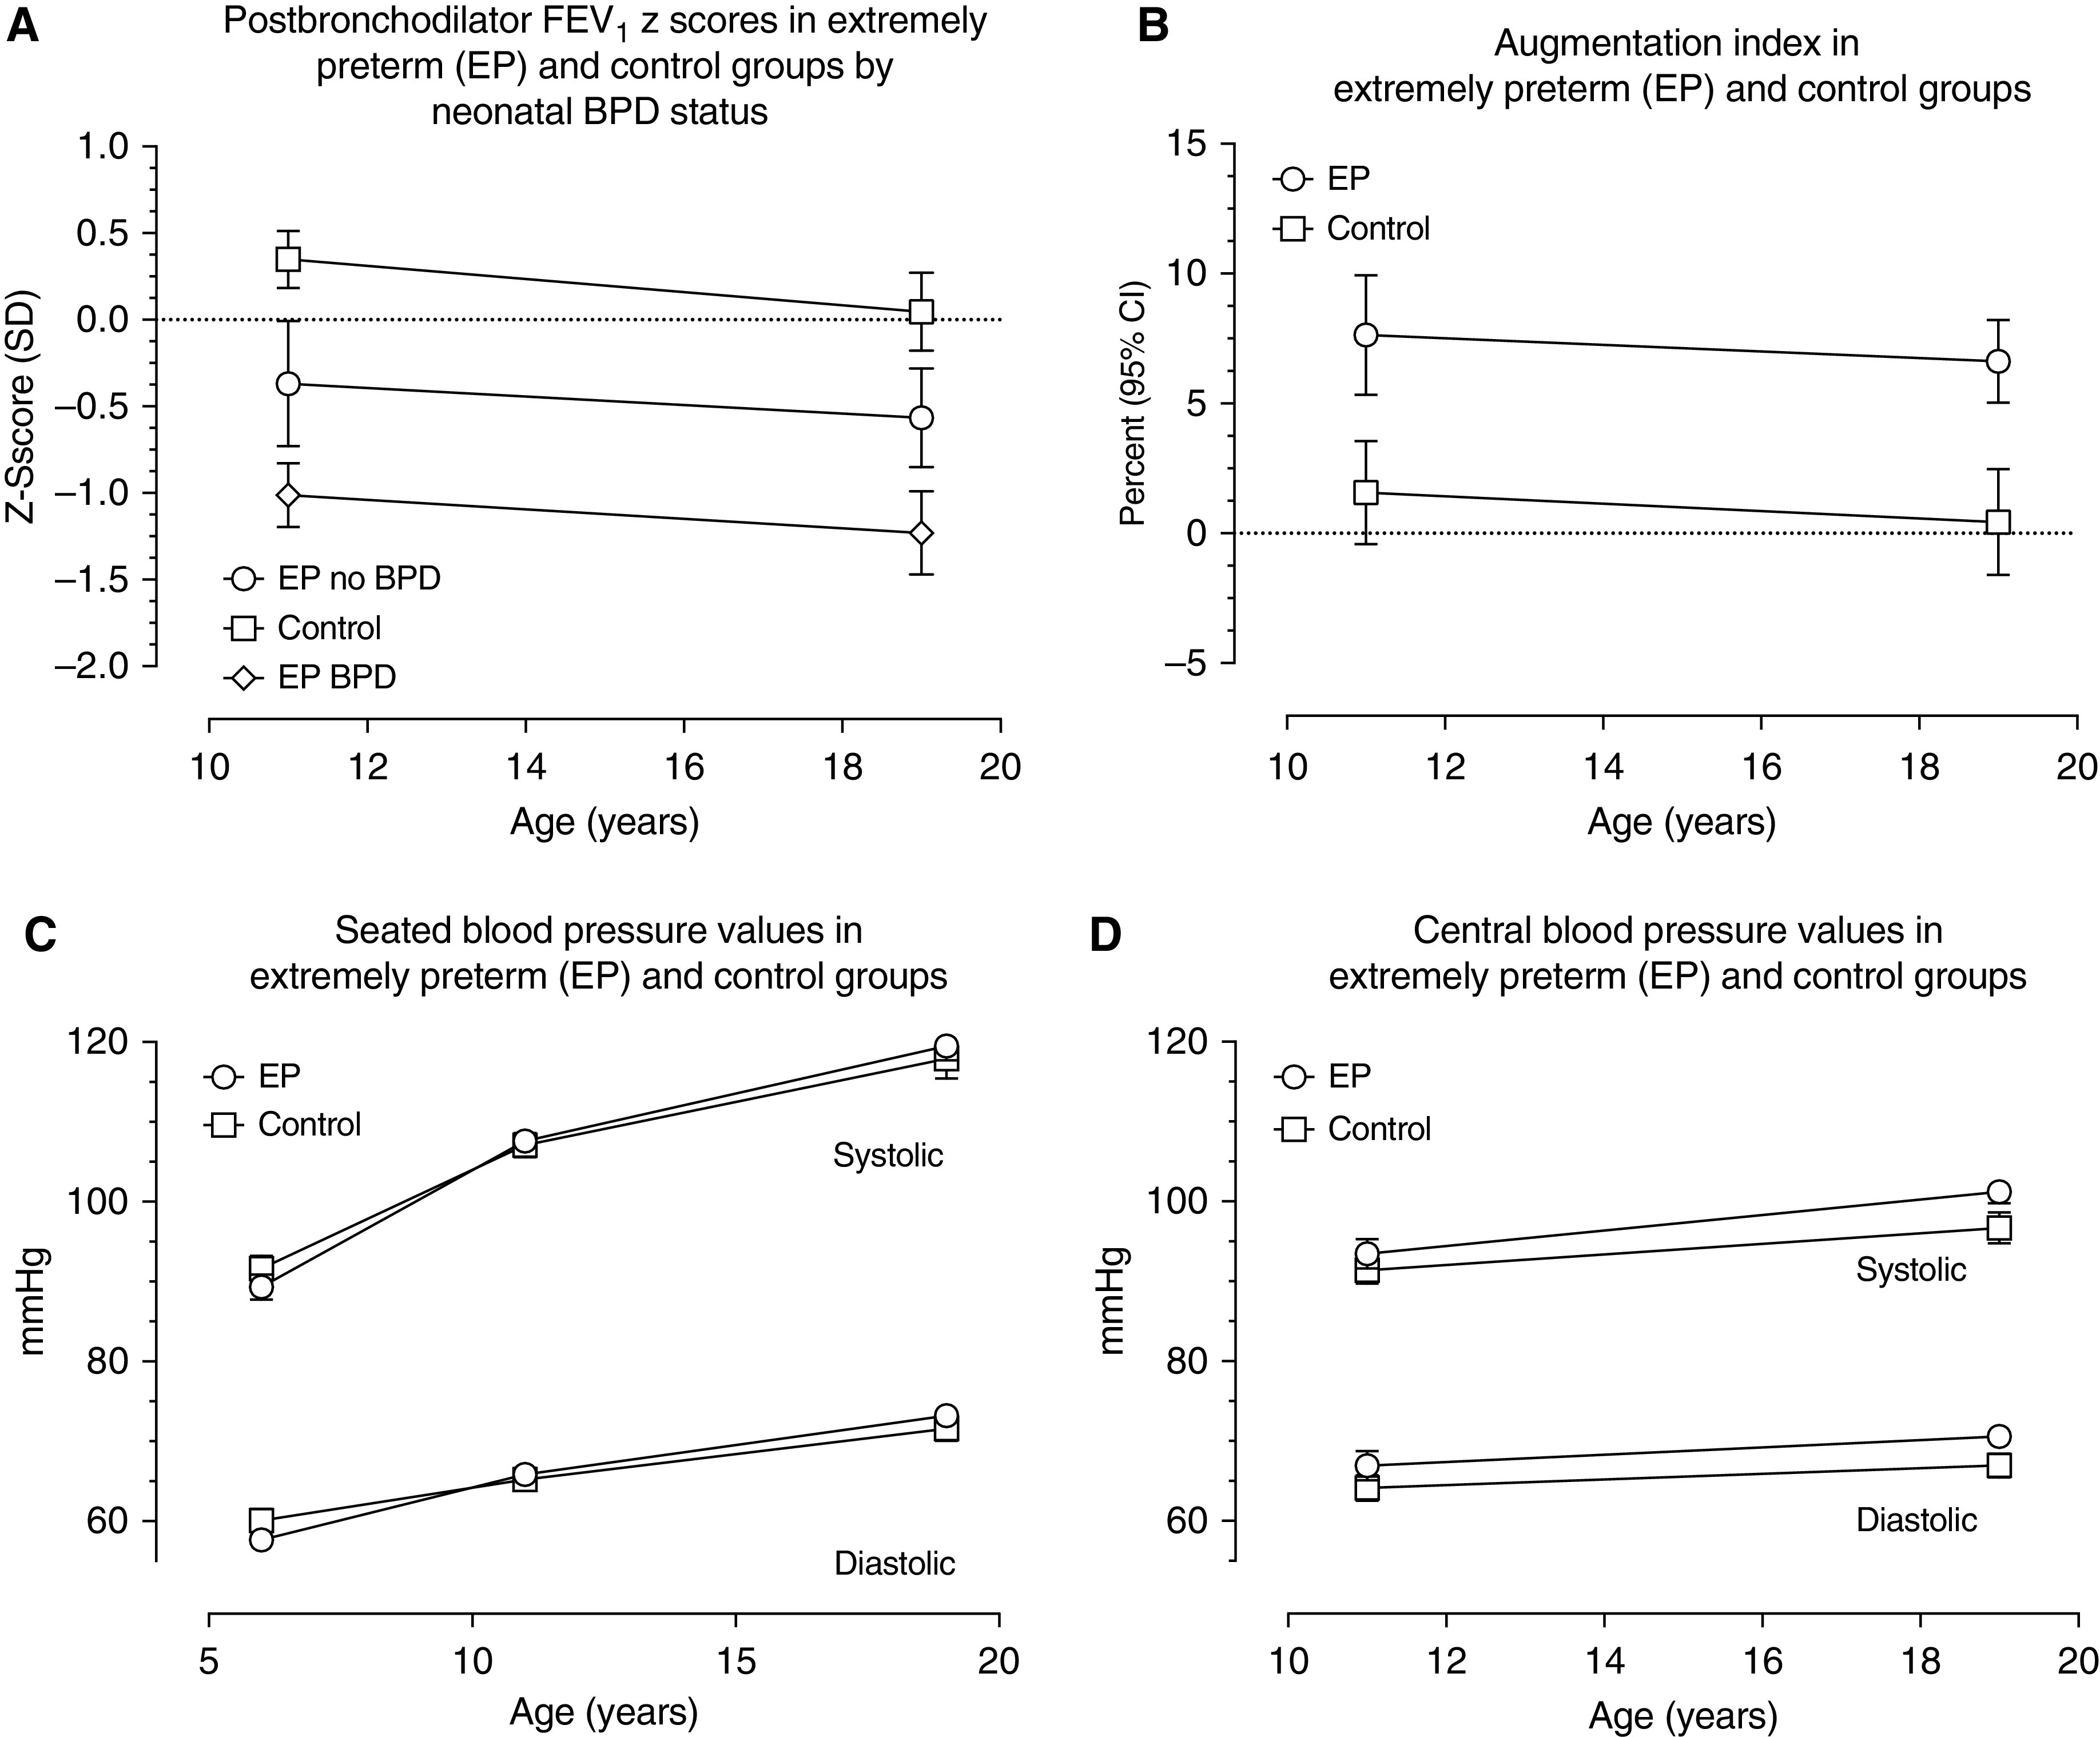
Trajectory of FEV1 and cardiovascular parameters in term-born control subjects and extremely preterm (EP) participants (with and without neonatal bronchopulmonary dysplasia [BPD]) throughout adolescence to 19 years of age. (A) Change in post-bronchodilator FEV1 between 11 and 19 years. (B) Change in augmentation index between 11 and 19 years. (C) Seated blood pressure values at 6, 11, and 19 years. (D) Central blood pressure changes between 11 and 19 years. CI = confidence interval.
Blood pressure and hemodynamic parameters
Observed mean AIx values declined across adolescence in both EP children and control subjects. Multilevel modeling indicated that these trajectories did not differ significantly and that overall the decline over time was not statistically significant (95% CI, −0.42 to 0.02; P = 0.07; Figure 2B). In contrast, seated brachial SBP and DBP rose over time (Figure 2C), as did calculated central pressures (Figure 2D). Multilevel modeling indicated that trajectories were similar in both groups: an average of 2.26 mm Hg increase per year for seated SBP (95% CI, 2.12–2.39), 1.09 mm Hg for seated DBP (95% CI, 0.97–1.20), 0.84 mm Hg for central SBP (95% CI, 0.64–1.03), and 0.41 mm Hg for central DBP (95% CI, 0.23–0.59). The observed difference in mean central SBP and DBP between EP children and control subjects increased between 11 and 19 years, but estimates from multilevel modeling showed that the differences in means between the two groups remained constant from 11 to 19 years (SBP = 3.34 mm Hg [95% CI, 1.53–5.15; P < 0.001] and DBP = 3.21 mm Hg [95% CI, 1.56–4.87; P < 0.001]).
Circulating biomarkers
Desmosine and creatinine concentrations were significantly higher in the EP group than in the control group (Table E2), but there were no differences within the EP group by BPD status. There were no significant relationships between desmosine and FEV1 z-score, or aortic or radial AIx. Although there was no difference in the mean eGFR or albumin:creatinine ratio between the groups, in multiple regression, aortic AIx was associated with both eGFR (P < 0.007) and EP status (with BPD: P < 0.001; without BPD: P = 0.005), and aortic pulse wave velocity was associated with eGFR (P = 0.007; Table E3).
Functional capacity
A clinically and statistically significant lower shuttle walk distance was observed in the EP group compared with the control group (899 m [SD = 305] vs. 1,132 m [303], P < 0.05), and in the EP group with BPD compared with the EP group without BPD (862 m [304] vs. 991 m [290], P < 0.05; Table E4).
Discussion
In this study, in subjects 19 years of age, respiratory function after birth before 26 weeks of gestation was characterized by clinically significant impairment of lung function across a range of spirometric parameters, before and after bronchodilator, and associated with a reduction in exercise capacity. The lung function deficits were of a similar magnitude to those seen at 11 years and there was no evidence of catch-up growth over adolescence. Indeed, data from the same cohort at 6 years had already identified deficits in peak expiratory flow rates compared with control subjects of 1.2 SD (95% CI, 1.4–0.8) for individuals with neonatal BPD and of 0.7 SD (95% CI, 1.0–0.3) for those without (12). There was no evidence of ongoing steroid-sensitive inflammation in the lung as assessed by FeNO, but desmosine concentration—a marker of elastin turnover—was elevated in the EP group. The EP group had elevated markers of cardiovascular risk compared the control group, including higher blood and APs. We believe that these differences are significant—for example, the AIx differences equate to 10–15 years of arterial age (5).
Our data argue against catch-up lung growth in the EP group. A systematic review conducted to 2010 concluded that adult EP survivors with neonatal BPD had more respiratory symptoms and pulmonary function abnormalities than control subjects and that this was associated with both radiologic structural changes and the suggestion of impairment in exercise capacity (20). Some studies have reported catch-up growth, postulating neoalveolarization throughout childhood and adolescence (21), whereas others have detected accelerated decline (22); still others show stable differences from control subjects (9). These differences may reflect different populations by birth weight and gestational age, improvements in neonatal treatment (“old” vs. “new” BPD), different follow-up ages and methods of testing, generally small sample sizes, and the varying nature of control groups, all of which create a complex picture (23). We have used the same techniques and standards to assess z-scores of function measures at both ages to minimize methodological errors. Conflicting findings are challenging for neonatologists wishing to make predictions about future lung health and to adult physicians trying to manage individual patients. These results suggest that one measure of lung function at age 11 or 19 is sufficient to identify participants with irreversible airflow obstruction.
Relationships between small lungs and elevated cardiovascular risk are well described (24). At age 6 years, we identified significantly reduced lung function but normal seated brachial blood pressure in this cohort, compared with term-born classmates (11, 12). At age 11, when we measured central AP for the first time, we found increased AIx in EP survivors compared with control subjects, and that these abnormal large-vessel hemodynamic changes were not reflected in measurements of seated peripheral blood pressure (3). Relationships between EP status and cardiovascular function persist in this new evaluation at 19 years, but significant differences between the EP and control groups are still not evident in peripheral blood pressure, whereas our central blood pressure and AP data show significant differences. At 11 years, we postulated that AP differences represented alterations in the smaller preresistance and resistance vessels and confirm this here, consistent with described alterations in the pulmonary arteries after neonatal BPD (25). Further work is required to understand the mechanisms of hypertension after EP birth to manage this optimally. It is recognized that elevations in blood pressure in young adults track with hypertension in later life (26).
The mechanisms of the respiratory and cardiovascular impairment observed at age 19 are complex, arising from a combination of prematurity, impaired lung development, perinatal insults, and environment (27). An important unanswered question was whether there is evidence of an active, tractable inflammatory process in the lungs. Consequent to impaired respiratory health, with episodes of childhood wheeze, many EP survivors acquire a diagnosis of asthma, and we continue to see a higher prevalence of an asthma diagnosis and treatments in the EP group with neonatal BPD, as reported by others (28). Asthma can be a challenging diagnosis to make or exclude, and more recent guidelines—though controversial—have focused on FeNO (19). FeNO concentrations were independently lower in the EP group than in the control group, even after correcting for height. We observed an increase in the proportion of subjects with bronchodilator reversibility in the EP group compared with the control group, and this was highest in the EP group with BPD. If EP survivors have an accelerated decline in lung function, or indeed a normal decline rate from submaximal lung development, a proportion of the EP group will subsequently meet spirometric criteria for COPD (post-bronchodilator FEV1/FVC below the lower limit of normal [8]). This poses a risk of misdiagnosis and potential overtreatment for a second chronic respiratory condition. It is now recognized that individuals may reach spirometric definitions of COPD through multiple mechanisms including normal versus impaired maximal lung capacity, with accelerated or normal subsequent lung function decline (29). In this group, we have recently reported that the EP microbiome shows significant dysbiosis in the airway regardless of neonatal BPD status (30), characterized by a shift in bacterial community composition away from Bacteroidetes as is typical in adults living with other chronic lung diseases including asthma and COPD (31).
We found higher desmosine concentrations in the EP group than in the control group. Desmosine is an elastin breakdown product, the largest pool of which lies within the cardiovascular system. There is also significant elastin within the lung, and elevated desmosine concentrations in chronic lung disease may relate to increased cardiovascular risk (32). Elevated desmosine concentrations may suggest an active process within large elastic arteries, although we did not identify a significant relationship between desmosine and either AIx or PWV. Alternatively, if the elevation in desmosine reflects ongoing elastin turnover in the lung, this would argue against the hypothesis that adult lungs from EP survivors have “burnt out” lung disease that does not require therapy to prevent further progression. The elevation in desmosine, suggesting increased elastin turnover, requires further study.
There is evidence for poor consideration of early-life factors among adult physicians (33). It is notable that at age 19, while mean z-scores were lower, for many participants spirometry remained within the normal range. This may provide false reassurance to clinicians unfamiliar with the adult respiratory consequences of being born EP—abnormalities may only become apparent on exercise testing in early disease (34). Walk distance correlated with FeNO concentration and absolute post-bronchodilator FEV1 and FVC, but not z-scores, which suggests that it is related to lung size rather than function.
Our analysis has strengths and weaknesses. EPICure is a national cohort that has been followed longitudinally. As with all longitudinal cohorts, there is significant attrition. We are reassured that the sample seen at 19 years remains representative of the whole cohort in terms of baseline perinatal variables, and results from those evaluated at each age are similar to those from the overall cohort. We have used multilevel modeling to provide confidence that we have, insofar as is possible, a representative cohort. All our assessments were performed to carefully developed standard operating procedures. Although we would have liked to include further testing, we were had no resources to perform other useful techniques, such as diffusion capacity testing and invasive estimations of /stroke volume. However, we did see trends to reductions in measures for both spirometry and AIx over adolescence. We used the same equipment to evaluate vascular parameters at each age, but measurements at 19 years were made in a formal standardized clinic setting in contrast to often ad hoc arrangements at 11 years, when the assessments were performed in a sample examined at school. Our findings reflect associations, and we cannot infer causation.
In conclusion, EP survivors aged 19, especially those who had BPD, have impaired lung capacity at the time of expected peak lung size, elevation in markers of cardiovascular risk, and in association with decreased exercise capacity. There was no evidence of steroid-sensitive inflammation within the lung as assessed by FeNO, but we did find evidence of increased systemic elastin turnover. Relationships between lung and AIx suggests that strategies to protect the developing lung during the immediate neonatal, infant, and early childhood periods can be expected to have long-term benefits on cardiorespiratory health. Our key clinical messages are to emphasize meticulous attention to maximizing lung health in the perinatal, neonatal, and childhood periods, and careful assessment and management of respiratory and cardiovascular risk in young adult survivors of EP including promotion of a healthy lifestyle, including, for example, physical activity, weight management, and tobacco avoidance.
Acknowledgments
Acknowledgment
The authors thank all of the EPICure participants and families, their Participant Advisory Group (coordinated by Bliss, the UK charity for preterm babies), and members of the EPICure research team who are not otherwise named. Desmosine estimations were performed by Jeffrey Huang (University of Dundee).
Footnotes
Supported by the Medical Research Council UK (MR/J01107X/1) and sponsored by University College London. Neither the funders nor the sponsors had any role in the design, execution, interpretation, or content of the study. N.M. receives support from the Department of Health’s National Institute for Health Research (NIHR) Biomedical Research Centre (BRC)’s funding scheme at University College London Hospitals/University College London. C.M.M. is funded by the NIHR Cambridge BRC. C.E.B. is supported by the NIHR Nottingham BRC Respiratory Theme. The views expressed are those of the authors and not necessarily those of the National Health Service, the NIHR, or the Department of Health and Social Care.
Data sharing statement: Data are available subject to the EPICure Data Sharing Policy (www.epicure.ac.uk).
Author Contributions: J.R.H. conceptualized and designed the study, obtained funding, drafted the first version of the manuscript, and revised it for important intellectual content. J.B. assisted in the design of the 19-year follow-up study, collected the data, and reviewed and revised the manuscript for intellectual content. Y.N. conducted the statistical analyses and critically reviewed and revised the manuscript for intellectual content. C.E.B., C.M.M., and J.R.C. contributed to the design of the study, and critically reviewed and revised the manuscript for intellectual content. N.M. conceptualized and designed the study, obtained funding, supervised data collection, and critically reviewed and revised the manuscript. All authors approved the final manuscript as submitted and agree to be accountable for all aspects of the work.
This article has an online supplement, which is accessible from this issue’s table of contents at www.atsjournals.org.
Originally Published in Press as DOI: 10.1164/rccm.202001-0016OC on April 17, 2020
Author disclosures are available with the text of this article at www.atsjournals.org.
References
- 1.Smith LK, Draper ES, Manktelow BN, Fenton A, Kurinczuk JJ on behalf of the MBRRACE-UK Collaboration. MBRRACE-UK supplementary report on survival up to one year of age of babies born before 27 weeks gestational age for births in Great Britain from January to December 2016; [accessed 2020 Jun 26]. Available from: https://www.npeu.ox.ac.uk/downloads/files/mbrrace-uk/reports/MBRRACE-UK%20supplementary%20tables%20on%20births%20before%2027%20weeks%20gestation%202016.pdf. [Google Scholar]
- 2.Jobe AH, Bancalari E. Bronchopulmonary dysplasia. Am J Respir Crit Care Med. 2001;163:1723–1729. doi: 10.1164/ajrccm.163.7.2011060. [DOI] [PubMed] [Google Scholar]
- 3.Bolton CE, Stocks J, Hennessy E, Cockcroft JR, Fawke J, Lum S, et al. The EPICure study: association between hemodynamics and lung function at 11 years after extremely preterm birth. J Pediatr. 2012;161:595–601.e2. doi: 10.1016/j.jpeds.2012.03.052. [DOI] [PMC free article] [PubMed] [Google Scholar]
- 4.Fawke J, Lum S, Kirkby J, Hennessy E, Marlow N, Rowell V, et al. Lung function and respiratory symptoms at 11 years in children born extremely preterm: the EPICure study. Am J Respir Crit Care Med. 2010;182:237–245. doi: 10.1164/rccm.200912-1806OC. [DOI] [PMC free article] [PubMed] [Google Scholar]
- 5.McEniery CM, Yasmin, Hall IR, Qasem A, Wilkinson IB, Cockcroft JR ACCT Investigators. Normal vascular aging: differential effects on wave reflection and aortic pulse wave velocity: the Anglo-Cardiff Collaborative Trial (ACCT) J Am Coll Cardiol. 2005;46:1753–1760. doi: 10.1016/j.jacc.2005.07.037. [DOI] [PubMed] [Google Scholar]
- 6.Chirinos JA, Zambrano JP, Chakko S, Veerani A, Schob A, Willens HJ, et al. Aortic pressure augmentation predicts adverse cardiovascular events in patients with established coronary artery disease. Hypertension. 2005;45:980–985. doi: 10.1161/01.HYP.0000165025.16381.44. [DOI] [PubMed] [Google Scholar]
- 7.Weber T, Auer J, O’rourke MF, Kvas E, Lassnig E, Lamm G, et al. Increased arterial wave reflections predict severe cardiovascular events in patients undergoing percutaneous coronary interventions. Eur Heart J. 2005;26:2657–2663. doi: 10.1093/eurheartj/ehi504. [DOI] [PubMed] [Google Scholar]
- 8.Global Initiative for Obstructive Lung Disease. Global strategy for the diagnosis, management, and prevention of chronic obstructive pulmonary disease (2020 report) [accessed 2020 Jun 26]. Available from: https://goldcopd.org/wp-content/uploads/2019/12/GOLD-2020-FINAL-ver1.2-03Dec19_WMV.pdf.
- 9.Doyle LW, Irving L, Haikerwal A, Lee K, Ranganathan S, Cheong J. Airway obstruction in young adults born extremely preterm or extremely low birth weight in the postsurfactant era. Thorax. 2019;74:1147–1153. doi: 10.1136/thoraxjnl-2019-213757. [DOI] [PubMed] [Google Scholar]
- 10.McEniery CM, Bolton CE, Fawke J, Hennessy E, Stocks J, Wilkinson IB, et al. Cardiovascular consequences of extreme prematurity: the EPICure study. J Hypertens. 2011;29:1367–1373. doi: 10.1097/HJH.0b013e328347e333. [DOI] [PubMed] [Google Scholar]
- 11.Bracewell MA, Hennessy EM, Wolke D, Marlow N. The EPICure study: growth and blood pressure at 6 years of age following extremely preterm birth. Arch Dis Child Fetal Neonatal Ed. 2008;93:F108–F114. doi: 10.1136/adc.2007.118596. [DOI] [PubMed] [Google Scholar]
- 12.Hennessy EM, Bracewell MA, Wood N, Wolke D, Costeloe K, Gibson A, et al. EPICure Study Group. Respiratory health in pre-school and school age children following extremely preterm birth. Arch Dis Child. 2008;93:1037–1043. doi: 10.1136/adc.2008.140830. [DOI] [PubMed] [Google Scholar]
- 13.Quanjer PH, Stanojevic S, Cole TJ, Baur X, Hall GL, Culver BH, et al. ERS Global Lung Function Initiative. Multi-ethnic reference values for spirometry for the 3-95-yr age range: the global lung function 2012 equations. Eur Respir J. 2012;40:1324–1343. doi: 10.1183/09031936.00080312. [DOI] [PMC free article] [PubMed] [Google Scholar]
- 14.Holland AE, Spruit MA, Troosters T, Puhan MA, Pepin V, Saey D, et al. An official European Respiratory Society/American Thoracic Society technical standard: field walking tests in chronic respiratory disease. Eur Respir J. 2014;44:1428–1446. doi: 10.1183/09031936.00150314. [DOI] [PubMed] [Google Scholar]
- 15.Chirinos JA, Kips JG, Roman MJ, Medina-Lezama J, Li Y, Woodiwiss AJ, et al. Ethnic differences in arterial wave reflections and normative equations for augmentation index. Hypertension. 2011;57:1108–1116. doi: 10.1161/HYPERTENSIONAHA.110.166348. [DOI] [PMC free article] [PubMed] [Google Scholar]
- 16.Pauca AL, O’Rourke MF, Kon ND. Prospective evaluation of a method for estimating ascending aortic pressure from the radial artery pressure waveform. Hypertension. 2001;38:932–937. doi: 10.1161/hy1001.096106. [DOI] [PubMed] [Google Scholar]
- 17.Albarbarawi O, Barton A, Miller D, McSharry C, Chaudhuri R, Thomson NC, et al. Characterization and validation of an isotope-dilution LC-MS/MS method for quantification of total desmosine and isodesmosine in plasma and serum. Bioanalysis. 2013;5:1991–2001. doi: 10.4155/bio.13.164. [DOI] [PubMed] [Google Scholar]
- 18.Janson C, Malinovschi A, Amaral AFS, Accordini S, Bousquet J, Buist AS, et al. Bronchodilator reversibility in asthma and COPD: findings from three large population studies. Eur Respir J. 2019;54:1900561. doi: 10.1183/13993003.00561-2019. [DOI] [PubMed] [Google Scholar]
- 19.National Institute for Healthcare Excellence. Asthma: diagnosis, monitoring and chronic asthma management [accessed 2020 Jun 26]. Available from: https://www.nice.org.uk/guidance/ng80.
- 20.Gough A, Spence D, Linden M, Halliday HL, McGarvey LPA. General and respiratory health outcomes in adult survivors of bronchopulmonary dysplasia: a systematic review. Chest. 2012;141:1554–1567. doi: 10.1378/chest.11-1306. [DOI] [PubMed] [Google Scholar]
- 21.Narayanan M, Owers-Bradley J, Beardsmore CS, Mada M, Ball I, Garipov R, et al. Alveolarization continues during childhood and adolescence: new evidence from helium-3 magnetic resonance. Am J Respir Crit Care Med. 2012;185:186–191. doi: 10.1164/rccm.201107-1348OC. [DOI] [PMC free article] [PubMed] [Google Scholar]
- 22.Doyle LW, Faber B, Callanan C, Freezer N, Ford GW, Davis NM. Bronchopulmonary dysplasia in very low birth weight subjects and lung function in late adolescence. Pediatrics. 2006;118:108–113. doi: 10.1542/peds.2005-2522. [DOI] [PubMed] [Google Scholar]
- 23.Bolton CE, Bush A, Hurst JR, Kotecha S, McGarvey L. Lung consequences in adults born prematurely. Thorax. 2015;70:574–580. doi: 10.1136/thoraxjnl-2014-206590. [DOI] [PubMed] [Google Scholar]
- 24.Hole DJ, Watt GC, Davey-Smith G, Hart CL, Gillis CR, Hawthorne VM. Impaired lung function and mortality risk in men and women: findings from the Renfrew and Paisley prospective population study. BMJ. 1996;313:711–715. doi: 10.1136/bmj.313.7059.711. [Discussion, pp. 715–716.] [DOI] [PMC free article] [PubMed] [Google Scholar]
- 25.Poon CY, Watkins WJ, Evans CJ, Tsai-Goodman B, Bolton CE, Cockcroft JR, et al. Pulmonary arterial response to hypoxia in survivors of chronic lung disease of prematurity. Arch Dis Child Fetal Neonatal Ed. 2016;101:F309–F313. doi: 10.1136/archdischild-2015-309015. [DOI] [PubMed] [Google Scholar]
- 26.Chen X, Wang Y. Tracking of blood pressure from childhood to adulthood: a systematic review and meta-regression analysis. Circulation. 2008;117:3171–3180. doi: 10.1161/CIRCULATIONAHA.107.730366. [DOI] [PMC free article] [PubMed] [Google Scholar]
- 27.Malleske DT, Chorna O, Maitre NL. Pulmonary sequelae and functional limitations in children and adults with bronchopulmonary dysplasia. Paediatr Respir Rev. 2018;26:55–59. doi: 10.1016/j.prrv.2017.07.002. [DOI] [PubMed] [Google Scholar]
- 28.Gough A, Linden M, Spence D, Patterson CC, Halliday HL, McGarvey LPA. Impaired lung function and health status in adult survivors of bronchopulmonary dysplasia. Eur Respir J. 2014;43:808–816. doi: 10.1183/09031936.00039513. [DOI] [PubMed] [Google Scholar]
- 29.Lange P, Celli B, Agustí A, Boje Jensen G, Divo M, Faner R, et al. Lung-function trajectories leading to chronic obstructive pulmonary disease. N Engl J Med. 2015;373:111–122. doi: 10.1056/NEJMoa1411532. [DOI] [PubMed] [Google Scholar]
- 30.Rofael SAD, McHugh TD, Troughton R, Beckmann J, Spratt D, Marlow N, et al. Airway microbiome in adult survivors of extremely preterm birth: the EPICure study. Eur Respir J. 2019;53:1801225. doi: 10.1183/13993003.01225-2018. [DOI] [PubMed] [Google Scholar]
- 31.Hilty M, Burke C, Pedro H, Cardenas P, Bush A, Bossley C, et al. Disordered microbial communities in asthmatic airways. PLoS One. 2010;5:e8578. doi: 10.1371/journal.pone.0008578. [DOI] [PMC free article] [PubMed] [Google Scholar]
- 32.Rabinovich RA, Miller BE, Wrobel K, Ranjit K, Williams MC, Drost E, et al. Evaluation of COPD Longitudinally to Identify Predictive Surrogate Endpoints (ECLIPSE) Investigators. Circulating desmosine levels do not predict emphysema progression but are associated with cardiovascular risk and mortality in COPD. Eur Respir J. 2016;47:1365–1373. doi: 10.1183/13993003.01824-2015. [DOI] [PubMed] [Google Scholar]
- 33.Bolton CE, Bush A, Hurst JR, Kotecha S, McGarvey L, Stocks J, et al. Are early life factors considered when managing respiratory disease? A British Thoracic Society survey of current practice. Thorax. 2012;67:1110. doi: 10.1136/thoraxjnl-2012-202637. [DOI] [PubMed] [Google Scholar]
- 34.Lovering AT, Elliott JE, Laurie SS, Beasley KM, Gust CE, Mangum TS, et al. Ventilatory and sensory responses in adult survivors of preterm birth and bronchopulmonary dysplasia with reduced exercise capacity. Ann Am Thorac Soc. 2014;11:1528–1537. doi: 10.1513/AnnalsATS.201312-466OC. [DOI] [PubMed] [Google Scholar]