

Abstract
Rationale: Vitamin D deficiency is common in patients with asthma and chronic obstructive pulmonary disease (COPD). Low 25-hydroxyvitamin D (25[OH]D) levels may represent a cause or a consequence of these conditions.
Objectives: To determine whether vitamin D metabolism is altered in asthma or COPD.
Methods: We conducted a longitudinal study in 186 adults to determine whether the 25(OH)D response to six oral doses of 3 mg vitamin D3, administered over 1 year, differed between those with asthma or COPD versus control subjects. Serum concentrations of vitamin D3, 25(OH)D3, and 1α,25-dihydroxyvitamin D3 (1α,25[OH]2D3) were determined presupplementation and postsupplementation in 93 adults with asthma, COPD, or neither condition, and metabolite-to-parent compound molar ratios were compared between groups to estimate hydroxylase activity. Additionally, we analyzed 14 datasets to compare expression of 1α,25(OH)2D3–inducible gene expression signatures in clinical samples taken from adults with asthma or COPD versus control subjects.
Measurements and Main Results: The mean postsupplementation 25(OH)D increase in participants with asthma (20.9 nmol/L) and COPD (21.5 nmol/L) was lower than in control subjects (39.8 nmol/L; P = 0.001). Compared with control subjects, patients with asthma and COPD had lower molar ratios of 25(OH)D3-to-vitamin D3 and higher molar ratios of 1α,25(OH)2D3-to-25(OH)D3 both presupplementation and postsupplementation (P ≤ 0.005). Intergroup differences in 1α,25(OH)2D3–inducible gene expression signatures were modest and variable if statistically significant.
Conclusions: Attenuation of the 25(OH)D response to vitamin D supplementation in asthma and COPD associated with reduced molar ratios of 25(OH)D3-to-vitamin D3 and increased molar ratios of 1α,25(OH)2D3-to-25(OH)D3 in serum, suggesting that vitamin D metabolism is dysregulated in these conditions.
Keywords: vitamin D 25-hydroxylase; vitamin D 1α-hydroxylase; 1α,25-dihydroxyvitamin D; 24R,25-dihydroxyvitamin D; 4,β25-dihydroxyvitamin D
At a Glance Commentary
Scientific Knowledge on the Subject
Vitamin D deficiency is common in patients with asthma and chronic obstructive pulmonary disease (COPD). It is not known whether low concentrations of the major circulating vitamin D metabolite 25-hydroxyvitamin D (25[OH]D) represent a cause or a consequence of inflammatory airways disease.
What This Study Adds to the Field
We show that patients with asthma and COPD exhibit a blunted 25(OH)D response to vitamin D supplementation as compared to healthy controls. This phenomenon was not explained by genetic variation in the vitamin D pathway. It was associated with evidence of reduced conversion of ‘parent’ vitamin D to 25(OH)D and increased conversion of 25(OH)D to biologically active 1,25-dihydroxyvitamin D. Our findings suggest that reverse causality might at least partially explain reported associations between prevalent asthma and COPD and vitamin D deficiency. This possibility does not preclude favorable effects of vitamin D supplementation in reducing risk of exacerbations of asthma and COPD, as previously demonstrated in intervention studies. The relationship between airway inflammation and vitamin D deficiency may therefore be bidirectional.
Asthma and chronic obstructive pulmonary disease (COPD) are major contributors to the global burden of noncommunicable disease; collectively, they affect more than 500 million people and were responsible for an estimated 3.6 million deaths in 2015 (1). Prevalent asthma and COPD have been widely reported to associate with vitamin D deficiency, as indicated by low circulating concentrations of the major circulating vitamin D metabolite 25-hydroxyvitamin D (25[OH]D) (2–7), which is used as a biomarker of vitamin D status by virtue of its relatively long half-life. These observations, coupled with data from mechanistic studies suggesting favorable effects of vitamin D on lung development and immune function (8–10), suggest that vitamin D deficiency might represent a reversible risk factor for development of these inflammatory airways diseases (11–13). However, null results from Mendelian randomization studies in asthma (14, 15) and reports that carriage of the Gc2 haplotype of vitamin D–binding protein is protective against COPD (16, 17) indicate that genetically determined low levels of 25(OH)D do not increase the risk of developing asthma or COPD.
An alternative explanation for the observed associations between vitamin D deficiency and prevalent asthma and COPD is that low 25(OH)D levels might arise as a consequence of disease, for example, if disease processes perturb vitamin D metabolism in such a way as to reduce synthesis and/or increase catabolism of 25(OH)D, or if disease causes immobility resulting in less exposure to sunlight. Figure 1 illustrates the major vitamin D3 oxidation pathways. Vitamin D3, derived from cutaneous synthesis or absorption in the gastrointestinal tract from dietary sources, is hydroxylated at C25 to form 25(OH)D. The cytochrome P450 (CYP450) enzymes catalyzing this conversion (CYP2R1, CYP3A4, and CYP27A1) are primarily expressed in the liver, but their expression and activity has also been reported in airway epithelium, T cells, and dendritic cells (18, 19). 25(OH)D subsequently undergoes a second hydroxylation step at C1 to form the active vitamin D metabolite 1α,25-dihydroxyvitamin D3 (1α,25[OH]2D3); this oxidation step is catalyzed by CYP27B1, which is expressed in multiple tissues, including the kidney, airway epithelium, and myeloid cells (20). Alternatively, 25(OH)D may undergo hydroxylation at C24 or C4 to form the inactive metabolites 24R,25-dihydroxyvitamin D3 (24R,25[OH]2D3) and 4β,25-dihydroxyvitamin D (4β,25[OH]2D3), respectively. 1α,25(OH)2D3 may also undergo hydroxylation at C24 to form the inactive metabolite 1α,24,25-trihydroxyvitamin D3 (1α,24,25[OH]3D3). The enzymes catalyzing 24-hydroxylation (CYP24A1) and 4β-hydroxylation (CYP3A4 and CYP3A5) are also expressed in both liver and airway epithelium (21, 22).
Figure 1.

Major vitamin D3 oxidation pathways. The CYP450 enzymes catalyzing each conversion are capitalized.
Expression of TNF, IL-1β, and TGF-β is increased in patients with asthma and COPD (23), and these cytokines have been reported to induce expression of CYP24A1 and CYP27B1 in cultured airway epithelial cells (22, 24). We therefore hypothesized that vitamin D deficiency might arise in patients with asthma and COPD as a result of increased 24-hydroxylation and/or 1α-hydroxylation of 25(OH)D. An opportunity to test this hypothesis recently arose in the context of three clinical trials in which adults with asthma, COPD, or neither condition were randomized to receive a standard regimen of vitamin D3 supplementation versus placebo for 1 year (25–27). In this paper, we report results of secondary analyses of biochemical data from participants randomized to the intervention arms of these studies, conducted to determine whether the 25(OH)D response to oral administration of vitamin D3 differed between individuals with and without inflammatory airways disease, with adjustment for potential phenotypic and genotypic confounders. Having observed that the vitamin D3–induced increase in 25(OH)D levels was attenuated in patients with asthma and COPD, we proceeded to measure serum concentrations of the vitamin D metabolites discussed above and to calculate metabolite-to-parent compound molar ratios for individual participants, both before and after vitamin D supplementation. Median molar ratios were then compared between groups at each time point to gain insights into potential differences in activity of vitamin D hydroxylases in cases versus control subjects, with higher ratios indicating greater activity and vice versa. We also conducted gene set variation analysis of 14 publicly available datasets to compare expression of the CYP450 enzymes catalyzing vitamin D oxidation pathways and vitamin D–inducible gene expression signatures in blood, sputum, airway epithelium, and lung tissue of adults with asthma or COPD versus control subjects.
Methods
Clinical Trial Participants and Procedures
The 227 adults contributing data to analyses presented in this paper were participants in one of three randomized controlled trials of vitamin D supplementation, conducted in London, UK (ClinicalTrials.gov Identifiers NCT00978315, NCT00977873, and NCT01069874), whose methods are described elsewhere (25–27). The cohort of participants contributing data to longitudinal analysis of 25(OH)D concentrations comprised 88 adults with asthma treated with inhaled corticosteroids (ICS), 79 patients with COPD, and 19 control subjects who had neither condition. Eligibility criteria and study procedures are detailed in the online supplement. All individuals contributing data to longitudinal analyses received six oral doses of 3 mg vitamin D3 over a 1-year period, administered at 2-month intervals. Administration of doses at baseline, 2 months, and 6 months was directly observed. Doses at 4, 8, and 10 months were self-administered by study participants during a telephone call with the study team. Serum samples were collected at baseline and at 2 and 12 months thereafter. The group contributing data to cross-sectional analyses included 19 adults with ICS-treated asthma, 17 adults with COPD, and 57 adults with neither condition, selected as above. All studies were approved by East London and The City Research Ethics Committee 1 (refs 09/H0703/67, 09/H0703/76, and 09/H0703/112) and written informed consent was obtained from all participants before enrollment.
Laboratory Analyses
For participants contributing data to prospective analyses, serum samples taken at baseline and at 2 months and 12 months postenrollment were sent to the Department of Clinical Biochemistry at Homerton Hospital, London, UK, for quantification of 25(OH)D2 and 25(OH)D3 concentrations by isotope dilution liquid chromatography–tandem mass spectrometry using an Architect ci8200 analyzer (Abbott Diagnostics). Concentrations of these metabolites were summed to give total serum 25(OH)D concentration. The limit of detection for 25(OH)D2 and 25(OH)D3 for this assay was 10 nmol/L. For participants contributing data to cross-sectional analyses, a baseline (i.e., presupplementation) serum sample was sent to the Thummel Laboratory at the Department of Pharmaceutics, University of Washington, Seattle, WA, for measurement of concentrations of vitamin D3, 25(OH)D3, 1α,25(OH)2D3, 24R,25(OH)2D3, and 4β,25(OH)2D3 using a liquid chromatography–tandem mass spectrometry assay, as previously described (28). Limits of detection were 0.07 nmol/L for vitamin D3; 0.25 nmol/L for 25(OH)D3; 1.87 pmol/L for 1α,25(OH)2D3; 0.05 nmol/L for 24R,25(OH)2D3; and 1.70 pmol/L for 4β,25(OH)2D3. Both laboratories participate in the international vitamin D external quality assurance scheme (www.deqas.org/). Details of SNP selection, DNA extraction, and genotyping are provided in the online supplement.
Gene Expression Datasets
Nine datasets from three studies were analyzed to compare gene expression in patients with asthma versus control subjects. The UBIOPRED (Unbiased Biomarkers in Prediction of Respiratory Disease Outcomes) study (29) contributed data from analysis of endobronchial biopsies, endobronchial brushings, nasal brushings, and blood and sputum samples; the ADEPT (Airways Disease Endotyping for Personalized Therapeutics) study (30) contributed data from analysis of sputum samples; and the study by Woodruff and colleagues (31) contributed data from analysis of blood, airway epithelium, and endobronchial biopsies. Five datasets from four studies were analyzed to compare gene expression in patients with COPD versus control subjects. The ECLIPSE (Evaluation of COPD Longitudinally to Identify Predictive Surrogate End-Points) study (32) contributed data from analysis of blood and sputum samples; the studies by Steiling and colleagues and Tilley and colleagues (33, 34) contributed data from analysis of airway epithelium; and the LTRC (Lung Tissue Research Consortium) study (reference set GSE47460) (35) contributed data from analysis of whole-lung homogenates. The selection process for genes to be included in vitamin D–inducible signatures is detailed in the online supplement.
Statistical Analyses
Statistical analyses were performed using Stata/IC v12.1 (StataCorp) and R v3.6.1 (R Foundation for Statistical Computing). Statistical significance was inferred if P values were less than 0.05. Determinants of the 25(OH)D response to vitamin D supplementation were evaluated using linear regression. In cross-sectional analyses, serum concentrations of metabolites and metabolite-to-parent compound molar ratios were compared between groups using Mann-Whitney tests. Prospective analyses to compare postsupplementation versus presupplementation values were conducted using Wilcoxon matched-pairs signed rank tests. For gene expression studies, enrichment scores for individual genes encoding CYP450 enzymes in the vitamin D pathway, and for groups of genes comprising epithelial and peripheral blood mononuclear cell (PBMC) signatures (see Table E7 in the online supplement) were derived using gene set variation analysis, as previously described (36), and compared between groups using Kruskal-Wallis rank sum tests (in which enrichment scores were nonnormally distributed) or Student’s t tests (in which enrichment scores were normally distributed). Further details of statistical analyses are provided in the online supplement.
Results
The 25(OH)D Response to Vitamin D Supplementation Is Blunted in Asthma and COPD
A total of 186 adults (88 with asthma, 79 with COPD, and 19 control subjects without either condition) were allocated to the intervention arms of one of three clinical trials (25–27) and recorded as receiving six oral doses of 3 mg (120,000 IU) vitamin D3 at 2-month intervals over 1 year. Their baseline characteristics are presented in Table E1. Mean age was highest in the COPD cohort (64.4 yr) and lower in the asthma and control cohorts (48.8 and 47.3 yr, respectively). Females were in the majority in asthma and control cohorts (60.2% and 84.2%, respectively) but in the minority in the COPD cohort (34.2%). Prevalence of current cigarette smoking was highest in the COPD cohort (49.4%), intermediate in control subjects (15.8%), and lowest in the asthma cohort (4.5%). Mean baseline 25(OH)D was similar for all three groups (46.1 vs. 45.2 vs. 44.3 nmol/L in asthma vs. COPD vs. control subjects, respectively).
Results of univariate and multivariate analyses evaluating phenotypic determinants of the vitamin D3–induced increase in 25(OH)D3 levels at 2 and 12 months postrandomization are presented in Table 1. The mean increase in 25(OH)D at 2 months after a single directly observed oral dose of 3 mg vitamin D3 was 23.5 nmol/L in control subjects, 12.3 nmol/L in participants with asthma, and 10.5 nmol/L in participants with COPD (adjusted mean difference for asthma vs. control subjects, −8.0 nmol/L [95% confidence interval (CI), −16.3 to 0.4 nmol/L]; adjusted mean difference for COPD vs. control subjects, −9.5 nmol/L [95% CI, −18.0 to −1.0 nmol/L]; Figure 2). A reduced increment in 25(OH)D at 2 months postdose was also seen among participants enrolled between July and January versus between February and June (adjusted mean difference, −12.8 nmol/L [95% CI, −7.8 to −17.8 nmol/L]) and in those with higher baseline vitamin D status (adjusted mean difference per 1 nmol/L increase in baseline 25[OH]D, −0.5 nmol/L [95% CI, −0.6 to −0.4 nmol/L]). Determinants of the 25(OH)D response to six oral doses of 3 mg vitamin D3 given at 2-month intervals, evaluated at 1 year, were similar to those seen for 2-month follow-up, with the mean 25(OH)D increase among control subjects (39.8 nmol/L) being almost double that seen in participants with asthma (20.9 nmol/L) and COPD (21.5 nmol/L; see Figure 2; adjusted mean difference in 25[OH]D increment for asthma vs. control subjects, −20.3 nmol/L [95% CI, −32.2 to −8.5 nmol/L]; adjusted mean difference for COPD vs. control subjects, −20.3 nmol/L [95% CI, −32.2 to −8.4 nmol/L]). As before, higher baseline vitamin D status was independently associated with a reduced mean 25(OH)D increment postsupplementation (adjusted mean difference per 1 nmol/L increase in baseline 25[OH]D, −0.7 nmol/L [95% CI, −0.8 to −0.5 nmol/L]).
Table 1.
Phenotypic Determinants of the 25(OH)D Response to Vitamin D3 Supplementation at 2-Month and 12-Month Follow-up
| (%) | n (%) | 2-Month Follow-up |
12-Month Follow-up |
||||||||
|---|---|---|---|---|---|---|---|---|---|---|---|
| Mean Δ25(OH)D (SD) (nmol/L) | Unadjusted Mean Difference (95% CI) | P Value | Adjusted Mean Difference (95% CI)* | P Value | Mean Δ25(OH)D (SD) (nmol/L) | Unadjusted Mean Difference (95% CI) | P Value | Adjusted Mean Difference (95% CI)† | P Value | ||
| Sex | |||||||||||
| M | 90 (48.4) | 12.8 (17.5) | Referent | — | — | — | 23.0 (24.4) | Referent | — | — | — |
| F | 96 (51.6) | 12.4 (26.6) | −0.4 (−7.0 to 6.1) | 0.90 | — | — | 22.8 (32.4) | −0.2 (−8.5 to 8.2) | 0.97 | — | — |
| Age, yr | 186 (100.0) | — | −0.0 (−0.3 to 0.2) | 0.84 | — | — | — | 0.1 (−0.1 to 0.5) | 0.25 | — | — |
| Disease status | |||||||||||
| Control subjects | 19 (10.2) | 23.5 (22.9) | Referent | — | Referent | — | 39.8 (29.8) | Referent | — | Referent | — |
| Asthma | 88 (47.3) | 12.3 (25.4) | −11.2 (−22.4 to −0.0) | 0.05 | −8.00 (−16.3 to 0.4) | 0.06 | 20.9 (27.4) | −18.9 (−33.7 to −4.1) | 0.01 | −20.3 (−32.2 to −8.5) | 0.001 |
| COPD | 79 (42.5) | 10.5 (18.4) | −13.0 (−24.3 to −1.7) | 0.02 | −9.5 (−18.0 to −1.0) | 0.03 | 21.5 (28.9) | −18.3 (−33.2 to −3.4) | 0.02 | −20.3 (−32.2 to −8.4) | 0.001 |
| Ethnic origin | |||||||||||
| White European | 159 (85.5) | 12.1 (22.9) | Referent | — | — | — | 22.1 (29.5) | Referent | — | — | — |
| Other | 27 (14.5) | 16.0 (20.8) | 3.9 (−5.4 to 13.2) | 0.41 | — | — | 27.9 (22.6) | 5.8 (−6.1 to 17.8) | 0.34 | — | — |
| Body mass index, kg/m2 | 186 (100.0) | — | −0.2 (−0.7 to 0.3) | 0.42 | — | — | — | −0.3 (−0.9 to 0.4) | 0.42 | — | — |
| Smoking status | |||||||||||
| Never- or ex-smoker | 140 (75.3) | 13.7 (21.1) | Referent | — | — | — | 23.3 (26.4) | Referent | — | — | — |
| Current smoker | 46 (24.7) | 9.4 (26.8) | −4.4 (−11.9 to 3.2) | 0.26 | — | — | 21.5 (34.7) | −1.9 (−11.5 to 7.8) | 0.71 | — | — |
| Alcohol intake, units/week | 186 (100.0) | — | 0.0 (−0.2 to 0.3) | 0.76 | — | — | — | −0.1 (−0.4 to 0.2) | 0.48 | — | — |
| Month of first dose | |||||||||||
| February–June | 92 (49.5) | 22.1 (21.1) | Referent | — | Referent | — | 26.5 (26.1) | Referent | — | Referent | — |
| July–January | 94 (50.5) | 3.4 (20.1) | −18.8 (−24.7 to −12.8) | <0.001 | −12.8 (−17.8 to −7.8) | <0.001 | 19.3 (30.7) | −7.1 (−15.5 to 1.2) | 0.09 | — | — |
| Days from first dose to follow-up | 186 (100.0) | — | −0.7 (−0.6 to 0.4) | 0.79 | — | — | — | −0.2 (−0.7 to 0.2) | 0.34 | — | — |
| Baseline 25(OH)D, nmol/L | 186 (100.0) | — | −0.5 (−0.6 to −0.4) | <0.001 | −0.5 (−0.6 to −0.4) | <0.001 | — | −0.7 (−0.8 to −0.5) | <0.001 | −0.7 (−0.8 to −0.5) | <0.001 |
Definition of abbreviations: CI = confidence interval; COPD = chronic obstructive pulmonary disease; Δ25(OH)D = change in serum 25-hydroxyvitamin D3 concentration at follow-up versus baseline.
Adjusted for disease status, month of first dose, and baseline concentration of 25-hydroxyvitamin D.
Adjusted for disease status and baseline concentration of 25-hydroxyvitamin D.
Figure 2.

Mean Δ25(OH)D concentration at 2-month and 12-month follow-up versus baseline. Six oral doses of 3 mg vitamin D3 were administered at 0, 2, 4, 6, 8, and 10 months; serum 25(OH)D levels were determined at baseline (i.e., immediately before the first dose), 2-month follow-up (i.e., 2 mo after the first dose and immediately before the second dose), and at 12-month follow-up (i.e., 12 mo after the first dose and 2 mo after the sixth dose). Error bars show standard error of the mean (SEM). COPD = chronic obstructive pulmonary disease; Δ25(OH)D = change in serum 25-hydroxyvitamin D concentration at follow-up versus baseline.
Attenuated 25(OH)D Response to Vitamin D Supplementation in Asthma and COPD Is Not Explained by Genetic Variation in the Vitamin D Pathway
We next investigated whether genetic variants in the vitamin D pathway previously reported to associate with blunted 25(OH)D response to supplementation were overrepresented in patients with asthma and COPD. Participants were genotyped for a panel of 19 SNPs in genes encoding vitamin D–binding protein (DBP, 6 SNPs) and enzymes responsible for reduction of 7-dehydrocholesterol (DHCR7, 2 SNPs), 25-hydroxylation of parent vitamin D (CYP2R1, 3 SNPs; CYP27A1, 1 SNP; and CYP3A4, 1 SNP), 1-α hydroxylation of 25(OH)D (CYP27B1, 2 SNPs), 24-hydroxylation of 25(OH)D (CYP24A1, 4 SNPs; see Figure 1). Genotype frequency was compared between disease conditions and found to vary for one SNP in CYP27B1 (rs4646536) and two SNPs in DBP (rs2298849 and rs16846876; see Table E2). However, none of these three SNPs associated with 25(OH)D increment postsupplementation after adjustment for baseline 25(OH)D level and disease status (see Table E3). Thus, we found no evidence to indicate that blunting of the 25(OH)D response to vitamin D supplementation in patients with asthma and COPD is explained by genetic variation in the vitamin D pathway.
Vitamin D Metabolite-to-Parent Compound Molar Ratios Differ in Unsupplemented Patients with Asthma and COPD versus Controls
Next, we reasoned that blunting of the vitamin D3–induced increase in 25(OH)D levels in patients with asthma and COPD might arise as a consequence of reduced synthesis of 25(OH)D from vitamin D3 and/or increased catabolism of 25(OH)D to one or more of its dihydroxylated metabolites, and that this might be reflected in reduced molar ratios of 25(OH)D-to-vitamin D3 and/or increased molar ratios of 1α,25(OH)2D-to-25(OH)D, 24R,25(OH)2D-to-25(OH)D, and 4β,25(OH)2D-to-25(OH)D. To test this hypothesis, we first determined concentrations of vitamin D3, 25(OH)D3, and three dihydroxylated vitamin D metabolites (1,25[OH]D3, 24R,25[OH]D3, and 4β,25[OH]D3) in serum of patients with asthma (n = 19), patients with COPD (n = 17), and control subjects with neither condition (n = 57) who had not received vitamin D supplementation, and compared absolute concentrations and metabolite-to-parent compound molar ratios between groups. Characteristics of participants contributing data to this analysis are presented in Table E4. Mean age was highest in those with COPD (66.8 yr), lowest in those with asthma (47.8 yr), and intermediate in control subjects (59.5 yr). Females were in the majority among control subjects (66.7%) but in the minority among patients with asthma (47.4%) and COPD (41.2%). Prevalence of current cigarette smoking was highest in those with COPD (35.3%), intermediate in control subjects (29.8%), and lowest in those with asthma (10.5%).
Table 2 presents results of this cross-sectional analysis of baseline data. Both participants with asthma and those with COPD had higher median serum concentrations of vitamin D3 (P < 0.001) and 1,25(OH)2D (P ≤ 0.04) than control subjects. Patients with COPD also had lower 25(OH)D concentrations than control subjects (P = 0.03), but those with asthma did not. Molar ratios of 25(OH)D3-to-vitamin D3 were lower in patients with asthma and COPD versus control subjects, whereas molar ratios of 1α,25(OH)2D3-to-25(OH)D3 were higher (P ≤ 0.005; Figure 3). No statistically significant differences in median molar ratios of 24R,25(OH)2D3-to-25(OH)D3 or 4β,25(OH)2D3-to-25(OH)D3 were seen between groups (see Table 2).
Table 2.
Baseline and 12-Month Serum Concentrations of Vitamin D3 and Its Metabolites and Metabolite-to-Parent Compound Molar Ratios by Disease Status
| Control Subjects [Median (IQR)] (n = 57) | Asthma (n = 19) |
COPD (n = 17) |
|||
|---|---|---|---|---|---|
| Median (IQR) | P Value* | Median (IQR) | P Value† | ||
| Baseline | |||||
| Vitamin D3, nmol/L | 0.07 (0.07–1.21) | 3.25 (2.44–4.14) | <0.001 | 2.54 (1.37–5.49) | <0.001 |
| 25(OH)D3, nmol/L | 52.28 (32.11–70.30) | 43.79 (30.97–71.74) | 0.97 | 27.23 (15.47–62.37) | 0.03 |
| 1α,25(OH)2D3, pmol/L | 42.49 (1.87–76.50) | 88.33 (70.02–117.70) | <0.001 | 77.27 (36.53–99.18) | 0.04 |
| 24R,25(OH)2D3, nmol/L | 2.72 (0.98–4.24) | 2.27 (1.21–3.87) | 0.93 | 1.47 (0.87–3.51) | 0.33 |
| 4β,25(OH)2D3, pmol/L | 120.73 (72.65–191.38) | 146.75 (85.80–230.14) | 0.48 | 63.25 (1.70–170.37) | 0.04 |
| 25(OH)D3-to-vitamin D3 ratio | 166.51 (38.07–700.67) | 13.81 (8.86–30.73) | <0.001 | 10.49 (6.91–13.54) | <0.001 |
| 1α,25(OH)2D3-to-25(OH)D3 ratio × 103 | 0.79 (0.12–1.42) | 1.91 (1.23–2.75) | <0.001 | 2.04 (0.80–4.39) | 0.005 |
| 24R,25(OH)2D3-to-25(OH)D3 ratio | 0.05 (0.03–0.07) | 0.05 (0.03–0.06) | 0.72 | 0.06 (0.05–0.08) | 0.23 |
| 4β,25(OH)2D3-to-25(OH)D3 ratio × 103 | 2.33 (1.84–3.99) | 3.14 (2.18–3.49) | 0.50 | 2.09 (0.11–3.85) | 0.23 |
| 12 mo | |||||
| Vitamin D3, nmol/L | 1.22 (0.07–3.20) | 4.29 (2.68–6.64) | 0.001 | 3.71 (2.37–6.23) | 0.006 |
| 25(OH)D3, nmol/L | 91.02 (59.69–108.57) | 78.00 (63.03–91.74) | 0.44 | 62.94 (39.18–86.58) | 0.10 |
| 1α,25(OH)2D3, pmol/L | 74.35 (16.47–126.54) | 126.54 (87.81–150.11) | <0.001 | 84.13 (57.20–115.69) | 0.25 |
| 24R,25(OH)2D3, nmol/L | 5.72 (2.90–8.57) | 5.62 (3.67–7.42) | 0.83 | 4.31 (3.03–6.98) | 0.36 |
| 4β,25(OH)2D3, pmol/L | 262.07 (86.84–396.76) | 248.97 (139.60–298.14) | 0.76 | 201.72 (71.12–274.83) | 0.27 |
| 25(OH)D3-to-vitamin D3 ratio | 66.26 (26.10–419.32) | 18.68 (12.08–25.67) | <0.001 | 14.30 (10.91–22.06) | <0.001 |
| 1α,25(OH)2D3-to-25(OH)D3 ratio ×103 | 0.72 (0.27–0.89) | 1.58 (1.18–2.25) | <0.001 | 1.18 (0.88–2.55) | 0.003 |
| 24R,25(OH)2D3-to-25(OH)D3 ratio | 0.06 (0.04–0.08) | 0.07 (0.06–0.08) | 0.25 | 0.07 (0.05–0.09) | 0.30 |
| 4β,25(OH)2D3-to-25(OH)D3 ratio ×103 | 2.66 (1.64–3.95) | 2.77 (2.24–3.82) | 0.59 | 2.95 (1.83–3.68) | 0.93 |
Definition of abbreviations: 1α,25(OH)2D3 = 1α,25-dihydroxyvitamin D3; 4β,25(OH)2D3 = 4β,25-dihydroxyvitamin D3; 24R,25(OH)2D3 = 24R,25-dihydroxyvitamin D3; 25(OH)D3 = 25-hydroxyvitamin D3; COPD = chronic obstructive pulmonary disease; IQR = interquartile range.
P value from Mann-Whitney test comparing values for asthma versus control subjects.
P value from Mann-Whitney test comparing values for COPD versus control subjects.
Figure 3.
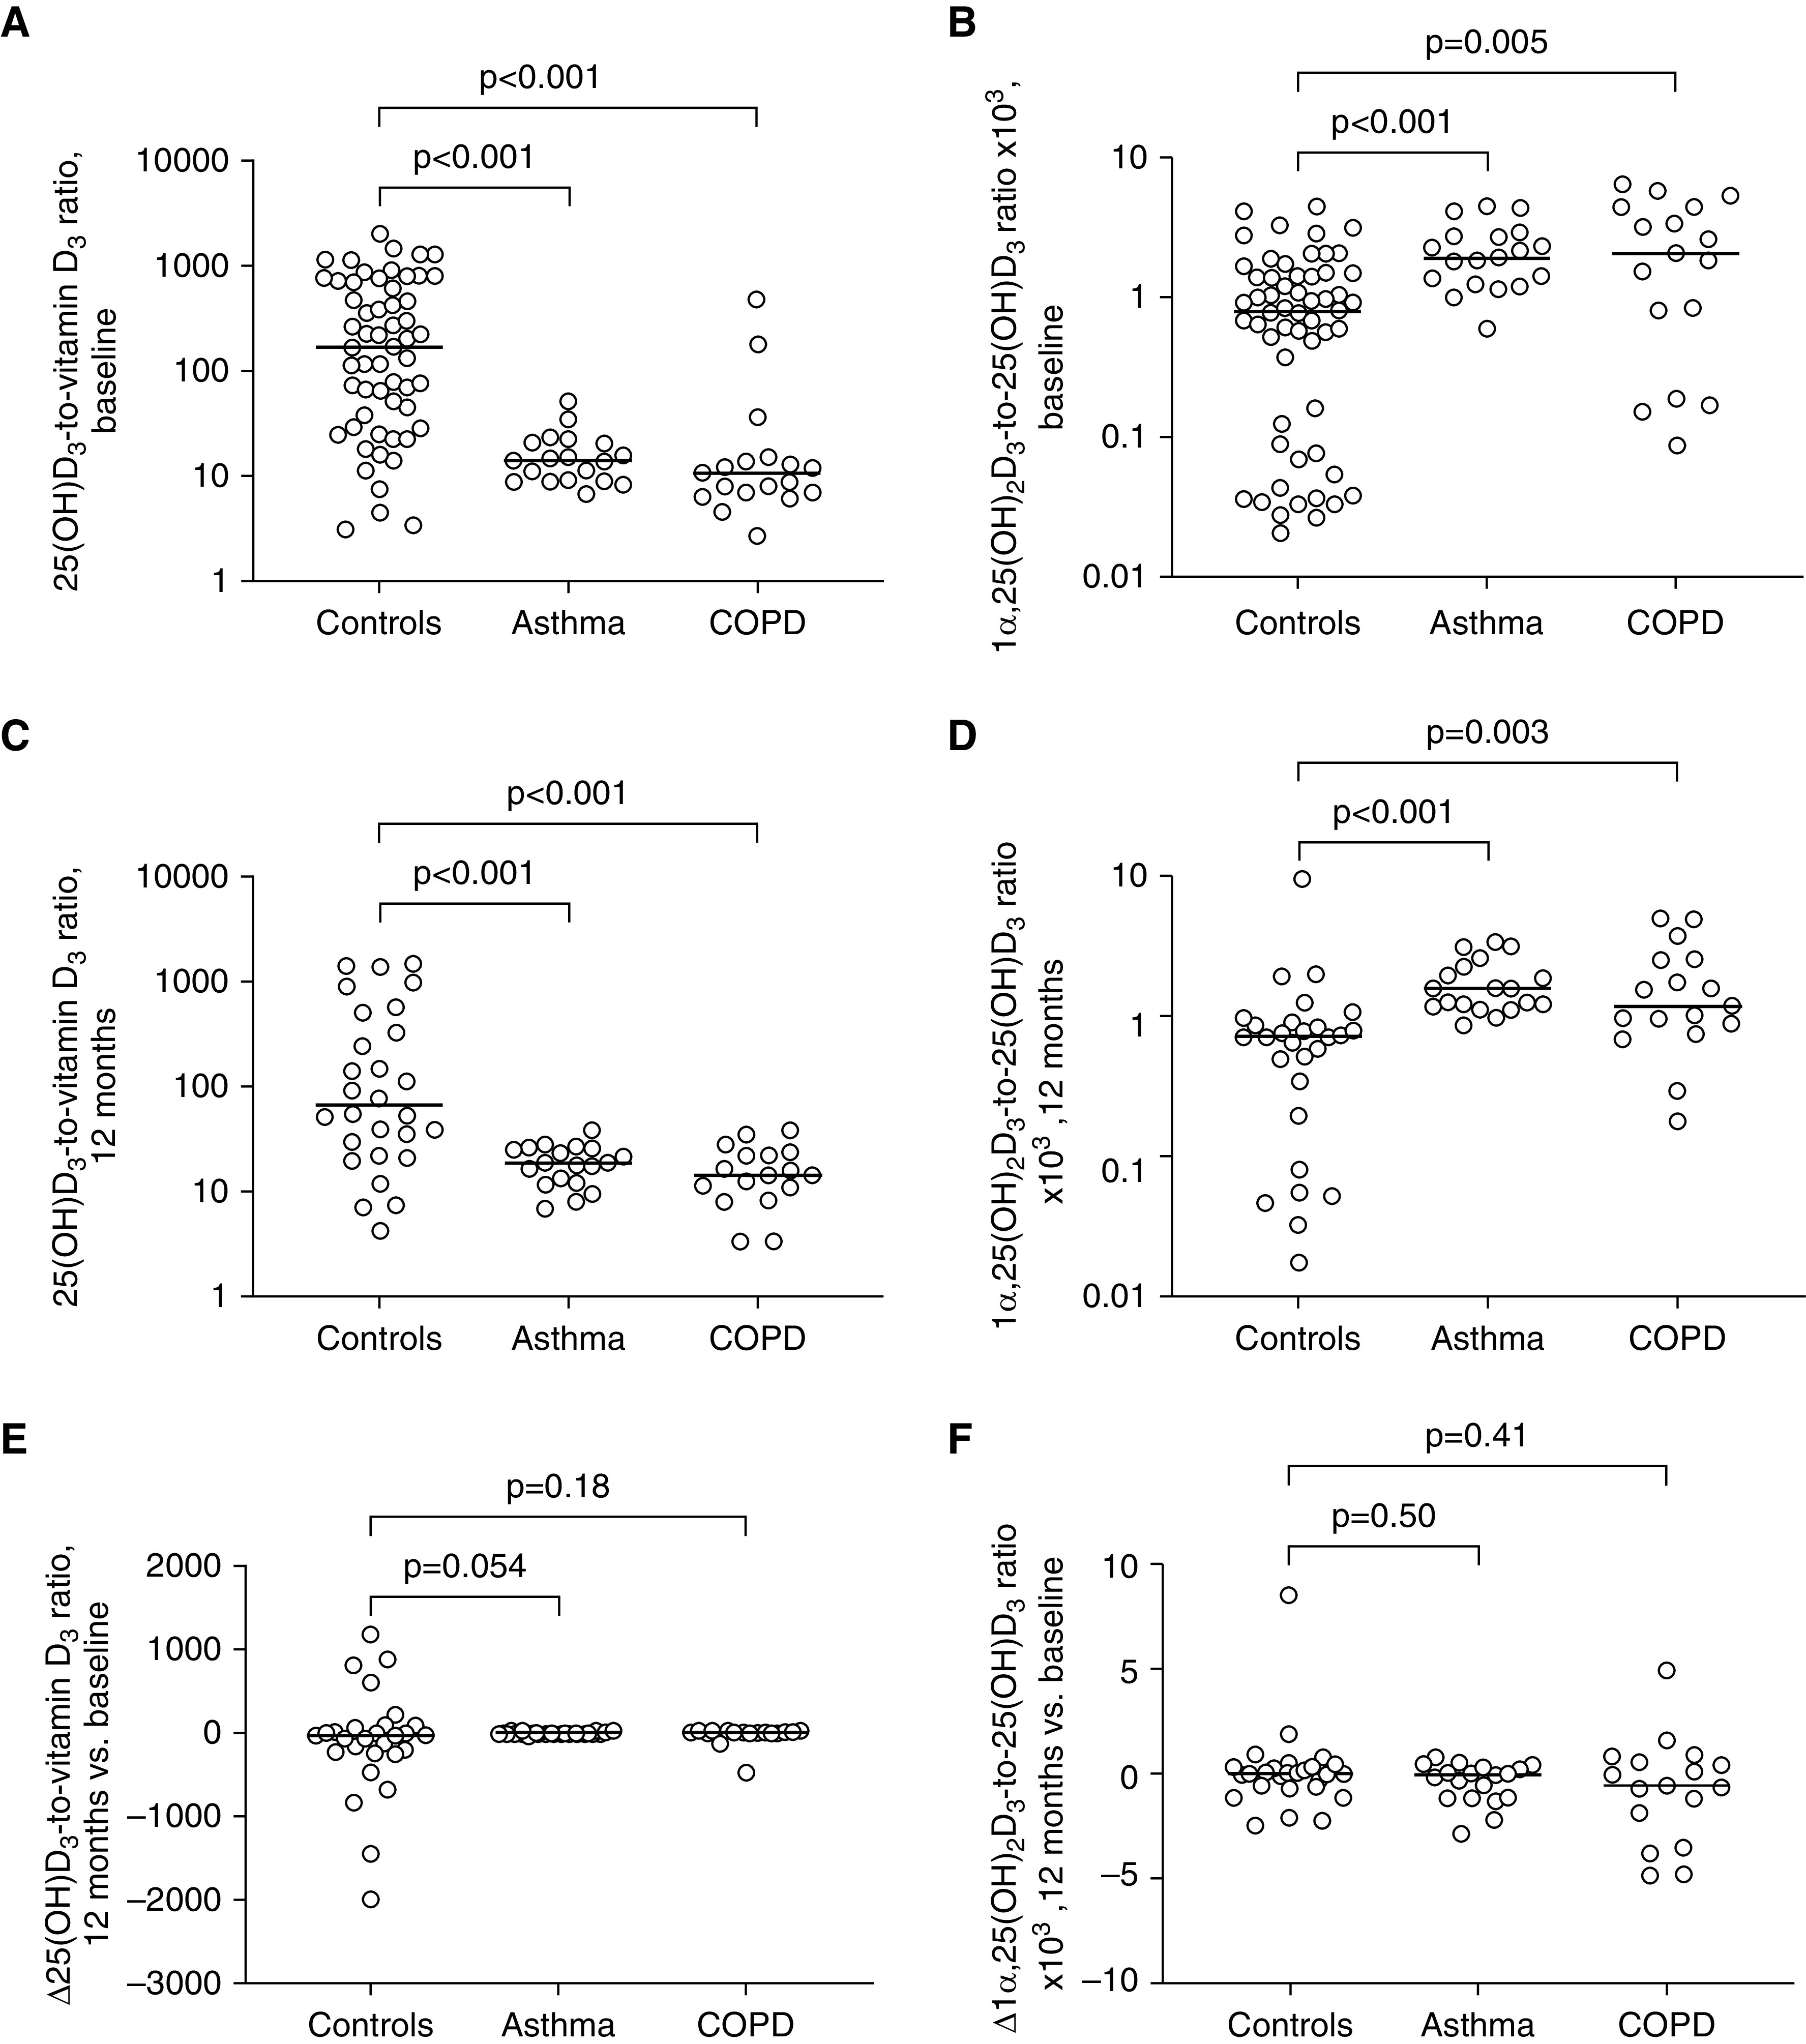
Vitamin D metabolite-to-parent compound molar ratios by disease status, presupplementation and postsupplementation. (A) Presupplementation 25-hydroxyvitamin D (25[OH]D3)-to-vitamin D3 molar ratios in adults with asthma (n = 19), COPD (n = 17), or neither condition (control subjects, n = 57). (B) Presupplementation 25-hydroxyvitamin D3–to–25(OH)D3 molar ratios in the same groups. (C) Postsupplementation 25(OH)D3-to-vitamin D3 molar ratios in adults with asthma (n = 19), COPD (n = 17), or neither condition (control subjects, n = 28). (D) Postsupplementation 1α,25(OH)2D3-to-25(OH)D3 molar ratios in the same groups. (E) Change in (Δ) 25(OH)D3-to-vitamin D3 molar ratios at follow-up versus baseline in adults with asthma (n = 19), COPD (n = 17), or neither condition (control subjects, n = 28). (F) Δ1α,25(OH)2D3-to-25(OH)D3 molar ratios at follow-up versus baseline in adults with asthma (n = 19), COPD (n = 17), or neither condition (control subjects, n = 28). P values from Mann-Whitney tests. Bars show median values in each group. COPD = chronic obstructive pulmonary disease.
Presupplementation Metabolite-to-Parent Compound Molar Ratios Do Not Differ by Disease Severity or Medication Use in Patients with Asthma and COPD
Having found reduced molar ratios of 25(OH)D-to-vitamin D3 and increased molar ratios of 1α,25(OH)2D-to-25(OH)D in patients with asthma and COPD versus control subjects at baseline, we were interested to determine whether the extent of derangements in these molar ratios among patients with inflammatory airways disease varied according to medication use or measures of disease activity or severity. Results are presented in Tables E5 and E6; no statistically significant associations with either ratio were seen for use of long-acting or short-acting β2-agonists or ICS in either asthma or COPD. Moreover, neither ratio associated with fractional exhaled nitric oxide concentration in patients with asthma, or with FEV1% predicted in patients with COPD.
Similar Intergroup Differences in Vitamin D Metabolite-to-Parent Compound Molar Ratios Are Seen after Vitamin D3 Supplementation
We next proceeded to compare absolute concentrations and metabolite-to-parent compound molar ratios for the same analytes between groups at 1-year postenrollment, following ingestion of six oral doses of 3 mg vitamin D3 administered at 0, 2, 4, 6, 8, and 10 months; blood samples were taken at 12-month follow-up (i.e., 12 mo after the first dose and 2 mo after the sixth dose). Results are shown in Table 2 and Figure 3. All participants with asthma and COPD included in baseline metabolite profiling also contributed data to this prospective analysis, but postsupplementation metabolite concentrations were only available for a subset of 28/57 control subjects (the other 29 received a different supplementation regimen). Paired analyses revealed that vitamin D3 supplementation induced statistically significant increases in serum concentrations of vitamin D3 (P = 0.01), 25(OH)D3 (P < 0.001), 1α,25(OH)2D3 (P = 0.002), 24R,25(OH)2D3 (P < 0.001), and 4β,25(OH)2D3 (P < 0.001). Intergroup comparisons of follow-up data revealed higher concentrations of vitamin D3 in both asthma and COPD versus control subjects (P ≤ 0.006) and higher 1α,25(OH)2D3 concentrations in asthma versus control subjects (P < 0.001). Consistent with results of cross-sectional analyses at baseline, postsupplementation molar ratios of 25(OH)D3-to-vitamin D3 and 1α,25(OH)2D3-to-25(OH)D3 were higher in both asthma and COPD versus control subjects (P ≤ 0.003). Changes in 25(OH)D3-to-vitamin D3 and 1,25-dihydroxyvitamin D3 (1,25[OH]2D3)-to-25(OH)D3 ratios from baseline were calculated for each clinical group; median values of these changes were close to zero for all three groups, indicating that ratios were essentially unchanged by vitamin D supplementation. When median changes in ratios were compared between disease groups versus control subjects, no statistically significant differences were seen.
Expression of Vitamin D Pathway Genes in Asthma and COPD
Next, we investigated whether altered metabolite-to-parent compound molar ratios were associated with any differences in expression of genes encoding proteins responsible for vitamin D metabolism (CYP2R1, CYP3A4, CYP3A5, CYP27A1, CYP24A1, CYP27B1, and DHCR7), transport (DBP), and signaling pathways (VDR and RXRA; see Figure 1). Table 3 presents expression data for these 10 genes across nine datasets relating to six sample types from three studies in patients with asthma (31, 37, 38) and five datasets relating to four sample types from four studies in patients with COPD (33, 34, 39, 40). Small but statistically significant differences in expression were seen for genes encoding the 25-hydroxylase CYP27A1 (decreased in airway epithelium in both asthma and COPD, and in endobronchial biopsy tissue in asthma), the 24-hydroxylase CYP24A1 (decreased in nasal brushings, airway epithelium, and endobronchial biopsy in asthma), VDR (increased in nasal and endobronchial brushings and sputum in asthma, and in lung homogenate in COPD), and RXRA (decreased in endobronchial brushings in asthma and small airway epithelium in COPD). For other genes, statistically significant differences in expression for patients with asthma or COPD versus control subjects were either in opposite directions for different datasets (CYP2R1 and CYP3A5), were seen in one dataset only (DBP, CYP3A4), or were absent (DHCR7, CYP27B1).
Table 3.
Expression of Vitamin D Pathway Genes in Patients with Asthma and COPD versus Control Subjects
| Phenotype | CYP2R1 |
CYP3A4 |
CYP3A5 |
CYP27A1 |
CYP24A1 |
CYP27B1 |
DBP |
DHCR7 |
VDR |
RXRA |
|||||||||||
|---|---|---|---|---|---|---|---|---|---|---|---|---|---|---|---|---|---|---|---|---|---|
| logFC | P Value | logFC | P Value | logFC | P Value | logFC | P Value | logFC | P Value | logFC | P Value | logFC | P Value | logFC | P Value | logFC | P Value | logFC | P Value | ||
| Asthma | |||||||||||||||||||||
| UBIOPRED | |||||||||||||||||||||
| Endobronchial biopsy | Asthma (n = 41) vs. control subjects (n = 26) | N/A | N/A | 0.04 | 0.76 | N/A | N/A | −0.01 | 0.96 | 0.13 | 0.36 | N/A | N/A | N/A | N/A | N/A | N/A | 0.10 | 0.48 | −0.16 | 0.21 |
| Endobronchial brushings | Asthma (n = 54) vs. control subjects (n = 44) | 0.05 | 0.56 | 0.18 | 0.03 | 0.17 | 0.05 | 0.00 | 0.98 | −0.02 | 0.87 | 0.14 | 0.23 | −0.01 | 0.95 | 0.15 | 0.19 | 0.22 | 0.01 | −0.25 | 0.03 |
| Nasal brushings | Asthma (n = 32) vs. control subjects (n = 25) | 0.09 | 0.55 | −0.19 | 0.14 | −0.32 | 0.03 | 0.30 | 0.06 | −0.32 | 0.05 | N/A | N/A | 0.19 | 0.19 | 0.10 | 0.52 | 0.37 | 0.01 | 0.11 | 0.46 |
| Blood | Asthma (n = 165) vs. control subjects (n = 87) | −0.02 | 0.71 | 0.00 | 0.95 | −0.32 | <0.0001 | 0.11 | 0.17 | −0.05 | 0.55 | −0.05 | 0.53 | 0.03 | 0.64 | −0.07 | 0.30 | 0.01 | 0.86 | 0.05 | 0.52 |
| Sputum | Asthma (n = 43) vs. control subjects (n = 16) | 0.09 | 0.56 | 0.29 | 0.10 | N/A | N/A | −0.26 | 0.08 | N/A | N/A | N/A | N/A | N/A | N/A | N/A | N/A | 0.30 | 0.04 | 0.06 | 0.73 |
| ADEPT | |||||||||||||||||||||
| Sputum | Asthma (n = 39) vs. control subjects (n = 9) | N/A | N/A | 0.03 | 0.90 | N/A | N/A | −0.11 | 0.59 | N/A | N/A | N/A | N/A | N/A | N/A | N/A | N/A | 0.05 | 0.80 | 0.19 | 0.36 |
| Woodruff | |||||||||||||||||||||
| Blood | Mild-moderate asthma (n = 23) vs. control subjects (n = 20) | −0.10 | 0.41 | 0.05 | 0.46 | −0.14 | 0.21 | −0.19 | 0.38 | 0.12 | 0.24 | 0.03 | 0.73 | 0.03 | 0.80 | 0.02 | 0.72 | −0.02 | 0.81 | 0.03 | 0.70 |
| Airway epithelium | Mild-moderate asthma (n = 62) vs. control subjects (n = 43) | 0.12 | 0.10 | −0.08 | 0.03 | −0.10 | 0.007 | −0.17 | 0.02 | −0.61 | <0.001 | 0.06 | 0.12 | −0.02 | 0.69 | 0.06 | 0.15 | −0.05 | 0.16 | −0.06 | 0.08 |
| Endobronchial biopsy | Mild-moderate asthma (n = 37) vs. control subjects (n = 24) | 0.14 | 0.14 | −0.08 | 0.19 | −0.17 | 0.19 | −0.19 | 0.01 | −0.41 | 0.015 | 0.04 | 0.57 | 0.13 | 0.17 | 0.10 | 0.12 | 0.09 | 0.10 | −0.01 | 0.76 |
| COPD | |||||||||||||||||||||
| ECLIPSE | |||||||||||||||||||||
| Blood | COPD (n = 151) vs. control subjects (n = 47) | 0.19 | 0.05 | −0.18 | 0.07 | N/A | N/A | 0.00 | 0.97 | N/A | N/A | N/A | N/A | 0.06 | 0.52 | N/A | N/A | −0.04 | 0.65 | −0.17 | 0.05 |
| Sputum | COPD (n = 104) vs. control subjects (n = 32) | −0.06 | 0.54 | −0.13 | 0.15 | −0.11 | 0.33 | 0.13 | 0.27 | −0.13 | 0.27 | 0.03 | 0.77 | 0.10 | 0.35 | 0.14 | 0.22 | 0.03 | 0.78 | 0.07 | 0.53 |
| Steiling | |||||||||||||||||||||
| Airway epithelium | Current/former smokers, COPD (n = 151) vs. control subjects (n = 87) | 0.11 | 0.005 | −0.01 | 0.80 | 0.24 | <0.001 | −0.28 | <0.001 | −0.08 | 0.42 | 0.04 | 0.07 | −0.01 | 0.83 | 0.06 | 0.22 | 0.01 | 0.84 | −0.04 | 0.19 |
| Tilley | |||||||||||||||||||||
| Small airway epithelium | Current smokers, COPD (n = 36) vs. control subjects (n = 72) | 0.13 | 0.06 | −0.01 | 0.92 | 0.23 | <0.001 | 0.07 | 0.38 | −0.22 | 0.18 | 0.06 | 0.18 | −0.07 | 0.36 | −0.02 | 0.79 | 0.11 | 0.06 | −0.09 | 0.035 |
| Lung Tissue Research Consortium (GSE47460) | |||||||||||||||||||||
| Lung homogenate | COPD (n = 215) vs. control subjects (n = 105) | −0.11 | 0.002 | N/A | N/A | −0.52 | <0.001 | N/A | N/A | 0.36 | 0.06 | 0.19 | 0.09 | 0.29 | 0.005 | 0.08 | 0.15 | 0.15 | 0.008 | −0.05 | 0.09 |
Definition of abbreviations: ADEPT = Airways Disease Endotyping for Personalized Therapeutics; COPD = chronic obstructive pulmonary disease; CYP = cytochrome P; DBP = vitamin D–binding protein; DHCR7 = 7-dehydrocholesterol reductase enzyme; ECLIPSE = Evaluation of COPD Longitudinally to Identify Predictive Surrogate End-Points; logFC = log2 fold change; N/A = not available; RXRA = retinoid-X receptor-A; UBIOPRED = Unbiased Biomarkers in Prediction of Respiratory Disease Outcomes; VDR = vitamin D receptor.
Expression of Vitamin D–Inducible Signatures in Asthma and COPD
Having found that circulating concentrations of 1α,25(OH)2D3 were elevated in asthma and COPD, and that expression of VDR was increased in sputum, endobronchial brushings, nasal brushings, and lung homogenates from patients with one or other of these conditions, we hypothesized that expression of vitamin D–inducible genes might be increased in blood and airway tissue of patients with asthma and COPD. To explore this possibility, we compared expression of 1,25(OH)2D3–inducible gene signatures in nine datasets relating to seven sample types from three studies in patients with asthma (31, 37, 38) and five datasets relating to four sample types from four studies in patients with COPD (33, 34, 39, 40). Results are presented in Table 4 and Figure E1; in patients with asthma, the epithelial vitamin D signature was modestly upregulated in nasal brushings (one dataset, log2 fold change [logFC], 0.10; P = 0.04), sputum (two datasets, logFC ≤ 0.18; P ≤ 0.04) and endobronchial biopsies (one dataset, logFC, 0.11; P = 0.04); and the PBMC signature was modestly upregulated in peripheral blood (one dataset, logFC, 0.06; P = 0.03). In patients with COPD, the epithelial vitamin D signature was modestly downregulated in whole-lung homogenate (one dataset, logFC, −0.08; P = 0.006) and the PBMC signature was modestly downregulated in peripheral blood (one dataset, logFC, −0.13; P = 0.01).
Table 4.
Expression of Vitamin D–Inducible Signatures in Patients with Asthma and COPD versus Control Subjects
| Phenotype | PBMC Signature |
Epithelial Signature |
|||
|---|---|---|---|---|---|
| logFC | P Value | logFC | P Value | ||
| Asthma | |||||
| UBIOPRED | |||||
| Endobronchial biopsy | Asthma (n = 41) vs. control subjects (n = 26) | N/A | N/A | −0.04 | 0.43 |
| Endobronchial brushings | Asthma (n = 54) vs. control subjects (n = 44) | N/A | N/A | 0.00 | 0.90 |
| Nasal brushings | Asthma (n = 32) vs. control subjects (n = 25) | N/A | N/A | 0.10 | 0.04 |
| Blood | Asthma (n = 165) vs. control subjects (n = 87) | 0.06 | 0.03 | N/A | N/A |
| Sputum | Asthma (n = 43) vs. control subjects (n = 16) | N/A | N/A | 0.11 | 0.04 |
| ADEPT | |||||
| Sputum | Asthma (n = 39) vs. control subjects (n = 9) | N/A | N/A | 0.18 | 0.01 |
| Woodruff | |||||
| Blood | Mild-moderate asthma (n = 23) vs. control subjects (n = 20) | 0.00 | 0.99 | N/A | N/A |
| Airway epithelium | Mild-moderate asthma (n = 62) vs. control subjects (n = 43) | N/A | N/A | 0.07 | 0.053 |
| Endobronchial biopsy | Mild-moderate asthma (n = 37) vs. control subjects (n = 24) | N/A | N/A | 0.11 | 0.04 |
| COPD | |||||
| ECLIPSE | |||||
| Blood | COPD (n = 151) vs. control subjects (n = 47) | −0.13 | 0.01 | N/A | N/A |
| Sputum | COPD (n = 104) vs. control subjects (n = 32) | N/A | N/A | −0.01 | 0.79 |
| Steiling | |||||
| Airway epithelium | Current/former smokers, COPD (n = 87) vs. control subjects (n = 151) | N/A | N/A | 0.03 | 0.20 |
| Tilley | |||||
| Small airway epithelium | Current smokers, COPD (n = 36) vs. control subjects (n = 72) | N/A | N/A | 0.01 | 0.72 |
| Lung Tissue Research Consortium (GSE47460) | |||||
| Whole-lung homogenate | COPD (n = 215) vs. control subjects (n = 105) | N/A | N/A | −0.08 | 0.006 |
Definition of abbreviations: ADEPT = Airways Disease Endotyping for Personalized Therapeutics; COPD = chronic obstructive pulmonary disease; ECLIPSE = Evaluation of COPD Longitudinally to Identify Predictive Surrogate End-Points; logFC = log2 fold change; N/A = not applicable; PBMC = peripheral blood mononuclear cells; UBIOPRED = Unbiased Biomarkers in Prediction of Respiratory Disease Outcomes.
Discussion
To our knowledge, this is the first study to compare vitamin D metabolism in patients with inflammatory airways disease versus control subjects. We found that the 25(OH)D response to vitamin D supplementation was significantly attenuated in patients with asthma and COPD. This phenomenon was associated with reduced molar ratios of 25(OH)D3-to-vitamin D3 and increased molar ratios of 1α,25(OH)2D3-to-25(OH)D in serum of patients with asthma or COPD versus control subjects, both before and after vitamin D supplementation. No statistically significant differences in molar ratios of 24R,25(OH)2D-to-25(OH)D or 4β,25(OH)2D-to-25(OH)D were seen between groups. Analysis of multiple gene expression datasets revealed reduced expression of CYP27A1 in airway epithelium (asthma and COPD vs. control subjects) and endobronchial biopsy tissue (asthma vs. control subjects); reduced expression of CYP24A1 in nasal brushings, airway epithelium, and endobronchial biopsy (asthma vs. control subjects); and increased expression of VDR in nasal brushings, endobronchial brushings, and sputum (asthma vs. control subjects), and lung homogenate (COPD vs. control subjects). By contrast, no evidence of differences in expression of CYP27B1 between groups was seen. 1α,25(OH)2D3–inducible gene expression signatures were modestly upregulated in blood, sputum, nasal brushings, and endobronchial biopsies of patients with asthma but modestly downregulated in whole-lung homogenate and peripheral blood of patients with COPD.
Our study yielded several unanticipated results. Findings from an in vitro study (22) had led us to expect that 24-hydroxylation of 25(OH)D would be increased in asthma and COPD, but we found no evidence of this in vivo. Instead, we found that molar ratios of 25(OH)D3-to-vitamin D3 were lower in patients versus control subjects and that expression of the 25-hydroxylase CYP27A1 was reduced in lung tissue. The former observation echoes findings of a recent study reporting reduced 25-hydroxylation of vitamin D3 in a mouse model of diabetes mellitus (41), although in this case the effect was mediated via reduced hepatic expression of CYP2R1. From a clinical perspective, our finding that the 25(OH)D response to vitamin D supplementation is attenuated in patients with asthma and COPD suggests that these patients may require higher doses of vitamin D to attain optimal 25(OH)D levels as compared with healthy control subjects.
The fact that increases in the ratio of 1α,25(OH)2D3-to-25(OH)D were not associated with increased expression of CYP27B1 in human lung tissue is also at variance with findings of animal studies (24), suggesting that lung tissue is unlikely to be the primary site of increased 1α-hydroxylation of 25(OH)D in patients with asthma and COPD. Although intergroup differences in metabolite-to-parent compound ratios may reflect variation in rates of conversion of a parent compound to its metabolite, they may also be explained by removal of the daughter metabolite from the circulation via direct excretion or sequestration into depots such as adipose tissue and muscle. Further studies to evaluate expression and activity of enzymes in the vitamin D metabolic pathway in patients with asthma and COPD are needed to determine whether differences in metabolite-to-parent ratios truly reflect changes in activity of metabolic enzymes.
With regard to downstream effects of 1α,25(OH)2D3 on gene expression, we were interested to note that 1α,25(OH)2D3–inducible gene expression signatures were increased in patients with asthma but not in those with COPD; this may reflect reduced responsiveness to 1α,25(OH)2D3 in COPD, possibly mediated at the level of the VDR. Whatever the underlying mechanism for the derangements in metabolite-to-parent compound molar ratios that we report here, our findings suggest that reverse causality might at least partially explain reported associations between prevalent asthma and COPD and vitamin D deficiency (2–7). This possibility does not preclude favorable effects of vitamin D supplementation in reducing risk of exacerbations of asthma and COPD, as previously demonstrated in intervention studies (42, 43); the relationship between airway inflammation and vitamin D deficiency may therefore be bidirectional. Given that we have shown evidence of reduced 25-hydroxylase activity in asthma and COPD, a case could be made for investigating effects of administering 25(OH)D in patients with these conditions (44).
Our study has several strengths. Three out of six doses of vitamin D supplementation were directly observed in all participants and the remaining three doses were supervised by telephone, which ensured a high degree of adherence. Strict case definitions for asthma and COPD, based on spirometric criteria, were applied. Our analyses of gene expression incorporated datasets generated from analysis of diverse clinical samples taken from patients with a range of disease severity recruited in different settings, enhancing the generalizability of our findings. We also had access to detailed information regarding potential phenotypic and genotypic confounders of the association between disease status and metabolite-to-parent compound molar ratios, allowing for comprehensive adjustment in our analyses.
Our study also has some limitations. Control subjects were recruited on the basis of an absence of a medical record diagnosis of asthma or COPD, and they did not undergo spirometry. This group could theoretically have included individuals with undiagnosed inflammatory airways disease. If this was the case, then results would be biased toward the null. Our study would have benefitted from the inclusion of data relating to renal and hepatic gene expression data, given that differences in metabolite-to-parent compound molar ratios were not always associated with consistent patterns of expression of genes encoding CYP450 enzymes in lung tissue, sputum, and peripheral blood. Additionally, we draw attention to the fact that we gave intermittent bolus doses of vitamin D3 during this study; our findings might have been different if a daily or weekly dosing regimen had been employed. Finally, we highlight the fact that we studied a relatively small number of participants; this may have limited the generalizability of our findings and our power to detect subgroup effects.
Conclusion
We report that the 25(OH)D response to vitamin D supplementation was attenuated in adults with asthma and COPD as compared with control subjects with neither condition. This phenomenon was associated with reduced molar ratios of 25(OH)D3-to-vitamin D3 and increased molar ratios of 1α,25(OH)2D3-to-25(OH)D3 in the serum, suggesting that vitamin D metabolism is dysregulated in these conditions. Similar studies should be conducted in patients in other settings to determine whether these intriguing findings can be replicated.
Acknowledgments
Acknowledgment
The authors thank all the people who participated in the research.
Footnotes
Supported by the UK National Institute for Health Research (ref RP-PG-0407-10398), Asthma UK (ref AUK-AC-2012-01), and the U.S. NIH (ref 5R01 GM63666). The views expressed are those of the authors and not necessarily those of the U.K. National Health Service, the NIHR, or the UK or U.S. departments of health.
Author Contributions: K.E.T. and A.R.M. conceived the study. D.A.J., C.S., V.D., J.H.W., J.E.M., W.J., P.P., C.J.G., A.B., Y.G., S.C., I.M.A., K.F.C., K.E.T., and A.R.M. contributed to study design. D.A.J., C.S., and A.R.M. participated in implementation of the study. D.A.J., Z.W., and K.E.T. performed laboratory analyses. D.A.J., C.S., N.Z.K., V.D., S.C., and A.R.M. performed data analyses. D.A.J. and A.R.M. wrote the first draft of the article; all other authors critically reviewed it and approved the final version.
This article has an online supplement, which is accessible from this issue’s table of contents at www.atsjournals.org.
Originally Published in Press as DOI: 10.1164/rccm.201909-1867OC on March 18, 2020
Author disclosures are available with the text of this article at www.atsjournals.org.
References
- 1.GBD 2015 Chronic Respiratory Disease Collaborators. Global, regional, and national deaths, prevalence, disability-adjusted life years, and years lived with disability for chronic obstructive pulmonary disease and asthma, 1990-2015: a systematic analysis for the Global Burden of Disease Study 2015. Lancet Respir Med. 2017;5:691–706. doi: 10.1016/S2213-2600(17)30293-X. [DOI] [PMC free article] [PubMed] [Google Scholar]
- 2.Al-Daghri NM, Al-Attas OS, Yakout SM, Alnaami AM, Wani K, Alokail MS. The association of serum 25-OH vitamin D with asthma in Saudi adults. Medicine (Baltimore) 2018;97:e12286. doi: 10.1097/MD.0000000000012286. [DOI] [PMC free article] [PubMed] [Google Scholar]
- 3.Freishtat RJ, Iqbal SF, Pillai DK, Klein CJ, Ryan LM, Benton AS, et al. High prevalence of vitamin D deficiency among inner-city African American youth with asthma in Washington, DC. J Pediatr. 2010;156:948–952. doi: 10.1016/j.jpeds.2009.12.033. [DOI] [PMC free article] [PubMed] [Google Scholar]
- 4.Bener A, Ehlayel MS, Tulic MK, Hamid Q. Vitamin D deficiency as a strong predictor of asthma in children. Int Arch Allergy Immunol. 2012;157:168–175. doi: 10.1159/000323941. [DOI] [PubMed] [Google Scholar]
- 5.Janssens W, Bouillon R, Claes B, Carremans C, Lehouck A, Buysschaert I, et al. Vitamin D deficiency is highly prevalent in COPD and correlates with variants in the vitamin D-binding gene. Thorax. 2010;65:215–220. doi: 10.1136/thx.2009.120659. [DOI] [PubMed] [Google Scholar]
- 6.Berg I, Hanson C, Sayles H, Romberger D, Nelson A, Meza J, et al. Vitamin D, vitamin D binding protein, lung function and structure in COPD. Respir Med. 2013;107:1578–1588. doi: 10.1016/j.rmed.2013.05.010. [DOI] [PubMed] [Google Scholar]
- 7.Skaaby T, Husemoen LL, Thuesen BH, Pisinger C, Jørgensen T, Fenger RV, et al. Vitamin D status and chronic obstructive pulmonary disease: a prospective general population study. PLoS One. 2014;9:e90654. doi: 10.1371/journal.pone.0090654. [DOI] [PMC free article] [PubMed] [Google Scholar]
- 8.Lykkedegn S, Sorensen GL, Beck-Nielsen SS, Christesen HT. The impact of vitamin D on fetal and neonatal lung maturation: a systematic review. Am J Physiol Lung Cell Mol Physiol. 2015;308:L587–L602. doi: 10.1152/ajplung.00117.2014. [DOI] [PubMed] [Google Scholar]
- 9.Faith A, Singh N, Farooque S, Dimeloe S, Richards DF, Lu H, et al. T cells producing the anti-inflammatory cytokine IL-10 regulate allergen-specific Th2 responses in human airways. Allergy. 2012;67:1007–1013. doi: 10.1111/j.1398-9995.2012.02852.x. [DOI] [PubMed] [Google Scholar]
- 10.Dimeloe S, Rice LV, Chen H, Cheadle C, Raynes J, Pfeffer P, et al. Vitamin D (1,25(OH)2D3) induces α-1-antitrypsin synthesis by CD4+ T cells, which is required for 1,25(OH)2D3-driven IL-10. J Steroid Biochem Mol Biol. 2019;189:1–9. doi: 10.1016/j.jsbmb.2019.01.014. [DOI] [PMC free article] [PubMed] [Google Scholar]
- 11.Litonjua AA, Weiss ST. Is vitamin D deficiency to blame for the asthma epidemic? J Allergy Clin Immunol. 2007;120:1031–1035. doi: 10.1016/j.jaci.2007.08.028. [DOI] [PubMed] [Google Scholar]
- 12.Zhu M, Wang T, Wang C, Ji Y. The association between vitamin D and COPD risk, severity, and exacerbation: an updated systematic review and meta-analysis. Int J Chron Obstruct Pulmon Dis. 2016;11:2597–2607. doi: 10.2147/COPD.S101382. [DOI] [PMC free article] [PubMed] [Google Scholar]
- 13.Pfeffer PE, Hawrylowicz CM. Vitamin D and lung disease. Thorax. 2012;67:1018–1020. doi: 10.1136/thoraxjnl-2012-202139. [DOI] [PubMed] [Google Scholar]
- 14.Hysinger EB, Roizen JD, Mentch FD, Vazquez L, Connolly JJ, Bradfield JP, et al. Mendelian randomization analysis demonstrates that low vitamin D is unlikely causative for pediatric asthma. J Allergy Clin Immunol. 2016;138:1747–1749, e4. doi: 10.1016/j.jaci.2016.06.056. [DOI] [PMC free article] [PubMed] [Google Scholar]
- 15.Manousaki D, Paternoster L, Standl M, Moffatt MF, Farrall M, Bouzigon E, et al. Vitamin D levels and susceptibility to asthma, elevated immunoglobulin E levels, and atopic dermatitis: a Mendelian randomization study. PLoS Med. 2017;14:e1002294. doi: 10.1371/journal.pmed.1002294. [DOI] [PMC free article] [PubMed] [Google Scholar]
- 16.Schellenberg D, Paré PD, Weir TD, Spinelli JJ, Walker BA, Sandford AJ. Vitamin D binding protein variants and the risk of COPD. Am J Respir Crit Care Med. 1998;157:957–961. doi: 10.1164/ajrccm.157.3.9706106. [DOI] [PubMed] [Google Scholar]
- 17.Khanna R, Nandy D, Senapati S. Systematic review and meta-analysis to establish the association of common genetic variations in vitamin D binding protein with chronic obstructive pulmonary disease. Front Genet. 2019;10:413. doi: 10.3389/fgene.2019.00413. [DOI] [PMC free article] [PubMed] [Google Scholar]
- 18.DiFranco KM, Mulligan JK, Sumal AS, Diamond G. Induction of CFTR gene expression by 1,25(OH)2 vitamin D3, 25OH vitamin D3, and vitamin D3 in cultured human airway epithelial cells and in mouse airways. J Steroid Biochem Mol Biol. 2017;173:323–332. doi: 10.1016/j.jsbmb.2017.01.013. [DOI] [PMC free article] [PubMed] [Google Scholar]
- 19.Sigmundsdottir H, Pan J, Debes GF, Alt C, Habtezion A, Soler D, et al. DCs metabolize sunlight-induced vitamin D3 to ‘program’ T cell attraction to the epidermal chemokine CCL27. Nat Immunol. 2007;8:285–293. doi: 10.1038/ni1433. [DOI] [PubMed] [Google Scholar]
- 20.Hewison M, Burke F, Evans KN, Lammas DA, Sansom DM, Liu P, et al. Extra-renal 25-hydroxyvitamin D3-1alpha-hydroxylase in human health and disease. J Steroid Biochem Mol Biol. 2007;103:316–321. doi: 10.1016/j.jsbmb.2006.12.078. [DOI] [PubMed] [Google Scholar]
- 21.Hukkanen J, Pelkonen O, Hakkola J, Raunio H. Expression and regulation of xenobiotic-metabolizing cytochrome P450 (CYP) enzymes in human lung. Crit Rev Toxicol. 2002;32:391–411. doi: 10.1080/20024091064273. [DOI] [PubMed] [Google Scholar]
- 22.Schrumpf JA, Amatngalim GD, Veldkamp JB, Verhoosel RM, Ninaber DK, Ordonez SR, et al. Proinflammatory cytokines impair vitamin D-induced host defense in cultured airway epithelial cells. Am J Respir Cell Mol Biol. 2017;56:749–761. doi: 10.1165/rcmb.2016-0289OC. [DOI] [PubMed] [Google Scholar]
- 23.Barnes PJ. The cytokine network in asthma and chronic obstructive pulmonary disease. J Clin Invest. 2008;118:3546–3556. doi: 10.1172/JCI36130. [DOI] [PMC free article] [PubMed] [Google Scholar]
- 24.Wang J, Liu X, Wang H, Li Y, Lan N, Yuan X, et al. Allergen specific immunotherapy enhanced defense against bacteria via TGF-β1-induced CYP27B1 in asthma. Oncotarget. 2017;8:68681–68695. doi: 10.18632/oncotarget.19826. [DOI] [PMC free article] [PubMed] [Google Scholar]
- 25.Martineau AR, MacLaughlin BD, Hooper RL, Barnes NC, Jolliffe DA, Greiller CL, et al. Double-blind randomised placebo-controlled trial of bolus-dose vitamin D3 supplementation in adults with asthma (ViDiAs) Thorax. 2015;70:451–457. doi: 10.1136/thoraxjnl-2014-206449. [DOI] [PubMed] [Google Scholar]
- 26.Martineau AR, James WY, Hooper RL, Barnes NC, Jolliffe DA, Greiller CL, et al. Vitamin D3 supplementation in patients with chronic obstructive pulmonary disease (ViDiCO): a multicentre, double-blind, randomised controlled trial. Lancet Respir Med. 2015;3:120–130. doi: 10.1016/S2213-2600(14)70255-3. [DOI] [PubMed] [Google Scholar]
- 27.Martineau AR, Hanifa Y, Witt KD, Barnes NC, Hooper RL, Patel M, et al. Double-blind randomised controlled trial of vitamin D3 supplementation for the prevention of acute respiratory infection in older adults and their carers (ViDiFlu) Thorax. 2015;70:953–960. doi: 10.1136/thoraxjnl-2015-206996. [DOI] [PubMed] [Google Scholar]
- 28.Martineau AR, Thummel KE, Wang Z, Jolliffe DA, Boucher BJ, Griffin SJ, et al. Differential effects of oral boluses of vitamin D2 vs vitamin D3 on vitamin D metabolism: a randomized controlled trial. J Clin Endocrinol Metab. 2019;104:5831–5839. doi: 10.1210/jc.2019-00207. [DOI] [PMC free article] [PubMed] [Google Scholar]
- 29.Kuo CS, Pavlidis S, Loza M, Baribaud F, Rowe A, Pandis I, et al. U-BIOPRED Project Team. A transcriptome-driven analysis of epithelial brushings and bronchial biopsies to define asthma phenotypes in U-BIOPRED. Am J Respir Crit Care Med. 2017;195:443–455. doi: 10.1164/rccm.201512-2452OC. [DOI] [PubMed] [Google Scholar]
- 30.Loza MJ, Djukanovic R, Chung KF, Horowitz D, Ma K, Branigan P, et al. ADEPT (Airways Disease Endotyping for Personalized Therapeutics); U-BIOPRED (Unbiased Biomarkers for the Prediction of Respiratory Disease Outcome Consortium) investigators. Validated and longitudinally stable asthma phenotypes based on cluster analysis of the ADEPT study. Respir Res. 2016;17:165. doi: 10.1186/s12931-016-0482-9. [DOI] [PMC free article] [PubMed] [Google Scholar]
- 31.Woodruff PG, Boushey HA, Dolganov GM, Barker CS, Yang YH, Donnelly S, et al. Genome-wide profiling identifies epithelial cell genes associated with asthma and with treatment response to corticosteroids. Proc Natl Acad Sci USA. 2007;104:15858–15863. doi: 10.1073/pnas.0707413104. [DOI] [PMC free article] [PubMed] [Google Scholar]
- 32.Singh D, Fox SM, Tal-Singer R, Bates S, Riley JH, Celli B. Altered gene expression in blood and sputum in COPD frequent exacerbators in the ECLIPSE cohort. PLoS One. 2014;9:e107381. doi: 10.1371/journal.pone.0107381. [DOI] [PMC free article] [PubMed] [Google Scholar]
- 33.Steiling K, van den Berge M, Hijazi K, Florido R, Campbell J, Liu G, et al. A dynamic bronchial airway gene expression signature of chronic obstructive pulmonary disease and lung function impairment. Am J Respir Crit Care Med. 2013;187:933–942. doi: 10.1164/rccm.201208-1449OC. [DOI] [PMC free article] [PubMed] [Google Scholar]
- 34.Tilley AE, O’Connor TP, Hackett NR, Strulovici-Barel Y, Salit J, Amoroso N, et al. Biologic phenotyping of the human small airway epithelial response to cigarette smoking. PLoS One. 2011;6:e22798. doi: 10.1371/journal.pone.0022798. [DOI] [PMC free article] [PubMed] [Google Scholar]
- 35.McDonough JE, Kaminski N, Thienpont B, Hogg JC, Vanaudenaerde BM, Wuyts WA. Gene correlation network analysis to identify regulatory factors in idiopathic pulmonary fibrosis. Thorax. 2019;74:132–140. doi: 10.1136/thoraxjnl-2018-211929. [DOI] [PMC free article] [PubMed] [Google Scholar]
- 36.Pavlidis S, Monast C, Loza MJ, Branigan P, Chung KF, Adcock IM, et al. I_MDS: an inflammatory bowel disease molecular activity score to classify patients with differing disease-driving pathways and therapeutic response to anti-TNF treatment. PLOS Comput Biol. 2019;15:e1006951. doi: 10.1371/journal.pcbi.1006951. [DOI] [PMC free article] [PubMed] [Google Scholar]
- 37.Silkoff PE, Strambu I, Laviolette M, Singh D, FitzGerald JM, Lam S, et al. Asthma characteristics and biomarkers from the Airways Disease Endotyping for Personalized Therapeutics (ADEPT) longitudinal profiling study. Respir Res. 2015;16:142. doi: 10.1186/s12931-015-0299-y. [DOI] [PMC free article] [PubMed] [Google Scholar]
- 38.Shaw DE, Sousa AR, Fowler SJ, Fleming LJ, Roberts G, Corfield J, et al. U-BIOPRED Study Group. Clinical and inflammatory characteristics of the European U-BIOPRED adult severe asthma cohort. Eur Respir J. 2015;46:1308–1321. doi: 10.1183/13993003.00779-2015. [DOI] [PubMed] [Google Scholar]
- 39.Bauer Y, Tedrow J, de Bernard S, Birker-Robaczewska M, Gibson KF, Guardela BJ, et al. A novel genomic signature with translational significance for human idiopathic pulmonary fibrosis. Am J Respir Cell Mol Biol. 2015;52:217–231. doi: 10.1165/rcmb.2013-0310OC. [DOI] [PMC free article] [PubMed] [Google Scholar]
- 40.Vestbo J, Anderson W, Coxson HO, Crim C, Dawber F, Edwards L, et al. ECLIPSE investigators. Evaluation of COPD Longitudinally to Identify Predictive Surrogate End-points (ECLIPSE) Eur Respir J. 2008;31:869–873. doi: 10.1183/09031936.00111707. [DOI] [PubMed] [Google Scholar]
- 41.Aatsinki SM, Elkhwanky MS, Kummu O, Karpale M, Buler M, Viitala P, et al. Fasting-induced transcription factors repress vitamin D bioactivation, a mechanism for vitamin D deficiency in diabetes. Diabetes. 2019;68:918–931. doi: 10.2337/db18-1050. [DOI] [PMC free article] [PubMed] [Google Scholar]
- 42.Jolliffe DA, Greenberg L, Hooper RL, Griffiths CJ, Camargo CA, Jr, Kerley CP, et al. Vitamin D supplementation to prevent asthma exacerbations: a systematic review and meta-analysis of individual participant data. Lancet Respir Med. 2017;5:881–890. doi: 10.1016/S2213-2600(17)30306-5. [DOI] [PMC free article] [PubMed] [Google Scholar]
- 43.Jolliffe DA, Greenberg L, Hooper RL, Mathyssen C, Rafiq R, de Jongh RT, et al. Vitamin D to prevent exacerbations of COPD: systematic review and meta-analysis of individual participant data from randomised controlled trials. Thorax. 2019;74:337–345. doi: 10.1136/thoraxjnl-2018-212092. [DOI] [PubMed] [Google Scholar]
- 44.Bischoff-Ferrari HA, Dawson-Hughes B, Stöcklin E, Sidelnikov E, Willett WC, Edel JO, et al. Oral supplementation with 25(OH)D3 versus vitamin D3: effects on 25(OH)D levels, lower extremity function, blood pressure, and markers of innate immunity. J Bone Miner Res. 2012;27:160–169. doi: 10.1002/jbmr.551. [DOI] [PubMed] [Google Scholar]