

Abstract
Introduction:
Endoscopic craniofacial resections (CFR) are performed for extensive anterior skull base lesions. This surgery involves removal of multiple intranasal structures, potentially leading to empty nose syndrome (ENS). However, many patients remain asymptomatic postoperatively. Our objective was to analyze the impact of CFR on nasal physiology and airflow using computational fluid dynamics (CFD). This is the first CFD analysis of post-CFR patients.
Methods:
Three-dimensional sinonasal models were constructed from 3 postoperative images using Mimics™ Hybrid computational meshes were created. Steady inspiratory airflow and heat transport were simulated at patient-specific flow rates using shear stress transport k-omega turbulent flow modeling in Fluent™. Simulated average heat flux (HF) and surface area where HF exceeded 50 W/m2 (SAHF50) were compared with laminar simulations in nine radiographically-normal adults.
Results:
Three adults underwent CFR without developing ENS. Average HF (W/m2) were 132.70, 134.84, 142.60 in CFR group, ranging from 156.24 to 234.95 in the non-operative cohort. SAHF50 (m2) values were 0.0087, 0.0120, 0.0110 in the CFR group, ranging from 0.0082 to 0.0114 in the radiographically-normal cohort. SAHF50 was distributed throughout the CFR cavities, with increased HF at the roof and walls compared to the non-operative cohort.
Conclusion:
Average HF was low in the CFR group compared to the non-operative cohort. However, absence of ENS in most CFR patients may be due to large stimulated mucosal surface area, commensurate with the non-operative cohort. Diffuse distribution of stimulated area may result from turbulent mixing after CFR. To better understand heat transport post-CFR, a larger cohort is necessary.
Keywords: Computational Fluid Dynamics (CFD), Computer Modeling for Nasal Airflow, Nasal airflow dynamics, Craniofacial Resection, Empty Nose Syndrome
INTRODUCTION
The endoscopic endonasal approach for removal of advanced tumors of paranasal sinuses and anterior skull base represents significant progress in cranial base surgery.1 In appropriate patients, endoscopic craniofacial resection (CFR) results in comparable oncologic outcomes and decreased morbidity as compared to the open approach.1–3 Dependent on the tumor location, oncologic resection often necessitates removal of multiple intranasal structures, and thereby creates an anatomically-distorted nasal cavity. After completion of healing, most patients deny nasal morbidity despite the absence of normal anatomic structures which have been previously shown to optimize nasal airflow and conditioning.4–6
Conversely, patients with empty nose syndrome (ENS) suffer from nasal airway obstruction, chronic nasal crusting, dryness and fetid odor. This debilitating disease is associated with, and commonly attributed to prior intranasal surgery performed to correct nasal airway obstruction.7–10 Altered aerodynamics causing abnormal conditioning of nasal airflow are thought to contribute largely to the development of ENS.8–10 Endoscopic CFR represents an extreme of surgically altered sinonasal anatomy and given this, it is remarkable that these individuals do not commonly endorse symptoms experienced by those with ENS.
Computational fluid dynamics (CFD) is a powerful tool to investigate nasal airflow and physiology in detail. Numerical simulations of airflow have been shown to approximate in-vivo conditions and provide objective data about flow patterns, as well as heat and water transfer.11–13 CFD has been utilized to evaluate surgical outcomes and to enhance the understanding of disease states including nasal airway obstruction, septal perforation, and ENS.8,9,13–18 However, no CFD studies have investigated the effects of CFR on nasal airflow patterns and conditioning.
The objective of this present study was to use CFD techniques to investigate the impact of endoscopic CFR on nasal physiology by comparing airflow characteristics of 3 CFR patients with those of 9 radiographically-normal (CT-normal) controls. This is the first CFD analysis of airflow in nasal cavities after endoscopic CFR.
METHODS
This study was approved by the Institutional Review Board (IRB) at the University of North Carolina at Chapel Hill. Three patients diagnosed with advanced skull base malignancy (high-grade neuroendocrine carcinoma – CFR1, esthesioneuroblastoma – CFR2, squamous cell carcinoma – CFR3) had history of endoscopic craniofacial resection with adjunctive chemotherapy and radiation therapy. Surgery for all three patients included transnasal near-total septectomy, frontal sinusotomy, total ethmoidectomy, sphenoidectomy, medial maxillectomy, dural resection, and skull base reconstruction with nasoseptal flap19.
Chart review was performed to identify signs of ENS on nasal endoscopy including crusting and bleeding, as well as for symptoms of ENS including nasal airway obstruction, facial pain, and anosmia. The Sino-Nasal Outcome Test (SNOT-22) and the Empty Nose Syndrome 6-Item Questionnaire (ENSQ6) were administered to available patients20,21. The SNOT-22 is a validated instrument to evaluate quality of life in chronic rhinosinusitis20. The ENSQ6 is a validated, specific questionnaire which is an adjunct to SNOT-22 to identify patients suspected of developing ENS wherein a score of 10.5 of 30 in the ENSQ6 can reliably predict ENS21.
3D Model Creation - CFR
Computed tomography (CT) scans with sinus protocol were obtained > 3 years post-operatively (Figure 1). Axial slices measuring 1.0 – 3.0 mm thickness were used to develop models of nasal geometries. All CT scans were de-identified and data imported and edited in Mimics™ 18.0 (Materialise, Inc. Plymouth, MI). The sinonasal air passages were reconstructed in three dimensions (3D) using pixels from −1024 and −300 Hounsfield units. Each CFR model consisted of the surgically-created unified sinonasal passage and nasopharynx. Using previously studied mesh refinement protocols,22,23 these reconstructions were meshed with approximately 6 million tetrahedral elements using meshing software ICEM-CFD™ 15.0 (ANSYS, Inc., Canonsburg, PA). Tetrahedral quality was ascertained and all cells had an aspect ratio greater than 0.3, a value which minimizes element distortion and optimizes numerical simulation accuracy. Regions of the sinonasal cavity were generated for post-simulation analysis; these consisted of each nostril surface, anterior nasal cavity, nasopharynx, and an outlet surface approximated at level of hard palate (Figure 2). All CFR nasal geometries were without nasal septum as a result of surgical resection. Posterior septal extent was approximated by a line from posterior hard palate to anterior clivus and the main nasal cavity was defined as the region extending from this extent forward to the nostrils. Mimics™ and ICEM-CFD™ were used to estimate surface area and volume of the main nasal cavity.
Figure 1.

Coronal images of computed tomography scans of CFR patients.
Figure 2.

Left lateral view of 3D nasal reconstructions of 3 CFR subjects. Nostrils are at left, nasopharynx (dark gray region) at right. All models have an outlet tube added to the posterior nasopharynx for numerical stability. CFR, craniofacial resection.
3D Model Creation – Radiographically Normal (CT-Normal)
The de-identified, sinus protocol CT scans of nine patients, at least 18 years of age, at Duke University and University of North Carolina hospitals were determined to be without aberrant or altered anatomy by study staff24 Imaging was obtained for a number of reasons including trauma, hydrocephalus, and acute respiratory failure. These CT images were used to create 3D nasal models as described above; the nasal cavity was defined from the true posterior septum to nostrils.
Airflow and Heat/Water Vapor Transport
The nasal cavity was modeled with airway-tissue interfaces acting as rigid boundaries. Turbulent simulations of inspiratory airflow and heat transfer were conducted in CFR geometries at resting breathing rates based on body weight and gender.25 The numerical scheme, implemented on Fluent™ v14.5 (ANSYS, Inc.), was a Reynolds-averaged Navier Stokes (RANS) setup comprising shear-stress transport based k-ω model with low-Reynolds-number correction. Boundary conditions for the steady-state, inspiratory airflow simulations were zero-velocity with no-slip at all airway walls, zero-gauge pressure set at the nostrils, and a negative pressure set at the nasopharyngeal outlet sufficient to draw twice the estimated minute-volume of air through the nasal model (−4.48 Pa for 14.6 L/min in CFR1, −16.71 Pa for 20.1 L/min in CFR2, −7.76 Pa for 20.8 L/min in CFR3). Uncoupled heat and water vapor transport simulations were conducted using Fluent™ with nasal mucosal temperature set to 32.6 C° and 100% relative humidity as described by Garcia et al.10 Ambient air temperature and relative humidity were set to 20 C° and 50%, respectively. It was assumed that the temperature and humidity gradients simulated here would not induce enough evaporation to affect cooling to a substantial degree so heat transport calculations did not include or account for any water-evaporation cooling.
Nasal resistance, water and heat flux were computed in the CFR sinonasal cavity as one unit, without laterality. For CT-normal nasal geometries, nasal resistance, water and heat flux were computed on both sides and then combined for a total numerical value. Nasal resistance was computed as the ratio of pressure drop from nostrils to posterior septum in pascals (Pa) divided by the volumetric flow in ml/sec. Additional information regarding equations is accessible in previous publications.10,12 Visualization of results was done using Fluent™ and post-processing software Fieldview™ 17.0 (Intelligent Light, Lyndhurst, New Jersey). From these computational models, heat and water flux, humidifying efficiency, surface area (SA) and volume, were calculated for the main nasal cavity in all nasal models. The nasopharynx was not included in final simulation analysis given its dynamic nature.
Nasal humidification efficiency, previously described by Dayal et al.,26 was defined as
Σhumidification = 100 x (Cpostseptum − Cnostril)/Cmucosa − Cnostril)
where Cnostril, Cpostseptum, and Cmucosa are the water concentrations in air at the nostril, posterior septum, and nasal mucosa, respectively. This represents the overall transport of water from nasal mucosa during inspiration. Heat flux represents the transfer of heat from nasal mucosa to inspired air and is a CFD measurement of mucosal cooling. Heat flux was calculated as the heat transfer rate in Watts (W, one Watt = 1 joule/sec) per square meter of nasal surface area. The surface area where heat flux (HF) exceeds 50 W/m2 (SAHF50) has been identified by Sullivan and colleagues12 as strongly correlating with perception of nasal patency and this was calculated from the models as well.
Turbulent modeling
Reynolds number (Re) is a ratio of the convective inertia of a flow to the viscosity of the fluid medium. For respiratory airflow, it can be computed as Re = ρ v Dh/μ, where ρ is the density of inspired air, v is the airflow velocity at some cross-section, Dh is the hydraulic diameter at that cross-section, and μ is the dynamic viscosity of air. The current simulations assumed ρ = 1.204 kg/m3 and μ = 1.825 × 10⁻⁵ kg/m·s. Considering the cross-section transverse to the generic flow direction just anterior to the septal resection zone, the corresponding Re values were 485 for CFR1, 484 for CFR2, and 940 for CFR3. Streamwise cross-sections through the posterior resected ends of the septum revealed almost circular outlines in all three test models (Figure 3). A circular cylinder, beyond Re>300,27,28 generates coherent vortex structures into the flow. The unsteady flow scales eventually devolve into turbulence with further increase in Re. The rounded end of a circular cylinder may stand in as a simplified version of the roughly circular curvature of the streamwise cross-section of the resected septum. So, with Re approaching 500 and beyond in the CFR 1 −3 models, a realistic simulation of the airflow necessitated the consideration of turbulence modeling schemes.
Figure 3.

Geometric features of the CFR1-3 models, to rationalize the necessity of the turbulence-modeling framework.
However, the choice of turbulence models to simulate the airflow in CFR subjects may also be challenged based on the evidences in literature,29–31 which have modeled nasal airflow at similar breathing rates using a laminar framework. Confounding as it might seem, such nasal models did not involve any septal resection and the inspired air was evenly partitioned along the left and right airways. The flow profile inside the nasal airways for gentle steady breathing could hence be considered laminar. On the contrary, after the two sides of the airway converge beyond the septum, turbulent fluctuations arise in the nasopharynx region and these fluctuations dominate the flow in the posterior parts of the airway continuing into the pharynx. Thus, understandably, prior CFD models for laryngeal airflow have implemented turbulence models32. A similar convergence of airflow from the two sides of the frontal nose happens at a much-anterior region (at the resected end of the septum) in CFR subjects and the resultant mixing justified the use of turbulence modeling to obtain a realistic idea of the flow profile.
To ensure that the meshing protocol was robust enough for the models to run turbulence simulations, we checked the parameter y+, which can detect the emergence of turbulence in zones adjacent to the wall and ascertains if the mesh is sufficiently refined to resolve such flow scales. We can calculate the parameter as , where τw is the wall shear stress, D is the perpendicular distance from the wall to the mesh element, and υ is the kinematic viscosity of air33. Generally, the different values for y+ provide following characterization:
y+< 5 suggests viscous sub-layers in near-wall regions,
y+>30 suggests the formation of fully turbulent layers.
In our simulations, mean approximated to 0.084, thus confirming the mesh adequacy34 for implementation of the shear-stress transport based k-ω model. Similar modeling frameworks have been shown to agree with in vivo data for monodisperse aerosol deposition in mouth-throat models35,36.
This preliminary study included too few subjects for statistical analysis therefore data for all 3 CFR subjects are given below while averages and range are reported for the group of nine subjects. Data from the CT-normal cohort are reported for bilateral nasal cavities.
RESULTS
Average surface area (SA) and volume of CT-normal nasal cavities without paranasal sinuses was 20,265 mm2 (range: 14,493 to 25,693 mm2) and 22,868 mm3 (range: 16.795 to 30,301 mm3), respectively, and was 37,929 mm2 (range: 32,091 to 43,593 mm2) and 71,509 mm3 (range: 50,248 to 86,542 mm3) respectively, with paranasal sinuses included. Because the paranasal sinuses are not thought to play a role in heating and humidification, SA-to-volume ratios (SAVR) were computed for the CT-normal models without sinuses included (main nasal cavity only, Table 1). Compared to the main nasal cavities of these subjects, craniofacial resection resulted in substantially increased nasal cavity volumes (75,535 mm3, 106,951 mm3, and 97,343 mm3 in CFR subjects 1, 2, and 3 respectively), similar SAs (19,202 mm2, 23,825 mm2, and 22,677 mm2), and therefore substantially decreased SAVR (0.254, 0.223, and 0.233 mm−1 in CFR subjects 1, 2, and 3 respectively, vs. average 0.903 mm−1, ranging from 0.751 to 1.150 mm−1 in the CT-normal cohort without sinuses included; Table I).
Table I.
Volume and surface area of CFR models and CT-normal models, comparing with paranasal sinuses present and removed. CFR: Craniofacial resection, CT-Normal: Radiographically normal, SAVR: surface area volume ratio.
| Model | Surface Area (mm2) | Volume (mm3) | SAVR (mm−1) | |||
|---|---|---|---|---|---|---|
| CFR 1 | 19202.4 | 75535.0 | 0.254 | |||
| CFR 2 | 23824.6 | 106951.4 | 0.223 | |||
| CFR 3 | 22677.3 | 97343.4 | 0.233 | |||
| CFR AVERAGE | 21901.4 | 93276.6 | 0.237 | |||
| With Sinuses | Sinuses Removed | With Sinuses | Sinuses Removed | With Sinuses | Sinuses Removed | |
| CT-Normal 1 | 38861.3 | 17981.2 | 80921.5 | 18757.8 | 0.480 | 0.959 |
| CT-Normal 2 | 37672.1 | 14492.9 | 85284.1 | 17029.8 | 0.442 | 0.851 |
| CT-Normal 3 | 43592.9 | 19312.2 | 86541.5 | 16795.3 | 0.504 | 1.15 |
| CT-Normal 4 | 32091.5 | 18571.3 | 57516.0 | 22202.4 | 0.558 | 0.836 |
| CT-Normal 5 | 32657.3 | 17696.0 | 50247.6 | 17891.9 | 0.650 | 0.989 |
| CT-Normal 6 | 39567.1 | 25475.2 | 65549.0 | 30301.3 | 0.604 | 0.841 |
| CT-Normal 7 | 42624.0 | 21643.9 | 85264.3 | 28822.6 | 0.500 | 0.751 |
| CT-Normal 8 | 37059.8 | 25692.6 | 64793.2 | 28935.8 | 0.572 | 0.888 |
| CT-Normal 9 | 37236.4 | 21519.2 | 67467.8 | 25074.2 | 0.552 | 0.858 |
| CT-Normal AVERAGE | 37929.2 | 20265.0 | 71509.4 | 22867.9 | 0.540 | 0.903 |
CFR resulted in comparable nasal resistances of 0.017, 0.046, and 0.019 Pa/ml/sec as compared to CT-normal nasal cavities, average 0.045 Pa/ml/sec (range 0.015 - 0.115 Pa/ml/sec) Table II. Airflow distribution in the CT-normal cavities was concentrated near the septum, primarily at the floor of the nose and through the middle meatus. In contrast, simulations in CFR cavities displayed airflow directed at the nasal roof with access to the sphenoid cavity and maxillary sinuses (Figure 4).
Table II.
Air-conditioning characteristics of CFR models compared to normal models. CFR: Craniofacial resection, CT-Normal: Radiographically normal. SAHF50 is the surface area where heat flux > 50 W/m2, SAVR is the surface area-to-volume ratio of the nasal cavity from the nostrils to the end of the septum, Humidifying efficiency: Σhumidification = 100 x (Cpostseptum − Cnostril)/(Cmucosa − Cnostril).
| Model | Nasal Resistance (Pa/(ml-sec)) | Average Heat Flux (W/m2) | Maximum Heat Flux (W/m2) | SAHF50 (cm2) | Humidifying Efficiency (%) |
|---|---|---|---|---|---|
| CFR 1 | 0.017 | 132.7 | 6429.7 | 86.7 | 70.3 |
| CFR 2 | 0.046 | 134.8 | 7568.6 | 120.3 | 64.2 |
| CFR 3 | 0.019 | 142.6 | 7455.2 | 109.9 | 62.8 |
| CFR AVERAGE | 0.028 | 136.7 | 7151.2 | 105.6 | 65.8 |
| CT-Normal 1 | 0.0396 | 204.0 | 11100.0 | 96.4 | 93.7 |
| CT-Normal 2 | 0.0353 | 235.0 | 8150.2 | 94.5 | 87.6 |
| CT-Normal 3 | 0.0149 | 190.6 | 5835.8 | 97.3 | 98.8 |
| CT-Normal 4 | 0.1153 | 224.3 | 9626.4 | 81.8 | 96.2 |
| CT-Normal 5 | 0.0523 | 211.1 | 15495.0 | 108.6 | 96.3 |
| CT-Normal 6 | 0.0302 | 156.2 | 10791.2 | 87.3 | 83.6 |
| CT-Normal 7 | 0.0177 | 172.5 | 7357.6 | 113.8 | 86.3 |
| CT-Normal 8 | 0.0355 | 169.7 | 8545.3 | 109.9 | 94.0 |
| CT-Normal 9 | 0.0652 | 175.1 | 9899.7 | 90.6 | 93.6 |
| CT-Normal AVERAGE | 0.045 | 193.2 | 9644.6 | 97.8 | 92.2 |
Figure 4.
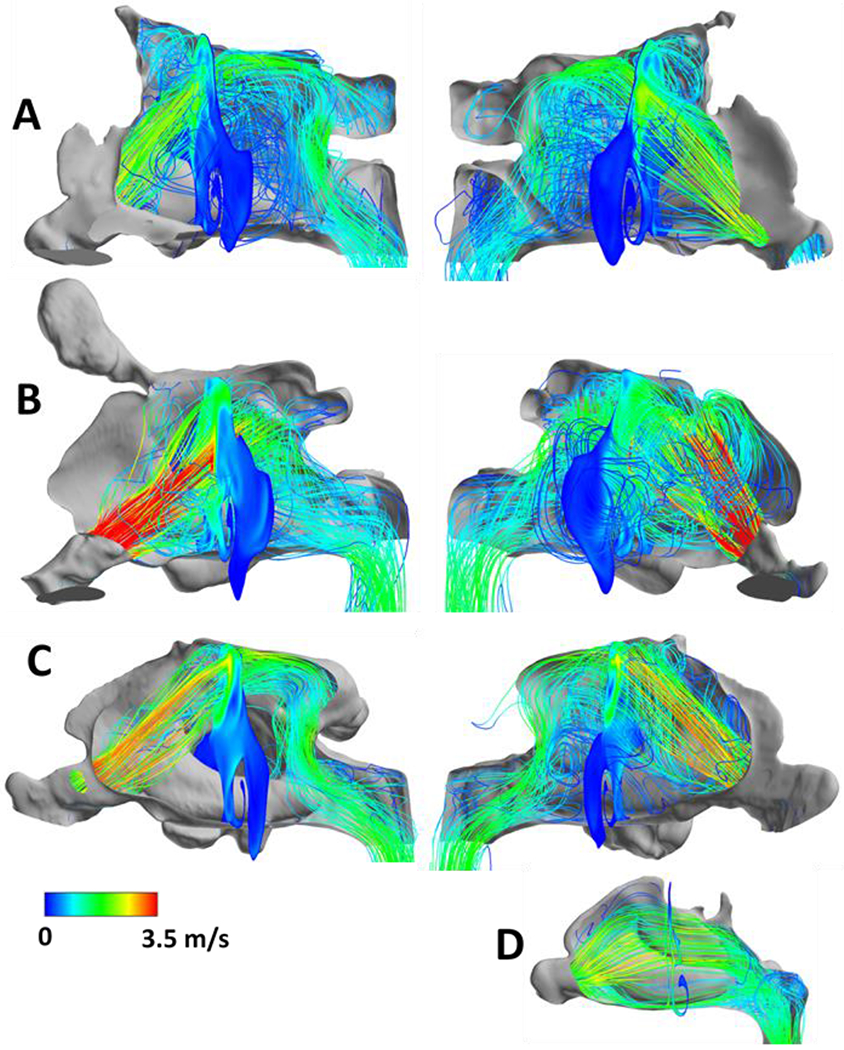
Lateral views of inspiratory airflow streamlines in CFR1 (A), CFR2 (B), CFR3 (C) and from the right nostril of one CT-normal subject (D). Cross-sectional slice shows airflow velocity contours. Left panels in (A), (B), (C) show airflow from right nostril, right panels show airflow from left nostril. Warmer colors indicate areas of greater velocity (m/s), with red indicating higher values. CFR, craniofacial resection.
Our simulations demonstrated decreased humidifying efficiency in CFR compared with CT-normal (CFR: 72.6%, 64.9%, and 66.4%, vs CT-normal, 93.21%; range, 91.72% - 98.03%; Table II). Heating efficiency of CFR was also less than that of CT-normal (CFR:72.6, 64.9, 66.4 % vs average (n=9): 93.2%, range 84.4 – 97.2%). Average heat flux was decreased over the total nasal surface area, as well as maximum heat flux in CFR compared with normal (average heat flux: CFR:,132.70, 134.84, 142.61 W/m2 vs. average (n=9): 193.16 W/m2, range 156.24 – 234.95 W/m2; maximum heat flux: CFR, 6429.7, 7568.6, and 7455.2 W/m2, vs average, 9644.6 W/m2; range, 5835.8 – 15495.0 W/m2). The surface area where heat flux exceeds the stimulation threshold of 50 W/m2 (SAHF50) revealed no substantial difference between CT-normal and CFR (CFR: 86.72, 120.3, 109.9 cm2 vs. CT-normal cohort: average 97.79 cm2 , range 81.83 – 113.77 cm2, Table II). A visual representation of a heat flux distribution (Figure 5) illustrates similarities in the involvement of the inferior turbinate in heating nasal airflow in both CFR and CT-normal, as well as substantial differences in location of heat flux compared to CT-normal nasal cavities with heat flux also occurring at the nasal roof in the CFR cavities and over the middle turbinate in CT-normal cavities.
Figure 5.

Lateral views of areas where heat flux was greater than 50 W/m2 (color) in CFR1 (A), CFR2 (B), CFR3 (C) and left lateral wall of one CT-normal subject (D). Gray areas indicate regions where heat flux was less than 50 W/m2. Left panels in (A), (B), (C) show areas where heat flux was greater than 50 W/m2 on right lateral wall, right panels show areas where heat flux was greater than 50 W/m2 on left lateral wall. Warmer colors indicate areas of greater heat loss, with red indicating higher values. CFR, craniofacial resection.
After completion of healing, all patients were noted to routinely exhibit healthy mucosa on nasal endoscopy without dryness or crusting. Chart review revealed no complaints of nasal congestion, fetid odor, or dryness. Two patients (CFR2 and CFR3) completed ENS6Q and SNOT-22 questionnaires. The ENSQ6 scores were 5 and 0 and SNOT-22 scores were 23 and 0 (CFR2, CFR3).
Discussion
In this preliminary study, we used computational modeling to simulate airflow in three sinonasal cavities from asymptomatic patients after endoscopic CFR. We investigated the resulting nasal physiology and compared to nasal physiology of CT-normal nasal cavities. Despite radical anatomic differences and different airflow patterns, our simulations predicted comparable airflow resistance and stimulated mucosal surface area between the CFR and CT-normal cohorts. Overall heat flux, heating, and humidifying efficiencies were decreased in CFR nasal cavities in comparison to CT-normal. To our knowledge, this is the first report of CFD analysis of nasal models after craniofacial resection.
For oncologic resection of skull base tumors, endoscopic CFR often removes the anatomic structures that enable and optimize nasal air-conditioning4,37. For example, in these studied CFR models, only an anterior septal strut and inferior turbinates remained after surgery. Given that extensive intranasal surgery has correlated with ineffective air conditioning,10,26,38 it is reasonable to assume that CFR patients would report symptoms of congestion, dryness, and crusting. However, the majority deny significant nasal complaints in the long-term postoperative period5,6. In the cohort herein, chart review demonstrated absence of ENS signs and symptoms and two patients reported ENS6Q scores lower than that indicative of ENS with one patient denying any nasal concerns. Similarly, SNOT-22 scores were lower than the mean of patients with chronic rhinosinusitis (CRS); 0 and 23 compared to 41.7 in CRS patients. This study was intended to investigate the phenomenon of minimal symptoms in the CFR population by using CFD simulations.
Traditionally, the study of nasal patency utilized rhinomanometry and focused on resistance to nasal airflow.39,40 With the advent of CFD modeling, additional metrics have been identified, such as heat flux and wall shear stress, that correlate with sensation of nasal patency.13,41,42 Zhao et al42 demonstrated that regional peak mucosal cooling predicted the perception of nasal patency in 22 healthy subjects. Sullivan and colleagues12 found that the surface area where heat flux exceeds 50 W/m2 (SAHF50) during inspiration strongly correlated with patient-reported nasal patency in an analysis of ten patients after surgery for nasal airway obstruction. In this investigation, CFR models demonstrated SAHF50 values comparable to those in CT-normal patients and higher than values in found in subjects with nasal obstruction12. The normal SAHF50 may explain the absence of perceived nasal obstruction which is paradoxically present in patients with ENS. Despite the similarity in SAHF50 values, the overall average heat flux in the CFR cohort was slightly lower (Table II), which may be due in part to somewhat lower maximum flux values in CFR vs CT-normal subjects (Table II).
In normal nasal cavities, the majority of airflow is distributed between the septum and middle and inferior meatus26,29. Our turbulent simulations in CFR models demonstrated dramatically different airflow patterns. With surgically absent nasal septum and middle turbinate, the majority of airflow was directed to the nasal roof. Despite this trajectory, the inferior turbinates (IT) demonstrated substantial interaction with the inspired air and a significant portion of SAHF50 was concentrated at this location (Figure 4 and 5). Previous CFD investigations have highlighted the physiologic importance of ITs noting that the majority of air humidification occurs at the anterior nasal cavity10,26,40. ENS is commonly associated with inferior turbinate resection (ITR) and rarely associated with middle turbinate resection (MTR)43. CFD airflow investigations after ITR have demonstrated decreased nasal resistance, increased nasal airflow, and decreased SAHF509. In patients with ENS, CFD simulation showed that small ITs resulted in decreased airflow intensity around the IT. It is possible that maintaining the inferior turbinate as well the location of stimulated mucosa (SAHF50) at the inferior turbinate results in adequate sensation of nasal patency in CFR nasal cavities.
Humidification efficiency (HE) represents moisture transport through the nasal cavity and normal nasal cavities are optimized for warming and humidifying inspired air4 ,44. HE was notably decreased in CFR models compared with the CT-normal cohort. Similarly, CFD simulations have shown decreased HE after virtual inferior and middle turbinectomy26 and in patients with ENS10. A decreased HE is hypothesized to contribute to the crusting and nasal dryness in patients with ENS. It is unclear why CFR patients do not develop these symptoms that would be expected with this less efficient humidification. It is possible that cellular changes account for this, but these changes cannot be accounted for in CFD simulations.
The pathophysiology of ENS is attributed to radical surgery and altered nasal aerodynamics.7,38 A number of CFD studies have investigated nasal airflow in patients with ENS, allowing comparison with our studied case series.8–10 In Li et al.,8,9 a laminar airflow model demonstrated decreased intensity (by wall shear stress) and rate of airflow, which limited the interaction of inspired air with nasal mucosa. This lack of regional airflow was hypothesized to contribute to ENS symptom of paradoxical nasal congestion. The symptoms of nasal crusting and dryness were attributed to overall decreased water and heat flux by Garcia et al.10 The CFR cohort presented here had radical surgery and resulting abnormal nasal aerodynamics without symptoms of ENS. We hypothesize that turbulent flow within the large volume of CFR sinonasal cavities may allow increased contact with mucosal surfaces to enable sensation of nasal patency.
Mathematical models have been used extensively to analyze nasal airflow patterns in a number of post-surgical conditions.8,11,15,45 These CFD studies have demonstrated a close relation between numerical simulations and in vivo measurements of nasal air conditioning.4,11,46 A laminar airflow is assumed in the majority of studies, which has support in experimental studies of healthy nasal cavities.29,47–49 Other CFD investigations of nasal physiology have used steady state or turbulent models to simulate nasal airflow.15,49–51 However, there are no data on the flow patterns in nasal cavities after extensive surgical resection. In this study, laminar flows were initially trialed; however, these simulations produced increased iteration-to-iteration residuals. A turbulent mathematical model resulted in better residuals and a stabilized equation. The similarity in the resistance values in the CFR and CT-normal groups can be ascribed to the different flow characteristics emerging in turbulence and in laminarity. In the CT-normal cohort, the presence of more anatomical features contribute to the nasal resistance. In CFR models, owing to turbulent mixing,52 the velocity gradient at the wall is higher than that observed in a laminar system at similar Reynolds numbers. Hence, the shear stress at the airway walls is correspondingly larger. This is in agreement with the fact that the losses in turbulent flow are much higher than those in laminar systems.46 Consequently, the pressure drop per unit length is greater in turbulent systems, which is reflected in larger frictional stress at the walls.
The larger pressure drop raises the nasal resistance in CFR models to values similar to those observed in the CT-normal cohort, despite the surgical removal of nasal structures in the former cohort. Simulations presented here may not directly demonstrate that turbulent flows in CFR patients induce sufficient mixing to alleviate heat flux lost from surgically removed tissues, but this hypothesis is suggested by this study and warrants further investigation. In addition, to confirm the validity of our turbulent flow model, in vivo investigation of airflow patterns of CFR nasal cavities are required.
The majority of post-surgical CFD simulations investigate less-extensive operations such as septoplasty and septal perforation repair13,15. Lindemann et al.11 performed virtual removal of lateral nasal wall structures, including the inferior and middle turbinates, and found abnormal airflow patterns; however, this study did not evaluate heat or water transport. The same group showed that in vivo evaluation of midface degloving and ITR resulted in reduced nasal air conditioning capacity53. Conversely, using rhinomanometry, Lueg et al. demonstrated that medial maxillectomy with lateral rhinotomy did not adversely affect nasal airway function40. Our preliminary study demonstrates adequate sensation of nasal patency after maximal endonasal surgery through the variable of SAHF50.
The authors acknowledge limitations to this initial investigation. The first is the lack of in vivo measurements to validate our computational predictions with the true nasal physiology in these unique nasal cavities. In addition, one patient was not available to complete the SNOT-22 and ENS6Q questionnaires. However, review of medical records for all 3 patients revealed no nasal complaints and healthy mucosa on repeated nasal endoscopy. Moreover, larger clinical studies have confirmed general absence of sinonasal complaints in patients after CFR.5,6 Turbulent airflow was assumed in CFR nasal models as this mathematical model resulted in the optimal simulation based on residuals. Comparison studies with in vivo investigations of CFR airflow are indicated to confirm this model. Water evaporation was excluded from this study due to an assumption that the temperature and humidity gradients simulated here would not induce enough evaporation to affect cooling to a substantial degree. Further study is needed to assess potential effects of evaporative cooling on these conclusions. Lastly, this study describes only three CFR models, which do not represent a substantial number for adequate power and statistical analysis. This was limited by the extensive protocol necessary for model creation and simulations. Future studies are warranted with larger numbers of patients to confirm the findings in this preliminary investigation.
Conclusion
In conclusion, in this pilot study, CFD techniques were used to examine the effects of endoscopic CFR on nasal airflow and conditioning. Simulations demonstrated similar areas of stimulated mucosa in the CFR group compared to the CT-normal cohort. The absence of ENS symptoms in most CFR patients may be due to their large stimulated mucosal surface area. Diffuse distribution of stimulated area may result from turbulent mixing of air after CFR. In vivo investigations of temperature and humidity in these nasal cavities are warranted to validate the numerical simulations. More information is needed on the effects of CFR on heat transport, water flux, and airflow patterns. Future directions include the investigation of a larger cohort of CFR patients and evaluation of patient symptoms, as well as interpretation of airflow in symptomatic CFR patients.
Acknowledgements:
The authors would like to acknowledge Maheer Masood for his assistance in data collection.
Footnotes
Disclosures: None
Presented at the 139th annual meeting of the American Rhinologic Society - Combined Otolaryngology Spring Meetings (COSM); April 15-18, 2018, National Harbor, Maryland
References:
- 1.Krischek B, Carvalho FG, Godoy BL, et al. From craniofacial resection to endonasalendoscopic removal of malignant tumors of the anterior skull base. World neurosurgery. 2014; 82(6):S59–S65. [DOI] [PubMed] [Google Scholar]
- 2.Hanna E, DeMonte F, Ibrahim S, et al. Endoscopic resection of sinonasal cancers with andwithout craniotomy: oncologic results. Archives of Otolaryngology–Head & Neck Surgery. 2009; 135(12):1219–1224. [DOI] [PubMed] [Google Scholar]
- 3.Higgins TS, Thorp B, Rawlings BA, Han JK. Outcome results of endoscopic vs craniofacialresection of sinonasal malignancies: a systematic review and pooled-data analysis International forum of allergy & rhinology: Wiley Online Library, 2011:255–261. [DOI] [PubMed] [Google Scholar]
- 4.Naftali S, Rosenfeld M, Wolf M, Elad D. The air-conditioning capacity of the human nose.Annals of biomedical engineering. 2005; 33(4):545–553. [DOI] [PubMed] [Google Scholar]
- 5.Gallagher MJ, Durnford AJ, Wahab SS, et al. Patient-reported nasal morbidity followingendoscopic endonasal skull base surgery. British journal of neurosurgery. 2014; 28(5):622–625. [DOI] [PubMed] [Google Scholar]
- 6.de Almeida JR, Snyderman CH, Gardner PA, Carrau RL, Vescan AD. Nasal morbidity following endoscopic skull base surgery: a prospective cohort study. Head & neck. 2011; 33(4):547–551. [DOI] [PubMed] [Google Scholar]
- 7.Sozansky J, Houser SM. Pathophysiology of empty nose syndrome. The Laryngoscope. 2015;125(1):70–74. [DOI] [PubMed] [Google Scholar]
- 8.Li C, Farag AA, Leach J, et al. Computational fluid dynamics and trigeminal sensory examinations of empty nose syndrome patients. The Laryngoscope. 2017; 127(6). [DOI] [PMC free article] [PubMed] [Google Scholar]
- 9.Li C, Farag AA, Maza G, et al. Investigation of the abnormal nasal aerodynamics andtrigeminal functions among empty nose syndrome patients International forum of allergy & rhinology: Wiley Online Library, 2018:444–452. [DOI] [PMC free article] [PubMed] [Google Scholar]
- 10.Garcia GJ, Bailie N, Martins DA, Kimbell JS. Atrophic rhinitis: a CFD study of air conditioning in the nasal cavity. Journal of applied physiology. 2007; 103(3):1082–1092. [DOI] [PubMed] [Google Scholar]
- 11.Lindemann J, Brambs H-J, Keck T, et al. Numerical simulation of intranasal airflow after radical sinus surgery. American journal of otolaryngology. 2005; 26(3):175–180. [DOI] [PubMed] [Google Scholar]
- 12.Sullivan CD, Garcia GJ, Frank-Ito DO, Kimbell JS, Rhee JS. Perception of better nasal patency correlates with increased mucosal cooling after surgery for nasal obstruction. Otolaryngology--Head and Neck Surgery. 2014; 150(1):139–147. [DOI] [PMC free article] [PubMed] [Google Scholar]
- 13.Kimbell J, Frank D, Laud P, Garcia G, Rhee J. Changes in nasal airflow and heat transfer correlate with symptom improvement after surgery for nasal obstruction. Journal of biomechanics. 2013; 46(15):2634–2643. [DOI] [PMC free article] [PubMed] [Google Scholar]
- 14.Frank DO, Zanation AM, Dhandha VH, et al. Quantification of airflow into the maxillary sinuses before and after functional endoscopic sinus surgery International forum of allergy & rhinology: Wiley Online Library, 2013:834–840. [DOI] [PMC free article] [PubMed] [Google Scholar]
- 15.Cannon DE, Frank DO, Kimbell JS, Poetker DM, Rhee JS. Modeling nasal physiology changes due to septal perforations. Otolaryngology--Head and Neck Surgery. 2013; 148(3):513–518. [DOI] [PMC free article] [PubMed] [Google Scholar]
- 16.Kimbell JS, Garcia GJ, Frank DO, et al. Computed nasal resistance compared with patient-reported symptoms in surgically treated nasal airway passages: a preliminary report. American journal of rhinology & allergy. 2012; 26(3):e94. [DOI] [PMC free article] [PubMed] [Google Scholar]
- 17.Frank DO, Kimbell JS, Cannon D, Rhee JS. Computed intranasal spray penetration: comparisons before and after nasal surgery International forum of allergy & rhinology: Wiley Online Library, 2013;3(1):48–55. [DOI] [PMC free article] [PubMed] [Google Scholar]
- 18.Li L, Han D, Zhang L, et al. Aerodynamic investigation of the correlation between nasal septal deviation and chronic rhinosinusitis. The Laryngoscope. 2012; 122(9):1915–1919. [DOI] [PubMed] [Google Scholar]
- 19.Kassam AB, Thomas A, Carrau RL, et al. Endoscopic reconstruction of the cranial base using a pedicled nasoseptal flap. Operative Neurosurgery. 2008; 63(suppl_1):ONS44–ONS53. [DOI] [PubMed] [Google Scholar]
- 20.Hopkins C, Gillett S, Slack R, Lund V, Browne J. Psychometric validity of the 22-item Sinonasal Outcome Test. Clinical otolaryngology. 2009; 34(5):447–454. [DOI] [PubMed] [Google Scholar]
- 21.Velasquez N, Thamboo A, Habib ARR, Huang Z, Nayak JV. The Empty Nose Syndrome 6-Item Questionnaire (ENS6Q): a validated 6-item questionnaire as a diagnostic aid for empty nose syndrome patients International forum of allergy & rhinology: Wiley Online Library, 2017; 7(1):64–71. [DOI] [PubMed] [Google Scholar]
- 22.Frank-Ito DO, Wofford M, Schroeter JD, Kimbell JS. Influence of mesh density on airflow and particle deposition in sinonasal airway modeling. Journal of aerosol medicine and pulmonary drug delivery. 2016; 29(1):46–56. [DOI] [PMC free article] [PubMed] [Google Scholar]
- 23.Basu S,Witten N, Kimbell J. Influence of localized mesh refinement on numerical simulations of post-surgical sinonasal airflow Journal of aerosol medicine and pulmonary drug delivery, 2017:14–14.27336220 [Google Scholar]
- 24.Keeler JA, Patki A, Woodard CR, Frank-Ito DO. A computational study of nasal spray deposition pattern in four ethnic groups. Journal of aerosol medicine and pulmonary drug delivery. 2016; 29(2):153–166. [DOI] [PMC free article] [PubMed] [Google Scholar]
- 25.Garcia GJ, Schroeter JD, Segal RA, et al. Dosimetry of nasal uptake of water-soluble and reactive gases: a first study of interhuman variability. Inhalation toxicology. 2009; 21(7):607–618. [DOI] [PubMed] [Google Scholar]
- 26.Dayal A, Rhee JS, Garcia GJ. Impact of middle versus inferior total turbinectomy on nasal aerodynamics. Otolaryngology--Head and Neck Surgery. 2016; 155(3):518–525. [DOI] [PMC free article] [PubMed] [Google Scholar]
- 27.Kim I, Pearlstein AJ. Stability of the flow past a sphere. Journal of Fluid Mechanics. 1990;21173–93. [Google Scholar]
- 28.Johnson T, Patel V. Flow past a sphere up to a Reynolds number of 300. Journal of Fluid Mechanics. 1999; 37819–70. [Google Scholar]
- 29.Kelly J, Prasad A, Wexler A. Detailed flow patterns in the nasal cavity. Journal of applied physiology. 2000; 89(1):323–337. [DOI] [PubMed] [Google Scholar]
- 30.Brandon BM, Austin GK, Fleischman G, et al. Comparison of Airflow Between Spreader Grafts and Butterfly Grafts Using Computational Flow Dynamics in a Cadaveric Model. JAMA Facial Plastic Surgery. 2018; 20(3):215–221. [DOI] [PMC free article] [PubMed] [Google Scholar]
- 31.Basu S, Frank-Ito DO, Kimbell JS. On computational fluid dynamics models for sinonasal drug transport: Relevance of nozzle subtraction and nasal vestibular dilation. Int J Numer Method Biomed Eng. 2018; 34(4):e2946. [DOI] [PMC free article] [PubMed] [Google Scholar]
- 32.Perkins EL, Basu S, Garcia GJM, et al. Ideal Particle Sizes for Inhaled Steroids Targeting Vocal Granulomas: Preliminary Study Using Computational Fluid Dynamics. Otolaryng Head Neck. 2018; 158(3):511–519. [DOI] [PMC free article] [PubMed] [Google Scholar]
- 33.Pope SB. Turbulent flows. New York: Cambridge University Press, 2000. [Google Scholar]
- 34.Walenga RL, Tian G, Hindle M, et al. Variability in nose-to-lung aerosol delivery. Journal of aerosol science. 2014; 7811–29. [DOI] [PMC free article] [PubMed] [Google Scholar]
- 35.Longest PW, Tian G, Khajeh-Hosseini-Dalasm N, Hindle M. Validating whole-airway CFD predictions of DPI aerosol deposition at multiple flow rates. Journal of Aerosol Medicine and Pulmonary Drug Delivery. 2016; 29(6):461–481. [DOI] [PMC free article] [PubMed] [Google Scholar]
- 36.Matida EA, Finlay WH, Lange CF, Grgic B. Improved numerical simulation of aerosol deposition in an idealized mouth–throat. Journal of Aerosol Science. 2004; 35(1):1–19. [Google Scholar]
- 37.Keck T, Leiacker R, Riechelmann H, Rettinger G. Temperature profile in the nasal cavity. The Laryngoscope. 2000; 110(4):651–654. [DOI] [PubMed] [Google Scholar]
- 38.Scheithauer MO. Surgery of the turbinates and “empty nose” syndrome. GMS current topicsin otorhinolaryngology, head and neck surgery. 2010; 9. [DOI] [PMC free article] [PubMed] [Google Scholar]
- 39.Andre R, Vuyk H, Ahmed A, Graamans K, Nolst Trenite G. Correlation between subjective and objective evaluation of the nasal airway. A systematic review of the highest level of evidence. Clinical otolaryngology. 2009; 34(6):518–525. [DOI] [PubMed] [Google Scholar]
- 40.Lueg EA, Irish JC, Roth Y, et al. An objective analysis of the impact of lateral rhinotomy and medial maxillectomy on nasal airway function. The Laryngoscope. 1998; 108(9):1320–1324. [DOI] [PubMed] [Google Scholar]
- 41.Elad D, Naftali S, Rosenfeld M, Wolf M. Physical stresses at the air-wall interface of the human nasal cavity during breathing. Journal of applied physiology. 2006; 100(3):1003–1010. [DOI] [PubMed] [Google Scholar]
- 42.Zhao K, Jiang J, Blacker K, et al. Regional peak mucosal cooling predicts the perception of nasal patency. The Laryngoscope. 2014; 124(3):589–595. [DOI] [PMC free article] [PubMed] [Google Scholar]
- 43.Houser SM. Empty nose syndrome associated with middle turbinate resection. Otolaryngol Head Neck Surg. 2006; 135:972–973. [DOI] [PubMed] [Google Scholar]
- 44.Naftali S, Schroter R, Shiner R, Elad D. Transport phenomena in the human nasal cavity: a computational model. Annals of biomedical engineering. 1998; 26(5):831–839. [DOI] [PubMed] [Google Scholar]
- 45.Bertin F, Barat J, Wilson R. Energy dissipation rates, eddy diffusivity, and the Prandtl number: An in situ experimental approach and its consequences on radar estimate of turbulent parameters. Radio Sci. 1997; 32(2):791–804. [Google Scholar]
- 46.Warhaft Z “The engine and the atmosphere: An introduction to engineering.” (1998). [Google Scholar]
- 47.Lindemann J, Keck T, Wiesmiller K, et al. A numerical simulation of intranasal air temperature during inspiration. The Laryngoscope. 2004; 114(6):1037–1041. [DOI] [PubMed] [Google Scholar]
- 48.Keyhani K, Scherer PW, Mozell MM. Numerical simulation of airflow in the human nasal cavity. J Biomech Eng. 1995; 117(4):429–441. [DOI] [PubMed] [Google Scholar]
- 49.Xi JX, Longest PW. Numerical predictions of submicrometer aerosol deposition in the nasal cavity using a novel drift flux approach. Int J Heat Mass Tran. 2008; 51(23–24):5562–5577. [Google Scholar]
- 50.Segal RA, Kepler GM, Kimbell JS. Effects of differences in nasal anatomy on airflow distribution: A comparison of four individuals at rest. Annals of biomedical engineering. 2008; 36(11):1870–1882. [DOI] [PubMed] [Google Scholar]
- 51.Zhao K, Jiang J. What is normal nasal airflow? A computational study of 22 healthy adults International forum of allergy & rhinology: Wiley Online Library, 2014:435–446. [DOI] [PMC free article] [PubMed] [Google Scholar]
- 52.Sreenivasan Katepalli R. “Turbulent mixing: A perspective.” Proceedings of the NationalAcademy of Sciences (2018): 201800463. [DOI] [PMC free article] [PubMed] [Google Scholar]
- 53.Lindemann J, Leiacker R, Sikora T, Rettinger G, Keck T. Impact of unilateral sinus surgery with resection of the turbinates by means of midfacial degloving on nasal air conditioning. The Laryngoscope. 2002; 112(11):2062–2066. [DOI] [PubMed] [Google Scholar]