

Abstract
Sumoylation is the covalent attachment of small ubiquitin-like modifier (SUMO) to a target protein. Similar to other ubiquitin-like pathways, three enzyme types are involved that act in succession: an activating enzyme (E1), a conjugating enzyme (E2), and a ligase (E3). To date, unlike other ubiquitin-like mechanisms, sumoylation of the target RanGAP1 (TargetRanGAP1) does not absolutely require the E3 of the system, RanBP2 (E3RanBP2), since the presence of E2 (E2Ubc9) is enough to sumoylate TargetRanGAP1. However, in the presence of E3, sumoylation is more efficient. To understand the role of the target specificity of E3RanBP2 and E2RanBP2, we carried out molecular dynamics simulations for the structure of E2Ubc9–SUMO–TargetRanGAP1 with and without the E3RanBP2 ligase. Analysis of the dynamics of E2Ubc9–SUMO–TargetRanGAP1 in the absence and presence of E3RanBP2 revealed that two different allosteric sites regulate the ligase activity: (i) in the presence of E3RanBP2, the E2Ubc9’s loop 2; (ii) in the absence of E3RanBP2, the Leu65–Arg70 region of SUMO. These results provide a first insight into the question of how E3RanBP2 can act as an intrinsic E3 for E2Ubc9 and why, in its absence, the activity of E2Ubc9–SUMO–TargetRanGAP1 could still be maintained, albeit at lower efficiency.
Keywords: Ubc9-RanGAP1, molecular dynamics, allostery, sumoylation cascade, E3-RanBP2
Introduction
Ubiquitin (Ub) and ubiquitin-like (Ubl) modifiers are proteins that mediate the post-transcriptional modification of specific targets. The small ubiquitin-like modifier (SUMO) family is a member of the Ub/Ubl superfamily. Four SUMO types were identified in mammals: SUMO-1, −2, −3, and −4.1–3 There are more than 100 SUMO targets for sumoylation, which are involved in, for example, subcellular localization, signal transduction, metabolic and transcriptional regulation, and modified enzyme activity.4,5 Disturbing the sumoylation cascade can lead to neurological disorders such as Parkinson and Alzheimer diseases, loss of the genome integrity, developmental faults, and cancer.2,6,7 SUMO conjugation involves a sequential cascade of three enzymes: SUMO activating enzyme (E1), SUMO-conjugating enzyme (E2), and SUMO ligase (E3). Initially, a protease cleaves the C-terminus of SUMO, exposing its Gly-Gly motif, which is next adenylated by an E1. The catalytic cysteine of the E1 attacks the adenylated C-terminus and forms a thioester bond, which is subsequently transferred to the E2 cysteine. In the last conjugation step, SUMO is transferred to an ɛ-amino group of a target lysine by the E3 enzyme.8–14 It is currently believed that E3 is needed for two reasons: it can act as an adapter for SUMO and E2, thus imposing target specificity, and it enhances conjugation.8,13,14 However, SUMO conjugation can also work well without an E3 for some targets that E2 recognizes and leads in in vivo sumoylation as, for example, in RanGAP1, p53, and IκBα targets.3
Although the general mechanism of sumoylation is known, the dynamic process on the atomic level and how signals are communicated in the structure are still open questions. For the last step of the conjugation (E2–E3–SUMO-1–Target), only one structure is available (PDB ID: 1Z5S)15 (Fig. 1a). In this structure, Ubc9 is the E2 enzyme (E2Ubc9), RanGAP1 is the target (TargetRanGAP1), RanBP2 (E3RanBP2) is the E3 enzyme, and SUMO-1 (SUMO) is conjugated to the catalytic lysine of the target.
Fig. 1.

(a) Stereo view of the E2Ubc9–E3RanBP2–SUMO–TargetRanGAP1 complex (PDB ID: 1Z5S). E2Ubc9 is colored yellow, E3RanBP2 is in blue, SUMO is in green, and TargetRanGAP1 in red. Left: Each protein is labeled and shown in cartoon and transparent surface representation. Right: The functional and structural important regions are colored in green-cyan and are represented in cartoon and transparent surface. The depicted regions of E2Ubc9 are loop 2 (L2), Target binding site (bsTarget), catalytic residue (E2catalytic), and inherent E3 region of E2Ubc9 (E3built-in). For TargetRanGAP1, E2Ubc9 binding sites (bsE2) and its catalytic residue (Targetcatalytic) are highlighted. The catalytic residues of both E2Ubc9 (Cys93) and TargetRanGAP1 (Lys524) are shown as stick representations (red). (b) Modeling of the thioester bond. In the crystal structure of the E2Ubc9–E3RanBP2–SUMO–TargetRanGAP1 complex, the C-terminal tail of SUMO (Gly97) is attached to the catalytic lysine (Lys524) of TargetRanGAP1 via an isopeptide bond. In order to observe the sequence of events that lead the system to catalysis, this isopeptide bond is broken and a new thioester bond is modeled between E2Ubc9 (Cys93) and SUMO (Gly97).
The E2Ubc9 is highly conserved across species, and it is the only E2 enzyme known for SUMO family members.3 It has the conserved superfold (UBC), which exists in all E2s of the Ub/Ubl superfamily. Among the E2s, there are some insertions into the UBC domain. In E2Ubc9, there are only two amino acid insertions, Asp100 and Lys101.16 These sites were suggested to have a role in target recognition.16 The target interacting regions of E2Ubc9 can be divided into two: (i) Lys74, Tyr87, Ser89, Thr91, Asp127, Pro128, and Ala 129, which form a catalytic pocket around the catalytic Cys93 of Ubc9 and the catalytic loop (Lys523–Glu526) of TargetRanGAP1,5,15,17–21 and (ii) the Ala131–Gln139 interface (third α-helix) of E2Ubc9, which helps in forming a stable complex with TargetRanGAP1 (Fig. 1a). This binding site is unique among E2–Target pairs and is called “built-in E3,”8 since E2Ubc9 can function as an E2 enzyme even in the absence of an E3 by utilizing this additional binding site.5,17,22
The consensus SUMO interaction motif (SIM) on TargetRanGAP1 is ΨKX[D/E], where Ψ is an aliphatic or branched residue such as Ile, Val, or Leu; K is the lysine residue to which SUMO is conjugated; × is any residue; and D/E is aspartate or glutamate. The SUMO consensus motif is located between residues 523 and 526 (LKSE)5,18–21 (Fig. 1a). The lysine residue, which attacks the thioester bond between SUMO and E2, is at position 524.17 The two TargetRanGAP1 helices facing the “built-in E3” of Ubc9 lie between Thr511 and Leu522 and between Leu555 and Pro56617 (Fig. 1a). TargetRanGAP1 without sumoylation is a cytosolic protein. It moves to the nuclear envelope during cell division and interacts with E3RanBP2 after sumoylation.17,23,24
SUMO ligase E3RanBP2 is a large protein with 300 residues, but only a fragment was crystallized (Ser2629–Ser2693).15 It has binding sites for E2Ubc9, SUMO, and TargetRanGAP1 (Fig. 1a). The interaction surface between E2Ubc9 and E3RanBP2 is not a conserved E2–E3 interface, and the distance between this interface and the catalytic Cys of Ubc9 is more than 30 Å.25 Several propositions have been made for the role of E3RanBP2 in the sumoylation cascade: (i) Since E3RanBP2 affects TargetRanGAP1 sumoylation in vivo but not in vitro, and E2Ubc9 has an additional E2–Target interface, it was proposed that TargetRanGAP1 is sumoylated in order to form a stable complex with E3RanBP2 at the nuclear pore3,15,20,21,25,26,27; (ii) E3RanBP2 helps target sumoylation through an allosteric mechanism. Fixing the two reactants, E2Ubc9 and SUMO, reduces the entropic cost of the system lowering the transition state barrier.15,22 Related to this proposition, (iii) E3RanBP2 optimally orients the structures, thus lowering the chance of nonproductive E2–SUMO conformations.15,17,22,28 E3RanBP2 was also proposed (iv) to promote the dissociation of the sumoylated target from the complex29 and (v) to protect the sumoylated TargetRanGAP1 from isopeptidases.27
To clarify the catalytic role of E3RanBP2 in the E2Ubc9–E3RanBP2–SUMO–TargetRanGAP1 system, we carried out molecular dynamics (MD) simulations. We modeled the step prior to catalysis, where the isopeptide bond between SUMO and TargetRanGAP1 is broken and a new thioester bond between SUMO and E2Ubc9 is formed. The modeling is performed on the crystal structure of E2Ubc9–E3RanBP2–SUMO–TargetRanGAP1 (1Z5S) with and without E3RanBP2 (Fig. 1b). In this work, we focused on the E2–Target dynamics in the absence and presence of E3RanBP2, as the E2Ubc9–SUMO complex dynamics were investigated earlier.30 Comparative analyses between the MD simulations of the E2Ubc9–E3RanBP2–SUMO–TargetRanGAP1 and E2Ubc9–SUMO–TargetRanGAP1 complexes revealed that E3RanBP2 provides slower exchange between the conformational ensembles for E2Ubc9–SUMO–TargetRanGAP1, which may result in a decrease of the system’s entropic cost as proposed by Reverter and Lima.15 Furthermore, both in the absence and presence of the E3RanBP2, the E2Ubc9–TargetRanGAP1 interface residues are dynamically coupled, although to a lower extent in the absence of E3RanBP2. As an explanation to the question of the role of E3RanBP2 and how catalysis can be performed in its absence, we show that the system of E2Ubc9–SUMO–TargetRanGAP1 could work through two distinct allosteric mechanisms: in the presence of E3RanBP2, allostery is induced by E2Ubc9, and in the absence of E3RanBP2, by SUMO.
Results
E3RanBP2 is an allosteric effector of the E2Ubc9–SUMO–TargetRanGAP1 complex
The behavior of the E2Ubc9–E3RanBP2–SUMO–TargetRanGAP1 complex structure and its individual chains in the 48.5-ns MD simulation is first characterized by the root mean square deviation (RMSD) from the minimized X-ray structure. The overall structure is stable with low amplitude fluctuations. Since E3RanBP2 is a fragment,15 it presents high-amplitude RMSD fluctuations (Table 1). The RMSD of E2Ubc9 suggests a relatively significant conformational change early in the simulations (at 16 ns) (Fig. 2a and b). Different from E3RanBP2 and E2Ubc9, the RMSD of TargetRanGAP1 and SUMO has a relatively stable profile (Table 1; Fig. 2a).
Table 1.
Various RMSD values for the E2Ubc9–E3RanBP2–SUMO–TargetRanGAP1 and E2Ubc9–SUMO–TargetRanGAP1 complex trajectories
| E2Ubc9–E3RanBP2–SUMO–TargetRanGAP1 | E2Ubc9–SUMO–TargetRanGAP1 | |
|---|---|---|
| Overall RMSD (Å) | 2.4±0.5 (3.6–0.6)a | 2.2±0.4 (4.2–0.6) |
| 2.1±0.4 (3.3–0.6)b | ||
| Individual chain-based RMSD (Å) | ||
| SUMO | 1.3±0.2 (1.9–0.5) | 1.5±0.2 (2.2–0.5) |
| E2Ubc9 | 1.9±0.5 (2.8–0.5) | 1.3±0.2 (2.1–0.6) |
| TargetRanGAP1 | 1.3±0.2 (2.0–0.6) | 1.5±0.3 (2.5–0.5) |
| E3RanBP2 | 3.2±0.9 (5.7–0.6) | — |
Each entry corresponds to mean±SD of the RMSD values. The maximum and minimum values of the data set are indicated in parentheses.
The RMSD is calculated over the trajectory of E2Ubc9–E3RanBP2–SUMO–TargetRanGAP1.
Before calculating the RMSD of the E2Ubc9–E3RanBP2–SUMO–TargetRanGAP1 complex, E3RanBP2 is extracted from the system. Thus, the reported results are calculated over three monomers: E2Ubc9–SUMO–TargetRanGAP1.
Fig. 2.

(a) RMSD evaluation of the E2Ubc9–E3RanBP2–SUMO–TargetRanGAP1 complex over the time course of the simulation of 48.5 ns. The color code of each line is indicated in the legend. (b) Extent of the conformational change observed in loop 2 of E2Ubc9. Loop 2 is represented in transparent surface and cartoon and the rest of E2Ubc9 is shown in cartoon. The white snapshot is extracted from 10 ns and the yellow one from 24 ns. (c) RMSD evaluation of the E2Ubc9–SUMO–TargetRanGAP1 complex over the time course of the simulation of 43 ns. The color code of each line is indicated in the legend.
The observed RMSD jump of E2Ubc9 is mainly due to the conformational change of the loop between residues Lys30 and Thr35 (loop 2), where Asp33 has the highest mobility. Loop 2 is the most mobile part of E2Ubc9, as also revealed by the mean-square fluctuations (MSF) of the residues (Table 2). Loop 2’s mobility is coordinated via a hinge-like behavior of residues Phe24 and Glu42. Interestingly, the comparison of the E2Ubc9 fluctuations in the isolated state and in the E2Ubc9–SUMO–TargetRanGAP1 complex structure, with and without E3RanBP2, indicates that loop 2 becomes more mobile when E2Ubc9 is bound to SUMO and TargetRanGAP1 and strikingly gains further mobility upon E3RanBP2 binding (Table 2). On the other hand, E2Ubc9’s two functional regions, mainly the catalytic cysteine (Cys93) and the built-in E3 (third α-helix), assume already rather restricted fluctuations upon SUMO and TargetRanGAP1 binding (Table 2).
Table 2.
Indication of E2Ubc9’s important atomic positional fluctuation values (in angstrom)a
| Isolated E2Ubc9 | E2Ubc9–E3RanBP2–SUMO–TargetRanGAP1 | E2Ubc9–SUMO–TargetRanGAP1 | |
|---|---|---|---|
| For the whole simulation time | |||
| E2Ubc9’s loop 2 | 3.7±1.9 | 19.9±13.6 | 8.6±4.9 |
| The whole protein except loop 2 | 0.7±0.7 | 0.6±0.6 | 0.6±0.6 |
| E2Ubc9’s catalytic Cys | 1.8 | 0.3 | 0.2 |
| E2Ubc9’s built-in E3 | 1.1±0.2 | 0.8±0.3 | 0.6±0.3 |
| For specific time periods of E2Ubc9–E3RanBP2–SUMO–TargetRanGAP1 | |||
| 2–15 ns | 19–24 ns | 25–30 nsb | |
| E2Ubc9’s loop 2 | 4.5±2.8 | 4.5±2.8 | 4.1±2.3 |
| E3RanBP2’s flexible linker (Asp2665–Asp2673) | 6.3±4.1 | 5.0±4.2 | 3.1±1.5 |
| For specific time periods of E2Ubc9–SUMO–TargetRanGAP1 | |||
| 5.5–7.5 nsb | 17–25 ns | ||
| E2Ubc9’s loop 2 | 1.6±0.4 | 3.0±2.2 | |
Each entry corresponds to mean±SD of the atomic positional fluctuation values. The maximum and minimum values of the data set are indicated in parentheses.
The time intervals are selected from the time windows where no strong correlation is observed at the E2Ubc9–TargetRanGAP1 interface.
To identify the major sampled conformational states, the MD trajectory of E2Ubc9–E3RanBP2–SUMO–TargetRanGAP1 is clustered by the RMSD between the conformations. When clustering at 2.5-Å RMSD, six clusters are generated (Fig. 3a). The RMSD jump of E2Ubc9 with loop 2’s motion is reflected in the transition from the first to the second cluster. Analysis of the conformational ensemble of the first and second clusters reveals that there is a transition between the two dominant conformations of E2Ubc9’s loop 2, a twisted and bent conformation and a relatively stable state also observed in the starting X-ray structure (PDB: 1Z5S; Fig. 2b). When plotting the clusters’ evolution with respect to time, the simulation divides into six windows (Fig. 3a). For each time window and the entire simulation, the network of correlated fluctuations is calculated and illustrated as a correlation map. The most important coupled fluctuations that could be ascribed function are those observed between the E2Ubc9 binding sites of TargetRanGAP1 and the E2 binding sites of TargetRanGAP1 (Fig. 1a; Supplementary Fig. S2a). The fluctuations of E2Ubc9’s loop 2 demonstrate strong correlations with the fluctuations of one of the explicit E2Ubc9 binding sites (Leu555–Pro566) of TargetRanGAP1 for the whole simulation time. Further, during 77.5% (2–38 ns) of the simulation time, there is a correlation between the fluctuations of E2Ubc9’s loop 2 and the SIM of TargetRanGAP1 (Fig. 4). The latter correlation is persistently high in the first (2–15 ns) and third (19–24 ns) clusters and resides in 38.7% of the simulation time. Coupled to this, Asp33 of loop 2 is at its most mobile and flexible state during this time (Table 2). Along this time, Asp2665–Asp2673 on E3RanBP2, which is a flexible linker connecting the two major helices of E3RanBP2, displayed a unique mobile and slightly flexible behavior (Table 2). Taken together, these lead us to suggest that E3RanBP2 helps organize the network of coupled fluctuations of E2Ubc9 and thus of E2Ubc9–TargetRanGAP1 binding via E2Ubc9’s loop 2.
Fig. 3.
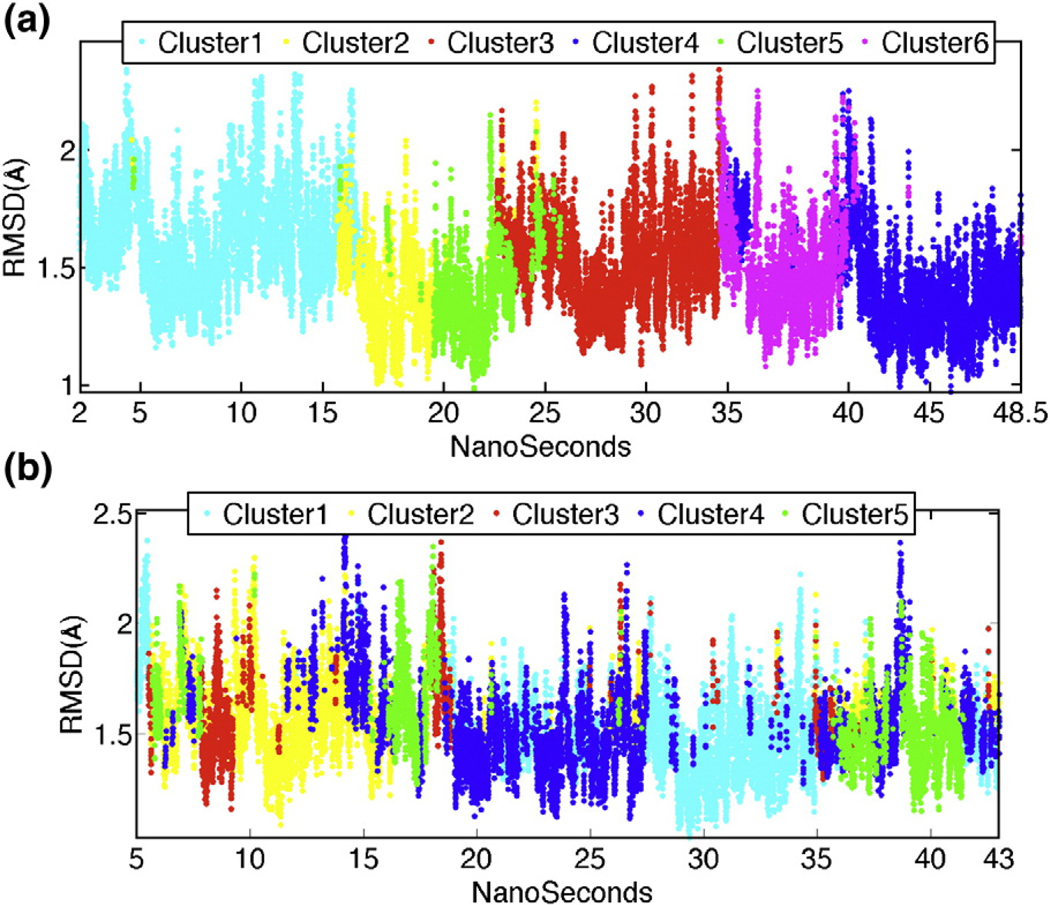
(a) RMSD evaluation of the E2Ubc9–E3RanBP2–SUMO–TargetRanGAP1 complex after clustering with an RMSD threshold of 2.5 Å over the time course of the simulation of 48.5 ns. The color code of each line represents a different conformational ensemble. (b) RMSD evaluation of the E2Ubc9–SUMO–TargetRanGAP1 complex after clustering with an RMSD threshold of 2.5 Å over the time course of the simulation of 43 ns. The color code of each line represents a different conformational ensemble.
Fig. 4.
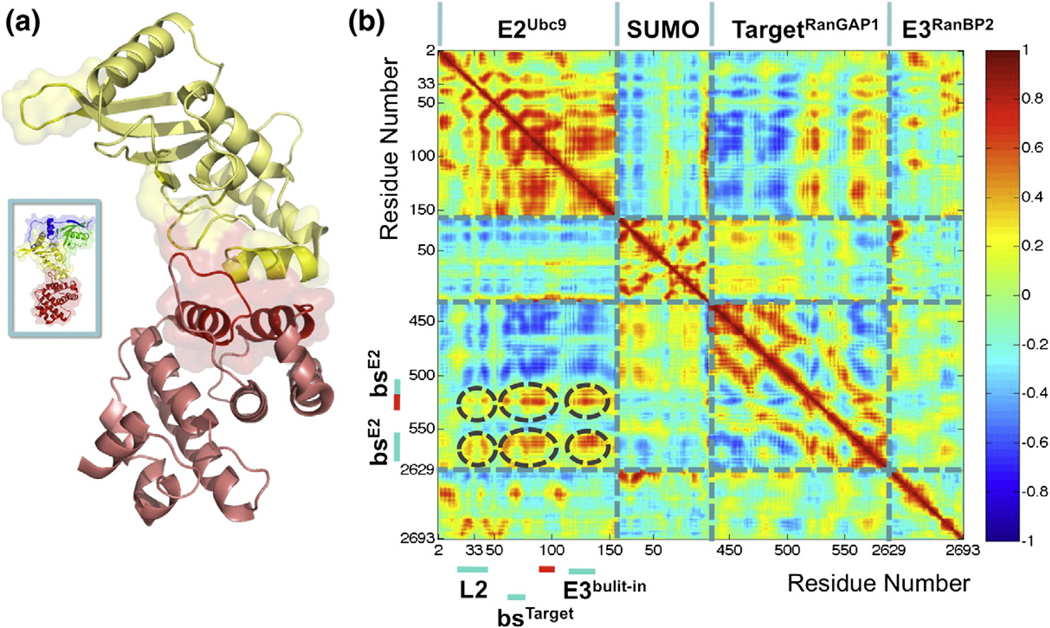
(a) Regions of the E2Ubc9–TargetRanGAP1 complex that show coupled correlated fluctuations. The monomer positions of the illustrated E2Ubc9 (yellow)–TargetRanGAP1 (dark red) complex are extracted from the PDB entry 1Z5S. The cartoon and transparent surface represented regions correspond to the encircled correlations on the left panel. The spatial arrangement of the E2Ubc9–TargetRanGAP1 complex in the overall configuration of the E2Ubc9–E3RanBP2–SUMO–TargetRanGAP1 complex is shown in the box on the left. (b) The coupled correlated fluctuations observed for the E2Ubc9–E3RanBP2–SUMO–TargetRanGAP1 complex imply an allosteric effect. The correlation plot is derived from the E2Ubc9–E3RanBP2–SUMO–TargetRanGAP1 complex trajectory within the time interval of 2–15 ns. The coloring scheme is the same as in Fig. 2a.In the plot, the important correlations are encircled in dark grey. Where these encircled regions correspond to on E2Ubc9 and TargetRanGAP1 are also highlighted next to the axes. The highly correlated regions spotted in circles show that the loop 2 of E2Ubc9 moves in accordance with the functional and structural important regions of the E2Ubc9–TargetRanGAP1 complex.
Asp33 of E2Ubc9’s loop 2 is 38.5 Å away from the catalytic lysine of TargetRanGAP1, yet its fluctuations are coupled to the catalytic SIM and E2Ubc9 binding site of TargetRanGAP1. Interestingly, Asp33, the most mobile and flexible residue of E2Ubc9’s loop 2, has been strongly conserved in evolution.31 Asp33’s dynamics with respect to the E2Ubc9–TargetRanGAP1interface, its conservation, and its position with respect to E3RanBP2 suggest that E3RanBP2 is an allosteric effector of the E2Ubc9–E3RanBP2–SUMO–TargetRanGAP1 complex.
An alternative sumoylation mechanism in the absence of E3RanBP2
The dynamics of the E2Ubc9–SUMO–TargetRanGAP1 complex structure is analyzed with respect to the same complex in the presence of E3RanBP2. The RMSD values of the E2Ubc9–SUMO–TargetRanGAP complex structure and its individual chains with and without E3RanBP2 revealed that the absence of E3RanBP2 does not affect the average RMSD values, yet the range of the RMSD fluctuations differs. Further, removal of E3RanBP2 results in higher RMSD values for TargetRanGAP1 and SUMO (Table 1; Fig. 2c). E2Ubc9, however, does not reflect any RMSD jumps as observed in the presence of E3RanBP2 (Fig. 2c). Thus, E3RanBP2 affects the conformational space spanned both by the E2Ubc9–SUMO–TargetRanGAP1 complex structure and its individual chains, which implies both conformational and configurational structural changes.
To compare the ensembles of conformations visited in E2Ubc9–SUMO–TargetRanGAP1 with and without E3RanBP2, we followed a step-by-step approach. First, we clustered the conformations from the simulations with and without E3RanBP2, with an RMSD radius of 3 Å. The absence of a joint cluster of conformations suggests that E2Ubc9–SUMO–TargetRanGAP1 with and without E3RanBP2 do not display similar conformational states (Table 3). As discussed below, this is likely to be due to the orientation change of SUMO observed in the absence of E3RanBP2 (Fig. 5a). The joined conformational ensembles are next searched for E2Ubc9 conformations only (with 2.5-Å RMSD radius). This analysis showed that almost for the whole simulation time of the E2Ubc9–SUMO–TargetRanGAP1 complex, the twisted/bent conformation of the E2Ubc9 loop 2 is not visited (Table 3). For a finer search of the conformational states, individual clustering and clustering of the conformations from the trajectory without E3RanBP2 are performed similarly as with E3RanBP2, except using different RMSD radii (2.2 Å and 2.5 Å). The distribution of clusters (16 and 5 for 2.2 Å and 2.5 Å radius, respectively) along time showed that the transitions between different conformational states are more frequent without E3RanBP2 (Fig. 3b). The 2.2-Å RMSD yielded a better distribution of the clusters’ evolution as compared to 2.5 Å, more conveniently dividing the trajectory into time windows (Fig. 3b; Supplementary Fig. S1).
Table 3.
The distribution of the conformations revealed by joint clustering
| E2Ubc9–E3RanBP2–SUMO–TargetRanGAP1 | E2Ubc9–SUMO–TargetRanGAP1 | |
|---|---|---|
| E2Ubc9–SUMO–TargetRanGAP1 | ||
| Ensemble 1 | 100 | 0 |
| Ensemble 2 | 0 | 71.5 |
| Ensemble 3 | 0 | 28.2 |
| Total | 100 | 100 |
| E2Ubc9 | ||
| Ensemble 1 | 73.3 | 99.1 |
| Ensemble 2 | 26.7 | 0.9 |
| Total | 100 | 100 |
The values indicated are in percentage.
Fig. 5.

(a) The lack of E3RanBP2 leads to the formation of a new interaction surface in the E2Ubc9–SUMO complex. The E2Ubc9–SUMO complex taken from the crystal structure of the E2Ubc9–E3RanBP2–SUMO–TargetRanGAP1 is shown in light grey. The colored monomers (E2Ubc9 in yellow and SUMO in green) belong to the snapshot taken from the E2Ubc9–SUMO–TargetRanGAP1 trajectory at 19.3 ns. The absence of E3 leads to an orientational change in SUMO, which results in the formation of a new binding interface between SUMO and E2Ubc9. The interaction surface on SUMO side (bsUbc9) is colored in green-cyan and shown in ribbon and transparent surface. Gly68 residue is shown explicitly, since among the newly formed interfaces, it has the tightest contact with E2Ubc9. (b) The new E2Ubc9–SUMO interface formed upon removal of E3RanBP2 indicates correlated fluctuations with E2Ubc9’s loop 2. This correlation plot is calculated from the trajectory of the E2Ubc9–SUMO–TargetRanGAP1 complex. The time interval taken in to account is 18–25 ns. The newly formed E2Ubc9–SUMO interface changes the network of correlations in the rest of the protein (The most important regions are encircled). The correlation plot reveals that the core of the new interface on the SUMO side is anti-correlated with E2Ubc9’s loop 2. This observation indicates that a new path is added in the sequence of events upon removal of E3RanBP2.
Unlike in the E2Ubc9–E3RanBP2–SUMO–TargetRanGAP1 simulation, only in 3 out of 16 clusters (26% of the simulation time; for the intervals of 4.5–5.5 ns, 15.5–17 ns, and 17–25 ns) coupled fluctuations are observed across the E2Ubc9–TargetRanGAP1 interface (Supplementary Fig. S1). For the rest of the simulation, either no correlation or a nonuniformly distributed low correlation (74% of the simulation time) is observed (Supplementary Fig. S2b). Further, only in one of the three ensembles does the E2Ubc9 loop 2 strongly correlate with the E2Ubc9 binding and catalytic sites of TargetRanGAP1 (Fig. 5b). The residence time of this ensemble is over 21% of the simulation (17–25 ns). The mobility and flexibility of E2Ubc9’s loop 2 is less restricted in this ensemble compared to the other clusters (Table 2). Thus, the correlation between the dynamical behavior of E2Ubc9’s loop 2 and the strength of the cooperative fluctuations across the E2Ubc9–TargetRanGAP1 interface observed for the E2Ubc9–E3RanBP2–SUMO–TargetRanGAP1 complex appears to also take place without E3RanBP2 (Table 2). This network of correlated fluctuations is coupled to the emergence of a new E2Ubc9–SUMO interface when E3RanBP2 is not present. On the SUMO side, this interface is formed at the Leu65–Arg70 region and is mediated by the anchoring of SUMO’s Gly68. This residue, which is fully conserved,31 is 10.5 Å away from the closest E2Ubc9 residue in the crystal structure. The anchoring is indicated as SUMO’s Gly68 approaches E2Ubc9’s Lys49 and Gly50. Further, this new interface presents a correlated motion with part of the E2Ubc9 catalytic pocket (Asp127–Ala129). To this end, it is plausible to suggest that formation of this new interface shifts the E2Ubc9 conformational ensemble, similar to the E3RanBP2-bound network of fluctuations in E2Ubc9. The formation of the new interface thus provides a rationale for the orientational change in the quaternary structure of the E2Ubc9–SUMO–TargetRanGAP1 complex in the absence of E3RanBP2 (Fig. 5a).
Discussion
Here, we study the mechanism of the sumoylation cascade prior to the covalent attachment of SUMO to the substrate and the role of E3RanBP2. Earlier, it was argued that E3RanBP2 helps to reduce the entropic cost of the system, lowering the conformational flexibility of SUMO and E2Ubc9.22 This can facilitate the passage through the transition state of the reaction, which implies that E3RanBP2 acts as a catalyst in the transfer of SUMO from E2 to the substrate. Based on the crystal structure of E2Ubc9–E3RanBP2–SUMO–TargetRanGAP1, we design two complexes, which serve as the basis for the dynamic simulations. The analysis of the time course of the conformations indeed suggests that the presence of E3RanBP2 restricts the transitions between the ensembles of accessible conformations and increases the cooperativity of E2Ubc9 with the E2Ubc9–TargetRanGAP1 interface. In the presence of E3RanBP2, E2Ubc9’s loop 2 demonstrates a highly mobile and flexible behavior. The fluctuations of loop 2 are allosterically coupled with the fluctuations of the SIM and E2Ubc9 binding sites on TargetRanGAP1, where Asp33 of this loop 2 of E2Ubc9 is 38.5 Å away from the catalytic lysine of TargetRanGAP. Interestingly, the E3RanBP2 free loop between Asp2665 and Asp2673, which is confined in the presence of E2Ubc9, gains mobility, as loop 2 is coupled with the functional sites on TargetRanGAP1. These data suggest that E3RanBP2 is involved in the network of correlated fluctuations that couples the E2Ubc9 loop 2 with the catalytic sites of TargetRanGAP1 and strengthens the binding between E2Ubc9 and TargetRanGAP1. This agrees with the proposition that E3RanBP2 could increase the affinity between Ubc9 and the target.17
E3RanBP2 may have a role in regulating catalytic efficiency.15,22,28 Without E3RanBP2, the exchange between conformational states is faster for the complex structure of E2Ubc9–SUMO–TargetRanGAP, which might be an indication of a decrease in catalytic efficiency. The absence of a common conformational ensemble of E2Ubc9–SUMO–TargetRanGAP with and without E3RanBP2 suggests that E3RanBP2 binding biases the conformational space sampled by the E2Ubc9–SUMO–TargetRanGAP structure as well as the E2Ubc9-only structure. The removal of E3RanBP2 significantly reduces the coupled fluctuations at the E2Ubc9–TargetRanGAP1 interface with a parallel decrease in the flexibility and mobility of E2Ubc9’s loop 2 and in the correlation between E2Ubc9’s loop 2 and the SIM and E2Ubc9 binding sites on TargetRanGAP1. Nevertheless, the emergence of the new interface between SUMO and E2Ubc9 with a quaternary change in the structure of the E2Ubc9–SUMO–TargetRanGAP1 complex regains the E3RanBP2-bound network of fluctuations in E2Ubc9. The new interface of SUMO (Leu65–Arg70) exhibits a correlated motion with one of the E2Ubc9 catalytic pocket loops concomitant with correlated fluctuations between E2Ubc9’s loop 2 and the E2Ubc9–TargetRanGAP1 interface. Although E2Ubc9–SUMO–TargetRanGAP1 with and without E3RanBP2 do not have a joint conformational space, the structural readjustment with the new interface reassumes the network of correlated fluctuations that are expected to assist in the catalytic efficiency. This structural readjustment may explain why in vitro sumoylation of TargetRanGAP1 is successful in the absence of E3RanBP2.3 To validate this proposed allosteric mechanisms, we carried out a second set of simulation for both complexes and observed that these corresponding mechanisms are persistently present in the absence and presence of E3RanBP2 for a significant period of the simulation time (for details, see Supplementary text, Supplementary Figs. S4–S6, and Supplementary Table S1).
To conclude, analysis of the dynamics of E2–Target in the absence and presence of E3RanBP2 and comparison with that of E2Ubc9–E3RanBP2–SUMO–TargetRanGAP1 exhibits why TargetRanGAP1 can be sumoylated in vitro without E3RanBP2 and also why E3RanBP2 affects sumoylation in vivo. In the latter case, E3RanBP2 allosterically preorganizes the structural environment for catalysis by restricting the conformational space. To this end, we propose two different allosteric sites that contribute to the ligase activity: (i) E2Ubc9’s loop 2, in the presence of E3RanBP2, and (ii) the Leu65–Arg70 region of SUMO, in the absence of E3RanBP2.
Materials and Methods
Molecular dynamics simulations
To observe catalysis-related conformational changes, we simulated the step prior to the SUMO conjugation. The isopeptide bond between SUMO and TargetRanGAP1 was broken and a new thioester bond between SUMO and E2Ubc9 was modeled. To observe the contribution of E3RanBP2, two PDB files were generated. In the first, the structure was composed of the same monomers as in 1Z5S (with a modeled thioester bond between E2Ubc9 and SUMO); in the second file, E3RanBP2 was excluded from the complex (with a modeled thioester bond between E2Ubc9 and SUMO). We also carried out MD simulations for two monomers, E2Ubc9 (PDB ID: 1A5R)32 and SUMO (PDB ID: 1A3S).33 AMBER 8.034,35 was used for the simulations. The simulation time scales for each protein were 32.5 ns for E2Ubc9, 50 ns for SUMO, 48.5 ns for E2Ubc9–E3RanBP2–SUMO–TargetRanGAP1, and 43 ns for E2Ubc9–SUMO–TargetRanGAP1. The equilibration times were 2 ns for E2Ubc9, 2.5 ns for SUMO, 2 ns for E2Ubc9–E3RanBP2–SUMO–TargetRanGAP1, and 5 ns for E2Ubc9–SUMO–TargetRanGAP1. For the E2Ubc9–E3RanBP2–SUMO–TargetRanGAP1 and E2Ubc9–SUMO–TargetRanGAP1 complexes, a second set of simulation was performed in order to validate the proposed allosteric mechanisms. The control set was 28 ns long for each complex, with equilibration times of 2.5 ns and 5 ns for E3RanBP2–SUMO–TargetRanGAP1 and E2Ubc9–SUMO–TargetRanGAP1, respectively. In all trajectory analyses, equilibration times were excluded.
Simulation parameters
The AMBER package34,35 was used for the MD simulations. ff03 was the force field for all of simulations. Using the TIP3P water model,36 the protein was solvated explicitly in a truncated octahedron box. Isobaric periodic boundary conditions were used with isotropic position scaling. The initial velocities of atoms were generated at 10 K with a Maxwellian distribution. The temperature was next gradually raised to 300 K; the system temperature was maintained at this temperature. The pressure was kept at 1 bar by the Berendsen weak-coupling approach.37 In order to calculate the full electrostatic energy of a periodic box, the particle mesh Ewald method38 with a cutoff distance of 9 Å was used. The constraints for the hydrogen bonds were set by the use of the SHAKE algorithm.39 A time step of 2 fs was employed in the Leapfrog algorithm. Coordinates and energies were written every 1 ps.
Modeling of the thioester bond
We modeled a thioester bond between Cys93 of E2Ubc9 and Gly97 of SUMO. For bond formation, the parameters were either taken from the classical parameters of AMBER or produced by using General Amber Force Field with the utilization of Antechamber program.34,35 In forming the thioester bond, two distinct residue types, Glb and Cyx, were used instead of Gly and Cys. A new residue type, Glb, was defined by excluding the –COOH end of the Gly97. For Glb, the atom types, the point charges, and the parameters for van der Waals interactions of Gly were used. For the case of Cys, the atom types, the point charges, and the parameters for van der Waals interactions of an existing residue Cyx were used. Generally, Cyx was employed for the case of disulphide bond formation. In the crystal structure, the Glb and Cyx residues were not in an optimal orientation for the formation of the thioester bond. Thus, the Gaussian program was used for geometry optimization.40–42 By utilizing the Gaussian method B3LYP/6–31+G⁎⁎, the residues were oriented into a close geometry. In the generation of the stretching, bending, and torsional parameters of the new geometrical orientation, GAFF and Antechamber were used. By making use of these parameters, the thioester bond between Cyx93 and Glb97 was formed with the tleap program of the AMBER.
RMSD calculations
RMSD gives a measure for the MSF of the snapshots from the equilibrium state of the protein. We considered the first snapshot after the equilibration as the reference structure. After that, the distances between the Cα of the superimposed proteins were calculated. We used the ptraj module of AMBER 8.034,35 for calculating the MSF. For the RMSD calculation of SUMO, residues 1 to 19 were eliminated, since they are quite flexible and lie at the N-terminus of SUMO.
Clustering analysis
The clustering of the generated conformations was based on RMSD. This similarity measure represents the conformational difference between each pair of superimposed structures.43 In the case of individual clustering, the conformations were superimposed on the average structure, calculated over the time course of the simulation of each case, assuming equilibrium fluctuations. For the case where the simulations were clustered together, the conformations were superimposed on the E2Ubc9 taken at 15 ns of the E2Ubc9–E3RanBP2–SUMO–TargetRanGAP1 complex trajectory. The clustering was done via the MMTSB Toolset’s44 kclust utility, which utilizes k-means clustering. Within the RMSD threshold, the frames were divided into clusters and time windows based on their similarity measure. The RMSD threshold was set at 3 Å for joint clustering, 2.5 Å for the E2Ubc9–E3RanBP2–SUMO–TargetRanGAP1 complex, and 2.5 Å and 2.2 Å for E2Ubc9–SUMO–TargetRanGAP1.
Calculation of the correlations between fluctuations
The normalized correlations between the mean-square fluctuations of atomic positions are defined as:
| (1) |
In Eq. (1), ΔRi is the fluctuation of the position vector Ri; ΔRj is the fluctuation of the position vector Rj. i and j stand for the residues of interest. The brackets represent ensemble averages over calculated snapshots. The cross-correlations range in the interval of [−1, 1]. −1 designates fully anti-correlated and 1 designates fully correlated atomic fluctuations. The normalized correlations between the mean square fluctuations were calculated within the time windows defined by the clustering analysis.
Supplementary Material
Acknowledgements
This project was funded in whole or in part with federal funds from the National Cancer Institute, National Institutes of Health, under contract no. HHSN261200800001E. This research was supported in part by the Intramural Research Program of the National Institutes of Health, National Cancer Institute, Center for Cancer Research. The content of this publication does not necessarily reflect the views or policies of the Department of Health and Human Services, nor does mention of trade names, commercial products, or organizations imply endorsement by the U.S. Government. R.L. acknowledges support from the NIH extramural program. T. H. acknowledges support from the Betil Fund, TUBA (Turkish Academy of Sciences), DPT (2009K120520), and TUBITAK project (TUBITAK, 107T382). The authors thank Bulent Balta for helpful discussions and Seren Soner for technical support.
Abbreviations used:
- MSF
mean-square fluctuations
- SUMO
small ubiquitin-like modifier
- Ubl
ubiquitin
- SIM
SUMO interaction motif
Footnotes
Supplementary materials related to this article can be found online at doi:10.1016/j.jmb.2010.12.044
References
- 1.Mo YY, Yu YN, Theodosiou E, Ee PLR &Beck WT (2005). A role for Ubc9 in tumorigenesis. Oncogene, 24, 2677–2683. [DOI] [PubMed] [Google Scholar]
- 2.Zhao J. (2007). Sumoylation regulates diverse biological processes. Cell. Mol. Life Sci 64, 3017–3033. [DOI] [PMC free article] [PubMed] [Google Scholar]
- 3.Melchior F. (2000). Sumo—nonclassical ubiquitin. Annu. Rev. Cell Dev. Biol 16, 591–626. [DOI] [PubMed] [Google Scholar]
- 4.Seeler JS & Dejean A. (2003). Nuclear and unclear-functions of SUMO. Nat. Rev. Mol. Cell Biol 4, 690–699. [DOI] [PubMed] [Google Scholar]
- 5.Martin S, Wilkinson KA, Nishimune A. & Henley JM (2007). Emerging extranuclear roles of protein SUMOylation in neuronal function and dysfunction. Nat. Rev. Neurosci 8, 948–959. [DOI] [PMC free article] [PubMed] [Google Scholar]
- 6.Baek SH (2006). A novel link between SUMO modification and cancer metastasis. Cell Cycle, 5, 1492–1495. [DOI] [PubMed] [Google Scholar]
- 7.Boggio R. & Chiocca S. (2006). Viruses and sumoylation: recent highlights. Curr. Opin. Microbiol 9, 430–436. [DOI] [PMC free article] [PubMed] [Google Scholar]
- 8.Hochstrasser M. (2002). New structural clues to substrate specificity in the “ubiquitin system.” Mol. Cell, 9, 453–454. [DOI] [PubMed] [Google Scholar]
- 9.Nalepa G, Rolfe M. & Harper JW (2006). Drug discovery in the ubiquitin–proteasome system. Nat. Rev. Drug Discovery, 5, 596–613. [DOI] [PubMed] [Google Scholar]
- 10.Kirkin V. & Dikic I. (2007). Role of ubiquitin- and Ubl-binding proteins in cell signaling. Curr. Opin. Cell Biol 19, 199–205. [DOI] [PubMed] [Google Scholar]
- 11.Watson IR & Irwin MS (2006). Ubiquitin and ubiquitin-like modifications of the p53 family. Neoplasia, 8, 655–666. [DOI] [PMC free article] [PubMed] [Google Scholar]
- 12.Hoeller D, Hecker CM & Dikic I. (2006). Ubiquitin and ubiquitin-like proteins in cancer pathogenesis. Nat. Rev. Cancer, 6, 776–788. [DOI] [PubMed] [Google Scholar]
- 13.Dye BT & Schulman BA (2007). Structural mechanisms underlying posttranslational modification by ubiquitin-like proteins. Annu. Rev. Biophys. Biomol. Struct 36, 131–150. [DOI] [PubMed] [Google Scholar]
- 14.Capili AD & Lima CD (2007). Taking it step by step: mechanistic insights from structural studies of ubiquitin/ubiquitin-like protein modification pathways. Curr. Opin. Struct. Biol 17, 726–735. [DOI] [PMC free article] [PubMed] [Google Scholar]
- 15.Reverter D. & Lima CD (2005). Insights into E3 ligase activity revealed by a SUMO-RanGAP1–Ubc9–Nup358 complex. Nature, 435, 687–692. [DOI] [PMC free article] [PubMed] [Google Scholar]
- 16.Tatham MH, Chen Y. & Hay RT (2003). Role of two residues proximal to the active site of Ubc9 in substrate recognition by the Ubc9 center dot SUMO-1 thiolester complex. Biochemistry, 42, 3168–3179. [DOI] [PubMed] [Google Scholar]
- 17.Bernier-Villamor V, Sampson DA, Matunis MJ &Lima CD (2002). Structural basis for E2-mediated SUMO conjugation revealed by a complex between ubiquitin-conjugating enzyme Ubc9 and RanGAP1. Cell, 108, 345–356. [DOI] [PubMed] [Google Scholar]
- 18.Duda DM & Schulman BA (2005). Tag-team SUMO wrestling. Mol. Cell, 18, 612–614. [DOI] [PubMed] [Google Scholar]
- 19.Heun P. (2007). SUMOrganization of the nucleus. Curr. Opin. Cell Biol, 19, 350–355. [DOI] [PubMed] [Google Scholar]
- 20.Geiss-Friedlander R. & Melchior F. (2007). Concepts in sumoylation: a decade on. Nat. Rev. Mol. Cell Biol 8, 947–956. [DOI] [PubMed] [Google Scholar]
- 21.Johnson ES (2004). Protein modification by SUMO. Annu. Rev. Biochem 73, 355–382. [DOI] [PubMed] [Google Scholar]
- 22.Pichler A, Knipscheer P, Saitoh H, Sixma TK &Melchior F. (2004). The RanBP2 SUMO E3 ligase is neither HECT- nor RING-type. Nat. Struct. Mol. Biol 11, 984–991. [DOI] [PubMed] [Google Scholar]
- 23.Muller S, Hoege C, Pyrowolakis G. & Jentsch S. (2001). Sumo, ubiquitin’s mysterious cousin. Nat. Rev. Mol. Cell Biol 2, 202–210. [DOI] [PubMed] [Google Scholar]
- 24.Macauley MS, Errington WJ, Okon M, Scharpf M, Mackereth CD, Schulman BA & McIntosh LP (2004). Structural and dynamic independence of isopeptide-linked RanGAP1 and SUMO-1. J. Biol. Chem 279, 49131–49137. [DOI] [PubMed] [Google Scholar]
- 25.Tatham MH, Kim S, Jaffray E, Song J, Chen Y. &Hay RT (2005). Unique binding interactions among Ubc9, SUMO and RanBP2 reveal a mechanism for SUMO paralog selection. Nat. Struct. Mol. Biol 12, 67–74. [DOI] [PubMed] [Google Scholar]
- 26.Tang ZS, Hecker CM, Scheschonka A. & Betz H. (2008). Protein interactions in the sumoylation cascade—lessons from X-ray structures. FEBS J. 275, 3003–3015. [DOI] [PubMed] [Google Scholar]
- 27.Zhu SS, Goeres J, Sixt KM, Bekes M, Zhang XD, Salvesen GS & Matunis MJ (2009). Protection from isopeptidase-mediated deconjugation regulates paralog-selective sumoylation of RanGAP1. Mol. Cell, 33, 570–580. [DOI] [PMC free article] [PubMed] [Google Scholar]
- 28.Matunis MJ & Pickart CM (2005). Beginning at the end with SUMO. Nat. Struct. Mol. Biol 12, 565–566. [DOI] [PubMed] [Google Scholar]
- 29.Song J, Durrin LK, Wilkinson TA, Krontiris TG& Chen YA (2004). Identification of a SUMO-binding motif that recognizes SUMO-modified proteins. Proc. Natl Acad. Sci. USA, 101, 14373–14378. [DOI] [PMC free article] [PubMed] [Google Scholar]
- 30.Tozluoğlu M, Karaca E, Nussinov R. & Haliloğlu T. (in press). A mechanistic view of the role of E3 in sumoylation. PLoS Comput. Biol 6, e1000913. [DOI] [PMC free article] [PubMed] [Google Scholar]
- 31.Armon A, Graur D. & Ben-Tal N. (2001). ConSurf: an algorithmic tool for the identification of functional regions in proteins by surface mapping of phylogenetic information. J. Mol. Biol 307, 447–463. [DOI] [PubMed] [Google Scholar]
- 32.Bayer P, Arndt A, Metzger S, Mahajan R, Melchior F, Jaenicke R. & Becker J. (1998). Structure determination of the small ubiquitin-related modifier SUMO-1. J. Mol. Biol 280, 275–286. [DOI] [PubMed] [Google Scholar]
- 33.Giraud MF, Desterro JMP & Naismith JH(1998). Structure of ubiquitin-conjugating enzyme 9 displays significant differences with other ubiquitin-conjugating enzymes which may reflect its specificity for sumo rather than ubiquitin. Acta Crystallogr., Sect. D: Biol. Crystallogr 54, 891–898. [DOI] [PubMed] [Google Scholar]
- 34.Case DA, Darden TA III, Simmerling TEC, Wang CL, Duke J, E R. et al. (2004). AMBER 8, p. 310, University of California, San Francisco. [Google Scholar]
- 35.Case DA, Cheatham TE, Darden T, Gohlke H, Luo R, Merz KM et al. (2005). The Amber biomolecular simulation programs. J. Comput. Chem 26, 1668–1688. [DOI] [PMC free article] [PubMed] [Google Scholar]
- 36.Jorgensen WL, Chandrasekhar J, Madura JD, Impey RW & Klein ML (1983). Comparison of simple potential functions for simulating liquid water. J. Chem. Phys 79, 926–935. [Google Scholar]
- 37.Berendsen HJC, Postma JPM, Vangunsteren WF, Dinola A. & Haak JR (1984). Molecular-dynamics with coupling to an external bath. J. Chem. Phys 81, 3684–3690. [Google Scholar]
- 38.Essmann U, Perera L, Berkowitz ML, Darden T, Lee H. & Pedersen LG (1995). A smooth particle mesh Ewald method. J. Chem. Phys 103, 8577–8593. [Google Scholar]
- 39.Ryckaert JP, Ciccotti G. & Berendsen HJC(1977). Numerical-integration of cartesian equations of motion of a system with constraints—molecular-dynamics of N-alkanes. J. Comput. Phys 23, 327–341. [Google Scholar]
- 40.Becke AD (1993). A new mixing of Hartree-Fock and local density-functional theories. J. Chem. Phys 98, 1372–1377. [Google Scholar]
- 41.Becke AD (1993). Density-functional thermochemistry. 3. The role of exact exchange. J. Chem. Phys 98, 5648–5652. [Google Scholar]
- 42.Becke AD (1988). Density-functional exchange-energy approximation with correct asymptotic-behavior. Phys. Rev. A, 38, 3098–3100. [DOI] [PubMed] [Google Scholar]
- 43.Leach A. (2001). Molecular Modelling: Principles and Applications. 2 edit. Prentice Hall. [Google Scholar]
- 44.Feig M, Karanicolas J. & Brooks CL (2004). MMTSB Tool Set: enhanced sampling and multiscale modeling methods for applications in structural biology. J. Mol. Graphics Modell 22, 377–395. [DOI] [PubMed] [Google Scholar]
Associated Data
This section collects any data citations, data availability statements, or supplementary materials included in this article.