Szanto et al. propose a new gating scheme to explain how the Shaker family of voltage-gated potassium channels are inactivated at negative membrane potentials and how these channels recover from this state.
Abstract
Despite major advances in the structure determination of ion channels, the sequence of molecular rearrangements at negative membrane potentials in voltage-gated potassium channels of the Shaker family remains unknown. Four major composite gating states are documented during the gating process: closed (C), open (O), open-inactivated (OI), and closed-inactivated (CI). Although many steps in the gating cycle have been clarified experimentally, the development of steady-state inactivation at negative membrane potentials and mandatory gating transitions for recovery from inactivation have not been elucidated. In this study, we exploit the biophysical properties of Shaker-IR mutants T449A/V474C and T449A/V476C to evaluate the status of the activation and inactivation gates during steady-state inactivation and upon locking the channel open with intracellular Cd2+. We conclude that at negative membrane potentials, the gating scheme of Shaker channels can be refined in two aspects. First, the most likely pathway for the development of steady-state inactivation is C→O→OICI. Second, the OI→CI transition is a prerequisite for recovery from inactivation. These findings are in accordance with the widely accepted view that tight coupling is present between the activation and C-type inactivation gates in Shaker and underscore the role of steady-state inactivation and recovery from inactivation as determinants of excitability.
Introduction
C-type inactivation is a process that renders voltage-gated potassium (KV) channels nonconductive upon prolonged depolarization in the absence of the fast, N-type inactivation. N-type inactivation is mediated by the block of the permeation pathway by the N-terminal inactivation particle, whereas C-type inactivation depends on the amino acids in and around the selectivity filter close to the C-termini of the channel subunits. C-type inactivation of potassium channels plays a major role in the governance of diverse biological processes such as modulating the firing of neurons (Bean, 2007), regulating the length and frequency of the action potential in cardiomyocytes (Smith et al., 1996; Jan and Jan, 2012; Bocksteins, 2016), and regulating the activation of nonexcitable immune (Matteson and Deutsch, 1984; Panyi et al., 2004; Villalonga et al., 2010; Pérez-Garcia et al., 2018) and endocrine cells (MacDonald and Wheeler, 2003). C-type inactivation is widely prevalent across many K+ channel families (Hoshi et al., 1991; Kurata and Fedida, 2006; Cuello et al., 2010b; Hoshi and Armstrong, 2013). Structurally, C-type inactivation is linked to conformational changes at the selectivity filter (Kurata and Fedida, 2006; Cuello et al., 2010b; Hoshi and Armstrong, 2013; Pless et al., 2013; Pau et al., 2017; Matthies et al., 2018). Furthermore, novel studies emphasize the importance of “inactivation water” molecules in the cavity behind the selectivity filter in controlling the molecular rearrangements related to inactivation (Cordero-Morales et al., 2011; Cuello et al., 2017) and recovery from inactivation (Ostmeyer et al., 2013).
The Shaker-IR channel lacking the N-type inactivation balls is a dedicated model for examining the C-type inactivation of KV channels (Hoshi et al., 1990, 1991; Kurata and Fedida, 2006). In Shaker-IR, the flow of ions is controlled by the coupled opening and closing of the activation gate (A-gate), formed by the bundle-crossing of four S6 helices (Yellen, 1998; Bezanilla, 2000; del Camino and Yellen, 2001; Webster et al., 2004), and the C-type inactivation gate (I-gate) formed by the selectivity filter. Four major gating states can be defined: closed (C), open (O), open-inactivated (OI), and closed-inactivated (CI) states, as indicated in Fig. 1 (Yellen, 1998; Panyi and Deutsch, 2006; Ostmeyer et al., 2013; Cuello et al., 2017). The existence of all the gating states is confirmed by functional, structural, and computational studies (Long et al., 2005; Cuello et al., 2010a, 2010b; Pau et al., 2017; Labro et al., 2018; Matthies et al., 2018).
Figure 1.
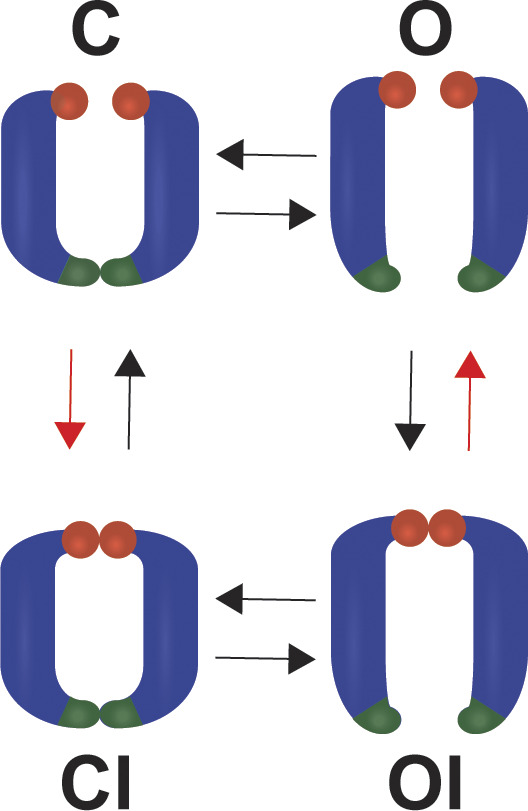
The four-state gating model of the Shaker-IR channel. The gating of Shaker-IR channels can be described by the four-state gating model, in which four major gating states can be distinguished depending on the status of the activation (dark green) and inactivation (red spheres) gates. Two opposing pore domains are illustrated in the cartoons. Among the closed (C), open (O), open-inactivated (OI), and closed-inactivated (CI) states, only the open state is conducting. The theoretically existing transitions between these gating states are indicated by arrows. In this study we investigate the existence of direct C→CI and OI→O transitions (red arrows) at negative membrane potentials.
The opening and closing of the A-gate is controlled by the membrane potential. Membrane depolarization opens, while repolarization closes, the A-gate (Yellen, 1998; Bezanilla, 2000). Upon A-gate opening, extended depolarization leads to C-type inactivation (O→OI), while sufficiently negative membrane potential triggers closing of the A-gate (OI→CI) long before recovery from inactivation takes place (CI→C; Kurata and Fedida, 2006; Panyi and Deutsch, 2006). The A-gate and I-gate are bidirectionally coupled, mediated by allosteric communication trajectories between the gates (Ogielska and Aldrich, 1999; Panyi and Deutsch, 2006; Sadovsky and Yifrach, 2007; Cuello et al., 2010a, 2010b; Labro et al., 2018).
Transitions at depolarized membrane potentials that lead to channel opening (O state) only partially determine the amount of current available for regulating physiological processes. It is equally important to understand what fraction of the channels is available to open. This is mainly determined by transitions at negative membrane potentials, i.e., the relative probability of channels in CI and C at steady state. The phenomenon of steady-state inactivation reflects this distribution. What determines this CIC equilibrium? What promotes recovery of closed I-gates? To address these issues, we consider putative gating transitions and ask the following questions. First, can the closed channel directly inactivate at negative membrane potentials (C→CI)? Second, must the inactivated channel (OI state) pass through the CI state to recover from inactivation, or can it bypass this state to recover? Can the inactivation gate (the I-gate), in its non-conducting configuration, rearrange/open while the A-gate is continuously open, i.e., is an OI→O transition permitted at negative voltages for recovery to occur? The answers to these mechanistic questions will expand our understanding of KV gating transitions and aid the design of more efficacious drugs with state-dependent binding, e.g., to sites in the cavity of the channel, which depend on the probability that the A-gate and/or the I-gate are open.
Studying gating transitions at negative membrane potentials is hampered by two factors. One is that at these membrane potentials, the open probability of the channels is very small, resulting in miniature currents. In addition, the driving force for K+ is small, which also results in small currents and a large error in the determination of the state of the A-gate from current measurements. In contrast, gating transitions at the A-gate, i.e., movement of the A-gate, can be precisely tracked using the state-dependent cysteine accessibility method (Liu et al., 1997).
Both C→CI and OI→O transitions require the I-gate to rearrange without A-gate movements, which contradicts the primary coupling between the activation and C-type inactivation gates. Our aim was to investigate the existence of the direct C→CI and OI→O transitions at negative membrane potentials in Shaker-IR channels transiently expressed in human embryonic kidney (HEK293) cells. To this end, we employed the patch-clamp technique in inside-out configuration and T449A/V474C Shaker-IR channels for studying closed-state inactivation (direct C→CI transition) or T449A/V476C Shaker-IR channels to examine recovery from inactivation in the presence of a locked-open A-gate (direct OI→O transition). These electrophysiologically silent transitions were visualized using state-dependent cysteine accessibility, Cd2+ modification, and Cd2+ crosslinking.
Materials and methods
DNA clones and site-directed mutagenesis
The Shaker-IR construct in a GW1-CMV mammalian expression plasmid containing a deletion of amino acids 6–46 to remove N-type inactivation, and C301S and C308S point mutations (Holmgren et al., 1996) to exclude Cd2+ modification of endogenous Shaker cysteines and accompanying functional effects, were a kind gift from R. Horn (Thomas Jefferson University, Philadelphia, PA; Ding and Horn, 2002). Amino acid substitutions at positions 449 (T449A) and 474 (V474C) or 476 (V476C), according to Shaker B numbering, were introduced using a QuikChange site-directed mutagenesis kit (Stratagene).
Cell culture and transfection
The human embryonic kidney cell line, HEK293, was obtained from ATCC and grown according to the instructions of the manufacturer. A calcium phosphate transfection kit (Invitrogen) was used to cotransfect the EGFP plasmid with the mutant Shaker constructs using a ratio of 1:10 µg. Transfected cells were replated into Corning 35-mm polystyrene cell culture dishes pretreated with poly-L-ornithine (Sigma-Aldrich) for higher cell adhesion to excise inside-out patches. Then channels were transiently expressed in the cells for 12–36 h after transfection. The EGFP-positive transfectants were identified on a Nikon TE2000U fluorescence microscope using bandpass filters of 455–495 nm and 515–555 nm for excitation and emission, respectively. In general, >60% of the EGFP-positive cells expressed the cotransfected ion channels.
Electrophysiology
All the experiments were performed using inside-out configuration. The direction of K+ currents and the voltage protocols are presented according to general conventions. Data were acquired using an Axopatch 200B amplifier (Molecular Devices) and digitized with Axon Digidata 1550 (Molecular Devices). The filter frequency was set to less than or equal to half of the sampling frequency. Pipettes were pulled from GC 150 F-15 borosilicate capillaries (Harvard Apparatus), and resistances were 8–9 MΩ. Only patches with a steady-state current <5% of the peak current were used in these studies. All experiments were performed at room temperature (20–24°C).
Solutions and perfusion system
The standard intracellular (bath) solution contained (in mM) 105 KF, 35 KCl, 10 EGTA, and 10 HEPES, titrated to pH 7.36–7.38 with KOH, with a final K+ concentration of 160–165 mM and osmolarity of 285–295 mOsm/L. To characterize the perfusion kinetics, the standard intracellular solution was identical, except that it contained 50 mM K+ and 100 mM NaF instead of the corresponding K+ salts and was titrated with NaOH. For experiments using Cd2+ as the modifying reagent, the intracellular solution was identical to the standard K+-based solution except that EGTA was omitted and (in mM) 125 KF, 35 KCl, and 10 HEPES were used. Standard extracellular (pipette) solution was (in mM) 150 NaCl, 2 KCl, 1.5 CaCl2, 1 MgCl2, and 10 HEPES. The osmolarity of the solution was 290 mOsm/L, and pH was titrated to 7.36–7.38 with NaOH.
A Warner Instruments SF-77A Perfusion Fast-Step system with 3-barrel square glass (700 µm internal side length) was used for rapid solution exchange. Inside-out patches were perfused with standard intracellular solutions at a rate of 0.5 ml/min. The principle and the description of the test protocol to determine the rate of the solution exchange has been described previously (Panyi and Deutsch, 2006, 2007). The solution exchange was complete in 30 ms (see Results).
Data analysis
Data were analyzed using Clampfit (v10; Molecular Devices), SigmaPlot (v10.; Systat Software), and Excel (Microsoft). Before analysis, inside-out current traces were digitally filtered with a three-point boxcar filter. All the ionic currents applied for determining conductance–voltage (G–V) and steady-state inactivation curves were leak corrected before the analysis.
To construct normalized G (Gnorm)-V curves of mutant Shaker-IR channels, inside-out patches were held at −120 mV and depolarized for 100 ms to test potentials ranging from −100 to +70 mV in steps of 10 mV every 60 s. Conductances at given test potentials were obtained from the leak-corrected peak currents (Ipeak) at test potential (V) and the K+ reversal potential (Erev) using G = Ipeak/(V − Erev). While isochronal tail current calculation is the standard method for determining G–V curves for noninactivating currents, the Shaker-IR/T449A channels in this study are inactivating, which complicates the interpretation of tail current analysis. The G values were normalized for the maximum conductance (Gnorm) and plotted as a function of the test potential. Gnorm-V curves were quantified by fitting a Boltzmann function and determining half-activation voltage (V1/2) and slope factor (k) from the fits.
To determine the inactivation time constants (τinact) of the currents, 2,000-ms-long depolarizing pulses to +50 mV were applied. The decaying part of the current traces was fitted by a single exponential function (I = I0 × [e−t/τ] + C) starting from 90% of the peak. To define activation time constants (τact) of the currents, 5-ms-long depolarizing pulses were applied from a holding potential of −120 mV to +50 mV, then evoked current traces were fitted using Hodgkin-Huxley n4-model (I = I0[1 − e−t/τ]4 + C).
For measuring the kinetics of recovery from inactivation, pairs of depolarizing pulses were delivered from the holding potential of −120 to +50 mV for 200 ms. The interpulse interval (ipi) at −120 mV varied between 0.5 and 60 s. The fractional recovery was calculated as (I2 − ISS1)/(I1 − ISS1), where I2 and I1 are the peak currents during the second and first pulse, respectively, and ISS1 is the steady-state current at the end of the first depolarization. Data points were fitted by a single exponential function (I = I0 × (1 − e−t/τ) + C) to obtain the time constant of recovery from inactivation (τrec).
To describe steady-state inactivation curves, the fraction of noninactivated channels at each voltage was calculated as I/I−120, where I is the peak current evoked by the depolarization from a given prepulse potential, and I−120 is the peak current evoked by identical depolarization from the holding potential of −120 mV. V1/2 and k were determined by fitting a Boltzmann function to the data points.
Data are represented as mean ± SEM. The numbers of cells (n) involved in the given analysis are shown in the text. P values were calculated based on ANOVA followed by Tukey’s honestly significant difference test. Differences were considered significant at P < 0.05.
Online supplemental material
Fig. S1 shows raw current traces corresponding to the analysis in Fig. 4, B and C (holding potential of −120 mV and −90 mV between pulses P1 and P2 in A and B, respectively, no Cd2+ applied). Fig. S2 shows raw current traces corresponding to the analysis in Fig. 5, B and C (holding potential of −90 mV between pulses P1 and P2 in the presence of 200 µM Cd2+). Fig. S3 shows the biophysical characterization of T449A/V476C Shaker-IR channels in inside-out patches.
Results
Experimental strategy to investigate the pathway leading to inactivation at negative membrane potentials in the T449A/V474C Shaker-IR channel
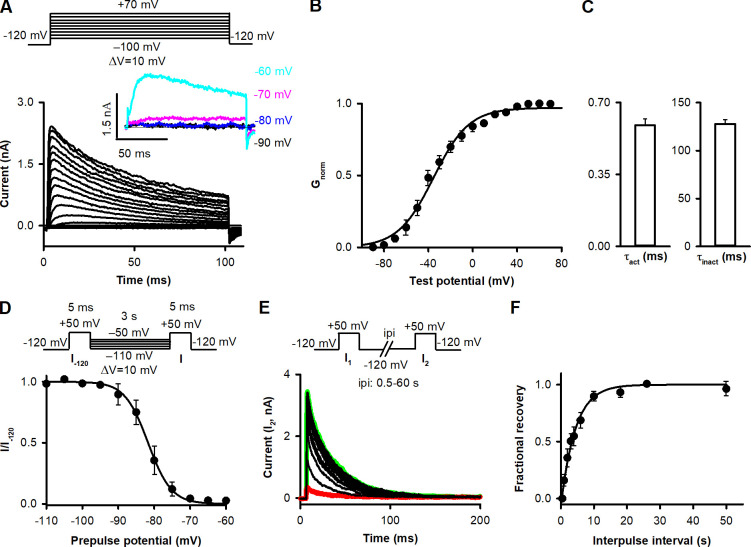
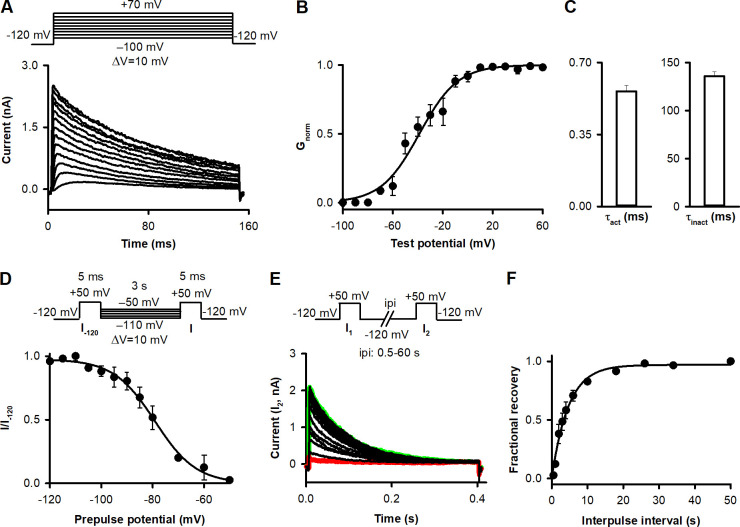
In Shaker-IR channels, residue 474 is located in the S6 helix, facing the water-filled cavity of the pore when A-gate is open (Liu et al., 1997). A cysteine introduced into this position can only be modified by Cd2+ or MTS reagents in the case of an open A-gate (Liu et al., 1997; Panyi and Deutsch, 2006, 2007). Cd2+ binding blocks ion conduction. T449A amino acid substitution was employed to speed up C-type inactivation to keep the length of our protocols reasonable (López-Barneo et al., 1993; Hoshi and Armstrong, 2013). To design a pulse sequence for optimizing the study of state transitions and kinetics, we electrophysiologically characterized the T449A/V474C Shaker-IR channel using inside-out patch-clamp configuration (see Data analysis). First the current–voltage (Fig. 2 A) and voltage dependence of the conductance were determined (Fig. 2 B) by fitting a Boltzmann function to the normalized conductance (Gnorm)-test potential relationships to give V1/2 = −51.6 ± 2.5 mV and a slope factor of k = 16.9 ± 2.1 mV (n = 5). The activation and inactivation time constants of the currents at +50 mV are in Fig. 2 C. The current activates quickly, and the inactivation kinetics is fast enough to conduct the experiments on a reasonable time scale. The voltage dependence of steady-state inactivation was characterized by V1/2 (V1/2 = −81.7 ± 0.7 mV, n = 4) and a slope factor (k = −5.8 ± 0.6 mV, n = 4) obtained from Boltzmann fits for I/I−120 dependence on prepulse potential of individual cells (see Materials and methods). The I/I−120 averaged at each prepulse potential is shown in Fig. 2 D. Using pulse pairs to +50 mV and varying the ipi, the kinetics of recovery from inactivation were determined at −120 mV, which served as the holding potential for the experiments between pulse protocols (Fig. 2 E), to give a recovery time constant of 4.4 ± 0.6 s (n = 5; Fig. 2 F).
Figure 2.
Electrophysiological parameters of T449A/V474C Shaker-IR ion channels expressed in HEK293 cells. (A) K+ currents in inside-out patch configuration for the T449A/V474C Shaker-IR channel. The patch was held at −120 mV and depolarized for 100 ms to test potentials ranging from −100 to +70 mV in steps of 10 mV every 60 s (see protocol above). Inset shows currents evoked by the depolarizing pulses to the indicated membrane potentials. (B) Gnorm-V data (see Materials and methods) were obtained for n = 5 cells, averaged, and plotted as a function of test potentials. The superimposed solid line shows the best-fit Boltzmann function to the averaged data points. (C) To determine activation time constant (τact), we applied 5-ms-long depolarizing pulses from a holding potential of −120 to +50 mV, and the evoked current traces were fitted using the Hodgkin–Huxley n4-model (n = 6). Inactivation time constant (τinact) of the current was determined by fitting a single exponential function to the decaying part of the currents evoked by 2,000-ms-long pulses to +50 mV (n = 5). (D) To describe voltage dependence of steady-state inactivation, patches were stepped from a holding of −120 mV to prepulse potentials between −110 and −50 mV in steps of 5 mV for 3 s, and then a short (5-ms) test pulse to +50 mV was applied to elicit potassium currents (I; see protocol above). After each step, a second test pulse was applied from a holding potential of −120 mV (I−120). The fraction of noninactivated channels (I/I−120) at each voltage was averaged for n = 4 cells and plotted as a function of prepulse potential. The superimposed solid line shows the best-fit Boltzmann function to the averaged data points. (E) To describe recovery from inactivation, pairs of depolarizing pulses were delivered from the holding potential of −120 mV to +50 mV for 200 ms (see protocol above). Currents recorded during the second pulses (I2) are shown at various ipi at −120 mV holding potential. Traces recorded with ipi of 0.5 and 60 s are highlighted in red and green, respectively. (F) The fractional recovery was calculated as (I2 − ISS1)/(I1 − ISS1), where I1 and I2 are the peak currents during the first and second pulse, and ISS1 is the steady-state current at the end of the first depolarization. Fractional recovery values were averaged for n = 5 cells for each ipi and plotted as a function of ipi. The best-fit exponential function to the averaged data points is indicated in the figure. Error bars indicate SEM throughout the figure.
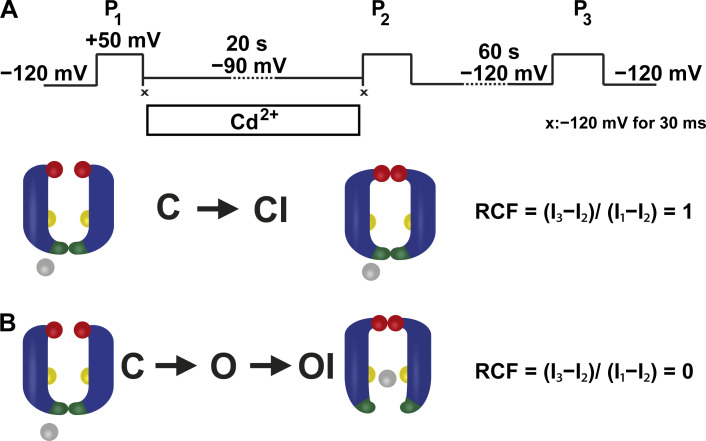
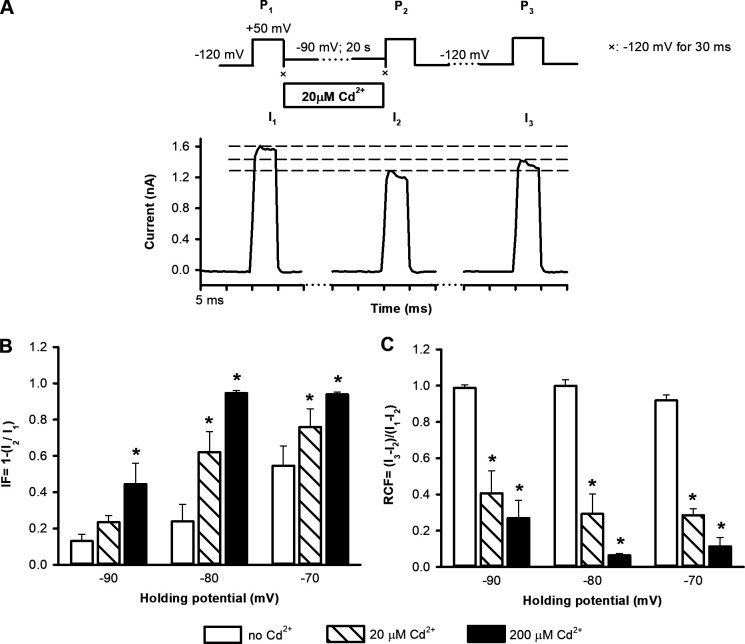
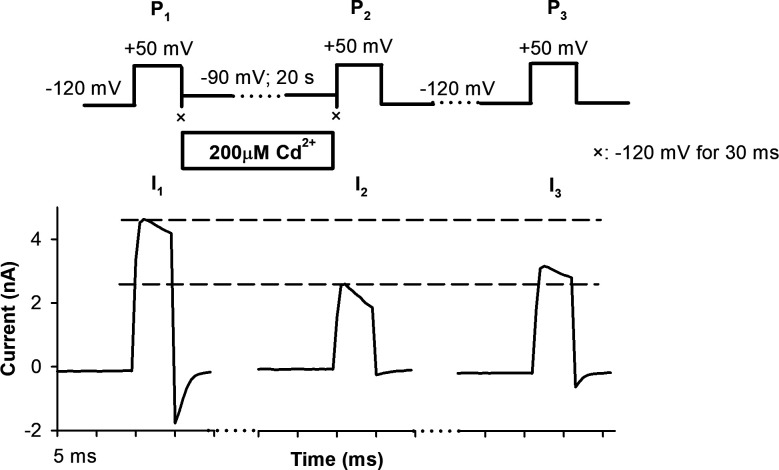
Based on these biophysical properties of T449A/V474C channels, we designed an experimental strategy using state-dependent cysteine accessibility to Cd2+ applied from the intracellular side to investigate closed-state inactivation (Fig. 3 A). A pulse sequence consisting of three 5-ms-long depolarizations to +50 mV was applied (Fig. 3 A). These depolarizing steps fully activated potassium currents (Fig. 2 B). During the first pulse (P1), control solution (150 mM K+, no Cd2+) was applied to obtain the maximum current (I1). This was followed by a 30-ms-long hyperpolarization to −120 mV to ensure quick and full closure of the A-gate of all channels before Cd2+ application (Fig. 3 A, symbol ×). The membrane potential was then stepped to various negative values for 20 s. As a control, the membrane potential was stepped to −120 mV, where neither steady-state inactivation nor A-gate opening was observed (Fig. 4). The status of the A-gate was then assessed at membrane potentials at which the channel shows a small degree of steady-state inactivation (Fig. 2 D), but no macroscopic current can be detected (Fig. 2, A and B, inset in A), e.g., at −90 mV (Fig. 3 A). Although Fig. 2 D may be an underestimate of true steady-state inactivation at −90 mV, it nonetheless defines the appropriate range of negative potentials for examination of state-dependent Cd2+ accessibility. The extent of steady-state inactivation at −90 mV was assessed by the current (I2) evoked by the second depolarizing pulse (P2). P2 was also preceded by a 30-ms-long step to −120 mV to avoid Cd2+ exposure of the open-state channels at the beginning of P2 (electromechanical delay in the perfusion system; Panyi and Deutsch, 2006; Fig. 3 A, symbol ×). In the absence of Cd2+, the ratio of the peak currents (I2/I1) during P2 and P1 was used to quantify steady-state inactivation. Thereafter the patch was held at −120 mV for 60 s, which was sufficient to ensure full recovery of the inactivated channels in control conditions. Consequently, the current amplitude (I3) during the third 5-ms-long depolarizing pulse (P3) in control cases was similar to that of the first pulse. When examining the modification of 474C by Cd2+, the pulse sequence was essentially the same as for control cases except the 20-s-long pulse was applied in the presence of an intracellular solution containing either 20 or 200 µM Cd2+. Cd2+ exposure of patches was initiated after P1 and terminated with the completion of the −90-mV holding step, before P2. The inactivated current fraction (IF) was calculated as IF = 1 − (I2/I1), and the recovered current fraction as RCF = (I3 − I2)/(I1 − I2) (Fig. 3 B). I1, I2, and I3 represent the leak-corrected current amplitudes evoked by the three sequential pulses. Theoretically, if inactivation originates solely from the closed state, i.e., there is no opening of the A-gate before inactivation, then RCF should equal 1, because the closed A-gate prevents Cd2+ modification of 474C and current loss (Fig. 3 B, upper model). In contrast, if A-gate opening precedes inactivation, Cd2+ will modify 474C, and current loss will be seen. If all channels contributing to steady-state inactivation have an open A-gate at −90 mV and Cd2+ modifies all of these channels, then RCF is 0 (Fig. 3 B, lower model). 0 < RCF < 1 indicates that the channels during steady-state inactivation were in a Cd2+-accessible state (see Discussion).
Figure 3.
Experimental strategy to investigate closed-state inactivation in T449A/V474C Shaker-IR ion channels. (A) The pulse protocol consisted of three 5-ms-long depolarizations to +50 mV (P1, P2, and P3). The corresponding peak currents evoked by these pulses are represented as I1, I2, and I3 in B. Between P1 and P2, patches were held in Cd2+ containing intracellular solution at −90 mV holding potential for 20 s. To avoid the Cd2+ exposure of the open-state channels during P1 and P2, 30-ms-long steps to −120 mV were applied directly after P1 and before P2, indicated by symbol ×. The holding potential of −120 mV was applied between P2 and P3 for 60 s. (B) The accessibility of cysteines at position 474 (yellow spheres) located between the activation (intracellular part of S6 helices, dark green) and C-type inactivation (red spheres) gates during inactivation was determined by applying Cd2+ (gray spheres) from the intracellular side. Upon binding to 474C, Cd2+ inhibits K+ currents, thus tracking precisely the incidental opening of the A-gate during the development of C-type inactivation. Model predictions for RCF are in the text; I1, I2, and I3 are defined in A.
Figure 4.
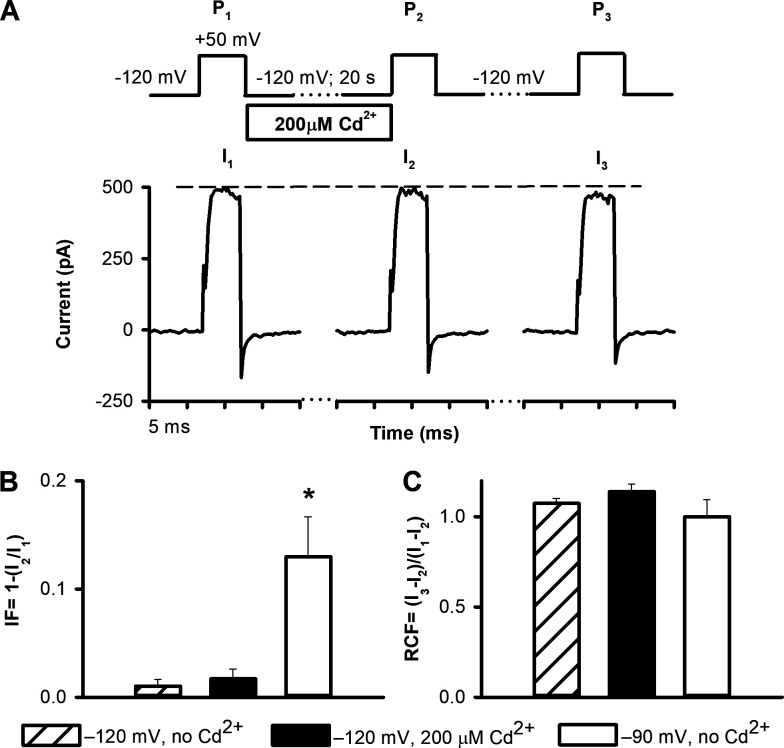
The three-pulse protocol: control measurements. Three different experimental conditions were used for control measurements on HEK293 cells expressing T449A/V474C Shaker-IR channels in inside-out patch. (A) Representative traces demonstrate currents evoked by the three depolarizing pulses to +50 mV (P1, P2, and P3) using a holding of −120 mV. The intracellular solution perfusate contained 200 µM Cd2+ during the 20-s holding, as indicated. The dashed reference line is drawn to I1. (B) Inactivated fraction of the channels (IF = [I1 − I2]/I1) at −120 mV holding between P1 and P2 (hatched bar), at −120 mV in the presence of 200 µM Cd2+ (solid bar), and at −90 mV in the absence of Cd2+ (empty bar). (C) RCF = (I3 − I2)/(I1 − I2) at −120 mV holding between P1 and P2 (hatched bar), at −120 mV holding between P1 and P2 in the presence of 200 µM Cd2+ (solid bar), and at −90 mV holding between P1 and P2 in the absence of Cd2+ (empty bar). Data are represented as mean ± SEM (n = 5) throughout the figure. Differences were considered significant (*) compared with control (−120 mV, no Cd2+) when P < 0.05.
Activation gate opening in the T449A/V474C Shaker-IR channel at negative holding potentials
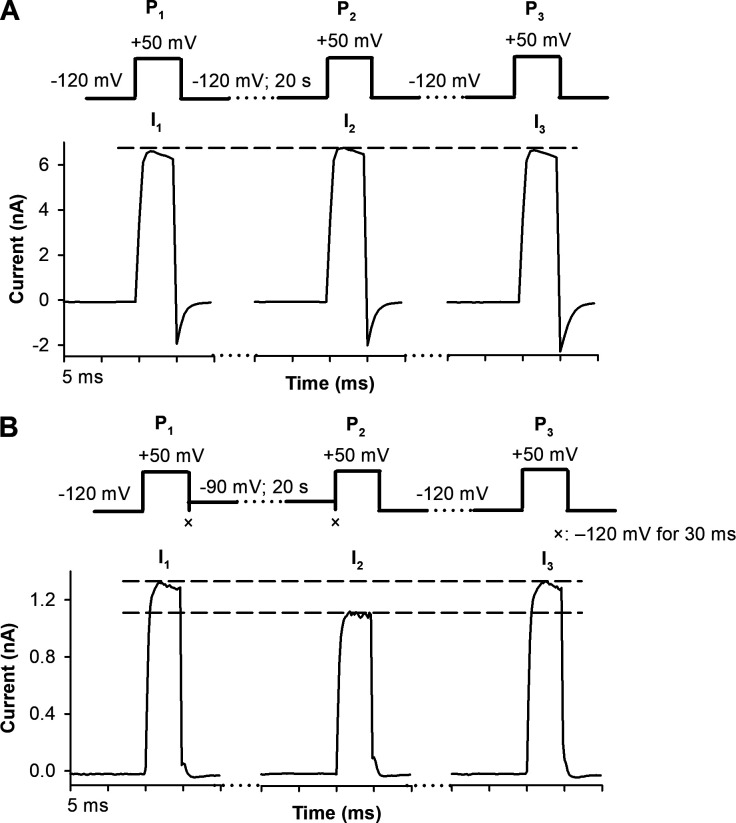
To evaluate the ability of the three-pulse protocol to report specifically on the opening of the A-gate, we used three different control experiments. First, application of a −120-mV holding potential for 20 s between P1 and P2 in the absence of Cd2+ did not decrease I2 compared with I1 (Fig. S1 A). No inactivation occurred (IF ∼0) and consequently, RCF is close to 1 (Fig. 4, B and C, hatched bars). Thus, pulse durations in the three-pulse protocol are properly designed to avoid current loss in the absence of Cd2+ or A-gate movement. Second, channels exposed intracellularly to 200 µM Cd2+ during the 20-s-long holding period at −120 mV also gave no reduction in current, since they remained in the closed state at −120 mV (Fig. 4 A); IF ∼0 and RCF ∼1 (Fig. 4, B and C, black bars). These data demonstrate that the timing of the start/stop of the Cd2+ application is optimized to avoid Cd2+ exposure of the open channels when they are closing (end of P1) or when closed channels are opening (during P2); Cd2+ exposure is thus well controlled during the pulse protocol. A third control shows that all channels that are inactivated at −90-mV holding potential between P1 and P2 (Fig. 4 B, empty bar; IF significantly increased; P < 0.05) recover from inactivation in the absence of Cd2+ (Fig. S1 B and Fig. 4 C, empty bar; RCF ∼1).
Figure S1.
Control experiments to validate the suitability of the three-pulse protocol. Inside-out patch currents were recorded in HEK293 cells expressing T449A/V474C Shaker-IR channels. (A) Representative traces show currents evoked by three 5-ms-long depolarizing pulses to +50 mV from the holding potential of −120 mV. The IF and RCF values calculated from I1, I2, and I3 peak currents are in Fig. 4, B and C. (B) Representative traces show currents evoked by three 5-ms-long depolarizing pulses to +50 mV. The holding potential was −120 mV before P1 and P3. The holding potential between pulses P1 and P2 was −90 mV. The IF and RCF values calculated from I1, I2, and I3 peak currents are in Fig. 4, B and C.
To assess the dependence of RCF on the holding potential, we chose holding potentials of −90, −80, or −70 mV between P1 and P2 in the presence of 20 or 200 µM intracellular Cd2+. Representative current traces of an experiment using 20 µM Cd2+ and −90-mV holding potential are shown in Fig. 5 A (the same experiment using 200 µM Cd2+ is in Fig. S2). Although no macroscopic current can be detected at −90 mV (Fig. 2, A and B), a small degree of steady-state inactivation occurs (IF, Fig. 5 B). At −80 and −70 mV, current increases (Fig. 2 A, inset), and inactivation becomes progressively more prominent (Fig. 2 D). IF increases with depolarizing holding potentials (Fig. 5 B) both in the absence and presence of Cd2+. In contrast, RCF decreased significantly only if Cd2+ was present during the holding potential between P1 and P2 (Fig. 5 C). This indicates that A-gate openings occur in the voltage range of −90 to −70 mV. Consequently, Cd2+ accesses 474C despite the lack of macroscopic current at −90 mV (Fig. 2 A, inset). The RCF is significantly decreased in the presence of 20 µM and 200 µM Cd2+ (Fig. 5 C) regardless of the holding potential. In the absence of Cd2+, RCF values are essentially the same at all holding potentials (Fig. 5 C).
Figure 5.
Determining the IFs and RCFs with intracellularly applied Cd2+. (A) An inside-out patch expressing T449A/V474C channels was exposed to 20 µM Cd2+ between P1 and P2 at −90 mV holding potential (top; see details also in Fig. 3) The holding potential before P3 was −120 mV. Symbol × indicates a 30-ms-long pulse to −120 mV. Dashed reference lines are drawn to I1, I2, and I3. (B) Based on the peak currents for each pulse, inactivated current fractions (IF = 1 − [I2/I1]) were calculated for the indicated holding potentials in the absence of Cd2+ (empty bars) or in the presence of 20 µM Cd2+ (hatched bars) or 200 µM Cd2+ (solid bars). (C) RCFs (RCF = [I3 − I2]/[I1 − I2]) were determined for the indicated holding potentials between P1 and P2 in the absence of Cd2+ exposure (empty bars) or in the presence of 20 µM Cd2+ (hatched bars) or 200 µM Cd2+ (solid bars) during the holding between P1 and P2. Data are given as mean ± SEM (n = 5); *, significant differences when P < 0.05 throughout the figure.
Figure S2.
Exposure of an inside-out patch to 200 µM Cd2+ at −90 mV in a three-pulse protocol. Inside-out patch currents were recorded in HEK293 cells expressing T449A/V474C Shaker-IR channels. Representative traces show currents evoked by three depolarizing pulses to +50 mV. The holding potential was −120 mV before P1 and P3. The holding potential between pulses P1 and P2 was −90 mV. 200 µM Cd2+ was applied intracellularly (empty horizontal bar). The IF and RCF values calculated from I1, I2, and I3 peak currents are in Fig. 5, B and C.
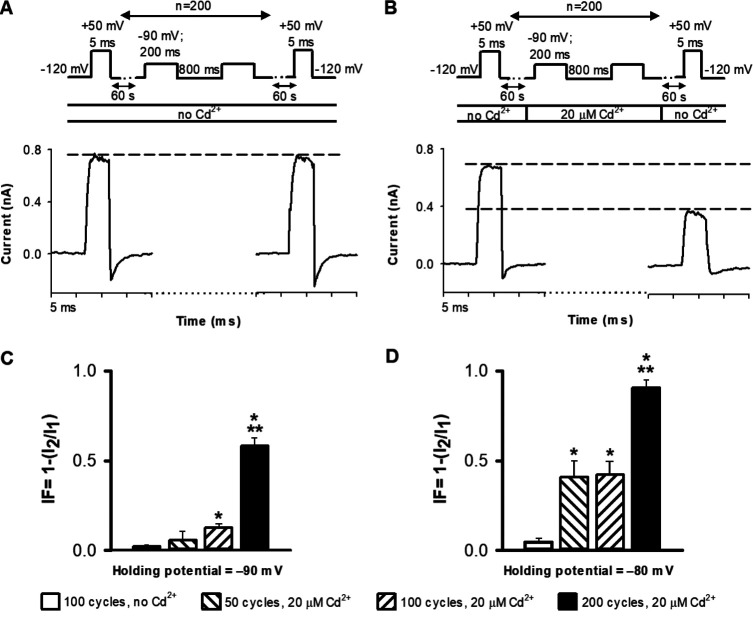
To correlate the increase in the current loss with Cd2+ exposure, we applied 20 µM Cd2+ for short (200 ms) durations over many cycles at −90 or −80 mV (Fig. 6). The pulse sequence (Fig. 6, A and B) started with a 5-ms depolarization to +50 mV to obtain the peak current I1, then the patch was held at −120 mV for 60 s. This was followed by the unit cycle, which consisted of 200 ms at −90 mV (or −80 mV) and 800 ms at −120 mV. The unit cycle was repeated 200, 100, or 50 times, followed by a 60-s holding at −120 mV in the absence of Cd2+, and the sequence was terminated by a 5-ms depolarization to +50 mV to obtain I2. Cd2+ was either absent (Fig. 6 A) or present (20 µM intracellular Cd2+, Fig. 6 B) during the indicated number of unit cycles. The cumulative fraction of channels modified by Cd2+ was calculated as IF = 1 − (I2/I1), as above. As indicated in Fig. 6, C and D, modification of 474C by cumulative exposure to Cd2+ is time and voltage dependent. A step to −80 mV produces more modification and increased IF than −90 mV. The pulse sequence gave cumulative Cd2+ exposure at 100 cycles similar to that obtained with a single 20-s application of 20 µM Cd2+. In summary, our results show that at holding potentials at which substantial steady-state inactivation occurs, the A-gate opens despite the lack of observable currents. This finding indicates that the CI state is populated through the C→O→OI pathway instead of the direct C→CI transition (see Discussion), as suggested by others (Klemic et al., 2001; Claydon et al., 2007, 2008; Jamieson and Jones, 2014).
Figure 6.
Cd2+ modification of T449A/V474C channels depends on the membrane potential and the duration of application. (A) Representative control pulse sequence for cumulative Cd2+ exposure. The unit cycle is defined as 200 ms at −90 and 800 ms at −120 mV holding potential. This cycle was repeated 200 times (n = 200). The cycles were flanked by 5-ms-long depolarizations to +50 mV in to obtain I1 and I2, the peak inside-out patch currents before and after the cycles, respectively. 60-s-long holdings at −120 mV followed the first pulse to +50 mV and preceded the second pulse to +50 mV. Empty bar under the pulse protocol indicates that no Cd2+ was applied in the control sequence. Dashed reference line is drawn at I1. (B) Representative pulse sequence for cumulative Cd2+ exposure. The unit cycle was the same as in A except Cd2+ was applied as indicated by the bar (20 µM Cd2+). This cycle was repeated by n = 200 times. Dashed reference lines are drawn at I1 and I2. (C) 1 – (I2/I1) at −90 mV holding (during the 200-ms segment of a unit cycle) at various cycle numbers in the absence of Cd2+ (empty bar, 50 cycles) or in the presence of 20 µM Cd2+ with 50 (left hatched bar), 100 (right hatched bar), and 200 cycles (filled bar). (D) Same experiment as in C except the holding potential was −80 mV during the 200-ms segment of a unit cycle. Mean values of n = 3–7 independent measurements are shown; error bars indicate SEM. * indicates that data are different from controls (P < 0.05). ** indicates that the data obtained with 200 cycles are also different from those obtained with 50 and 100 cycles (P < 0.05).
Locked-open A-gate prevents recovery from C-type inactivation
The experiments above suggest that an open A-gate is important for inactivation to occur at negative holding potentials. The ability of the channels to recover from inactivation may also mechanistically depend on the conformational status of the A-gate. Locking the A-gate in the open state is a suitable method to investigate determinants for recovery from inactivation.
Previous studies have shown that a Shaker-IR 476C mutant channel can be trapped in the open state by Cd2+ application from the intracellular side (Webster et al., 2004). This is caused by formation of a metal bridge between 476C in one subunit and a native histidine (H486) in a neighboring subunit, thus inhibiting A-gate closing even at negative voltages. A biophysical characterization of the T449A/V476C Shaker-IR channel expressed in HEK293 cells using inside-out patch-clamp configuration is given in Fig. S3. We designed control measurements to confirm the applicability of the protocol to study the consequence of A-gate locking by Cd2+ exposure on recovery from inactivation.
Figure S3.
Biophysical characterization of T449A/V476C Shaker-IR ion channels. (A) To characterize the steady-state activation of T449A/V476C mutant channels, inside-out patches were held at −120 mV and depolarized to test potentials ranging from −100 to +70 mV in steps of 10 mV every 60 s. The duration of the depolarizing pulses was 100 ms (see protocol above). Representative current trace is shown in A. (B) G–V data were obtained from the peak currents (Ipeak) at test potential (Vtest) and the K+ reversal potential (Erev) using G = Ipeak/(Vtest − Erev). Then G values were normalized for the maximum conductance (Gnorm) and plotted as a function of test potential. The superimposed solid line shows the best-fit Boltzmann function to the mean values ± SEM (n = 5). The Boltzmann function was fitted to the G–V relationship obtained from n = 5 patches to result in V1/2 = −38.8 ± 2.1 mV, k = 15.3 ±1.8 mV (n = 5, mean ± SEM). (C) To determine the activation time constant (τact) we applied 5-ms-long depolarizing pulse from a holding potential of −120 mV to +50 mV. Current traces were fitted using the Hodgkin-Huxley n4-model; τact was used to describe the activation kinetics. Inactivation time constant (τinact) of the current at +50 mV was determined by fitting a single exponential function to the decaying part of the currents evoked by a 2,000-ms-long depolarizing pulse. (D) To describe the voltage dependence of steady-state inactivation from a holding potential of −120 mV, the patch was stepped to prepulse potentials between −110 and −50 mV (ΔV = 5 mV) for 3 s, then a 5-ms-long test pulse to +50 mV was applied to elicit K+ currents (see protocol above). The fraction of noninactivated channels at each voltage was calculated as I/I−120, where I is the peak current evoked by 5-ms depolarization to +50 mV from a prepulse potential applied for 3 s, and I−120 is the peak current evoked by identical depolarization from the holding potential of −120 mV. The superimposed solid line shows the best-fit Boltzmann function to the mean values of I/I−120 ± SEM (n = 5). The Boltzmann function was fitted to the voltage dependence of steady-state inactivation relationships of n = 5 patches to result in V1/2 = −79.1 ± 0.7 mV, k = −8.0 ±0.6 mV (n = 5, mean ± SEM). (E) For measuring the kinetics of recovery from inactivation, pairs of depolarizing pulses were delivered from the holding potential of −120 to +50 mV for 200 ms (see protocol above). Currents recorded during the second pulses (I2) are shown at various ipi at −120 mV holding. Traces recorded with ipi of 0.5 and 60 s are highlighted in red and green, respectively. (F) The fractional recovery was calculated as (I2 − ISS1)/(I1 − ISS1), where I2 and I1 are the peak currents during the second and first pulse, respectively, and ISS1 is the steady-state current at the end of the first depolarization. Data points were fitted with by single exponential function to give the time constant of recovery from inactivation (τrec). Data are given as mean ± SEM; τrec = 4.6 ± 0.6 s (n = 3).
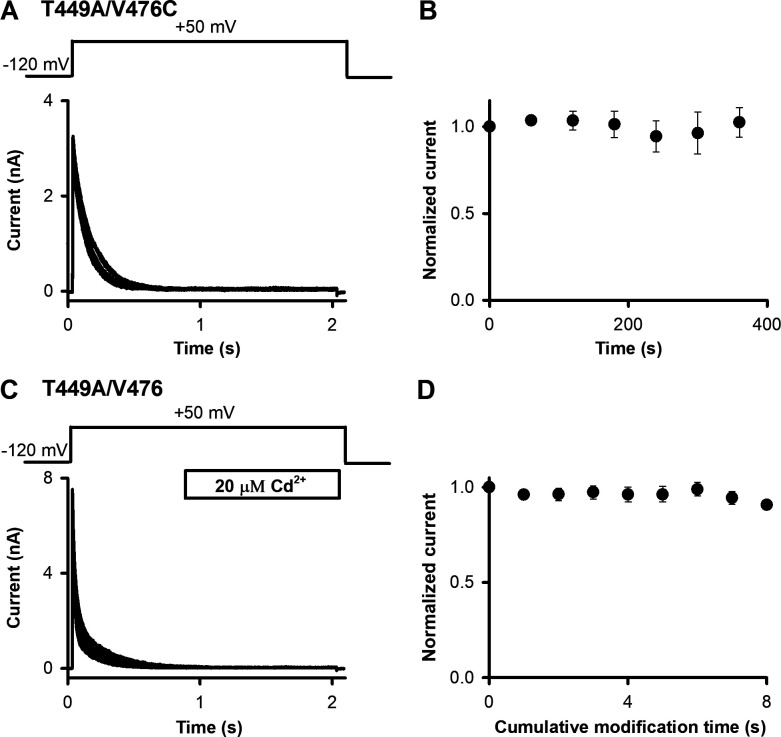
In T449A/V476C channels the extent of recovery from inactivation was monitored by current amplitudes evoked by 2-s-long repeated depolarizations to +50 mV from a holding potential of −120 mV. The ipi was set to 60 s (Fig. 7 A). Currents were normalized to the peak of the first pulse and plotted as a function of time elapsed from the first depolarizing pulse (Fig. 7 B). Repeated depolarizations in the absence of Cd2+ resulted in similar current amplitudes for the T449A/V476C channels; thus, the ipi is sufficient for full recovery of the current.
Figure 7.
Control measurements for determining OI→O transition. (A) An inside-out patch pulled from a HEK293 cell expressing T449A/V476C Shaker-IR channels was repeatedly depolarized from a holding potential of −120 mV to +50 mV for 2 s using the pulse protocol shown above the superimposed raw current traces. The ipi was 60 s. (B) The peak current for each pulse was determined and normalized to the peak current of the first pulse, and then these were plotted as a function of the time elapsed from the first depolarizing pulse. (C) For T449A/V476 channels, the same protocol was used as in A, except that the intracellular surface of the patch was exposed to 20 µM Cd2+. The timing (applied to fully inactivated channels 1 s after the depolarization to +50 mV) and the duration (1 s) of the Cd2+ application are indicated by the horizontal bar. (D) Peak currents for each pulse were determined, normalized to the peak current of the first pulse, and plotted as a function of the cumulative exposure time to 20 µM Cd2+. Error bars indicate SEM throughout the figure; n = 5.
A second control experiment shown in Fig. 7, C and D, demonstrates the lack of peak current reduction by Cd2+ in the absence of 476C. The pulse protocol was identical to the one used in Fig. 7 A except Cd2+ (20 µM) was applied to OI channels for 1 s. We recorded identical peak currents even after long (≤8 s) cumulative exposure of T449A/V476 channels to Cd2+ in the OI state (Fig. 7 D). Thus Cd2+ does not influence the currents in the absence of 476C.
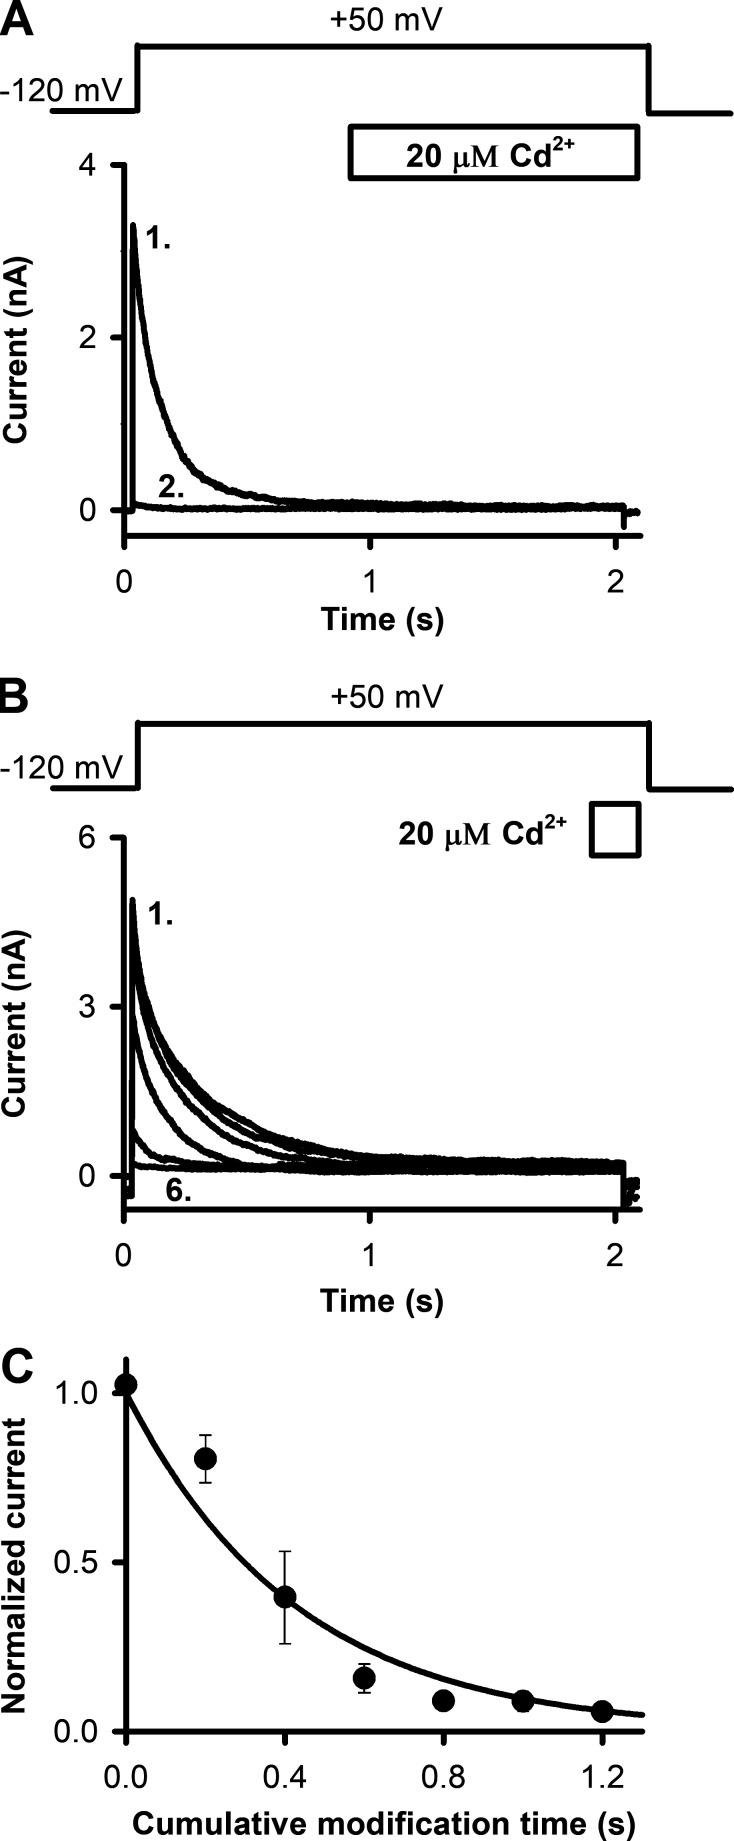
To determine the dependence of recovery from inactivation on the status of the A-gate, we locked open the A-gate of T449A/V476C Shaker-IR channels by intracellular Cd2+ exposure (20 µM) after the full inactivation of the current (i.e., in the OI state) at +50 mV (Fig. 8, A and B). To do this, we essentially repeated the control experiment in Fig. 7 C except that T449A/V476C Shaker-IR channels were used. Cd2+ exposure was timed to the final 1,000 ms of the first 2-s-long depolarizing pulses (Fig. 8 A). The T449A/V476C Shaker construct inactivates completely by the time the Cd2+ application starts (Figs. 2 C and 8 A; τi = 136 ms; Cd2+ application starts after approximately >7× the time constant for inactivation). During the remaining time, patches were perfused by standard intracellular solution. This resulted in complete loss of peak current. Thus, channels that have A-gates locked open with Cd2+ are unable to recover from inactivation (n = 5). We suggest that these channels were trapped in the OI state and therefore remained nonconductive even after a 60-s-long holding at −120 mV. The loss of the current was irreversible. The kinetics of current loss was determined by repeated exposure of the OI channels to 20 µM Cd2+ for short, 200-ms durations (Fig. 8 B). This resulted in a quantized and significant decrement of peak currents (Fig. 8 C) upon cumulative exposure. The loss of the current as a function of cumulative modification time followed a single exponential decay, indicating a specific interaction between the cysteine residue at position 476C and Cd2+.
Figure 8.
Determining the extent of recovery from inactivation after locking open the activation gate of T449A/V476C Shaker-IR channels by Cd2+. (A and B) Inside-out patches pulled from HEK293 cells expressing T449A/V476C Shaker-IR channels were repeatedly depolarized from a holding potential of −120 mV to +50 mV for 2 s using the pulse protocols shown above the corresponding raw current traces. The ipi was 60 s. The timing and duration of the exposure of the intracellular surface of the patch to 20 µM Cd2+ are indicated by the empty bars. (A) 1,000-ms-long perfusion with 20 µM Cd2+ started 1,000 ms after the start of each depolarizing pulse, and the patch was perfused with standard intracellular solution for the remaining time and during the interpulse holding potential. Numbers in the panel indicate the first and second traces. (B) 200-ms-long perfusion with 20 µM Cd2+ started 1,800 ms after the start of each depolarizing pulse, and the patch was perfused with standard intracellular solution for the remaining time and during the interpulse holding potential. Numbers in the panel indicate the first and last traces. (C) Peak currents were determined from experiments as in B and were normalized to the peak of the first pulse (in the absence of Cd2+) and plotted as a function of cumulative exposure to 20 µM Cd2+. Solid line indicates the best-fit single exponential function to the averaged data points. Mean ± SEM values for n = 5 experiments are shown.
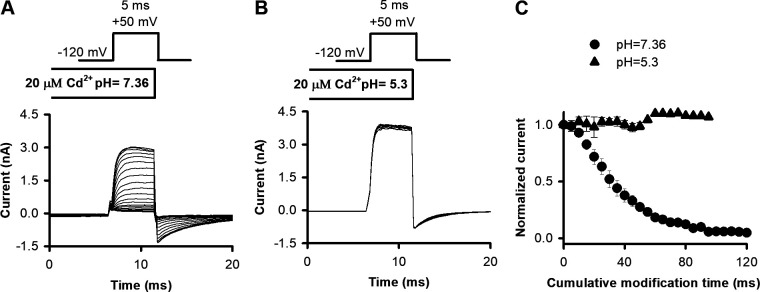
To confirm that this nonconductive OI state is created by a Cd2+ bridge between 476C and H486 in our inactivating V449A construct, we tested whether the Cd2+-induced current loss could be prevented by the protonation of H486 at low pH. A deprotonated H486 is critical for the metal-bridge formation by Cd2+ with 476C (Holmgren et al., 1998; Webster et al., 2004). Depolarizing pulses to +50 mV were applied from a holding of −120 mV every 15 s. Cd2+ application started 200 ms before each pulse and ended simultaneously with the depolarization. The pH of Cd2+ containing intracellular solutions was set to 7.36 (Fig. 9 A) or 5.3 (Fig. 9 B). The development of the locked-open state at pH 7.36 (Fig. 9 A) is indicated by the increased relative amplitudes of the tail currents (compared with tail currents at pH 5.3), followed by a slow decay corresponding to inactivation. The trace-to-trace decrease in the peak currents at +50 mV indicates that locked-open and inactivated channels do not recover from inactivation (Fig. 9 A). This current phenotype and the inactivation process of open channels with locked-open A-gates have been described previously for V476C mutant Shaker channels (Liu et al., 1997; Holmgren et al., 1998; Webster et al., 2004). In contrast, at pH 5.3, where the metal bridge formation is inhibited, both the shape of the tail currents and peak amplitudes of the currents at +50 mV are conserved during repeated depolarizations (Fig. 9 B). Normalized peak currents decrease during cumulative application of Cd2+ at pH 7.36 (solid circles); however, at pH 5.3 (solid triangles), the peaks were maintained at a steady level (Fig. 9 C; n = 4–5).
Figure 9.
Applying Cd2+ in low-pH solutions inhibits metal bridge formation. (A and B) Inside-out patches expressing T449A/V476C channels were repeatedly depolarized the holding potential of −120 mV to +50 mV every 15 s in the presence of 20 µM Cd2+ at pH 7.36 (A) and pH 5.3 (B). Cd2+ was applied intracellularly for 200 ms before opening and during the depolarization to +50 mV. Pulse protocols, with appropriate ipi, were run three to four times in the absence of Cd2+ to verify the stability of the peak currents (not depicted). (C) Peak currents for each pulse were normalized to the peak current of the first pulse and plotted as a function of cumulative modification time. Results represented by different symbols were obtained at pH 7.36 (solid circles) and pH 5.3 (solid triangles). Error bars indicate SEM for n = 4–5 independent measurements.
Discussion
The thermodynamic four-state cycle (Fig. 1) is a useful approximation for exploring gating mechanisms. This model obtains across all voltages, but the probabilities of state occupancy and kinetics of gating transitions will be voltage dependent and thereby determine the likely pathways taken to a given state. In this study, we explored electrophysiologically “silent” gating transitions (transitions not accompanied by measurable current) of Shaker-IR during the development of steady-state inactivation and recovery from inactivation. In both inactivation and recovery from inactivation, entry into and exit from the CI state is crucial. At negative membrane potentials, we find that Shaker K+ channels populate the CI state through the C→O→OI→CI pathway and that the OI→CI transition is mandatory before recovery from inactivation. Support for these conclusions was achieved by demonstrating that (1) the A-gate opens at membrane potentials at which the CI state develops and (2) recovery from inactivation can be prevented when the A-gate is locked open in inactivated channels (OI-state stabilized). Specifically, in the first case, we found that Cd2+ modifies the T449A/V474C Shaker-IR channels at −90 mV, a membrane potential at which steady-state inactivation develops in the absence of measurable current, i.e., the opening of the A-gate of the channel allows Cd2+ to reach 474C behind the A-gate. In the second case, locking the A-gate open using a Cd2+ bridge between 476C and H486 in the T449A/V476C construct renders the channels permanently inactivated, thereby impeding recovery from inactivation. Current literature shows a strong allosteric coupling between the activation and inactivation gates of Shaker: opening of the A-gate promotes closure of the I-gate at the selectivity filter. Here we show that an open A-gate can lock the I-gate in the nonconducting conformation as well. Considering the facilitation of I-gate closure by an open A-gate, we propose that the CI state is populated through the C→O→OI→CI pathway in Shaker at negative membrane potentials.
Closed-state inactivation has been described and reviewed for many ion channels, including voltage-gated sodium, calcium, and potassium channels (Bähring and Covarrubias, 2011; Bähring et al., 2012). The existence of closed-state inactivation in Shaker-IR channels has been shown in the ILT mutant at low pH, but not at physiological pH (Claydon et al., 2007, 2008). The ILT triple substitution in S4, however, disrupts fundamentally the cooperativity between the voltage-sensor and the pore domain and may affect the communication between the activation and C-type inactivation gates as well (Smith-Maxwell et al., 1998). A multiple-state inactivation model was described for the L382I mutant of Shaker which, in contrast to Shaker-IR channels, can inactivate directly from one of the four deep closed states (Ayer and Sigworth, 1997). Residue 382 is located in the S4-S5 linker close to the bottom of the S4 helix and has been identified as an important element in the coupling between activation and inactivation gates (Long et al., 2005); thus the mutation can generate new possible transitions between the C and CI states. Closed-state inactivation has been proposed for Shaker-IR T442A channels also, which contain a T-to-A mutation in the second threonine residue in TTVGYGD signature sequence (Labro et al., 2018). This mutation largely affects the gating properties of the channel because the A-gate opening does not lead to C-type inactivation (inverted allosteric coupling between the activation and C-type inactivation gates; Labro et al., 2018).
In contrast to experiments using mutant Shaker channels having dramatically altered the properties mentioned above (ILT, L382I, and T442A), which led to conclusions based on ionic current measurements at small driving force, we improved the experimental settings in two areas. First, we used Shaker T449A/V474C and T449A/V476C mutants, in which the natural gating processes are conserved, and thus the gating parameters are comparable to the parameters of the wild-type channel (Fig. 2 and Fig. S3). Second, we monitored and manipulated directly the status of the A-gate by Cd2+ modification. This method provides a delicate tool to track A-gate opening (Liu et al., 1997) and lock it in the open state (Holmgren et al., 1998; Webster et al., 2004). Cysteine modification and metal-bridge formation by Cd2+ for 474C and 476C channels are based on sensitive and specific chemical interactions. Because of the applied experimental strategies, the electrophysiologically silent transitions were revealed, and the fast perfusion system provided a precise way to perform Cd2+ modification assays.
In their seminal paper, del Camino and Yellen (2001) showed that the Cd2+ modification rate of Shaker 474C is in a perfect agreement with the normalized open probability (Po) of the channel, i.e., the A-gate provides gated access for Cd2+ to the cysteine in position 474C, located behind the A-gate. As the Po-V relationship is a continuous function, we aimed at increasing the reliability of the RCF readout (Fig. 5) by an appropriate negative control. We showed that when a holding potential of −120 mV was used between P1 and P2, very long exposure (20 s) of high concentration (200 µM) of Cd2+ (10× the concentration used in Fig. 5 A) resulted in RCF = 1, i.e., the data shown in Fig. 4 C serve as a good negative control for the data in Fig. 5. Although Shaker-IR channels in the closed state have a miniature, but measurable, conductance (upper limit of 16 fS; Soler-Llavina et al., 2003), our negative control in Fig. 4 argues that this conductance does not allow significant modification of 474C by Cd2+ at −120 mV.
Based on the experiments shown in Figs. 4 and 5 and the analysis above, we attribute the reduction of RCF to the interaction of Cd2+ with cysteines behind the A-gate. The specific interaction between Cd2+ and cysteine is supported by the fact that a higher concentration of Cd2+ resulted in larger reduction of RCF, as expected for a pseudo–first-order chemical reaction between cysteine and Cd2+ (Fig. 5). In addition, repeated brief changes in the holding potential to −90 mV (or −80 mV; Fig. 6, C and D) in the presence of Cd2+ resulted in a similar increase in IF as a single, long-duration application of Cd2+ (Fig. 5). Furthermore, the analysis of the time dependence of the reaction could be extended by repeated short-duration application of Cd2+ without increasing the chance of nonspecific interactions, which may happen at a single, long-lasting application of Cd2+. In summary, we conclude from experiments shown in Figs. 3, 4, 5, and 6 that the Cd2+ accessibility assay based on a specific interaction between 474C and Cd2+ and performed by a fast-step perfusion system in our experimental setup provides an appropriate tool to detect A-gate opening via determining the reduction in RCF.
Data in Fig. 5 show that RCF is nonzero at all tested membrane potentials. This may mean that either only a fraction of channels that contribute to steady-state inactivation are in the state where Cd2+ can interact with them, or perhaps all of them are in the Cd2+-accessible state but Cd2+ does not modify all the channels within 20 s. In the latter case, the RCF should decrease with an increase in the Cd2+ concentration, as we have shown clearly in Fig. 5 C. Short, repeated applications of Cd2+ resulting in increased cumulative exposure time resulted in more significant current loss (increase in IF, Fig. 6), which also supports the hypothesis that channels are in the Cd2+-accessible state when steady-state inactivation takes place. Both IF and RCF parameters are expected to show membrane potential dependence, which is demonstrated in Figs. 5 and 6.
Our experiments clearly demonstrate that a significant fraction of Shaker-IR channels have open A-gates and interact with Cd2+ at negative membrane potentials where steady-state inactivation takes place. A simple conclusion from this finding could be that some channels open and then inactivate at −90 mV, and these are the channels that can be modified by Cd2+. That is, opening of the channels precedes inactivation, and the gating steps resulting in steady-state inactivation are C→O→OI. In reality, both O and OI channels can be modified by Cd2+ through 474C (Panyi and Deutsch, 2007). Thus, we cannot rule out the possibility that the reduction of RCF is the consequence of Cd2+ interacting with channels generated by C→CI→OI transition at −90 mV. However, we suggest this latter scenario is less likely for two reasons. First, Cd2+ modification of OI channels occurs at an ∼20-fold lower rate compared with O channels (Panyi and Deutsch, 2007). Second, recent publications argue that opening of the A-gate triggers the collapse of the selectivity filter in Shaker. That is, the principal transition leading to the OI state is O→OI (Labro et al., 2018), so the state that was modified by Cd2+ should rather be the O state preceding the OI state. This conclusion may hold for Shaker constructs, e.g., T449A, where C-type inactivation dominates the inactivation process (Jamieson and Jones, 2014). However, in Shaker-IR channels displaying other slow-inactivation mechanisms, e.g., U-type inactivation, transitions to the inactivated state may occur predominantly from closed states (Klemic et al., 2001).
Compared to other gating transitions, relatively less is known about the pathway and the molecular rearrangements leading to recovery from C-type inactivation. In a classic scenario during prolonged depolarization, the slow inactivation gate shuts (OI state), and returning to a negative membrane potential induces the OI→CI transition. Channels in the CI-state will, under a sufficiently negative and prolonged repolarization period, recover from inactivation and populate the closed state (C). The rate of recovery can be modulated by many factors, e.g., the concentration of extracellular and intracellular cations, extracellular pH, and the membrane potential (Pardo et al., 1992; Levy and Deutsch, 1996a, 1996b; Rasmusson et al., 1998; Ray and Deutsch, 2006). The rate-limiting step in recovery from inactivation is the CI→C transition, as OI→CI is very fast (milliseconds) in Shaker (Panyi and Deutsch, 2006), whereas recovery from inactivation is on the time scale of many seconds. Our previous finding that the A-gate of inactivated channels closes relatively quickly (time constant is 23 ms at −120 mV; Panyi and Deutsch, 2006) does not rule out the possibility of recovery (i.e., a selectivity filter in the conductive state) with an open A-gate.
If closure of the A-gate is obligatory for recovery, then channels with a locked-open A-gate will remain inactivated, i.e., recovery from inactivation is precluded. This is what we demonstrated for Shaker-IR in Fig. 8: locking the A-gate open in inactivated channels (OI) using a single, 1-s application of Cd2+ or by repeated administration for 200-ms-long Cd2+ pulses completely prevented recovery from inactivation. The decrement in peaks upon cumulative Cd2+ exposure follows a single-exponential decay, indicating the specific interaction between Cd2+ and T449A/V476C channels in Fig. 8 C. We concluded from these data that recovery from inactivation is not possible with a locked-open A-gate.
This conclusion is based on the loss of the current upon Cd2+ application (Fig. 8). Divalent cations are known to inhibit ion channels, e.g., Ba2+ blocks Shaker and other KV channels (Armstrong and Taylor, 1980; Hurst et al., 1995; Harris et al., 1998; Gibor et al., 2004), and Cd2+ blocks several ion channels (Hobai et al., 1997; Abbruzzese et al., 2010; Tu et al., 2016). A critical control to support our conclusion was therefore to demonstrate that Cd2+ does not inhibit Shaker-IR lacking the critical cysteine in position 476 (Fig. 7 B). We also showed that the 60-s-long ipi between repetitive depolarizing pulses is sufficient for a full recovery from inactivation in control (Fig. 7 A). Thus, the current loss demonstrated in Fig. 8 cannot be explained by an inadequately short holding at −120 mV between pulses.
Locking the A-gate in the open configuration using a Cd2+ bridge between 476C and a histidine of a neighboring subunit (H486) was described in detail for a Shaker-IR channel (Webster et al., 2004). To confirm the existence of the Cd2+ bridge between H486 and 476C in the inactivating T449A/V476C Shaker-IR construct, we changed the intracellular pH. At low intracellular pH (5.3), where histidines are protonated (pKa ∼6.0), Cd2+ is unable to modify the currents (Fig. 9 C). This argues for a specific action between Cd2+, H486, and 476C.
We conclude that closure of the A-gate is a precondition for recovery from inactivation and that the sequence of gating transitions is O→OI→CI→C at negative membrane potentials. Based on this scheme, an intracellular open channel blocker that prevents A-gate closure might slow and delay recovery from inactivation. Analogous to our findings in Shaker, it has been demonstrated for NaV channels that channel deactivation needs to precede recovery from inactivation (Kuo and Bean, 1994).
Our investigation has used a novel combination of voltage protocols and modification strategies to define the gating scheme that underlies steady-state inactivation for Shaker at negative membrane potentials, and to identify a prerequisite for recovery from inactivation. We propose that the most likely pathway for the development of steady-state inactivation is C→O→OICI. Moreover, the OI→CI transition is a prerequisite for recovery from inactivation. This sequence of gating transitions complies with tight coupling between the activation and C-type inactivation gates. The biological significance of these findings is that both steady-state inactivation and recovery from inactivation essentially determine the fraction of channels available to open, which is critical to excitability in nerve and muscle cells.
Acknowledgments
Christopher J. Lingle served as editor.
We thank the expert technical assistance of Cecilia Nagy.
This work was supported by the Hungarian Academy of Sciences projects KTIA_NAP_13-2-2015-0009 and KTIA_NAP_13-2-2017-0013 (Z. Varga). The following grants also supported this work: National Research Development and Innovation Office, Hungary grants OTKA K132906 (Z. Varga) and OTKA K119417 (G. Panyi, F. Zakany); Ministry of Human Capacities, Hungary grant EFOP-3.6.2-16-2017-00006 (G. Panyi); and Ministry of Finance, Hungary grant GINOP-2.3.2-15-2016-00015 (G. Panyi). The project is co-financed by the European Union and the European Regional Development Fund. F. Zakany was supported by the New National Excellence Program of the Ministry for Innovation and Technology (ÚNKP-19-3-III-DE-92). The support of National Institutes of Health grant GM 52302 (C.J. Deutsch) is highly appreciated.
The authors declare no competing financial interests.
Author contributions: T.G. Szanto: Conceptualization, Investigation, Formal analysis, and Writing–Original Draft; F. Zakany: Conceptualization, Investigation, Formal analysis, and Writing–Original Draft; F. Papp: Investigation and Formal analysis; Z. Varga: Conceptualization and Writing–Review & Editing; C.J. Deutsch: Conceptualization, Writing–Original Draft, Writing–Review & Editing, and Funding acquisition; G. Panyi: Conceptualization, Writing–Original Draft, Writing–Review & Editing, Funding acquisition, and Methodology.
References
- Abbruzzese J., Sachse F.B., Tristani-Firouzi M., and Sanguinetti M.C.. 2010. Modification of hERG1 channel gating by Cd2+. J. Gen. Physiol. 136:203–224. 10.1085/jgp.201010450 [DOI] [PMC free article] [PubMed] [Google Scholar]
- Armstrong C.M., and Taylor S.R.. 1980. Interaction of barium ions with potassium channels in squid giant axons. Biophys. J. 30:473–488. 10.1016/S0006-3495(80)85108-3 [DOI] [PMC free article] [PubMed] [Google Scholar]
- Ayer R.K. Jr., and Sigworth F.J.. 1997. Enhanced closed-state inactivation in a mutant Shaker K+ channel. J. Membr. Biol. 157:215–230. 10.1007/s002329900230 [DOI] [PubMed] [Google Scholar]
- Bähring R., and Covarrubias M.. 2011. Mechanisms of closed-state inactivation in voltage-gated ion channels. J. Physiol. 589:461–479. 10.1113/jphysiol.2010.191965 [DOI] [PMC free article] [PubMed] [Google Scholar]
- Bähring R., Barghaan J., Westermeier R., and Wollberg J.. 2012. Voltage sensor inactivation in potassium channels. Front. Pharmacol. 3:100 10.3389/fphar.2012.00100 [DOI] [PMC free article] [PubMed] [Google Scholar]
- Bean B.P. 2007. The action potential in mammalian central neurons. Nat. Rev. Neurosci. 8:451–465. 10.1038/nrn2148 [DOI] [PubMed] [Google Scholar]
- Bezanilla F. 2000. The voltage sensor in voltage-dependent ion channels. Physiol. Rev. 80:555–592. 10.1152/physrev.2000.80.2.555 [DOI] [PubMed] [Google Scholar]
- Bocksteins E. 2016. Kv5, Kv6, Kv8, and Kv9 subunits: No simple silent bystanders. J. Gen. Physiol. 147:105–125. 10.1085/jgp.201511507 [DOI] [PMC free article] [PubMed] [Google Scholar]
- Claydon T.W., Kehl S.J., and Fedida D.. 2008. Closed-state inactivation induced in K(V)1 channels by extracellular acidification. Channels (Austin). 2:139–142. 10.4161/chan.2.2.6231 [DOI] [PubMed] [Google Scholar]
- Claydon T.W., Vaid M., Rezazadeh S., Kwan D.C., Kehl S.J., and Fedida D.. 2007. A direct demonstration of closed-state inactivation of K+ channels at low pH. J. Gen. Physiol. 129:437–455. 10.1085/jgp.200709774 [DOI] [PMC free article] [PubMed] [Google Scholar]
- Cordero-Morales J.F., Jogini V., Chakrapani S., and Perozo E.. 2011. A multipoint hydrogen-bond network underlying KcsA C-type inactivation. Biophys. J. 100:2387–2393. 10.1016/j.bpj.2011.01.073 [DOI] [PMC free article] [PubMed] [Google Scholar]
- Cuello L.G., Cortes D.M., and Perozo E.. 2017. The gating cycle of a K+ channel at atomic resolution. eLife. 6 e28032 10.7554/eLife.28032 [DOI] [PMC free article] [PubMed] [Google Scholar]
- Cuello L.G., Jogini V., Cortes D.M., Pan A.C., Gagnon D.G., Dalmas O., Cordero-Morales J.F., Chakrapani S., Roux B., and Perozo E.. 2010a Structural basis for the coupling between activation and inactivation gates in K(+) channels. Nature. 466:272–275. 10.1038/nature09136 [DOI] [PMC free article] [PubMed] [Google Scholar]
- Cuello L.G., Jogini V., Cortes D.M., and Perozo E.. 2010b Structural mechanism of C-type inactivation in K(+) channels. Nature. 466:203–208. 10.1038/nature09153 [DOI] [PMC free article] [PubMed] [Google Scholar]
- del Camino D., and Yellen G.. 2001. Tight steric closure at the intracellular activation gate of a voltage-gated K(+) channel. Neuron. 32:649–656. 10.1016/S0896-6273(01)00487-1 [DOI] [PubMed] [Google Scholar]
- Ding S., and Horn R.. 2002. Tail end of the s6 segment: role in permeation in shaker potassium channels. J. Gen. Physiol. 120:87–97. 10.1085/jgp.20028611 [DOI] [PMC free article] [PubMed] [Google Scholar]
- Gibor G., Yakubovich D., Peretz A., and Attali B.. 2004. External barium affects the gating of KCNQ1 potassium channels and produces a pore block via two discrete sites. J. Gen. Physiol. 124:83–102. 10.1085/jgp.200409068 [DOI] [PMC free article] [PubMed] [Google Scholar]
- Harris R.E., Larsson H.P., and Isacoff E.Y.. 1998. A permanent ion binding site located between two gates of the Shaker K+ channel. Biophys. J. 74:1808–1820. 10.1016/S0006-3495(98)77891-9 [DOI] [PMC free article] [PubMed] [Google Scholar]
- Hobai I.A., Bates J.A., Howarth F.C., and Levi A.J.. 1997. Inhibition by external Cd2+ of Na/Ca exchange and L-type Ca channel in rabbit ventricular myocytes. Am. J. Physiol. 272:H2164–H2172. [DOI] [PubMed] [Google Scholar]
- Holmgren M., Jurman M.E., and Yellen G.. 1996. N-type inactivation and the S4-S5 region of the Shaker K+ channel. J. Gen. Physiol. 108:195–206. 10.1085/jgp.108.3.195 [DOI] [PMC free article] [PubMed] [Google Scholar]
- Holmgren M., Shin K.S., and Yellen G.. 1998. The activation gate of a voltage-gated K+ channel can be trapped in the open state by an intersubunit metal bridge. Neuron. 21:617–621. 10.1016/S0896-6273(00)80571-1 [DOI] [PubMed] [Google Scholar]
- Hoshi T., and Armstrong C.M.. 2013. C-type inactivation of voltage-gated K+ channels: pore constriction or dilation? J. Gen. Physiol. 141:151–160. 10.1085/jgp.201210888 [DOI] [PMC free article] [PubMed] [Google Scholar]
- Hoshi T., Zagotta W.N., and Aldrich R.W.. 1990. Biophysical and molecular mechanisms of Shaker potassium channel inactivation. Science. 250:533–538. 10.1126/science.2122519 [DOI] [PubMed] [Google Scholar]
- Hoshi T., Zagotta W.N., and Aldrich R.W.. 1991. Two types of inactivation in Shaker K+ channels: effects of alterations in the carboxy-terminal region. Neuron. 7:547–556. 10.1016/0896-6273(91)90367-9 [DOI] [PubMed] [Google Scholar]
- Hurst R.S., Latorre R., Toro L., and Stefani E.. 1995. External barium block of Shaker potassium channels: evidence for two binding sites. J. Gen. Physiol. 106:1069–1087. 10.1085/jgp.106.6.1069 [DOI] [PMC free article] [PubMed] [Google Scholar]
- Jamieson Q., and Jones S.W.. 2014. Shaker IR T449 mutants separate C- from U-type inactivation. J. Membr. Biol. 247:319–330. 10.1007/s00232-014-9634-3 [DOI] [PubMed] [Google Scholar]
- Jan L.Y., and Jan Y.N.. 2012. Voltage-gated potassium channels and the diversity of electrical signalling. J. Physiol. 590:2591–2599. 10.1113/jphysiol.2011.224212 [DOI] [PMC free article] [PubMed] [Google Scholar]
- Klemic K.G., Kirsch G.E., and Jones S.W.. 2001. U-type inactivation of Kv3.1 and Shaker potassium channels. Biophys. J. 81:814–826. 10.1016/S0006-3495(01)75743-8 [DOI] [PMC free article] [PubMed] [Google Scholar]
- Kuo C.C., and Bean B.P.. 1994. Na+ channels must deactivate to recover from inactivation. Neuron. 12:819–829. 10.1016/0896-6273(94)90335-2 [DOI] [PubMed] [Google Scholar]
- Kurata H.T., and Fedida D.. 2006. A structural interpretation of voltage-gated potassium channel inactivation. Prog. Biophys. Mol. Biol. 92:185–208. 10.1016/j.pbiomolbio.2005.10.001 [DOI] [PubMed] [Google Scholar]
- Labro A.J., Cortes D.M., Tilegenova C., and Cuello L.G.. 2018. Inverted allosteric coupling between activation and inactivation gates in K+ channels. Proc. Natl. Acad. Sci. USA. 115:5426–5431. 10.1073/pnas.1800559115 [DOI] [PMC free article] [PubMed] [Google Scholar]
- Levy D.I., and Deutsch C.. 1996a Recovery from C-type inactivation is modulated by extracellular potassium. Biophys. J. 70:798–805. 10.1016/S0006-3495(96)79619-4 [DOI] [PMC free article] [PubMed] [Google Scholar]
- Levy D.I., and Deutsch C.. 1996b A voltage-dependent role for K+ in recovery from C-type inactivation. Biophys. J. 71:3157–3166. 10.1016/S0006-3495(96)79509-7 [DOI] [PMC free article] [PubMed] [Google Scholar]
- Liu Y., Holmgren M., Jurman M.E., and Yellen G.. 1997. Gated access to the pore of a voltage-dependent K+ channel. Neuron. 19:175–184. 10.1016/S0896-6273(00)80357-8 [DOI] [PubMed] [Google Scholar]
- Long S.B., Campbell E.B., and Mackinnon R.. 2005. Voltage sensor of Kv1.2: structural basis of electromechanical coupling. Science. 309:903–908. 10.1126/science.1116270 [DOI] [PubMed] [Google Scholar]
- López-Barneo J., Hoshi T., Heinemann S.H., and Aldrich R.W.. 1993. Effects of external cations and mutations in the pore region on C-type inactivation of Shaker potassium channels. Receptors Channels. 1:61–71. [PubMed] [Google Scholar]
- MacDonald P.E., and Wheeler M.B.. 2003. Voltage-dependent K(+) channels in pancreatic beta cells: role, regulation and potential as therapeutic targets. Diabetologia. 46:1046–1062. 10.1007/s00125-003-1159-8 [DOI] [PubMed] [Google Scholar]
- Matteson D.R., and Deutsch C.. 1984. K channels in T lymphocytes: a patch clamp study using monoclonal antibody adhesion. Nature. 307:468–471. 10.1038/307468a0 [DOI] [PubMed] [Google Scholar]
- Matthies D., Bae C., Toombes G.E., Fox T., Bartesaghi A., Subramaniam S., and Swartz K.J.. 2018. Single-particle cryo-EM structure of a voltage-activated potassium channel in lipid nanodiscs. eLife. 7 e37558 10.7554/eLife.37558 [DOI] [PMC free article] [PubMed] [Google Scholar]
- Ogielska E.M., and Aldrich R.W.. 1999. Functional consequences of a decreased potassium affinity in a potassium channel pore. Ion interactions and C-type inactivation. J. Gen. Physiol. 113:347–358. 10.1085/jgp.113.2.347 [DOI] [PMC free article] [PubMed] [Google Scholar]
- Ostmeyer J., Chakrapani S., Pan A.C., Perozo E., and Roux B.. 2013. Recovery from slow inactivation in K+ channels is controlled by water molecules. Nature. 501:121–124. 10.1038/nature12395 [DOI] [PMC free article] [PubMed] [Google Scholar]
- Panyi G., and Deutsch C.. 2006. Cross talk between activation and slow inactivation gates of Shaker potassium channels. J. Gen. Physiol. 128:547–559. 10.1085/jgp.200609644 [DOI] [PMC free article] [PubMed] [Google Scholar]
- Panyi G., and Deutsch C.. 2007. Probing the cavity of the slow inactivated conformation of shaker potassium channels. J. Gen. Physiol. 129:403–418. 10.1085/jgp.200709758 [DOI] [PMC free article] [PubMed] [Google Scholar]
- Panyi G., Varga Z., and Gáspár R.. 2004. Ion channels and lymphocyte activation. Immunol. Lett. 92:55–66. 10.1016/j.imlet.2003.11.020 [DOI] [PubMed] [Google Scholar]
- Pardo L.A., Heinemann S.H., Terlau H., Ludewig U., Lorra C., Pongs O., and Stühmer W.. 1992. Extracellular K+ specifically modulates a rat brain K+ channel. Proc. Natl. Acad. Sci. USA. 89:2466–2470. 10.1073/pnas.89.6.2466 [DOI] [PMC free article] [PubMed] [Google Scholar]
- Pau V., Zhou Y., Ramu Y., Xu Y., and Lu Z.. 2017. Crystal structure of an inactivated mutant mammalian voltage-gated K+ channel. Nat. Struct. Mol. Biol. 24:857–865. 10.1038/nsmb.3457 [DOI] [PMC free article] [PubMed] [Google Scholar]
- Pérez-García M.T., Cidad P., and López-López J.R.. 2018. The secret life of ion channels: Kv1.3 potassium channels and proliferation. Am. J. Physiol. Cell Physiol. 314:C27–C42. 10.1152/ajpcell.00136.2017 [DOI] [PubMed] [Google Scholar]
- Pless S.A., Galpin J.D., Niciforovic A.P., Kurata H.T., and Ahern C.A.. 2013. Hydrogen bonds as molecular timers for slow inactivation in voltage-gated potassium channels. eLife. 2 e01289 10.7554/eLife.01289 [DOI] [PMC free article] [PubMed] [Google Scholar]
- Rasmusson R.L., Morales M.J., Wang S., Liu S., Campbell D.L., Brahmajothi M.V., and Strauss H.C.. 1998. Inactivation of voltage-gated cardiac K+ channels. Circ. Res. 82:739–750. 10.1161/01.RES.82.7.739 [DOI] [PubMed] [Google Scholar]
- Ray E.C., and Deutsch C.. 2006. A trapped intracellular cation modulates K+ channel recovery from slow inactivation. J. Gen. Physiol. 128:203–217. 10.1085/jgp.200609561 [DOI] [PMC free article] [PubMed] [Google Scholar]
- Sadovsky E., and Yifrach O.. 2007. Principles underlying energetic coupling along an allosteric communication trajectory of a voltage-activated K+ channel. Proc. Natl. Acad. Sci. USA. 104:19813–19818. 10.1073/pnas.0708120104 [DOI] [PMC free article] [PubMed] [Google Scholar]
- Smith P.L., Baukrowitz T., and Yellen G.. 1996. The inward rectification mechanism of the HERG cardiac potassium channel. Nature. 379:833–836. 10.1038/379833a0 [DOI] [PubMed] [Google Scholar]
- Smith-Maxwell C.J., Ledwell J.L., and Aldrich R.W.. 1998. Uncharged S4 residues and cooperativity in voltage-dependent potassium channel activation. J. Gen. Physiol. 111:421–439. 10.1085/jgp.111.3.421 [DOI] [PMC free article] [PubMed] [Google Scholar]
- Soler-Llavina G.J., Holmgren M., and Swartz K.J.. 2003. Defining the conductance of the closed state in a voltage-gated K+ channel. Neuron. 38:61–67. 10.1016/S0896-6273(03)00157-0 [DOI] [PubMed] [Google Scholar]
- Tu Y.C., Yang Y.C., and Kuo C.C.. 2016. Modulation of NMDA channel gating by Ca2+ and Cd2+ binding to the external pore mouth. Sci. Rep. 6:37029 10.1038/srep37029 [DOI] [PMC free article] [PubMed] [Google Scholar]
- Villalonga N., David M., Bielanska J., Vicente R., Comes N., Valenzuela C., and Felipe A.. 2010. Immunomodulation of voltage-dependent K+ channels in macrophages: molecular and biophysical consequences. J. Gen. Physiol. 135:135–147. 10.1085/jgp.200910334 [DOI] [PMC free article] [PubMed] [Google Scholar]
- Webster S.M., Del Camino D., Dekker J.P., and Yellen G.. 2004. Intracellular gate opening in Shaker K+ channels defined by high-affinity metal bridges. Nature. 428:864–868. 10.1038/nature02468 [DOI] [PubMed] [Google Scholar]
- Yellen G. 1998. The moving parts of voltage-gated ion channels. Q. Rev. Biophys. 31:239–295. 10.1017/S0033583598003448 [DOI] [PubMed] [Google Scholar]


