The essential mammalian mechanosensitive channel PIEZO1 organizes in the plasma membrane into nanometric clusters that depend on the integrity of cholesterol domains to rapidly detect applied force and especially inactivate synchronously, the most commonly altered feature of PIEZO1 in pathology.
Abstract
The human mechanosensitive ion channel PIEZO1 is gated by membrane tension and regulates essential biological processes such as vascular development and erythrocyte volume homeostasis. Currently, little is known about PIEZO1 plasma membrane localization and organization. Using a PIEZO1-GFP fusion protein, we investigated whether cholesterol enrichment or depletion by methyl-β-cyclodextrin (MBCD) and disruption of membrane cholesterol organization by dynasore affects PIEZO1-GFP’s response to mechanical force. Electrophysiological recordings in the cell-attached configuration revealed that MBCD caused a rightward shift in the PIEZO1-GFP pressure–response curve, increased channel latency in response to mechanical stimuli, and markedly slowed channel inactivation. The same effects were seen in native PIEZO1 in N2A cells. STORM superresolution imaging revealed that, at the nanoscale, PIEZO1-GFP channels in the membrane associate as clusters sensitive to membrane manipulation. Both cluster distribution and diffusion rates were affected by treatment with MBCD (5 mM). Supplementation of polyunsaturated fatty acids appeared to sensitize the PIEZO1-GFP response to applied pressure. Together, our results indicate that PIEZO1 function is directly dependent on the membrane composition and lateral organization of membrane cholesterol domains, which coordinate the activity of clustered PIEZO1 channels.
Introduction
Mechanosensitive ion channels are membrane proteins that sense mechanical stimuli, allowing cells to respond and adapt to physical forces. An essential family of eukaryotic mechanosensitive channels are PIEZO channels (Coste et al., 2010) comprised of two members, PIEZO1 and PIEZO2 (Wu et al., 2017a). These channels are associated with a number of physiological functions, such as the development of vascular architecture (Li et al., 2014; Rode et al., 2017). Human PIEZO1 also plays a key role in erythrocyte volume regulation (Cahalan et al., 2015), in which gain-of-function variants cause hereditary dehydrated stomatocytosis (xerocytosis; Zarychanski et al., 2012; Albuisson et al., 2013; Andolfo et al., 2013; Bae et al., 2013a). These mutations invariably slow channel inactivation, and this phenotype confers native resistance to malarial invasion in African populations (Ma et al., 2018).
Three recently published cryo-EM structures of purified mouse PIEZO1 provide detailed information of its trimeric, curved structure (Ge et al., 2015; Guo and MacKinnon, 2017; Saotome et al., 2018; Zhao et al., 2018). Three homomeric subunits form a central nonselective cation-permeable pore with a large-scale propeller-like assembly (Ge et al., 2015; Guo and MacKinnon, 2017). Large beams that extend from the central pore axis to the extremity of the protein have been proposed to underlie a lever-like mechanism to transfer force from the periphery to the channel gate (Guo and MacKinnon, 2017; Zhao et al., 2018). Activation of PIEZO1 is associated with a force-from-lipids mechanism (Martinac et al., 1990; Lewis and Grandl, 2015; Teng et al., 2015; Cox et al., 2016a; Syeda et al., 2016), in which lipid bilayer forces are sufficient to drive an as-yet-unknown conformational change in PIEZO1 and trigger gating. This suggests that both global effects on membrane physical properties and specific lipid interactions are likely to be essential for PIEZO1 function (Cox et al., 2016b; Cordero-Morales and Vásquez, 2018; Romero et al., 2019).
Cholesterol is a ubiquitous component of cellular membranes and a major modulator of membrane mechanical properties. Application of the cholesterol-depleting agent methyl-β-cyclodextrin (MBCD) reduced whole-cell indentation-induced currents in PIEZO1-expressing cells (Qi et al., 2015). This response was linked to the cholesterol-binding protein stomatin-like 3 (STOML3), previously shown to sensitize PIEZO1 channels (Poole et al., 2014). Furthermore, a cross-linking–based proteomics study reported a nonrandom degree of association between a cholesterol analogue and PIEZO1 (Hulce et al., 2013). Thus, there is mounting evidence indicating physiologically relevant interplay between cholesterol and PIEZO1-mediated mechanotransduction. In humans, the difference in the tissue expression pattern of STOML3 and the more ubiquitous PIEZO1 suggests that STOML3-mediated cholesterol sensitization of PIEZO1 may be tissue specific (Uhlén et al., 2015).
In this study, we characterized the effects of cholesterol on PIEZO1 activity in cells with undetectable levels of STOML3 (Sultan et al., 2008; Uhlén et al., 2015). Using superresolution stochastic optical reconstruction microscopy (STORM) imaging, we show that PIEZO1 channels in the plasma membrane associate as clusters. Cholesterol removal or disruption affected the dynamics of these PIEZO1 clusters but had only a minor effect on their size. Removal of cholesterol or disruption of cholesterol-rich domains reduced channel sensitivity, slowed down activation, and abolished inactivation in cell-attached patches. We imaged both cholesterol-rich membrane domains and PIEZO1 in HEK293T cells stably expressing the channel protein, using both standard and superresolution fluorescence microscopy to quantify the dynamic behavior of PIEZO1 and its relationship with cholesterol-rich membrane domains. Furthermore, we suggest a model of the PIEZO1 and cholesterol interaction and propose that this association is essential for the spatiotemporal activity of PIEZO1.
Materials and methods
Patch-clamp electrophysiology
All recordings of human PIEZO1 were obtained from HEK293T cells stably expressing PIEZO1-1591–GFP (Syeda et al., 2016), a previously characterized fusion protein (Cox et al., 2016a). N2A cells were a kind gift from Dr. K. Poole (University of New South Wales, Kensington, Australia). PIEZO1 KO HEK293T cells were a kind gift from Prof. A. Patapoutian (Scripps Institute, La Jolla, CA). Transient transfection of PIEZO1-KO cells with plasmid expressing the R2456H Piezo1 mutant was performed using polyethyleneimine according to the manufacturer’s protocol. The same transfection protocol was used to prepare cells for transient versus stable cell line Piezo1 expression (see Fig. S6). Cells were plated onto 12-mm round glass coverslips and grown in Dulbecco’s modified Eagle medium (DMEM) supplemented with 10% FBS. Cells were treated with 0.1, 0.5, 1, 5, or 10 mM MBCD (C4555; Sigma-Aldrich), 100 µg/ml water-soluble cholesterol/MBCD complex (C4951; Sigma-Aldrich; product contains 40 mg cholesterol per gram of compound, and the compound molarity during the 100 µg/ml treatment is equivalent to 10 µM cholesterol and 75 µM MBCD) or 80 µM dynasore (D7693; Sigma-Aldrich) in serum-free DMEM for 30 min at 37°C. Untreated control samples were also incubated in serum-free DMEM at 37°C for 30 min before patch-clamping. Docosahexanoic acid (DHA) treatment was performed by culturing cells for 24 or 48 h in DMEM supplemented with 10% FBS and 25 µM DHA (D2534; Sigma-Aldrich). All recordings were performed in identical pipette/bath solutions having the following composition: 140 mM NaCl, 3 mM KCl, 1 mM MgCl2, 1 mM CaCl2, 10 mM glucose, and 10 mM HEPES, pH 7.4. Borosilicate glass pipettes (Drummond Scientific) were pulled using a Narishige puller (PP-83; Narishige) to achieve a bubble number of 6.0 (3-MΩ pipette resistance). The PIEZO1 currents were recorded at room temperature using an AxoPatch 200B amplifier (Axon Instruments) in the cell-attached patch configuration, at a 20-kHz sampling rate with 1-kHz filtration. Negative pressure was applied to the membrane patch using a computer-controlled high-speed pressure clamp-1 apparatus (HSPC-1; ALA Scientific Instruments).
Figure S6.
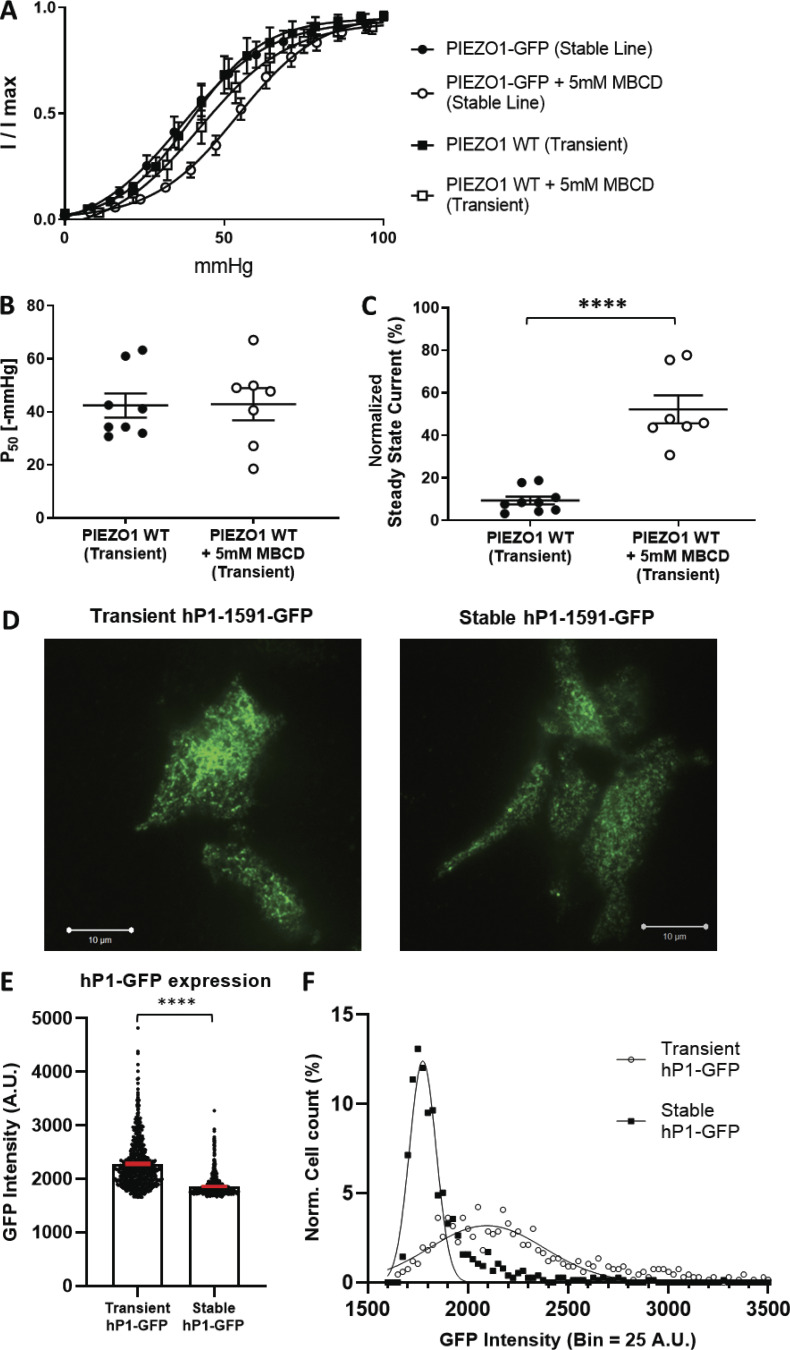
Effect of cholesterol depletion via MBCD on transiently transfected WT human PIEZO1. (A) Boltzmann curve fits of normalized I/Imax values from all control and MBCD-treated cells stably or transiently expressing human PIEZO1 proteins. Data for the stable cell line is quantified in Fig. 1 F. (B) Quantification of midpoint activation pressure for transiently expressed WT human PIEZO1. PIEZO1 WT (n = 8 cells), PIEZO1 WT + MBCD (n = 7 cells). (C) Quantification of channel inactivation expressed as normalized steady-state current for transiently expressed WT human PIEZO1. PIEZO1 WT (n = 9 cells), PIEZO1 WT + 5 mM MBCD (n = 7 cells). Statistical analysis was performed using Student’s t test; ****, P < 0.0001. (D) TIRF imaging of transiently expressed hP1-GFP in PIEZO1-KO HEK293T cells (left) and stably expressed hP1-GFP from hP1-GFP-CellLine (right). Scale bar represents 10 µm. (E) Average GFP intensity detected in the basal membrane of transiently or stably expressed PIEZO1-GFP. Transient hP1-GFP (n = 662 cells), stable hP1-GFP (n = 756 cells), imaged over three separate sample preparations. Error bars indicate SEM; ****, P < 0.0001. (F) Normalized cell count histogram of the range of observed fluorescence intensities exhibited by cells over the course of the imaging experiments (bin size = 25 A.U.).
Cell culture and sample preparation for imaging
PIEZO1-GFP stable HEK293T cells were seeded in DMEM (Gibco) supplemented with 10% FBS inside 35-mm diameter Fluorodishes (FD35-100; World Precision Instruments) and grown to 70–85% confluency for 2–3 d. For colocalization studies, cells were incubated in 1:1,000 dilution of cholera toxin subunit B (CtxB)–Alexa Fluor 555 (Invitrogen; 5 mg/ml stock) and rinsed three times with PBS. After labeling, treatments were performed as described above, and cells were immediately imaged live on a Zeiss Elyra microscope.
Estimation of plasma membrane cholesterol using Filipin III was performed as previously described (Qin et al., 2006). Briefly, 50 mg/ml Filipin III (F4767; Sigma-Aldrich) stock in DMSO was diluted 1:1,000 in PBS and incubated for 1 h at room temperature with fixed, treated, or untreated cells. Afterward, cells were extensively washed in PBS and stored at 4°C before imaging experiments. TIRF imaging was performed as described below by exciting the sample with a 405-nm laser at a 63° angle and detection through an α Plan-Apochromat 100×/1.46 oil objective of the Zeiss Elyra microscope.
The plasmids shown in Table 1 were transfected using Lipofectamine 3000 (L3000001; Thermo Fisher Scientific) according to the manufacturer’s protocol and used for image cross-correlation spectroscopy (ICCS) control experiments (see Fig. S12). The D4Hα-mCherry (θ toxin domain 4) fluorescent marker of cholesterol domains (Johnson et al., 2012; Maekawa, 2017) was used to monitor cholesterol levels during MBCD treatments (see Fig. S2).
Table 1. Plasmids used in this study.
| Gene | Species | Vector | Reference |
|---|---|---|---|
| Lck10-GFP | Human | pEGFP-N1 | From Dr. K. Gaus (Kapoor-Kaushik et al., 2016) |
| Lck10-mCherry | Human | pEGFP-N1 | From Dr. K. Gaus (Kapoor-Kaushik et al., 2016) |
| Stoml3-GFP | Mouse | pEGFP-N3 | From Dr. K. Poole (Poole et al., 2014) |
| D4H-mCherry | C. perfringens | pmCherry-C1 | From Dr. R. Du (Maekawa and Fairn, 2015; Venugopal et al., 2016) |
K. Gaus, Single Molecule Science and EMBL Australia Node, University of New South Wales, Sydney, Australia. R. Du, School of Biotechology and Biomolecular Sciences, University of New South Wales, Sydney, Australia.
Figure S12.
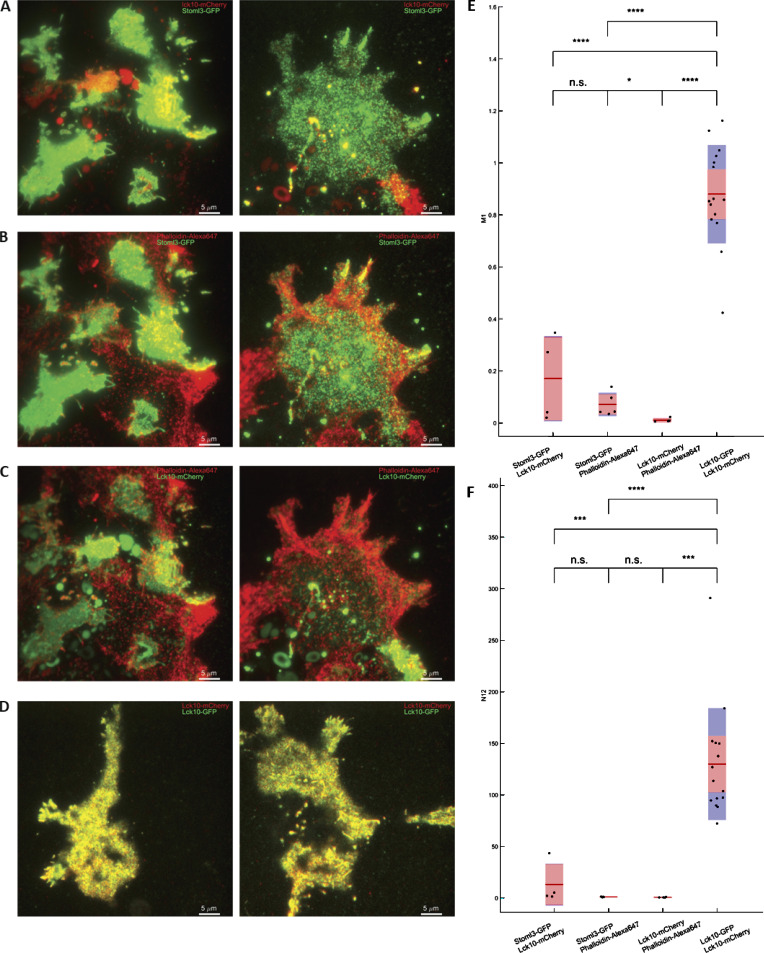
ICCS control experiments. Controls for ICCS analysis using proteins that mostly do not colocalize compared with doubly stained Lck10-GFP/Lck10-mCherry HEK293T cells. (A) Two membrane markers, Lck10-mCherry and Stoml3-GFP, only marginally colocalize (first column in E and F), likely from their overexpressed presence in plasma membrane. (B and C) Actin stained with phalloidin–Alexa Fluor 647 does not colocalize with Stoml3-GFP (B; second column in E and F), nor does it colocalize with Lck10-mCherry (C; third column in E and F), as expected for actin localization versus membrane markers. (D) HEK293T cells doubly labeled with lck10-mCherry and lck10-GFP showed strong colocalization (last column in E and F) as expected. Red lines in E and F represent median; red and blue zones are SEM and SD. Statistical assessment was performed using one-way ANOVA with multiple comparisons; *, P < 0.05; **, P < 0.005; ***, P < 0.0005; n.s., not significant.
Figure S2.
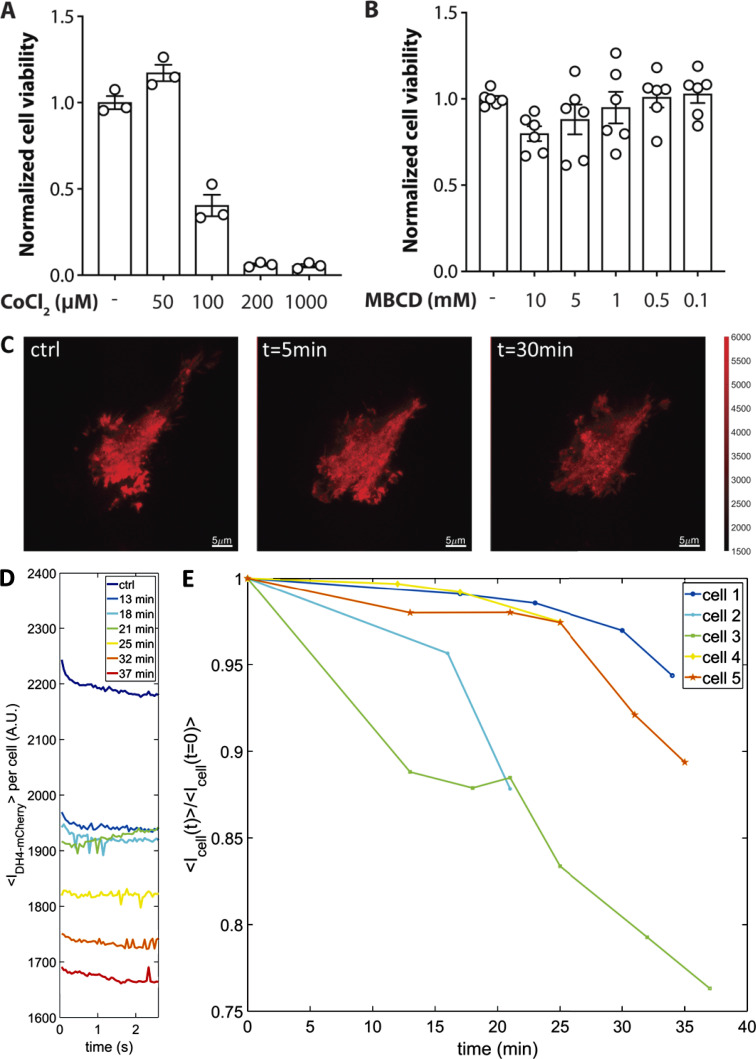
Effect of MBCD on cell viability and cholesterol levels. (A) Normalized cell viability of PIEZO1-GFP HEK293T cells in the presence and absence of the hypoxia-mimetic CoCl2 as a positive control to see a reduction in viability on cell death. Error bars represent mean ± SEM. (B) Effect of 30-min MBCD pretreatment on cell viability. Error bars represent mean ± SEM. (C) HEK293T cells were transfected with D4H-mCherry, a marker of cholesterol in the plasma membrane, and live-imaged in TIRF mode over 45 min during the 5-mM MBCD treatment (scale bar, 5 µm). (D) D4H-mCherry fluorescence intensity monitored in 2.5-s time blocks. Each colored line represents a consecutive fluorescence recording at different time points for the same cell. (E) Time-course of D4H-mCherry fluorescence, normalized to the average fluorescence intensity at time = 0. Each colored plot represents a separate cell undergoing the 5-mM MBCD treatment.
For STORM experiments, cells were treated with drugs, 5 mM MBCD, 50 µg/ml water-soluble cholesterol/MBCD complex, or 80 µM dynasore diluted in serum-free DMEM, or incubated in serum-free DMEM for control samples, for 30 min at 37°C. After treatment, cells were washed with warm PBS and fixed with 4% PFA for 15 min at room temperature followed by three rinses with PBS. Postfixation cells were permeabilized with Triton X-100 (0.01% vol/vol) at room temperature for 15 min. After permeabilization, cells were blocked with 5% BSA for 1 h at room temperature, followed by incubating the dishes with labeling reagents at room temperature for 1 h. PIEZO1-GFP was labeled with anti-GFP–Alexa Fluor 647 with 1:1,000 PBS dilution from stock (Bioss Antibodies; 1 µg/µl). Samples were stored at 4°C and imaged within 2 d from preparation on a Zeiss Elyra microscope.
STORM imaging of Piezo-GFP-anti-GFP-Alexa Fluor 647 and cluster point data analysis
STORM images were acquired on a TIRF microscope (Elyra; Zeiss) using a 100× α Plan APO oil-immersion objective lens (NA 1.46). Cells prepared and fixed as described above were covered with STORM buffer consisting of 25 mM HEPES, 5% glycerol (vol/vol), 25 µg/ml glucose oxidase, 25 µg/ml horseradish peroxidase, and 20 mM cysteamine (Dempsey et al., 2011). We ensured that out-of-focus drift was eliminated by setting the temperature of the heating enclosure at 26°C and using the definite focus of the Elyra microscope. Alexa Fluor 647 fluorophores were excited using a 638-nm laser, and emission was collected using a longpass filter at 640 nm. Alexa Fluor 647 fluorophores were photoconverted from dark to excitable state, ∼0.1 mW of continuous 405-nm laser radiation, and imaged with ≪1 mW of 488-nm light. Between 10,000 and 20,000 images were acquired per dataset, and single-molecule emissions were fitted using a 2D Gaussian distribution function in the algorithm provided in Zeiss’ Zen software. For image data acquisition, we used a cooled, electron-multiplying charge-coupled device camera (iXon DU-897D; Andor) with an exposure time of 30 ms and an imaging area containing cells of interest. The zoom lens before the camera was set to 1.6× such that the pixel size was 0.1 µm. The data were acquired and preprocessed using Zen software customized for this microscope, while further cluster decomposition and statistics were done using custom-built scripts in Matlab (The Mathworks). Preprocessing in Zen consisted of filtering out the features (molecules) detected with signal-to-noise parameters <6 and size ≤9 pixels (mask) diameter, which equaled 0.9 µm. No visible lateral (xy) or axial (z) drifts were observed in any datasets analyzed. No grouping of observation points was done, as we did not calibrate the blinking of Alexa Fluor 647 under imaging conditions in case they are uniformly randomly dispersed. Nevertheless, we do not claim that the number of PIEZO1-GFP entities observed per cluster are in absolute values. Rather, we quantify the extent (area and perimeter) of clusters and quantify the relative change in observations, number of emitting events, per cluster in each condition. Preprocessed point pattern data were exported to a TXT file and loaded into Matlab for further quantification. Point patterns of observations, per cell, were segmented into clusters using the approach called DBSCAN (Bar-On et al., 2012) using custom-built software in Matlab. Briefly, for each point detected, we calculated the local density within an ∼30-nm radius (average precision of detections in STORM using Elyra). Next, we started with the highest local density point and counted all the molecules within a circle of ∼30 nm. Then, the same operation was repeated for every point within the circle, and so on until all points of a cluster were processed, and all the points that passed the criteria were grouped into the first cluster. All the points from that cluster were removed from the original cluster data and stored. The operation was repeated until the next cluster was isolated. This iterative process was repeated until the last cluster was defined and points included were stored. We searched the objects with at least five detections (points) per cluster, and any object with fewer observations was not considered a cluster. For each cluster, we calculated the cluster area and perimeter using a combination of Matlab functions (boundary, alphaShape, and perimeter) and number of points per area (density). By defining the total cell surface using the thresholded image from the GFP channel, only the clusters within the cell boundaries were considered. This also allowed for counting the number of PIEZO1-GFP clusters per unit cell area. Clusters smaller than the approximate size of a single PIEZO1 trimer (∼200 nm2) were not considered for the statistics, as they could be the outcome of single-molecule blinking, which we did not account for.
Clusters were excluded from the analysis based on the estimated number of molecules detected in each cluster. If the number of detected molecules in a given cluster was larger than the number of 200 nm2 molecules (a conservative estimate of the area projected by a single PIEZO1 trimer) that could fit in that cluster area, then the cluster was rejected. This was formulated as Eq. 1,
| (1) |
where Ac is the measured cluster area, 200 is a conservative estimate of the area in square nanometers projected by a single Piezo trimer, and Dc is the density of molecular detections/nm2 detected in the same cluster, resulting in the following area thresholding values control (Ac > 269 nm2). This cutoff value was applied to all experimental conditions.
Live-cell TIRF imaging and k-space image correlation spectroscopy (kICS) confinement analysis
PIEZO1-GFP diffusion inside the plasma membrane of stably transfected HEK293T cells was imaged with a TIRF Elyra (Zeiss) microscope using a 100×/1.46 lens at an imaging rate of 29 Hz. The microscope stage was equipped with an enclosed heating module (37°C). To quantify the diffusion of PIEZO1-GFP entities and its confinement by cholesterol domains, we applied kICS confinement analysis as previously reported (Abu-Arish et al., 2015). By assuming the isotropic diffusion of fluorescent particles, we circularly averaged the correlation function at each temporal k2 and temporal lags τ, as shown in examples of Fig. S11, A–C. Subsequently, we fitted the resulting correlation function to extract the diffusion of PIEZO1-GFP outside of cholesterol clusters and the lateral unbinding rate of PIEZO1-GFP from cholesterol rich domains, as described in Eq. 2 of Brandão et al. (2014). The kICS correlation functions from late temporal lags and for large spatial frequencies was fitted using Eq. 9 of Brandão et al. (2014).
Figure S11.
Examples of kICS correlation functions. (A–C) kICS correlation functions (CF) for control (A), MBCD (B), and MBCD-cholesterol (C) conditions, showing effectively two dynamic populations more present in control and MBCD-cholesterol conditions, while MBCD seemed to remove large k2 or in domain diffusive component.
The same TIRF modality was used to image cholesterol labeling D4H-mCherry expressed in HEK293T cells, before and after MBCD (see Fig. S2). To monitor the cholesterol removal from the same cell, we first imaged several fields of view of cells before MBCD addition. Cells were imaged for 2.5 s (33 ms/frame) before (control), and then every 5–10 min a series of images (2.5 s) were recorded after addition of 5 mM MBCD. The average intensity per cell per time frame was extracted using a custom-built program in Matlab (see Fig. S2).
Finally, TIRF imaging was used to image fixed transiently transfected PIEZO1-KO cells expressing PIEZO1-GFP from plasmid or Piezo1-GFP stable cell line (see Fig. S6). TIRF imaging ensured that PIEZO1-GFP signal was predominantly from plasma membrane.
Live PIEZO1-GFP and CtxB–Alexa Fluor 555 imaging and colocalization by spatiotemporal ICCS (STICCS)
Live PIEZO1-GFP stable cells were labeled with CtxB–Alexa Fluor 555 and imaged on a Zeiss Elyra microscope in TIRF mode, as described above. For two-color imaging on a single electron-multiplying charge-coupled device camera, we used a dual-band dichroic filter cube for 488/561-nm excitation, in which an acousto-optic tunable filter laser controlling module was used to separately excite GFP (Piezo1) or Alexa Fluor 555 (CtxB) at any given frame. The resulting frame time was increased to ∼240 ms and exposure time was set at 33 ms. We quantified the degree of colocalization between PIEZO1-GFP and the cholesterol domain marker, CtxB–Alexa Fluor 555, and their diffusion rate, by STICCS (Toplak et al., 2012; Hedde et al., 2014). For each image series, in two channels, a rectangular area surrounding an individual cell was defined. The immobile population (DC component of Discrete Fourier transform) from each cell was filtered by Fourier filtering, from each channel. STICCS correlation function was calculated for each channel and for cross-correlation, as described in Toplak et al. (2012) and Hedde et al. (2014). The amplitudes of auto- and cross-correlation functions were used to calculate the density of colocalized entities using the following equation:
where γ1, γ2, and γ12 are geometric factors of the point spread function in each channel, and S1, S2, and S12 are slopes of linear fit between the amplitudes and the inverse squared widths of correlation function, as measured in each temporal lag, τ (Hedde et al., 2014). To characterize noisier STICCS correlation functions from short temporal sequence datasets and obtain squared widths, of correlation functions, we used 2D moment analysis as in Eq. 10 of Pandžić et al. (2018). For amplitudes, we assumed that the integral under the curve of a 2D Gaussian is equal to and calculated the numerical integral at each temporal lag. The point spread function γ factors can be calculated using
for each channel i separately and
for cross-correlation. To measure γ factors, we imaged a z-stack of 0.1-µm tetraspeck (Invitrogen) nanoparticles and calculated the above integrals numerically. The resulting ratios between gammas were
and
for the imaging configuration described above. The number of PIEZO1 entities at each condition was obtained by applying the analysis described above to the image data for the PIEZO1 imaging channel (488 nm) and using the equation
To characterize the diffusion of colocalized entities of PIEZO1 and CtxB, we used linearly fitted squared widths, σ2, of STICCS correlation functions versus temporal lag, τ, where the resulting slopes are equal to 4Dτ (Video 1; Toplak et al., 2012; Hedde et al., 2014).
Video 1.
Examples of STICCS correlation function fluctuations over time. Each row shows the PIEZO1-GFP autocorrelation function (left), the CtxB–Alexa Fluor 555 autocorrelation function (center), and the cross-correlation function (right) evolution for each tested condition, over the course of a typical experiment (time expressed in frame time blocks τ, top right). Ctrl, untreated control; chol, water-soluble cholesterol/MBCD complex; dyno, dynasore.
To further investigate the effect of MBCD on PIEZO1 colocalization with CtxB, we performed experiments in which the same cells were imaged before and after treatment. We imaged cells before treatment as described above while recording their positions and added drugs to the dish, ensuring that the dish could not move to preserve the saved cells’ coordinates. Live-cell imaging acquisition began 20 min after the treatment was applied.
Imaging membrane order with Laurdan and ICCS analysis
Cells plated on dishes were labeled with a 1:200 dilution of 5 mM Laurdan (D250; Molecular Probes), incubated at 37°C for 30 min, washed with warm PBS, fixed and permeabilized, and then the PIEZO1-GFP was labeled with anti-GFP–Alexa Fluor 647. Laurdan data were acquired on a Zeiss LSM 880 microscope with excitation from a mode-locked two-photon Insight DeepSea operating at 80-MHz repetition rate and a wavelength of 780 nm. Excitation and photon collection were performed with a Plan-Apochromat 63× 1.4 oil objective (Zeiss). Laurdan data were acquired in two channels with wavelengths of 400–460 and 470–530 nm.
ICCS was applied to quantify the level of colocalization between PIEZO1 and ordered/disordered phases of Laurdan (Comeau et al., 2008). Each image pair was preprocessed to minimize the artifacts due to channel misalignment, noise, and cell edges (Comeau et al., 2008). First, a correction matrix for shift of far red (Alexa Fluor 647) images, to align with Laurdan images, was calculated using Matlab function imregtform. The corrected images were then noise filtered using a 2D Gaussian filter with 1-pixel σ. Then the minimum intensity from images in each channel was subtracted, and a final image was normalized to its maximum. Finally, the resulting images were used to define a mask, from thresholding above the average intensity, and all the pixels not belonging to the mask (equal to 0) were set to have the value of average intensity of pixels within the mask (equal to 1). This process ensures that pixels not belonging to cell areas are not contributing to the fluctuations and inherent correlation functions in ICCS (Comeau et al., 2008). We extracted the number density of particles in red (PIEZO1), green (either ordered or disordered Laurdan phase), and cross-correlation channels.
Cell viability assay
An MTS assay (Ab197010, Abcam) was used to interrogate the effect of MBCD pretreatment of cells in the presence of serum-free medium according to the manufacturer’s protocol. Briefly, cells were seeded at a density of 30 × 104 cells per well in a 96-well plate and pretreated with MBCD or CoCl2, as a positive control to induce cell death, for 30 min and then incubated in the presence of MTS. The subsequent colorimetric change was measured using a VersaMaxTunable microplate reader (Molecular Devices) and normalized to untreated cells.
Online supplemental material
Fig. S1 shows the dose-dependent effects of MBCD on PIEZO1-GFP in stable cell line. Fig. S2 shows the effect of MBCD on cell viability and cholesterol levels. Fig. S3 shows the cholesterol labeling experiment using Filipin III staining. Fig. S4 shows the quantitation of the first event latency of PIEZO1-GFP response. Fig. S5 shows the effect of cholesterol depletion via MBCD on N2A cells. Fig. S6 shows the effect of cholesterol depletion via MBCD on transiently transfected WT human PIEZO1. Fig. S7 shows the effect of DHA treatment on PIEZO1-GFP. Fig. S8 shows the effect of cytoskeleton manipulation on the membrane diffusion of PIEZO1-GFP. Fig. S9 shows additional parameters calculated from ICCS for assessment of PIEZO1-GFP/CtxB-Alexa Fluor 555 colocalization in the plasma membrane. Fig. S10 shows time-lapse imaging of single cells exposed to treatments. Fig. S11 shows examples of kICS correlation functions. Fig. S12 shows ICCS control experiments. Video 1 shows examples of STICCS correlation function fluctuations over time. Videos 2, 3, and 4 show live TIRF imaging of hP1-1591–GFP stable cell line in control condition, after MBCD treatment, and after water-soluble cholesterol/MBCD complex treatment, respectively.
Results
Electrophysiological effects of membrane cholesterol manipulation
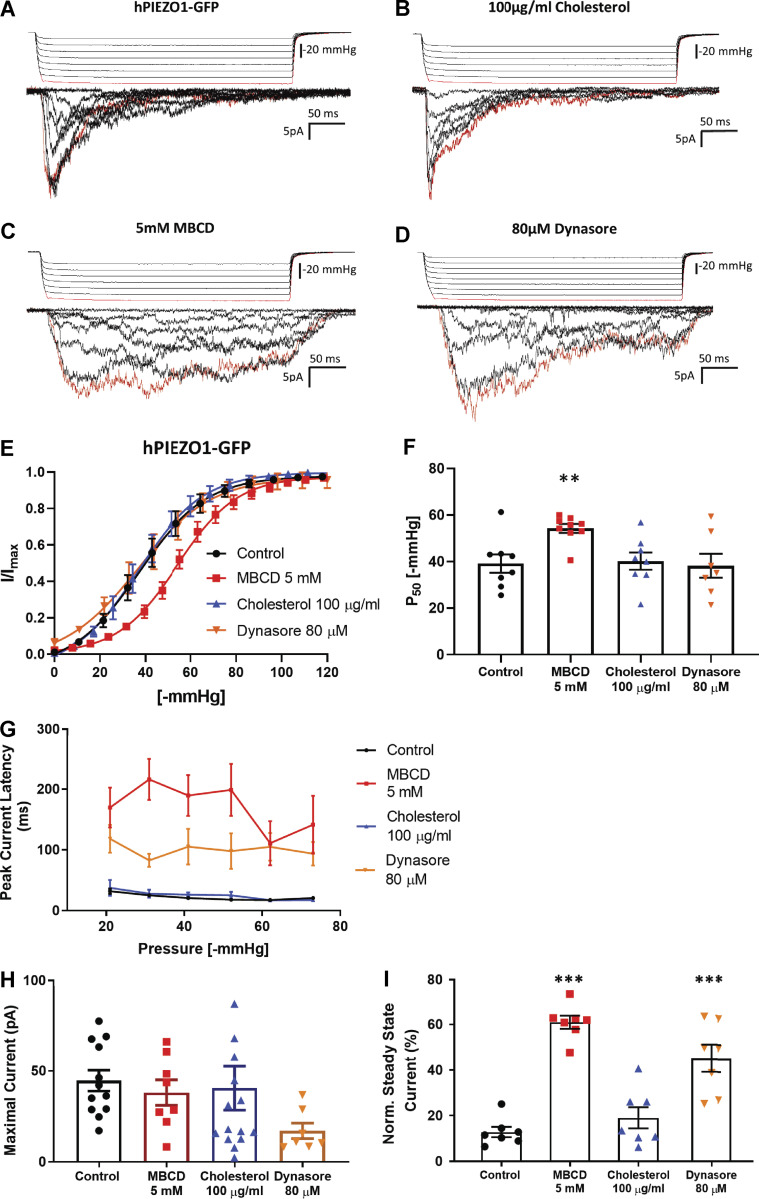
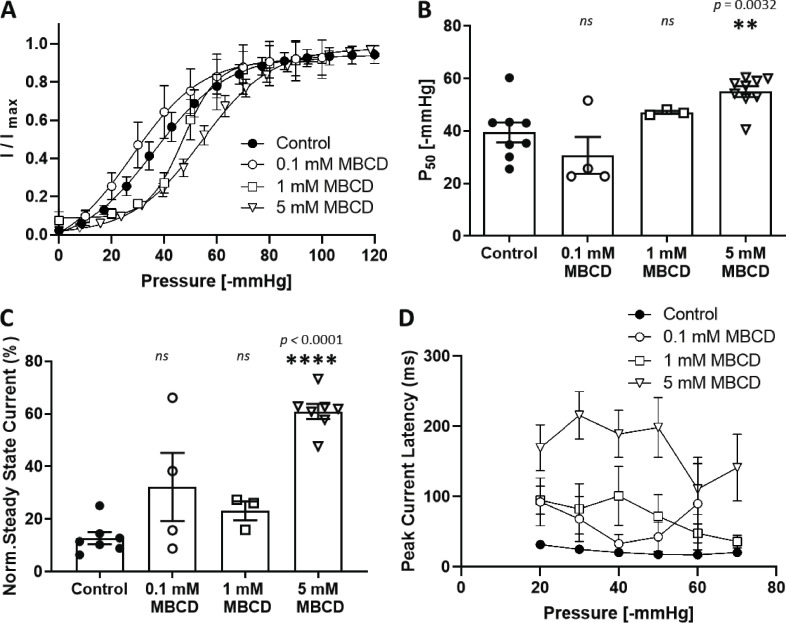
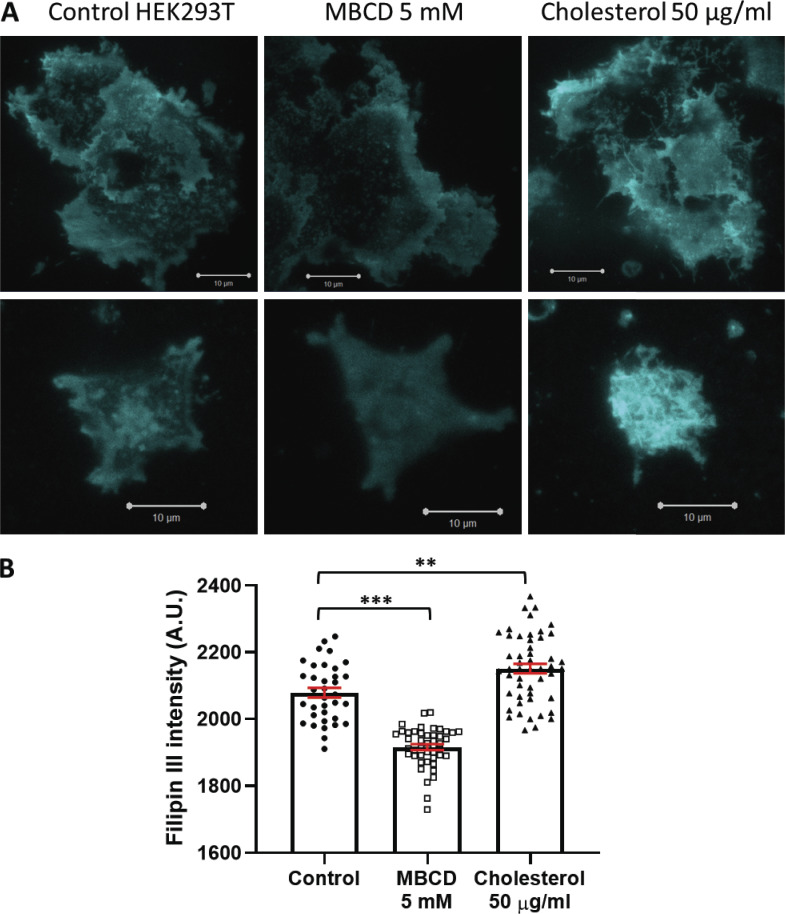
We measured the effects of cholesterol depletion, supplementation, and dynasore (a compound known to disrupt cholesterol-rich domains) on PIEZO1-GFP channels stably expressed in HEK293T cells. These cells express exceedingly low levels of STOML3 (Sultan et al., 2008; Uhlén et al., 2015). We observed a significant modulation of channel sensitivity and kinetics when cholesterol was removed by MBCD or dynasore was added compared with control cells (Fig. 1, A–D). High doses (100 µg/ml) of water-soluble MBCD/cholesterol complex (Fig. 1 B) did not affect PIEZO1-GFP gating. However, PIEZO1-GFP pressure sensitivity was significantly decreased after treatment with 5 mM MBCD (Fig. 1, E and F), but not at lower dosages (Fig. S1), without significant impact on cell viability (Fig. S2, A and B). The treatment of HEK293T cells with 5 mM MBCD was verified to effectively decrease the level of cholesterol by measuring the fluorescence intensity of a genetically encoded DH4a-mCherry cholesterol probe (Johnson et al., 2012; Maekawa and Fairn, 2015; Fig. S2, C and D). The efficacy of the MBCD and water-soluble cholesterol treatment was also verified by staining cells with the cholesterol probe Filipin III (Fig. S3).
Figure 1.
Modulation of PIEZO1-GFP activity in cell-attached patches of HEK293T cells in response to manipulation of cholesterol domains in the plasma membrane. (A–D) Example recordings from cell attached patches in response to the application of negative-pressure pulses of HEK293T cells stably expressing PIEZO1-GFP at +65 mV pipette voltage. Currents shown are from control cells incubated in serum-free medium for 30 min (A), cells treated with 100 µg/ml water-soluble cholesterol/MBCD complex (B), cells incubated in serum-free medium supplemented with 5 mM MBCD (C), or supplemented with 80 µM dynasore (D). The first pressure pulse and its associated current are highlighted in red. (E) Pressure–response curves comparing the effects of each compound on PIEZO1-GFP pressure sensitivity. Peak current values (I) are normalized to the maximal current (Imax) within the same recording and fitted with a Boltzmann distribution curve. (F) Midpoint activation pressures (P50) producing 50% of the maximal current response from each Boltzmann curve analyzed in E (one-way ANOVA; **, P < 0.005; n.s., not significant; n = 7–10). (G) Latency time in milliseconds of the PIEZO1-GFP response measured between the start of negative-pressure pulse and the onset of the maximal current within the same recording (n = 3, where each is the average of at least three consecutive pressure protocols). Average latencies are displayed for pulse pressures between −20 and −70 mmHg. (H) Average maximal current from cell-attached patches generated from each cell in all conditions. (I) Quantification of the mean steady-state current produced by each cell. The average current measured over the last 100 ms of the pressure stimulus was normalized to the maximal current within the same cell (n = 7 cells per condition). The steady-state current for each cell is the average mean steady-state current from a minimum of three pressure pulses between −40 and −60 mmHg. All data represent mean ± SEM; statistical analysis was performed using one-way ANOVA (**, P < 0.005; ***, P < 0.0005).
Figure S1.
Dose-dependent effects of MBCD on PIEZO1-GFP in stable cell line. (A) Pressure–response curves comparing the effects of different concentrations of MBCD on PIEZO1-GFP pressure sensitivity. Peak current values (I) are normalized to the maximal current (Imax) within the same recording and fitted with a Boltzmann distribution curve. (B) Midpoint activation pressures (P50) producing 50% of the maximal current response from each Boltzmann curve analyzed in A (one-way ANOVA; **, P < 0.005; n.s., not significant; n = 3–9 cells). (C) Quantification of the mean steady-state current produced by each cell. The average current measured over the last 100 ms of the pressure stimulus was normalized to the maximal current within the same cell and expressed as a percentage. n = 3–7 cells per condition. The steady-state current for each cell is the average mean steady-state current from a minimum of three pressure pulses between −40 and −60 mmHg. (D) Latency time in milliseconds of the PIEZO1-GFP response measured between the start of negative-pressure pulse and the onset of the maximal current within the same recording (n = 3 cells, where each is the average of at least three consecutive pressure protocols). Average latencies are displayed for pulse pressures between −20 and −70 mmHg. All data represent mean ± SEM; statistical analysis between control and treatments was performed using one-way ANOVA; **, P < 0.005; ****, P < 0.0001.
Figure S3.
Filipin III staining. (A) TIRF microscopy images of HEK293T cells untreated, cholesterol depleted (5 mM MBCD), or cholesterol enriched (50 µg/ml water-soluble cholesterol). Fields of view including multiple cells are shown on the top row, and images including single, isolated cells on the bottom row. All the images are displayed using the same spectral minimum/maximum values (minimum = 1,600 A.U.; maximum = 3,060 A.U.). Scale bars, 10 μM. (B) Mean fluorescence intensity quantification of Filipin III fluorescence. Intensity calculations were performed using Fiji. A threshold was applied to all images to remove the pixels of intensity <1,600 A.U. before calculating the mean Filipin III intensity (one image represents n = 1). Control (n = 35), MBCD (n = 45), cholesterol (n = 50). Error bars represent mean ± SEM. Statistical comparison performed using one-way ANOVA; **, P < 0.05; ***, P < 0.001.
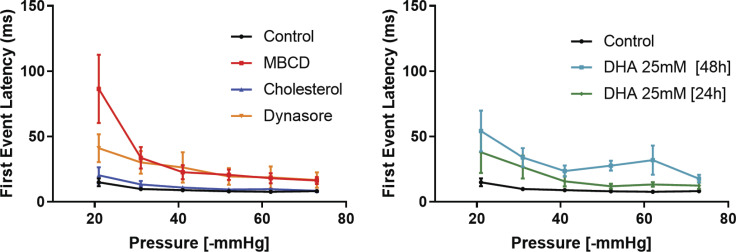
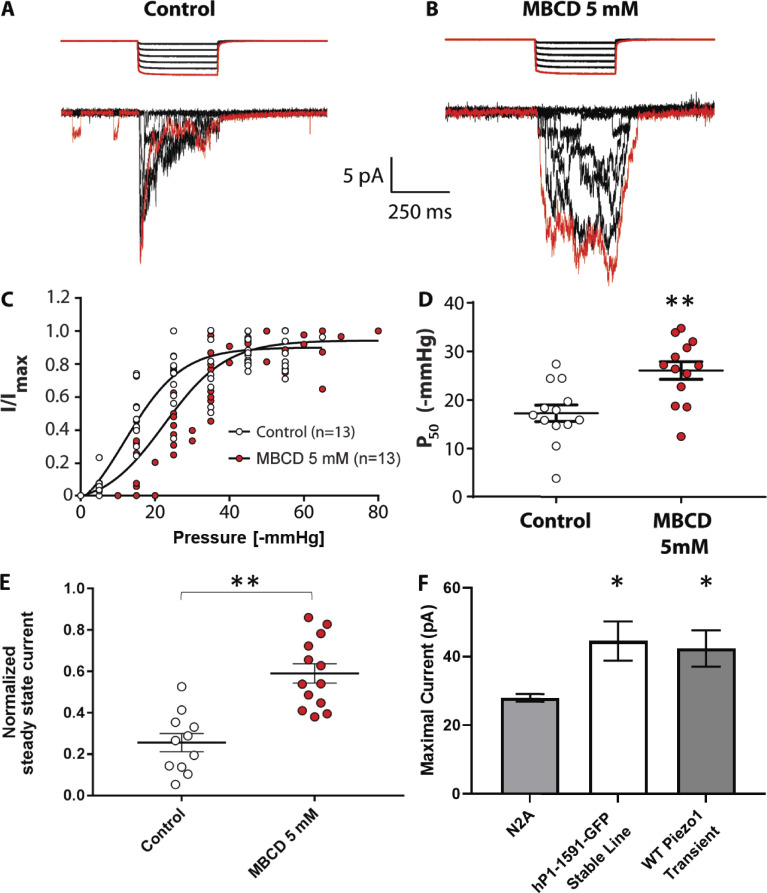
Desensitization to applied pressure was accompanied by a substantial increase in latency of the response, at both the level of the first opening (Fig. S4) and onset of the maximal current (Fig. 1 G). None of the compounds altered the average maximal PIEZO1-GFP current (Fig. 1 H). Both MBCD and dynasore caused similar delays in PIEZO1-GFP activation, but only MBCD caused a rightward shift in the midpoint activation pressure of the channel by ∼40%. Interestingly, both MBCD and dynasore treatment substantially reduced channel inactivation, as quantified using normalized steady-state current (Fig. 1 I). Similar effects of MBCD were observed on endogenous mouse PIEZO1 channels in N2A cells (Fig. S5).
Figure S4.
First event latency of PIEZO1-GFP response. The latency time (milliseconds) was calculated as the time gap from the onset of a computer-controlled high-speed pressure clamp negative-pressure pulse and the first visible single PIEZO1-GFP response. The PIEZO1-GFP latency was measured during 350-ms-long square suction pulses, ranging from −20 to −70 mmHg. Error bars represent SEM.
Figure S5.
Cholesterol depletion via MBCD in N2A cells. N2A cells were cultured in 10% FBS-supplemented DMEM and treated with 5 mM MBCD in serum-free medium for 30 min at 37°C before experiments. Electrophysiological recordings were collected as described in Materials and methods. (A) Computer-controlled high-speed pressure clamp square pressure pulses were applied to untreated N2A cells in cell-attached mode at +65 mV pipette potential. Mechanically evoked currents from native PIEZO1 proteins are shown below the pressure trace. The first pressure pulse and its respective PIEZO1 current trace are highlighted in red. (B) MBCD-treated N2A cells display a loss-of-inactivation phenotype compared with control. (C) Combined normalized I/Imax values from all control and MBCD-treated cells in the experiment were fitted with a single Boltzmann curve per condition (see Materials and methods). (D) Average P50 values obtained from Boltzmann fits for each individual cell analyzed under control and MBCD conditions. (E) Comparison of normalized steady-state mechanosensitive currents from N2A cells in control and MBCD-treated conditions. Control (n = 13), MBCD (n = 13); **, P < 0.01, Student’s t test. (F) Comparison of the mean current density recorded from cell-attached patches of N2A cells, hP1-1591–GFP stable cells, and transiently expressed WT Piezo1 (N2A n = 13 cells; hP1-1591–GFP n = 12 cells; Transient WT Piezo1 = 12 cells; *, P < 0.05; one-way ANOVA). Error bars represent SEM.
Cholesterol removal exacerbates the slow-inactivating phenotype of PIEZO1 R2456H
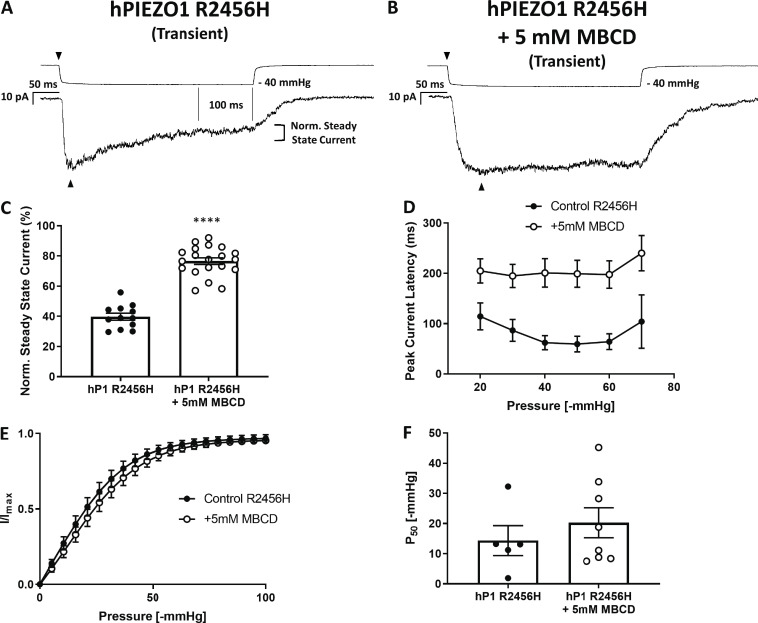
The inactivation of PIEZO1 is currently described as an intrinsic process in the channel gating cycle, which can be altered by introducing mutations at specific sites in the protein (Poole et al., 2014; Wu et al., 2017b; Moroni et al., 2018; Zheng et al., 2019; Lewis and Grandl, 2020). The R2456H mutant, a xerocytosis-causing variant of human PIEZO1, displays a significant loss of inactivation with respect to WT PIEZO1 (Fig. 2 A), as previously reported (Bae et al., 2013a). We tested whether the effects of MBCD treatment on the channel inactivation were specific to the WT channel or could affect the R2456H channel as well (Fig. 2, A and B). The degree of inactivation was quantified using normalized steady-state current (Fig. 2, A–C). Interestingly, the MBCD treatment appeared to slow the inactivation of R2456H PIEZO1 (Fig. 2, B and C), increasing the steady-state current while also increasing the latency of the response (Fig. 2 D and Fig. S4), when the mutant was transfected into PIEZO1 KO HEK293T cells. MBCD did not change the sensitivity of R2456H to applied pressure (Fig. 2, E and F).
Figure 2.
The slow-inactivation phenotype of the human PIEZO1 mutant R2456H is exacerbated by the removal of plasma membrane cholesterol via MBCD. The R2456H mutation was introduced in the human PIEZO1-1591-GFP clone, henceforth referred to as hPIEZO1 R2456H. (A) Example trace of a cell-attached recording from transiently overexpressed human hPIEZO1 R2456H mutant. (B) Example trace of a cell-attached recording from transiently overexpressed human hP1 R2456H treated with 5 mM MBCD for 30 min in serum-free medium. (C) Histogram quantifying the impact of 5-mM MBCD treatment on the normalized steady-state current. hPIEZO1 R2456H (n = 12); hPIEZO1 R2456H + 5 mM MBCD (n = 20). (D) This effect was accompanied by a longer latency to activation of the peak current at all pressures after treatment with MBCD. Control (n = 6), MBCD (n = 8). (E) Pressure–response curve of hPIEZO1 R2456H and MBCD-treated hPIEZO1 R2456H showing Boltzmann curve fits. hPIEZO1 R2456H (n = 5), hPIEZO1 R2456H + MBCD (n = 8). (F) Quantification of P50 values obtained from Boltzmann fits analyzed in E. Statistical analysis was performed using one-way ANOVA (****, P < 0.0001; n = 1 represents the average of minimum three recordings from the same cell). Error bars in all graphs represent SEM.
Interestingly, cholesterol removal via MBCD did not significantly change the midpoint of activation of the transiently transfected WT PIEZO1 to applied pressure either (Fig. S6, A and B). We hypothesized that the shift in pressure sensitivity observed in our stable cell line after MBCD treatment was dependent on the mode of channel expression (i.e., stable versus transient). Indeed, when observed in TIRF mode, transiently expressed hP1-1591-GFP was detected in higher amounts in the basal plasma membrane compared with cells stably expressing the same PIEZO1 clone (Fig. S5, D–F).
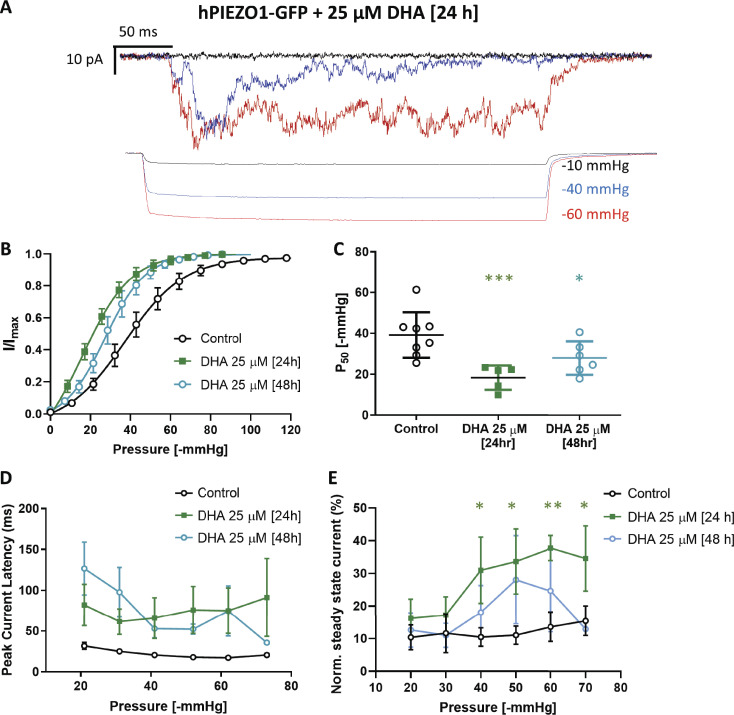
The transiently expressed R2456H mutant displayed a higher sensitivity to pressure (Fig. 2 F) compared with transiently expressed WT PIEZO1 (Fig. S6 B) and stably expressed PIEZO1-GFP (Fig. 1 F). Nontransfected PIEZO1 KO HEK293T cells did not produce mechanosensitive currents when challenged with suction pulses (Fig. 2 G). The P50 values and slopes of Boltzmann fits are summarized in Table 2. Only the stable cell line and the PIEZO1 native to N2A cells (Fig. S5) appeared to right-shift their sensitivity after MBCD treatment. All the PIEZO1 variants studied (PIEZO1-GFP, transiently transfected WT, transiently transfected R2456H mutant, and N2A native) displayed slower inactivation after cholesterol removal. These results suggest that membrane cholesterol, like other lipids (Romero et al., 2019), contributes to PIEZO1 inactivation. The sensitivity of PIEZO1-GFP to its lipid environment was also observed when cells where cultured in presence of DHA (Fig. S7), which caused an increase in pressure sensitivity, latency of the response, and loss of inactivation.
Table 2. Summary of average P50 values and slopes derived from Boltzmann fits of I/Imax versus pressure plots of all PIEZO1 variants and treatments performed in this study.
| P50 (−mmHg) | Slope of Boltzmann α−1 (mmHg−1) | ∆G (kBT) | |
|---|---|---|---|
| hPIEZO1-GFP | 36.4 ± 3 | 14 ± 2.5 | 3.5 ± 0.4 |
| + 0.1 mM MBCD | 30.7 ± 7 | 13.3 ± 1.3 | 3.2 ± 0.5 |
| + 1 mM MBCD | 47.1 ± 0.6 | 8.3 ± 3.7 | 5.7 ± 1.3 |
| + 5 mM MBCD | 54.2 ± 1.1 | 13.3 ± 1 | 5.3 ± 1.2 |
| + 100 µg/ml cholesterol | 36.8 ± 2.5 | 14.4 ± 2 | 3.5 ± 0.2 |
| + 80 µM dynasore | 36.7 ± 4.8 | 16.3 ± 3.9 | 3.7 ± 1 |
| + 25 µM DHA (24 h) | 16 ± 2.8 | 12.3 ± 1.4 | 1.6 ± 0.4 |
| + 25 µM DHA (48 h) | 27 ± 1.8 | 10.3 ± 1.4 | 3.6 ± 0.8 |
| hPIEZO1 WT | 39.6 ± 2.1 | 11.6 ± 2 | 4.4 ± 0.5 |
| + 5 mM MBCD | 42.2 ± 2.6 | 14.3 ± 2.1 | 3.7 ± 0.6 |
| hPIEZO1 R2456H | 13.3 ± 7 | 15.1 ± 3 | 1.3 ± 0.6 |
| + 5 mM MBCD | 16.4 ± 5.6 | 14.1 ± 2.8 | 1.9 ± 0.5 |
| N2A mPIEZO1 | 17.8 ± 2.2 | 6.6 ± 1.6 | 4.7 ± 0.3 |
| + 5 mM MBCD | 22.5 ± 1.8 | 8.4 ± 1.7 | 4 ± 0.7 |
Gating free energy calculations were estimated following Eq. 7 (∆G/kBT ≈ P50 ∙ α) in Hamill and Martinac (2001). Statistical difference between ∆G detected for PIEZO1-GFP versus 25 µM DHA (24 h), P = 0.0153, Student’s t test. All values are reported as mean ± SEM.
Figure S7.
Effect of DHA treatment on PIEZO1-GFP. The fatty acid DHA is an important dietary polyunsaturated fatty acid that is thought to enhance separation of lipid phases in vitro and confer fluidity to disordered lipid phases (Levental et al., 2016). The fatty acid becomes incorporated into membrane phospholipids when supplied long term in the cell culture medium (Shaikh et al., 2009). (A) Patch-clamp recording of PIEZO1-GFP in cell-attached mode, 24-h treatment with 25 µM DHA recorded at +65 mV pipette voltage. Each current plot and its respective pressure trace are color-coded. (B) Boltzmann fit of normalized current versus pressure plot of PIEZO1-GFP after 24- and 48-h treatment with 25 µM DHA. Control (n = 8 cells), DHA 24 h (n = 5 cells), DHA 48 h (n = 6 cells). (C) Quantification of P50 values derived from individual Bolzmann functions analyzed in B. (D) Average peak current latency time recorded in the −20 to −70 mmHg pressure regimes for control and DHA-treated cells. Control (n = 8 cells), DHA 24 h (n = 5 cells), DHA 48 h (n = 6 cells). (E) Quantification of PIEZO1-GFP current inactivation represented as normalized (Norm.) steady-state current at all pressures between −20 and −70 mmHg applied pressure in control, 24- and 48-h DHA-treated cells. Control PIEZO1-GFP (n = 8 cells), DHA 24 h (n = 5 cells), DHA 48 h (n = 3 cells). Statistical analysis was performed using one-way ANOVA; *, P < 0.05; **, P < 0.005; ***, P < 0.0005; error bars represent SEM.
Cholesterol depletion increases PIEZO1-GFP diffusion in live cells
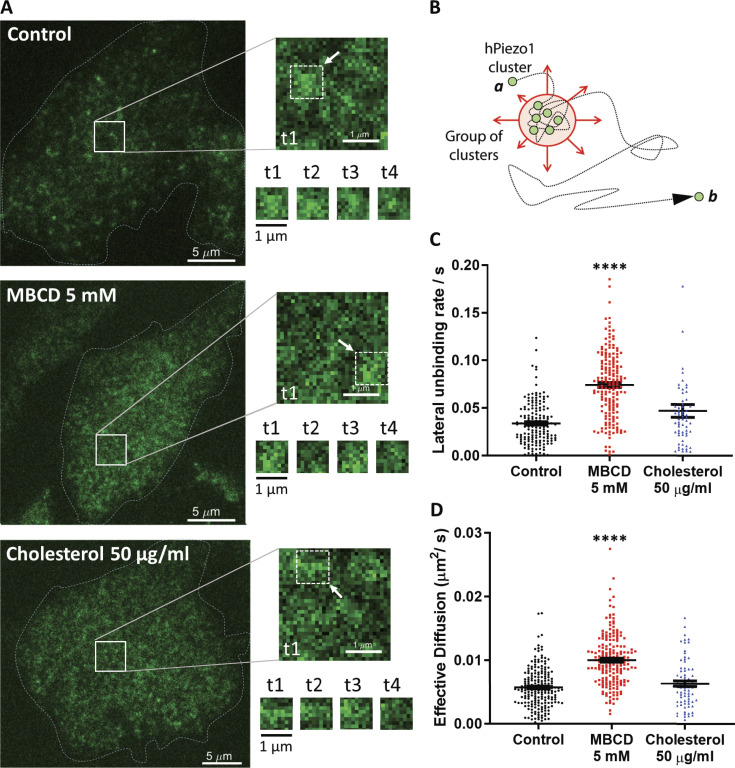
To study the dynamics of PIEZO1-GFP in a live cell, we performed spatiotemporal kICS analysis of pixel fluorescence fluctuations in the basal membrane of our stable cell line (Fig. 3 A, Video 2, Video 3, and Video 4). The PIEZO1-GFP fluorescent signal in TIRF mode was detected as distinct puncta of varying sizes. The smaller fluorescent entities diffusing away from large puncta were defined as clusters, and puncta larger than the point spread function (∼200-nm radius) were defined as groups of clusters (Fig. 3 B). The term “cluster” was used to indicate a diffraction-limited fluorescent entity composed of an unknown amount of PIEZO1-GFP proteins. The same definition of a PIEZO1-GFP cluster is used in all diffraction-limited imaging experiments, except the superresolution imaging section (STORM), in which individual proteins were detected with an average localization precision of ∼30 nm. PIEZO1-GFP appears to experience a limited diffusion, schematically described in the cartoon as the motion from A to B (Fig. 3 B), owing to its clustering and heterogeneity of the plasma membrane. Before the addition of MBCD, the channel’s average diffusion rate was ∼0.005 µm2/s (Fig. 3 D). Cholesterol removal by MBCD doubled the diffusion rate, whereas addition of 50 µg/ml of cholesterol had no effect.
Figure 3.
Cholesterol removal alters PIEZO1-GFP dynamics in situ. (A) Left: TIRF images are the initial frames acquired during live-cell imaging. Right: Representative time course of PIEZO1-GFP diffusion dynamics within the highlighted square area, shown next to each of the conditions tested. The four time points (t1–t4) represent the time course of the fluctuations in fluorescence intensity within the 1-µm2 portion of the image indicated by the white arrow, collected at 150-frame intervals (∼5-s intervals between consecutive time points). Scale bars, 5 μM. (B) Cartoon describing the limited diffusion experienced by PIEZO1-GFP channels in the plasma membrane. (C) Quantification of lateral unbinding rate (s−1) of PIEZO1-GFP entities in control (n = 5 trials, 205 cells), 5 mM MBCD-treated (n = 5 trials, 193 cells), and 50 µg/ml cholesterol-treated cells (n = 5 trials, 77 cells). (D) Effective diffusion (µm2/s) of PIEZO1-GFP clusters and group of clusters (fluorescent entities) in control, 5 mM MBCD-, and 50 µg/ml cholesterol-treated cells. Both lateral unbinding rates and effective diffusion are increased significantly by cholesterol depletion via MBCD. Data represent mean ± SEM analyzed with one-way ANOVA; ****, P < 0.00005).
Video 2.
Live TIRF imaging of hP1-1591–GFP stable cell line in control condition. Untreated hP1-1591–GFP stable cells were imaged in TIRF mode as described in Materials and methods and Fig. 3. 50 frames/s.
Video 3.
Live TIRF imaging of hP1-1591–GFP stable cell line after MBCD treatment. hP1-1591–GFP stable cells were treated with 5 mM MBCD for 30 min, then imaged in TIRF mode as described in Materials and methods and Fig. 3. 50 frames/s.
Video 4.
Live TIRF imaging of hP1-1591–GFP stable cell line after water-soluble cholesterol/MBCD complex treatment. hP1-1591–GFP stable cells were treated with 50 µg/ml water-soluble cholesterol/MBCD complex and imaged in TIRF mode as described in Materials and methods and Fig. 3. 50 frames/s.
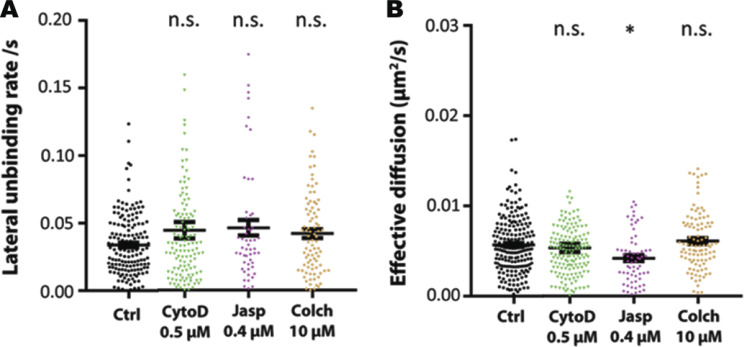
kICS analysis measures the lateral unbinding rate from the PIEZO1-GFP clusters, k_unbind. This measurement is defined as the rate at which fluorescent entities (particles or clusters) move away from locally confined areas or docking areas. This parameter can also be interpreted as rate at which a measured protein escapes a local confining environment. MBCD-treated cells caused PIEZO1-GFP molecules to dissociate at a higher rate from associated local confinement, whereas cholesterol addition did not affect this affinity (Fig. 3 C). This result implies that MBCD treatments break the underlying local cholesterol scaffold by removing the cholesterol and changing the affinity of PIEZO1-GFP to its local environment, whereas cholesterol addition does not change the confinement barrier, but only the number of barriers. Perturbing the actin (cytochalasin D, jasplakinolide) or the microtubule cytoskeleton (colchicine) did not affect the local lateral unbinding of the PIEZO1-GFP from clusters (Fig. S8 A). Interestingly, among these compounds, only jasplakinolide appeared to reduce the effective diffusion in the basal membrane, consistent with its effect on the organization of the cortical actin meshwork (Fig. S8 B).
Figure S8.
Effect of cytoskeleton manipulation on the membrane diffusion of PIEZO1-GFP. (A) Quantification of lateral unbinding rate (s−1) of PIEZO1-GFP entities in control and after treatments. (B) Effective diffusion (µm2/s) of PIEZO1-GFP entities in control and after treatments. Disruption of the cellular cytoskeleton has no effect on the dispersion rate and the lateral unbinding rate of PIEZO1-GFP clusters, while reinforcement reduces its micrometer-scale diffusion rates. CytoD, cytochalasin D (n = 5 trials, 170 cells); Jasp, jasplakinolide (n = 5 trials, 79 cells); Colch, colchicine (n = 5 trials, 104 cells). One-way ANOVA, *, P < 0.05; n.s., not significant; error bars represent SEM.
Nanoscale organization of PIEZO1-GFP in clusters
To confirm our observations on PIEZO1-GFP clustering dynamics, we performed STORM in TIRF mode. By applying STORM, we were able to detect the boundaries of each fluorescent entity with nanometric precision and therefore describe the biophysical characteristics of large and small PIEZO1-GFP clusters.
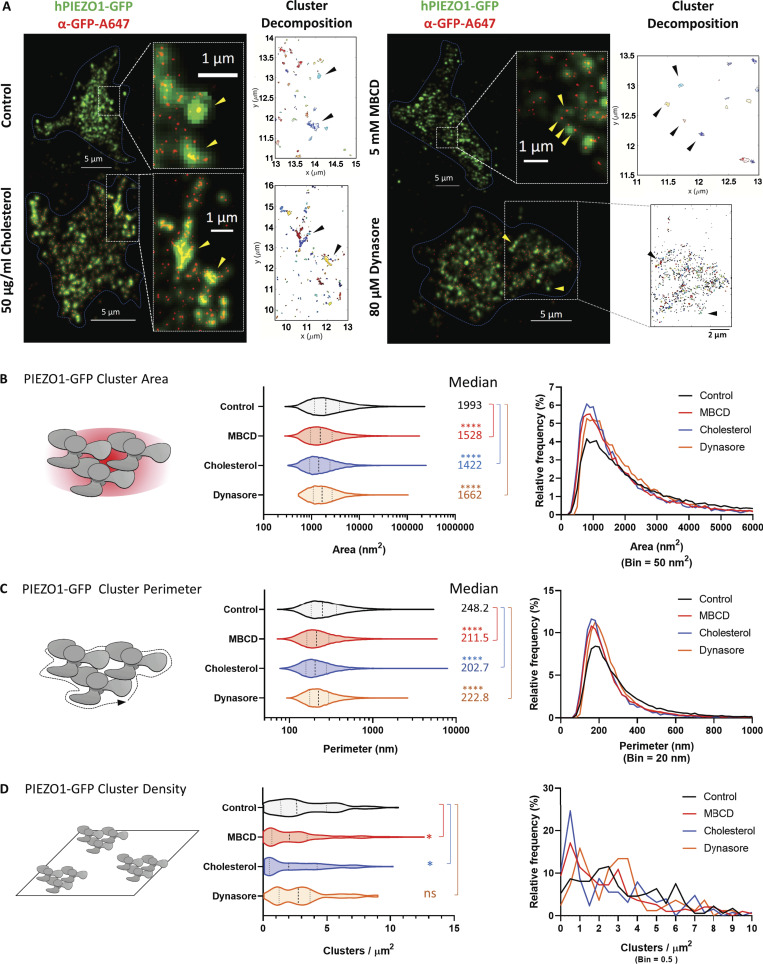
Our stable cell line carrying a PIEZO1-GFP fused construct permitted us to visualize stochastic blinking events originating from an Alexa Fluor 647–labeled anti-GFP antibody. This allowed us to avoid issues with the specificity of commercially available primary PIEZO1 antibodies. Fig. 4 A shows the PIEZO1-GFP stable cell line and the resolution improvement due to STORM analysis. The insets in the figure focus on subcellular areas in which the GFP signal (in green) was superimposed with the STORM signal (in red) inferred from the optical reconstruction of Alexa Fluor 647 blinking events. Software cluster decomposition and classification allowed us to characterize PIEZO1-GFP clusters by defining their area (Fig. 4 B), perimeter (Fig. 4 C), and cluster density/µm2 (Fig. 4 D).
Figure 4.
Modulation of PIEZO1-GFP clusters determined by STORM superresolution microscopy. (A) TIRF microscopy of PIEZO1-GFP cells immunolabeled with an anti-GFP antibody conjugated to Alexa Fluor 647. Images of control cells and treated cells (cell boundary highlighted by a dashed line) show the PIEZO1-GFP signal (green) superimposed on the STORM signal (yellow arrowheads) from Alexa Fluor 647 (red; insets). Scale bar represents 5 µm or 1 μm in inset. The physical properties of the clusters shown in the insets were analyzed by cluster decomposition and are shown in the adjacent cluster maps (black arrowheads). (B) Left: Quantification of PIEZO1-GFP cluster area as violin plots in control and treatment conditions. Right: Relative frequency of cluster areas in square nanometers. (C) Left: Quantification of PIEZO1-GFP cluster perimeters as violin plots in control and treatment conditions. Right: Relative frequency of cluster perimeters in nanometers. For cluster area and perimeter: control PIEZO1-GFP (n = 34,741), MBCD (n = 19,159), cholesterol (n = 12,097), dynasore (n = 19,982); n = 1 represents a single PIEZO1-GFP cluster. (D) Left: Quantification of PIEZO1-GFP cluster density as violin plots in control and treatment conditions. Right: Relative frequency of cluster density in clusters per square micrometer. Control PIEZO1-GFP (n = 173), MBCD (n = 193), cholesterol (n = 126), dynasore (n = 82); n = 1 represents a single cell. All violin plots are marked with median (thick dashed line) flanked by 25th and 75th percentile (thin dashed lines). The median value of each plot is reported on the righthand side of each graph. One-way ANOVA; *, P < 0.05; ****, P < 0.00005; ns, not significant.
In control experiments, PIEZO1-GFP clusters appeared to distribute nonuniformly around the cell’s basal membrane and to pack into a variety of cluster areas and perimeters. Cluster areas ranged from few hundred to several thousand square nanometers. Less than 10% of total clusters in relative frequency histograms appeared to be ∼1,000–2,000 nm2 in area (Fig. 4 B) and ∼200–300 nm in perimeter (Fig. 4 C). All tested conditions appeared to increase the relative frequency of this fraction of clusters, indicating breakdown of larger order clusters into smaller ones. Despite the statistical difference detected between the median values for cluster sizes between conditions, the distribution of these cluster populations largely overlapped. In addition, the stably expressing HEK293T cells displayed variable levels of cluster densities in their basal membrane (Fig. 4 D), and we identified three major populations: low-density PIEZO1-GFP cells (∼2–3 clusters/µm2), medium-density PIEZO1-GFP cells (∼6 clusters/µm2), and high-density PIEZO1-GFP cells (∼8–9 clusters/µm2). As suggested by the size histograms, each treatment appeared to impact the density of PIEZO1-GFP clusters in the basal membrane by increasing the number of cells displaying reduced cluster densities. Of all tested conditions, dynasore appeared to uniformly reduce the cluster density in all three observed groups. MBCD and cholesterol treatments, on the other hand, greatly reduced the fraction of cells displaying high densities of PIEZO1-GFP, enriching the fraction of cells displaying low-density PIEZO1-GFP clusters. Because of the filtering process applied to STORM data, it is important to mention here that the smallest cluster population of <30-nm radius would likely have been excluded from the analysis if not found to produce sufficient blinking events and thus preventing us from estimating exact cluster densities per square micrometer. Our results nevertheless offer reliable estimates for densities of larger PIEZO1 clusters above that size.
These results suggest that PIEZO1-GFP assembles into clusters in the plasma membrane of cells. Cholesterol levels in the plasma membrane appear to regulate the degree of clustering by mostly affecting the density of clusters in the basal membrane.
Colocalization of PIEZO1-GFP and raft marker CtxB
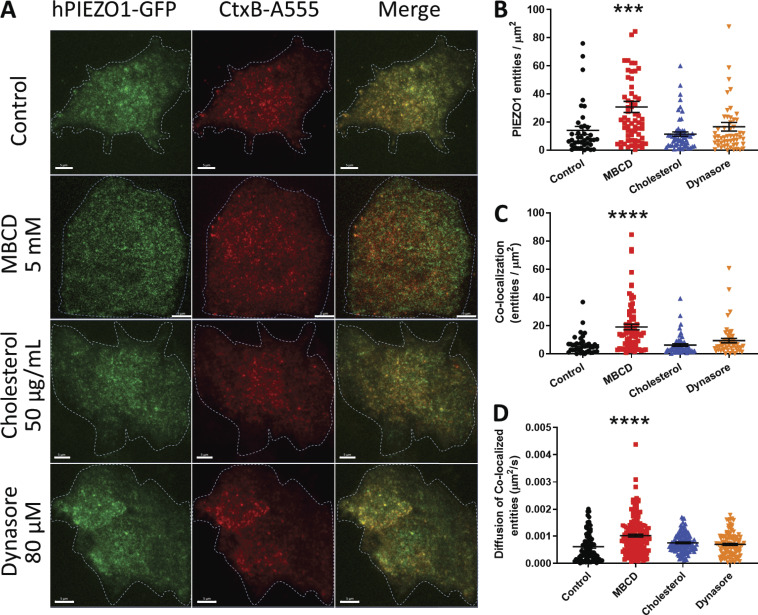
To visualize association of PIEZO1-GFP and cholesterol-rich domains in stably expressing HEK293T cells, we used fluorescently labeled (Alexa Fluor 555) CtxB, a well-known marker of lipid rafts (Day and Kenworthy, 2015). Because of the heterogeneous and dynamic behavior of PIEZO1-GFP entities in the membrane, we collected imaging data as time-lapse series in two channels and examined the degree of cross-correlation between GFP- and Alexa Fluor 555–tagged entities using STICCS (see Materials and methods). This approach allows for quantitation of density of fluorescent entities per square micrometer (amplitudes of correlation functions) and to calculate the number of overlapping (colocalized) entities in a series as well as their dynamics. In control experiments, PIEZO1-GFP appeared as punctate entities consistent with channel clustering that often colocalized with CtxB–Alexa Fluor 555 (Fig. 5, top row). Quantification of PIEZO1-GFP/CtxB colocalization revealed that PIEZO1-GFP colocalizes with CtxB at ∼40% (Fig. S9 A). These colocalized entities dissociated upon addition of MBCD (Fig. 5 A, second row). This resulted in a larger fraction of smaller PIEZO1-GFP entities detected in the membrane (Fig. 5 B) as well as an increase in colocalized entities (Fig. 5 C). The density of fluorescent CtxB did not change across conditions, indicating that GM1 ganglioside levels were not affected (Fig. S9 B).
Figure 5.
Colocalization of PIEZO1-GFP and CtxB raft marker using TIRF. (A) TIRF microscopy of cholesterol-rich domains labeled with CtxB–Alexa Fluor 555 (A555; red) on the basal membrane of PIEZO1-GFP–expressing HEK293T cells (GFP fluorescence in green). (B) Average number of PIEZO1-GFP entities per square micrometer detected after 30-min treatments. (C) Average density of colocalized entities per square micrometer detected after 30-min treatments. Control (n = 6 trials, 42 cells), MBCD (n = 6 trials, 81 cells), cholesterol (n = 6 trials, 62 cells), and dynasore (n = 6 trials, 55 cells). (D) Effective diffusion rate of colocalized PIEZO1-GFP/CtxB–A555 at the micrometer scale, before and after treatments. Examples of STICCS correlation function time courses are shown in Video 1. One-way ANOVA; ***, P < 0.0005; ****, P < 0.0001; error bars represent SEM. Scale bars represent 5 µm.
Figure S9.
Additional parameters calculated from ICCS for assessment of PIEZO1-GFP/CtxB–Alexa Fluor 555 colocalization in the plasma membrane. (A) Fraction of total PIEZO1-GFP colocalized with CtxB–Alexa Fluor 555. (B) Average number of CtxB–Alexa Fluor 555 entities colocalized with PIEZO1-GFP per square micrometer. (C) 2D effective diffusion of CtxB–Alexa Fluor 555 in the basal plasma membrane. One-way ANOVA; ****, P < 0.0001; error bars represent SEM.
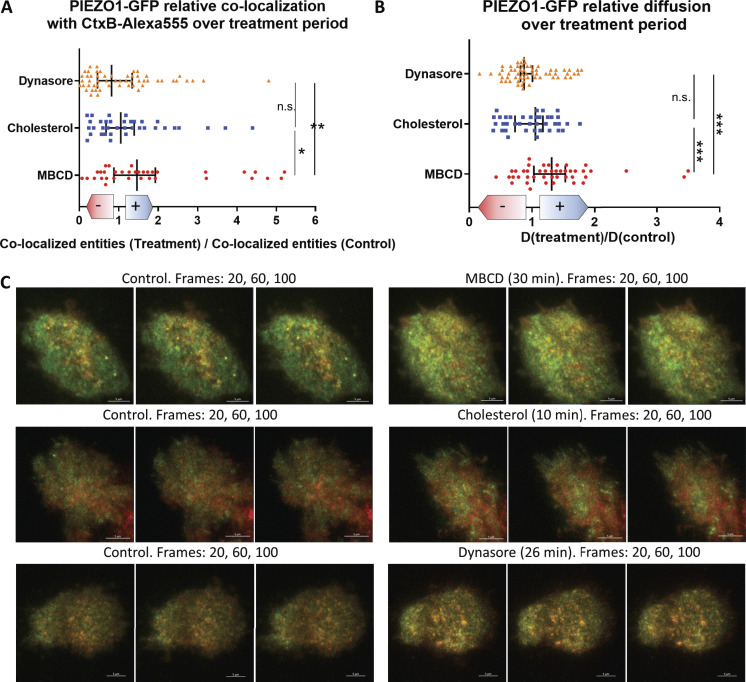
As previously observed (Fig. 3 D), the MBCD-treated PIEZO1-GFP entities also appeared to diffuse faster in the basal membrane than in controls, consistent with the idea that cholesterol-rich domains spatially confine PIEZO1-GFP. Interestingly, the diffusion speed of colocalized PIEZO1-GFP/CtxB entities was faster after MBCD treatment compared with the diffusion speed of colocalized entities in the control condition (Fig. 5 D). The MBCD treatment approximately doubled the diffusion speed of both individual CtxB entities (Fig. S9 C) and the PIEZO1-GFP/CtxB colocalized entities (Fig. 5 D). The effects of MBCD treatment were also observed in time-course experiments at the single-cell level (Fig. S10). Dynasore- and cholesterol-treated cells showed no significant difference in either PIEZO1-GFP cluster numbers (Fig. 5 B) or their colocalization with CtxB (Fig. 5 C) compared with control. In addition, CtxB did not significantly affect the diffusive dynamics of PIEZO1-GFP. The validity of ICCS as a tool to assess colocalization was verified and confirmed in a series of control experiments (Fig. S11 and Fig. S12).
Figure S10.
Time-lapse imaging of single cells exposed to treatments. Live hP1-1591–GFP cells were stained with CtxB–Alexa Fluor 555 and imaged periodically in 100-frame time lapses for up to ∼70 min. (A and B) We monitored the amount of colocalized PIEZO1-GFP/CtxB–Alexa Fluor 555 entities (A) and the diffusion dynamics of PIEZO1-GFP (B) at the single-cell level in response to the various treatments used in this study. The results are quantified above and expressed as relative fold-change (+ shift for increase, – shift for decrease) with respect to values recorded before drug exposure. Each data point represents a single cell. (C) Representative frames of image series collected before (left) and after (right) start of treatment (from top to bottom: 5 mM MBCD, 50 µg/ml cholesterol, 80 µM dynasore). Statistical assessment was performed using one-way ANOVA with multiple comparisons; *, P < 0.05; **, P < 0.005; ***, P < 0.0005; error bars indicate median ± 95% confidence interval.
Collectively, these results suggest that PIEZO1-GFP associates into larger clusters in a cholesterol-dependent manner. Disruption of cholesterol organization in the membrane facilitates diffusion of PIEZO1-GFP, suggesting a confinement by cholesterol-rich fences.
Colocalization of PIEZO1-GFP and the membrane order probe Laurdan
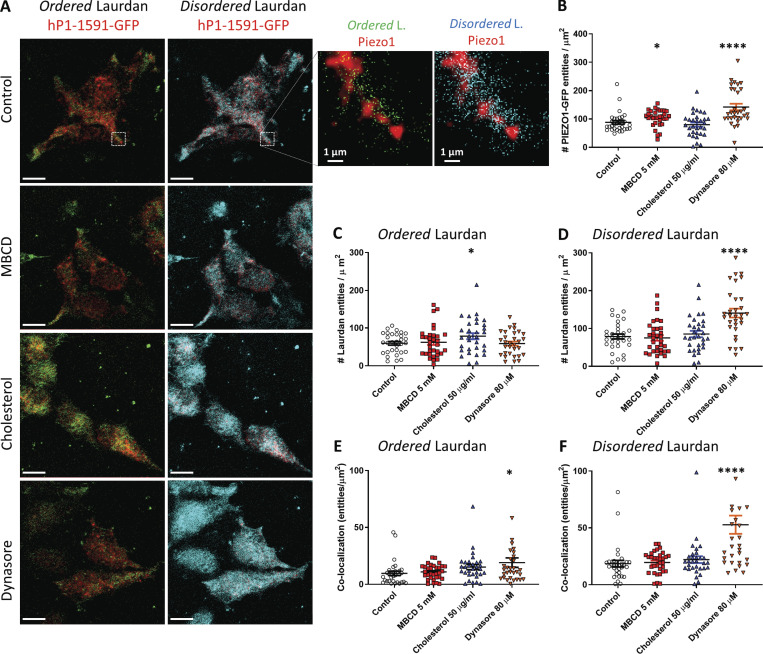
Using two-photon microscopy (excitation 780 nm), we were able to distinguish the fluorescent signals emitted from Laurdan associated with lipid-ordered membrane domains (emission 400–460 nm) and lipid-disordered ones (emission 470–530 nm) and independently assess the degree of colocalization between each lipid phase and PIEZO1-GFP using ICCS. As previously observed, the density of PIEZO1-GFP fluorescent entities appeared to increase upon cholesterol domain disruption after MBCD and dynasore treatments (Fig. 6 B). The density of “ordered” Laurdan (fraction of Laurdan associated with ordered lipids) was significantly increased upon cholesterol enrichment (Fig. 6 C). Conversely, Laurdan phase distribution appeared to be sensitive to cholesterol disruption, displaying a significant increase in detectable “disordered” Laurdan entities (fraction of Laurdan associated with disordered lipids) after exposure to dynasore (Fig. 6 D), but surprisingly not after MBCD treatment. In the control samples PIEZO1-GFP was found to colocalize with both the ordered Laurdan entities (Fig. 6 E) and the disordered counterpart (Fig. 6 F), and both populations appeared to increase their respective density of colocalized entities only after being treated with dynasore.
Figure 6.
Colocalization between PIEZO1-GFP and Laurdan phases. (A) Fluorescence microscopy of hP1-1591-CL cells labeled with Laurdan. PIEZO1-GFP (red) is tested for colocalization with either the liquid-ordered phase or the liquid-disordered signals emitted by the Laurdan dye. The images on the left column display the signal emitted by ordered-phase Laurdan (green signal, emission 400–460 nm) and the right column shows the signal emitted by disordered-phase Laurdan (cyan signal, emission 470–530 nm). Scale bars represent 10 µm. The inset on the top right shows a magnified portion of each control image (dashed white box) and highlights the difference in signal intensity and degree of colocalization with PIEZO1-GFP exhibited by either membrane phase labeled by the Laurdan dye. (B) Density of PIEZO1-GFP entities per square micrometer detected under various conditions. (C) Density of ordered Laurdan entities. (D) Density of disordered Laurdan entities. (E) Density of colocalized PIEZO-GFP/ordered Laurdan entities as determined by image correlation spectroscopy. (F) Density of colocalized PIEZO-GFP/disordered Laurdan entities. n = 1 represents data obtained from a single cell. Control PIEZO1-GFP (n = 31 cells), 5 mM MBCD (n = 32 cells), 50 µg/ml cholesterol (n = 31 cells), 80 µM dynasore (n = 31 cells). Statistical analysis was performed using one-way ANOVA; *, P < 0.05; ****, P < 0.0001; error bars represent SEM.
Dynasore treatment slightly increased the average density of PIEZO1-GFP colocalized with the ordered membranes (Fig. 6 E; dynasore, 19.1 colocalized entities/µm2, +1% versus control) but had a dramatic effect on its association with the disordered membranes (Fig. 6 F; dynasore, 52.8 colocalized entities/µm2, +285% versus control) membrane regions detected by Laurdan. Cholesterol enrichment did not affect the density of PIEZO1-GFP colocalized with ordered lipids, despite increasing the fraction of ordered Laurdan.
These results suggest that dynasore treatment increases the density of detectable disordered membrane domains, causing a large fraction of PIEZO1-GFP to associate with disordered lipids. MBCD treatment did not appear to significantly increase the fraction of disordered membrane domains while increasing the density of PIEZO1-GFP entities, highlighting the different mechanism of action of the two drugs on HEK293T membranes.
Discussion
In this study, we examined the effect of cholesterol depletion on PIEZO1’s response to mechanical stimuli in the form of negative pressure applied to cell-attached membrane patches. Our patch-clamp results indicate that the manipulation of membrane cholesterol alters PIEZO1-mediated mechanotransduction. We observed changes to collective (synchronized) inactivation and a latency of activation of PIEZO1 channel clusters when MBCD or dynasore was added to stably expressing HEK293T cells (Fig. 1).
Several possible explanations describe the observed phenomena. The impact of these drugs on channel activity could arise from effects on PIEZO1 organization, disrupted lipid-channel direct interactions, altered organization of cytoskeletal structures, and/or changes to plasma membrane organization and its global mechanical properties such as tension and fluidity. How these drugs impact the plasma membrane is still a matter of debate.
MBCD has been extensively used as a chelator of cholesterol (Zidovetzki and Levitan, 2007) for the removal and delivery of the lipid to membranes in vitro, and its mechanisms of action have been explored in detail (López et al., 2011; Chun et al., 2013). In contrast, the exact mechanism of action on the plasma membrane of dynasore (a known inhibitor of dynamin and endocytosis; Preta et al., 2015) is currently unknown and is speculated to interfere with calcium release by acting on the PLCγ-ERK1/2 cascade (Basagiannis et al., 2017), known to be involved in lipid remodeling. The induction of phosphorylation of PLCγ via dynasore, leading to enhanced lipase activity (Gresset et al., 2010), might explain its effect on the integrity of lipid domains. By changing the organization of membrane lipids, we have found that Piezo1 sensitivity, inactivation, and latency of the response can be modulated.
The rapid inactivation of PIEZO1 by membrane stretch is a key feature of this mechanosensitive ion channel (Coste et al., 2010; Gottlieb et al., 2012). Slowing inactivation in mutant PIEZO1 channels has been linked to several mechanopathologies, the first being hereditary xerocytosis, a familial anemia (Zarychanski et al., 2012; Bae et al., 2013b). The effect of cholesterol depletion on PIEZO1 has similar characteristics observed for these mutations (Bae et al., 2013b). For example, two mutations introduced to the ion-conducting pore of PIEZO1 resulted in a channel devoid of inactivation (Bae et al., 2013b). Interestingly, the slow-inactivation phenotype of the PIEZO1 R2456H mutant could be further exacerbated by cholesterol depletion via MBCD (Fig. 2, B and C). PIEZO1 R2456H displays a lower activation threshold (Fig. 2, E and F) besides its reduced inactivation (Fig. 2 C), in contrast with previous observations in whole-cell patch-clamp experiments (Glogowska et al., 2017; Romero et al., 2019). Furthermore, whenever we observed loss of inactivation, we also detected a delay in the latency of response, suggesting that the two parameters are functionally linked. Taken together, these data highlight that both lipids and mutations can affect PIEZO1 inactivation, with synergistic results.
The relationship between loss of channel inactivation and shift in sensitivity remains unclear. Slowly inactivating double mutants displayed a leftward shift in pressure dependence (Bae et al., 2013b), whereas MBCD-treated WT proteins experienced a rightward shift. Conversely, enrichment of membrane fatty acids with DHA resulted in the sensitization of PIEZO1-GFP but also in loss of inactivation. The repeated stimulation of membrane patches from stable PIEZO1-GFP cells treated with DHA caused a delay in the channel latency and the progressive loss of inactivation at high pressure regimes (Fig. S7 E), a finding in contrast with a recent study using whole-cell patch-clamping and activation of PIEZO1 by cell indentation (Romero et al., 2019). This suggests that the magnitude and mode of application of the mechanical stimulus also play a role in defining the inactivation behavior of PIEZO1. The activation thresholds quantified in Table 2 are in good agreement with previously published estimates (Cox et al., 2016a; Bae et al., 2013b).
We also observed that the mode of expression of PIEZO1 and its mutant plays a role in determining the channel mechanosensitive properties. The sensitivity of all transiently expressed channels did not change after MBCD treatment, as opposed to what we observed in PIEZO1-GFP stable cells and N2A, but all nevertheless experienced a significant loss of inactivation after cholesterol depletion. We speculate that transient (24–48-h) overexpression of the channel was not sufficiently long to allow proper localization of the PIEZO1 channel with respect to cholesterol domains. In contrast, we can imagine that a stable cell line would have regulated its PIEZO1 levels and subcellular distribution over many generations to avoid long-term toxicity due to acute overexpression, allowing for a significant MBCD-driven modulation of both inactivation and sensitivity to be detected. This conclusion is supported by MBCD’s effect on N2A cells (Fig. S5). It is worth noting that plasmid-borne PIEZO1 levels were found to be higher than in stable cells (Fig. S6 E) and N2A cells (Fig. S5 F). Together, these results suggest that cholesterol plays an important role in regulating PIEZO1 inactivation, while PIEZO1 sensitivity is dependent on the mechanical properties of its host membrane rather than on the presence of cholesterol specifically.
Because of the possibility that cholesterol regulates inactivation by affecting the clustering of channels, we performed STORM superresolution microscopy to investigate the behavior of PIEZO1-GFP in the basal membrane of our stable cell line. Currently, the latency of channels could only be explained by fracture kinetics that predicted the presence of clusters (Bae et al., 2013a). The association of PIEZO1 with cholesterol-rich membrane domains appears to be a crucial determinant of its mechanotransductive properties (Qi et al., 2015). Possible evidence of cluster formation was also observed previously using structure illuminated microscopy (Cox et al., 2016a; Maneshi et al., 2018).
Using superresolution microscopy, we demonstrated that PIEZO1 indeed forms membrane clusters at the nanoscale. PIEZO1-GFP clusters in the cell membrane have a broad range of sizes (Fig. 4), from presumably isolated single channels up to assemblies of the protein in the tens of thousands of square nanometers. The stable cell line probed here displays a range of PIEZO1-GFP expression levels, as well as a nonhomogeneous distribution of the clusters on the cellular basal membrane (Fig. 4 D). We identified cluster subpopulations that are disrupted and are more sensitive to cholesterol modulation. Approximate estimates of the PIEZO1 protein area based on the most detailed available structure (PDB accession no. 6B3R) suggest that a single trimer projects a ∼280-nm2 area when observed perpendicularly to the membrane plane (Ge et al., 2015). Estimating channel numbers in the cluster is complicated by the dome-like structure that is adopted by PIEZO1 and the need to assess how they would pack (Guo and MacKinnon, 2017). Nevertheless, all the treatments used appear to reduce the median density of PIEZO1-GFP clusters and significantly enrich a subset of smaller clusters (∼1,000–1,500 nm2 in area; Fig. 4 B, histogram). Correlative experiments on live cells allowed us to follow the cluster biophysical properties during treatment (Fig. S10).
Removal of membrane cholesterol via MBCD appeared to generate more PIEZO1-GFP entities in the membrane (Fig. 5 B) and to cause a faster diffusion of channels in the basal membrane (Figs. 3 D and 5 D), suggesting that cholesterol domains confine PIEZO1-GFP clusters within lipid boundaries, rather than cytoskeletal fences (Fig. S8). Interestingly, MBCD treatment increased the colocalization between PIEZO1-GFP and the raft marker CtxB (Fig. 5 C), suggesting that upon cholesterol disruption, PIEZO1-GFP clusters retained interactions with lipid raft components that are enriched in GM1 ganglioside, the target of CtxB. The dynasore treatment, on the other hand, failed to increase the diffusion of PIEZO1-GFP clusters in the membrane (Fig. 5 D) and did not change the degree of colocalization with the marker CtxB compared with control (Fig. 5 C).
The association of PIEZO1 and lipid rafts has been suggested, since depletion of STOML3 affects PIEZO1 activation (Poole et al., 2014). These colocalized PIEZO1-GFP/CtxB entities also appeared to diffuse faster than in the control condition (Fig. 5 D), similarly to what was observed in single-color PIEZO1-GFP in situ imaging (Fig. 3 D). Our most accurate estimates for the diffusion of PIEZO1-GFP clusters were in the order of 0.01 µm2/s, in the same order of magnitude as previously reported by the Pathak laboratory (0.067 µm2/s; Ellefsen et al., 2019). This is in support of the idea that channel inactivation could be regulated by raft-mediated clustering of the protein.
We used Laurdan imaging to investigate the localization of PIEZO1-GFP in the membrane with respect to liquid disordered and more ordered regions. In control conditions, ∼40% of detected PIEZO1-GFP entities appeared to be colocalized with ordered domains (Fig. 6 E and Fig. S9), whereas the remaining fraction colocalized with disordered lipid entities (Fig. 6 F). MBCD treatment did not increase the colocalization of PIEZO1-GFP with disordered lipids (Fig. 6 F), supporting the idea that an interaction between ordered, raft-like membrane fractions and PIEZO1-GFP clusters is maintained after cholesterol depletion.
This also suggested that, after dynasore treatment, the cell membrane retained intact cholesterol-rich domains able to confine PIEZO1-GFP diffusion observed for the control. In some experiments, the treatment also caused an increase in detectable PIEZO1-GFP entities suggestive of cluster breakdown (Fig. 6 B). Interestingly, dynasore, but not MBCD, increased the number of disordered Laurdan entities (Fig. 6 D) while promoting the colocalization of PIEZO1-GFP clusters with disordered lipid entities (Fig. 6 F). In this case, PIEZO1 showed no increased retention of CtxB (Fig. 5 C), suggesting that an increased fraction of channel clusters became associated with disordered lipid domains while being separated from cholesterol-rich membrane fractions.
This might explain the difference observed in electrophysiology between MBCD, which maintains CtxB/PIEZO1 colocalization, and dynasore, which does not, and link to the effect on channel inactivation. Possibly, as PIEZO1 clusters become separated from rafts, they lose their ability to collectively inactivate and localize to a different mechanical environment. The effect of MBCD on the mechanical properties of the membrane could produce stiffer environments able to desensitize the channels of the cluster (Byfield et al., 2004; Khatibzadeh et al., 2013). This suggest that during the channel gating cycle, a lipid-dependent component plays a major role in regulating the kinetics of inactivation. This fits well with recent extensive data from the Vasquez laboratory (Romero et al., 2019) and extends the effects to cholesterol. These lipid-mediated effects may also explain why native PIEZO1 shows ameliorated inactivation in some cell types (Rode et al., 2017; Del Mármol et al., 2018). Cholesterol enrichment did not appear to increase the fraction of PIEZO1-GFP in proximity of ordered lipids (Fig. 6 E) or CtxB (Fig. 5 C), but significantly increased the fraction of ordered lipids (Fig. 6 C), indicating that cholesterol enrichment induced an enlargement of existing cholesterol domains. Also, cholesterol enrichment did not sensitize the PIEZO1-GFP response or affect its kinetics (Fig. 1 B), indicating that the additional membrane stiffening due to ordered lipids did not affect the channel response. In contrast, PIEZO1 has been reported to be desensitized following membrane stiffening by supplementation of saturated fatty acids (Romero et al., 2019), which become incorporated into membrane phospholipids. It appears therefore that PIEZO1 sensitivity is mostly affected by the stiffness of nonraft membranes, in which the higher line tension (Uline et al., 2012; Markin and Sachs, 2015) of the disordered membrane phase lowers the threshold for channel activation.
We envision a scenario based on the “picket-fence model” (Fujiwara et al., 2016) in which cholesterol fences (rather than cytoskeletal fences) organized as a dynamic network on the cell surface delimit the 2D diffusion of PIEZO1 clusters. In our view, stiffened lipid structures connecting several clusters would allow fast propagation of membrane tension between them, facilitating the synchronized gating behavior of the channels.
Further work should aim to probe whether these effects are generated by specific lipid–protein interactions, global effects on the mechanics of the bilayer, or both. Cholesterol-mediated effects on PIEZO1 may be relevant to cell types frequently exposed to cholesterol in the circulation such as red blood cells, vascular endothelial cells (Park et al., 1998), leukocytes (Zhang et al., 2011), or cells displaying high levels of membrane cholesterol such as myelinating oligodendrocytes and Schwann cells (Belin et al., 2017).
Our electrophysiology results suggest that the inactivation of PIEZO1 currents could be mediated by cholesterol domains bridging PIEZO1 clusters and not only an intrinsic effect of the conformational changes of the PIEZO1 protein during its gating cycle, as shown by previous mutation studies (Bae et al., 2013b; Glogowska et al., 2017; Wu et al., 2017b; Moroni et al., 2018; Zheng et al., 2019). This ability of lipids to modulate or even reverse the slow-inactivating phenotype of PIEZO1 mutants has recently been suggested (Romero et al., 2019). Along with this study, our work highlights the critical importance of studying PIEZO1 and its disease-causing variants in native PIEZO1-expressing cells where possible.
Acknowledgments
David A. Eisner served as editor.
We acknowledge the access to instruments at the University of New South Wales Biomedical Imaging Facility and Mark Wainwright Analytical Centre, as well as Cancer Institute NSW for purchase of the Zeiss 880 multiphoton microscope.
P. Ridone has been supported by the University of New South Wales (University International Tuition Award); C.D. Cox was supported by an Early and Mid-Career Fellowship from New South Wales Health; and M. Vassalli was a recipient of the Australian Government Endeavor Fellowship 5504_2016. This project was also supported by Australian Research Council Grant DP160103993 and the National Health and Medical Research Council of Australia (Principal Research Fellowship APP1135974) to B. Martinac. We also acknowledge funds from the Office of Health and Medical Research, New South Wales State Government.
The authors declare no competing financial interests.
Author contributions: P. Ridone designed and performed electrophysiology experiments on all samples except N2A cells; analyzed all electrophysiology data; sample preparation and data acquisition in microscopy experiments; designed and produced the figures in the manuscript; and wrote the manuscript. E. Pandzic was responsible for sample preparation and data acquisition for microscopy experiments; analysis of all microscopy data; was involved in the design and production of figures and videos; and wrote the manuscript. M. Vassalli initialized the collaboration between B. Martinac, P. Ridone, and E. Pandzic; performed the pilot microscopy experiments (TIRF and STORM); suggested Laurdan and Filipin experiments; and critically reviewed the manuscript. C.D. Cox performed electrophysiology experiments on N2A cells; performed cell viability assay; and critically reviewed the manuscript. A. Macmillan involved in the experimental design of microscopy experiments and critically reviewed the manuscript. P.A. Gottlieb provided stable PIEZO1-GFP cell lines and critically reviewed the manuscript. B. Martinac was head of laboratory and PhD supervisor of P. Ridone; provided equipment and funds; and critically reviewed the manuscript.
References
- Abu-Arish A., Pandzic E., Goepp J., Matthes E., Hanrahan J.W., and Wiseman P.W.. 2015. Cholesterol modulates CFTR confinement in the plasma membrane of primary epithelial cells. Biophys. J. 109:85–94. 10.1016/j.bpj.2015.04.042 [DOI] [PMC free article] [PubMed] [Google Scholar]
- Albuisson J., Murthy S.E., Bandell M., Coste B., Louis-Dit-Picard H., Mathur J., Fénéant-Thibault M., Tertian G., de Jaureguiberry J.P., Syfuss P.Y., et al. 2013. Dehydrated hereditary stomatocytosis linked to gain-of-function mutations in mechanically activated PIEZO1 ion channels. Nat. Commun. 4:1884 10.1038/ncomms2899 [DOI] [PMC free article] [PubMed] [Google Scholar]
- Andolfo I., Alper S.L., De Franceschi L., Auriemma C., Russo R., De Falco L., Vallefuoco F., Esposito M.R., Vandorpe D.H., Shmukler B.E., et al. 2013. Multiple clinical forms of dehydrated hereditary stomatocytosis arise from mutations in PIEZO1. Blood. 121:3925–3935–S12. 10.1182/blood-2013-02-482489 [DOI] [PubMed] [Google Scholar]
- Bae C., Gnanasambandam R., Nicolai C., Sachs F., and Gottlieb P.A.. 2013a Xerocytosis is caused by mutations that alter the kinetics of the mechanosensitive channel PIEZO1. Proc. Natl. Acad. Sci. USA. 110:E1162–E1168. 10.1073/pnas.1219777110 [DOI] [PMC free article] [PubMed] [Google Scholar]
- Bae C., Gottlieb P.A., and Sachs F.. 2013b Human PIEZO1: removing inactivation. Biophys. J. 105:880–886. 10.1016/j.bpj.2013.07.019 [DOI] [PMC free article] [PubMed] [Google Scholar]
- Bar-On D., Wolter S., van de Linde S., Heilemann M., Nudelman G., Nachliel E., Gutman M., Sauer M., and Ashery U.. 2012. Super-resolution imaging reveals the internal architecture of nano-sized syntaxin clusters. J. Biol. Chem. 287:27158–27167. 10.1074/jbc.M112.353250 [DOI] [PMC free article] [PubMed] [Google Scholar]
- Basagiannis D., Zografou S., Galanopoulou K., and Christoforidis S.. 2017. Dynasore impairs VEGFR2 signalling in an endocytosis-independent manner. Sci. Rep. 7:45035 10.1038/srep45035 [DOI] [PMC free article] [PubMed] [Google Scholar]
- Belin S., Zuloaga K.L., and Poitelon Y.. 2017. Influence of Mechanical Stimuli on Schwann Cell Biology. Front. Cell. Neurosci. 11:347 10.3389/fncel.2017.00347 [DOI] [PMC free article] [PubMed] [Google Scholar]
- Brandão H.B., Sangji H., Pandžić E., Bechstedt S., Brouhard G.J., and Wiseman P.W.. 2014. Measuring ligand-receptor binding kinetics and dynamics using k-space image correlation spectroscopy. Methods. 66:273–282. 10.1016/j.ymeth.2013.07.042 [DOI] [PubMed] [Google Scholar]
- Byfield F.J., Aranda-Espinoza H., Romanenko V.G., Rothblat G.H., and Levitan I.. 2004. Cholesterol depletion increases membrane stiffness of aortic endothelial cells. Biophys. J. 87:3336–3343. 10.1529/biophysj.104.040634 [DOI] [PMC free article] [PubMed] [Google Scholar]
- Cahalan S.M., Lukacs V., Ranade S.S., Chien S., Bandell M., and Patapoutian A.. 2015. Piezo1 links mechanical forces to red blood cell volume. eLife. 4 e07370 10.7554/eLife.07370 [DOI] [PMC free article] [PubMed] [Google Scholar]
- Chun Y.S., Oh H.G., Park M.K., Kim T.W., and Chung S.. 2013. Increasing Membrane Cholesterol Level Increases the Amyloidogenic Peptide by Enhancing the Expression of Phospholipase C. J. Neurodegener. Dis. 2013 407903. [DOI] [PMC free article] [PubMed] [Google Scholar]
- Comeau J.W., Kolin D.L., and Wiseman P.W.. 2008. Accurate measurements of protein interactions in cells via improved spatial image cross-correlation spectroscopy. Mol. Biosyst. 4:672–685. 10.1039/b719826d [DOI] [PubMed] [Google Scholar]
- Cordero-Morales J.F., and Vásquez V.. 2018. How lipids contribute to ion channel function, a fat perspective on direct and indirect interactions. Curr. Opin. Struct. Biol. 51:92–98. 10.1016/j.sbi.2018.03.015 [DOI] [PMC free article] [PubMed] [Google Scholar]
- Coste B., Mathur J., Schmidt M., Earley T.J., Ranade S., Petrus M.J., Dubin A.E., and Patapoutian A.. 2010. Piezo1 and Piezo2 are essential components of distinct mechanically activated cation channels. Science. 330:55–60. 10.1126/science.1193270 [DOI] [PMC free article] [PubMed] [Google Scholar]
- Cox C.D., Bae C., Ziegler L., Hartley S., Nikolova-Krstevski V., Rohde P.R., Ng C.A., Sachs F., Gottlieb P.A., and Martinac B.. 2016a Removal of the mechanoprotective influence of the cytoskeleton reveals PIEZO1 is gated by bilayer tension. Nat. Commun. 7:10366 10.1038/ncomms10366 [DOI] [PMC free article] [PubMed] [Google Scholar]
- Cox C.D., Bavi N., and Martinac B.. 2016b Origin of the Force: The Force-From-Lipids Principle Applied to Piezo Channels. In Current Topics in Membranes. Cambridge, MA: Academic Press; 59–96. [DOI] [PubMed] [Google Scholar]
- Day C.A., and Kenworthy A.K.. 2015. Functions of cholera toxin B-subunit as a raft cross-linker. Essays Biochem. 57:135–145. 10.1042/bse0570135 [DOI] [PMC free article] [PubMed] [Google Scholar]
- Del Mármol J.I., Touhara K.K., Croft G., and MacKinnon R.. 2018. Piezo1 forms a slowly-inactivating mechanosensory channel in mouse embryonic stem cells. eLife. 7 e33149 10.7554/eLife.33149 [DOI] [PMC free article] [PubMed] [Google Scholar]
- Dempsey G.T., Vaughan J.C., Chen K.H., Bates M., and Zhuang X.. 2011. Evaluation of fluorophores for optimal performance in localization-based super-resolution imaging. Nat. Methods. 8:1027–1036. 10.1038/nmeth.1768 [DOI] [PMC free article] [PubMed] [Google Scholar]
- Ellefsen K.L., Holt J.R., Chang A.C., Nourse J.L., Arulmoli J., Mekhdjian A.H., Abuwarda H., Tombola F., Flanagan L.A., Dunn A.R., et al. 2019. Myosin-II mediated traction forces evoke localized Piezo1-dependent Ca2+ flickers. Commun. Biol. 2:298 10.1038/s42003-019-0514-3 [DOI] [PMC free article] [PubMed] [Google Scholar]
- Fujiwara T.K., Iwasawa K., Kalay Z., Tsunoyama T.A., Watanabe Y., Umemura Y.M., Murakoshi H., Suzuki K.G., Nemoto Y.L., Morone N., et al. 2016. Confined diffusion of transmembrane proteins and lipids induced by the same actin meshwork lining the plasma membrane. Mol. Biol. Cell. 27:1101–1119. 10.1091/mbc.E15-04-0186 [DOI] [PMC free article] [PubMed] [Google Scholar]
- Ge J., Li W., Zhao Q., Li N., Chen M., Zhi P., Li R., Gao N., Xiao B., and Yang M.. 2015. Architecture of the mammalian mechanosensitive Piezo1 channel. Nature. 527:64–69. 10.1038/nature15247 [DOI] [PubMed] [Google Scholar]
- Glogowska E., Schneider E.R., Maksimova Y., Schulz V.P., Lezon-Geyda K., Wu J., Radhakrishnan K., Keel S.B., Mahoney D., Freidmann A.M., et al. 2017. Novel mechanisms of PIEZO1 dysfunction in hereditary xerocytosis. Blood. 130:1845–1856. 10.1182/blood-2017-05-786004 [DOI] [PMC free article] [PubMed] [Google Scholar]
- Gottlieb P.A., Bae C., and Sachs F.. 2012. Gating the mechanical channel Piezo1: a comparison between whole-cell and patch recording. Channels (Austin). 6:282–289. 10.4161/chan.21064 [DOI] [PMC free article] [PubMed] [Google Scholar]
- Gresset A., Hicks S.N., Harden T.K., and Sondek J.. 2010. Mechanism of phosphorylation-induced activation of phospholipase C-gamma isozymes. J. Biol. Chem. 285:35836–35847. 10.1074/jbc.M110.166512 [DOI] [PMC free article] [PubMed] [Google Scholar]
- Guo Y.R., and MacKinnon R.. 2017. Structure-based membrane dome mechanism for Piezo mechanosensitivity. eLife. 6 e33660 10.7554/eLife.33660 [DOI] [PMC free article] [PubMed] [Google Scholar]
- Hamill O.P., and Martinac B.. 2001. Molecular basis of mechanotransduction in living cells. Physiol. Rev. 81:685–740. 10.1152/physrev.2001.81.2.685 [DOI] [PubMed] [Google Scholar]
- Hedde P.N., Stakic M., and Gratton E.. 2014. Rapid measurement of molecular transport and interaction inside living cells using single plane illumination. Sci. Rep. 4:7048 10.1038/srep07048 [DOI] [PMC free article] [PubMed] [Google Scholar]
- Hulce J.J., Cognetta A.B., Niphakis M.J., Tully S.E., and Cravatt B.F.. 2013. Proteome-wide mapping of cholesterol-interacting proteins in mammalian cells. Nat. Methods. 10:259–264. 10.1038/nmeth.2368 [DOI] [PMC free article] [PubMed] [Google Scholar]
- Johnson B.B., Moe P.C., Wang D., Rossi K., Trigatti B.L., and Heuck A.P.. 2012. Modifications in perfringolysin O domain 4 alter the cholesterol concentration threshold required for binding. Biochemistry. 51:3373–3382. 10.1021/bi3003132 [DOI] [PubMed] [Google Scholar]
- Kapoor-Kaushik N., Hinde E., Compeer E.B., Yamamoto Y., Kraus F., Yang Z., Lou J., Pageon S.V., Tabarin T., Gaus K., et al. 2016. Distinct Mechanisms Regulate Lck Spatial Organization in Activated T Cells. Front. Immunol. 7:83 10.3389/fimmu.2016.00083 [DOI] [PMC free article] [PubMed] [Google Scholar]
- Khatibzadeh N., Spector A.A., Brownell W.E., and Anvari B.. 2013. Effects of plasma membrane cholesterol level and cytoskeleton F-actin on cell protrusion mechanics. PLoS One. 8 e57147 10.1371/journal.pone.0057147 [DOI] [PMC free article] [PubMed] [Google Scholar]
- Levental K.R., Lorent J.H., Lin X., Skinkle A.D., Surma M.A., Stockenbojer E.A., Gorfe A.A., and Levental I.. 2016. Polyunsaturated Lipids Regulate Membrane Domain Stability by Tuning Membrane Order. Biophys. J. 110:1800–1810. 10.1016/j.bpj.2016.03.012 [DOI] [PMC free article] [PubMed] [Google Scholar]
- Lewis A.H., and Grandl J.. 2015. Mechanical sensitivity of Piezo1 ion channels can be tuned by cellular membrane tension. eLife. 4 e12088 10.7554/eLife.12088 [DOI] [PMC free article] [PubMed] [Google Scholar]
- Lewis A.H., and Grandl J.. 2020. Inactivation Kinetics and Mechanical Gating of Piezo1 Ion Channels Depend on Subdomains within the Cap. Cell Rep. 30:870–880.e2. 10.1016/j.celrep.2019.12.040 [DOI] [PMC free article] [PubMed] [Google Scholar]
- Li J., Hou B., Tumova S., Muraki K., Bruns A., Ludlow M.J., Sedo A., Hyman A.J., McKeown L., Young R.S., et al. 2014. Piezo1 integration of vascular architecture with physiological force. Nature. 515:279–282. 10.1038/nature13701 [DOI] [PMC free article] [PubMed] [Google Scholar]
- López C.A., de Vries A.H., and Marrink S.J.. 2011. Molecular mechanism of cyclodextrin mediated cholesterol extraction. PLOS Comput. Biol. 7 e1002020 10.1371/journal.pcbi.1002020 [DOI] [PMC free article] [PubMed] [Google Scholar]
- Ma S., Cahalan S., LaMonte G., Grubaugh N.D., Zeng W., Murthy S.E., Paytas E., Gamini R., Lukacs V., Whitwam T., et al. 2018. Common PIEZO1 Allele in African Populations Causes RBC Dehydration and Attenuates Plasmodium Infection. Cell. 173:443–455.e12. 10.1016/j.cell.2018.02.047 [DOI] [PMC free article] [PubMed] [Google Scholar]
- Maekawa M. 2017. Domain 4 (D4) of Perfringolysin O to Visualize Cholesterol in Cellular Membranes-The Update. Sensors (Basel). 17:504 10.3390/s17030504 [DOI] [PMC free article] [PubMed] [Google Scholar]
- Maekawa M., and Fairn G.D.. 2015. Complementary probes reveal that phosphatidylserine is required for the proper transbilayer distribution of cholesterol. J. Cell Sci. 128:1422–1433. 10.1242/jcs.164715 [DOI] [PubMed] [Google Scholar]
- Maneshi M.M., Ziegler L., Sachs F., Hua S.Z., and Gottlieb P.A.. 2018. Enantiomeric Aβ peptides inhibit the fluid shear stress response of PIEZO1. Sci. Rep. 8:14267 10.1038/s41598-018-32572-2 [DOI] [PMC free article] [PubMed] [Google Scholar]
- Markin V.S., and Sachs F.. 2015. Free Volume in Membranes: Viscosity or Tension? Open J. Biophys. 5:80–83. 10.4236/ojbiphy.2015.53007 [DOI] [PMC free article] [PubMed] [Google Scholar]
- Martinac B., Adler J., and Kung C.. 1990. Mechanosensitive ion channels of E. coli activated by amphipaths. Nature. 348:261–263. 10.1038/348261a0 [DOI] [PubMed] [Google Scholar]
- Moroni M., Servin-Vences M.R., Fleischer R., Sánchez-Carranza O., and Lewin G.R.. 2018. Voltage gating of mechanosensitive PIEZO channels. Nat. Commun. 9:1096 10.1038/s41467-018-03502-7 [DOI] [PMC free article] [PubMed] [Google Scholar]
- Pandžić E., Abu-Arish A., Whan R.M., Hanrahan J.W., and Wiseman P.W.. 2018. Velocity landscape correlation resolves multiple flowing protein populations from fluorescence image time series. Methods. 140–141:126–139. 10.1016/j.ymeth.2018.02.011 [DOI] [PubMed] [Google Scholar]
- Park H., Go Y.M., St John P.L., Maland M.C., Lisanti M.P., Abrahamson D.R., and Jo H.. 1998. Plasma membrane cholesterol is a key molecule in shear stress-dependent activation of extracellular signal-regulated kinase. J. Biol. Chem. 273:32304–32311. 10.1074/jbc.273.48.32304 [DOI] [PubMed] [Google Scholar]
- Poole K., Herget R., Lapatsina L., Ngo H.D., and Lewin G.R.. 2014. Tuning Piezo ion channels to detect molecular-scale movements relevant for fine touch. Nat. Commun. 5:3520 10.1038/ncomms4520 [DOI] [PMC free article] [PubMed] [Google Scholar]
- Preta G., Lotti V., Cronin J.G., and Sheldon I.M.. 2015. Protective role of the dynamin inhibitor Dynasore against the cholesterol-dependent cytolysin of Trueperella pyogenes. FASEB J. 29:1516–1528. 10.1096/fj.14-265207 [DOI] [PMC free article] [PubMed] [Google Scholar]
- Qi Y., Andolfi L., Frattini F., Mayer F., Lazzarino M., and Hu J.. 2015. Membrane stiffening by STOML3 facilitates mechanosensation in sensory neurons. Nat. Commun. 6:8512 10.1038/ncomms9512 [DOI] [PMC free article] [PubMed] [Google Scholar]
- Qin C., Nagao T., Grosheva I., Maxfield F.R., and Pierini L.M.. 2006. Elevated plasma membrane cholesterol content alters macrophage signaling and function. Arterioscler. Thromb. Vasc. Biol. 26:372–378. 10.1161/01.ATV.0000197848.67999.e1 [DOI] [PubMed] [Google Scholar]
- Rode B., Shi J., Endesh N., Drinkhill M.J., Webster P.J., Lotteau S.J., Bailey M.A., Yuldasheva N.Y., Ludlow M.J., Cubbon R.M., et al. 2017. Piezo1 channels sense whole body physical activity to reset cardiovascular homeostasis and enhance performance. Nat. Commun. 8:350 10.1038/s41467-017-00429-3 [DOI] [PMC free article] [PubMed] [Google Scholar]
- Romero L.O., Massey A.E., Mata-Daboin A.D., Sierra-Valdez F.J., Chauhan S.C., Cordero-Morales J.F., and Vásquez V.. 2019. Dietary fatty acids fine-tune Piezo1 mechanical response. Nat. Commun. 10:1200 10.1038/s41467-019-09055-7 [DOI] [PMC free article] [PubMed] [Google Scholar]
- Saotome K., Murthy S.E., Kefauver J.M., Whitwam T., Patapoutian A., and Ward A.B.. 2018. Structure of the mechanically activated ion channel Piezo1. Nature. 554:481–486. 10.1038/nature25453 [DOI] [PMC free article] [PubMed] [Google Scholar]
- Shaikh S.R., Rockett B.D., Salameh M., and Carraway K.. 2009. Docosahexaenoic acid modifies the clustering and size of lipid rafts and the lateral organization and surface expression of MHC class I of EL4 cells. J. Nutr. 139:1632–1639. 10.3945/jn.109.108720 [DOI] [PubMed] [Google Scholar]
- Sultan M., Schulz M.H., Richard H., Magen A., Klingenhoff A., Scherf M., Seifert M., Borodina T., Soldatov A., Parkhomchuk D., et al. 2008. A global view of gene activity and alternative splicing by deep sequencing of the human transcriptome. Science. 321:956–960. 10.1126/science.1160342 [DOI] [PubMed] [Google Scholar]
- Syeda R., Florendo M.N., Cox C.D., Kefauver J.M., Santos J.S., Martinac B., and Patapoutian A.. 2016. Piezo1 Channels Are Inherently Mechanosensitive. Cell Rep. 17:1739–1746. 10.1016/j.celrep.2016.10.033 [DOI] [PMC free article] [PubMed] [Google Scholar]
- Teng J., Loukin S., Anishkin A., and Kung C.. 2015. The force-from-lipid (FFL) principle of mechanosensitivity, at large and in elements. Pflugers Arch. 467:27–37. 10.1007/s00424-014-1530-2 [DOI] [PMC free article] [PubMed] [Google Scholar]
- Toplak T., Pandzic E., Chen L., Vicente-Manzanares M., Horwitz A.R., and Wiseman P.W.. 2012. STICCS reveals matrix-dependent adhesion slipping and gripping in migrating cells. Biophys. J. 103:1672–1682. 10.1016/j.bpj.2012.08.060 [DOI] [PMC free article] [PubMed] [Google Scholar]
- Uhlén M., Fagerberg L., Hallström B.M., Lindskog C., Oksvold P., Mardinoglu A., Sivertsson Å., Kampf C., Sjöstedt E., Asplund A., et al. 2015. Proteomics. Tissue-based map of the human proteome. Science. 347 1260419 10.1126/science.1260419 [DOI] [PubMed] [Google Scholar]
- Uline M.J., Schick M., and Szleifer I.. 2012. Phase behavior of lipid bilayers under tension. Biophys. J. 102:517–522. 10.1016/j.bpj.2011.12.050 [DOI] [PMC free article] [PubMed] [Google Scholar]
- Venugopal S., Martinez-Arguelles D.B., Chebbi S., Hullin-Matsuda F., Kobayashi T., and Papadopoulos V.. 2016. Plasma Membrane Origin of the Steroidogenic Pool of Cholesterol Used in Hormone-induced Acute Steroid Formation in Leydig Cells. J. Biol. Chem. 291:26109–26125. 10.1074/jbc.M116.740928 [DOI] [PMC free article] [PubMed] [Google Scholar]
- Wu J., Lewis A.H., and Grandl J.. 2017a Touch, Tension, and Transduction - The Function and Regulation of Piezo Ion Channels. Trends Biochem. Sci. 42:57–71. 10.1016/j.tibs.2016.09.004 [DOI] [PMC free article] [PubMed] [Google Scholar]
- Wu J., Young M., Lewis A.H., Martfeld A.N., Kalmeta B., and Grandl J.. 2017b Inactivation of Mechanically Activated Piezo1 Ion Channels Is Determined by the C-Terminal Extracellular Domain and the Inner Pore Helix. Cell Rep. 21:2357–2366. 10.1016/j.celrep.2017.10.120 [DOI] [PMC free article] [PubMed] [Google Scholar]
- Zarychanski R., Schulz V.P., Houston B.L., Maksimova Y., Houston D.S., Smith B., Rinehart J., and Gallagher P.G.. 2012. Mutations in the mechanotransduction protein PIEZO1 are associated with hereditary xerocytosis. Blood. 120:1908–1915. 10.1182/blood-2012-04-422253 [DOI] [PMC free article] [PubMed] [Google Scholar]
- Zhang X., Hurng J., Rateri D.L., Daugherty A., Schmid-Schönbein G.W., and Shin H.Y.. 2011. Membrane cholesterol modulates the fluid shear stress response of polymorphonuclear leukocytes via its effects on membrane fluidity. Am. J. Physiol. Cell Physiol. 301:C451–C460. 10.1152/ajpcell.00458.2010 [DOI] [PMC free article] [PubMed] [Google Scholar]
- Zhao Q., Zhou H., Chi S., Wang Y., Wang J., Geng J., Wu K., Liu W., Zhang T., Dong M.-Q., et al. 2018. Structure and mechanogating mechanism of the Piezo1 channel. Nature. 554:487–492. 10.1038/nature25743 [DOI] [PubMed] [Google Scholar]
- Zheng W., Gracheva E.O., and Bagriantsev S.N.. 2019. A hydrophobic gate in the inner pore helix is the major determinant of inactivation in mechanosensitive Piezo channels. eLife. 8 e44003 10.7554/eLife.44003 [DOI] [PMC free article] [PubMed] [Google Scholar]
- Zidovetzki R., and Levitan I.. 2007. Use of cyclodextrins to manipulate plasma membrane cholesterol content: evidence, misconceptions and control strategies. Biochim. Biophys. Acta. 1768:1311–1324. 10.1016/j.bbamem.2007.03.026 [DOI] [PMC free article] [PubMed] [Google Scholar]


