Insulin receptor deletion in T regs improves metabolic outcomes in models of diet- and age-induced obesity and hyperinsulinemia. Direct effects of hyperinsulinemia on T regs is a previously unknown mechanism controlling T reg function in metabolic syndrome.
Abstract
Adipose tissue (AT) regulatory T cells (T regs) control inflammation and metabolism. Diet-induced obesity causes hyperinsulinemia and diminishes visceral AT (VAT) T reg number and function, but whether these two phenomena were mechanistically linked was unknown. Using a T reg–specific insulin receptor (Insr) deletion model, we found that diet-induced T reg dysfunction is driven by T reg–intrinsic insulin signaling. Compared with Foxp3cre mice, after 13 wk of high-fat diet, Foxp3creInsrfl/fl mice exhibited improved glucose tolerance and insulin sensitivity, effects associated with lower AT inflammation and increased numbers of ST2+ T regs in brown AT, but not VAT. Similarly, Foxp3creInsrfl/fl mice were protected from the metabolic effects of aging, but surprisingly had reduced VAT T regs and increased VAT inflammation compared with Foxp3cre mice. Thus, in both diet- and aging-associated hyperinsulinemia, excessive Insr signaling in T regs leads to undesirable metabolic outcomes. Ablation of Insr signaling in T regs represents a novel approach to mitigate the detrimental effects of hyperinsulinemia on immunoregulation of metabolic syndrome.
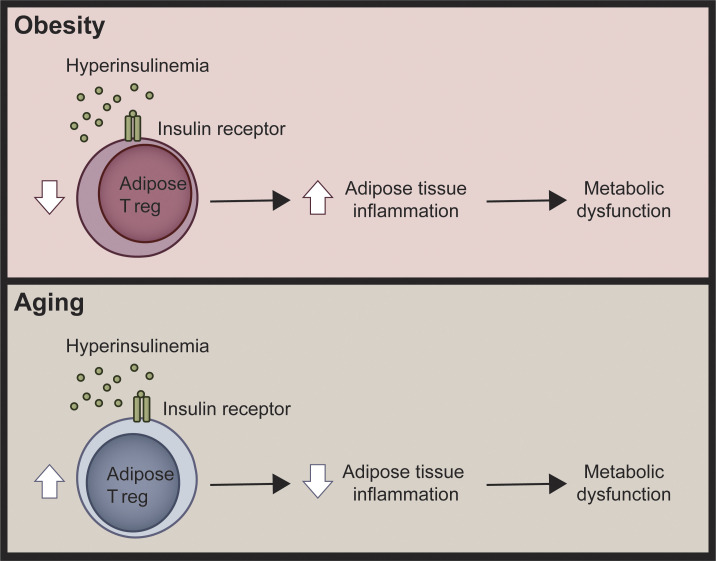
Graphical Abstract
Introduction
Obesity-associated adipose tissue (AT) inflammation is thought to promote insulin resistance and contribute to the development of type 2 diabetes (T2D; Donath, 2014). In lean mice, visceral AT (VAT) primarily contains type 2 immune cells, including regulatory T cells (T regs) and M2-like macrophages; these are reduced in diet-induced obesity with a parallel accumulation of proinflammatory cells, such as M1-like macrophages. Elevated production of cytokines such as TNF-α, IL-6, and IFN-γ in obese, inflamed AT is thought to directly contribute to insulin resistance and, ultimately, the development of T2D (Becker et al., 2017; Wu et al., 2016). In brown AT (BAT), type 2 immune cells also have a key homeostatic role, responding to cold by promoting expression of thermogenic genes such as UCP1 to enhance energy expenditure and prevent obesity (Brestoff et al., 2015; Nguyen et al., 2011; Qiu et al., 2014). Maintaining a healthy immune composition in both VAT and BAT is important for metabolic homeostasis.
AT-resident CD4+Foxp3+ T regs (hereafter T regs) control local immune homeostasis and systemic metabolism (Panduro et al., 2016). In lean mice, VAT T regs exhibit a distinct Th2-like phenotype, with elevated expression of PPARγ, IL-10, and ST2 (IL-33R; Cipolletta et al., 2012, 2015; Feuerer et al., 2009; Han et al., 2014; Vasanthakumar et al., 2015). In BAT, T reg numbers positively correlate with thermogenesis and energy expenditure, particularly upon cold stimulation (Kälin et al., 2017; Medrikova et al., 2015). In both mice (Cipolletta et al., 2015; Han et al., 2014; Vasanthakumar et al., 2015) and humans (Wu et al., 2019), obese AT contains reduced proportions of VAT T regs, and therapies that reverse obesity-associated VAT T reg loss improve systemic insulin sensitivity (Feuerer et al., 2009; Han et al., 2015; Vasanthakumar et al., 2015). In contrast to the apparently beneficial effects of VAT T regs in diet-induced obesity, VAT T regs are deleterious in a model of age-associated insulin resistance, and their depletion leads to improved insulin sensitivity (Bapat et al., 2015).
We previously reported that insulin reduced IL-10 production from mouse T regs in an Akt-mTOR–dependent manner, resulting in impaired suppression of inflammatory cytokine production by myeloid cells (Han et al., 2014). Investigation into the role of the insulin receptor (Insr) in conventional CD4+ T cells (T convs) revealed that insulin signaling promoted their inflammatory function in vivo (Fischer et al., 2017; Tsai et al., 2018). How insulin signaling affected T regs in vivo in the context of normal or elevated levels of insulin, however, remained unknown. Here, we investigated how insulin controls the function and phenotype of AT T regs in two physiologically relevant models of hyperinsulinemia and insulin resistance.
Results and discussion
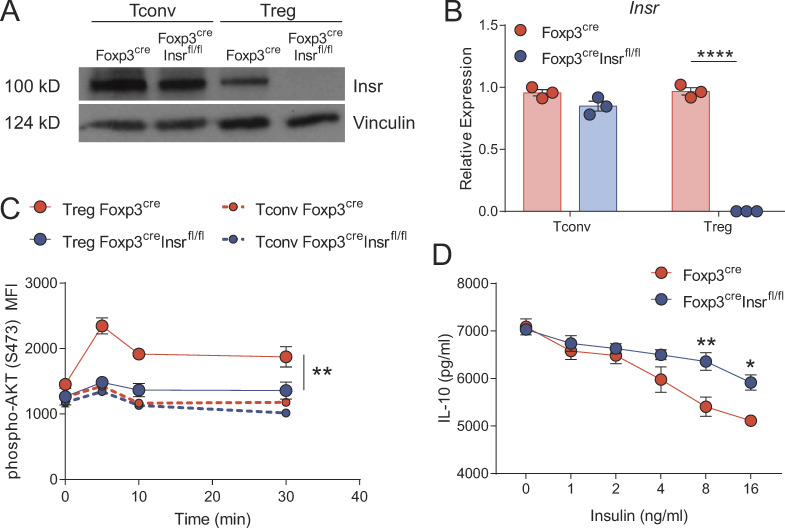
To investigate the role of insulin signaling in T regs in vivo, we crossed Foxp3YFP-cre mice to Insrfl/fl mice, using Foxp3YFP-creInsrwt/wt mice (hereafter Foxp3cre mice) as controls. Western blot and mRNA analysis confirmed T reg–specific deletion of the Insr, with no significant reduction in protein or mRNA expression in T convs (Fig. 1, A and B). We verified specific impairment of insulin signaling in Foxp3+ T regs from Foxp3creInsrfl/fl mice by measuring ex vivo insulin-stimulated Akt phosphorylation at Ser473. Consistent with our previous work (Han et al., 2014), in Foxp3cre mice, the amount of insulin-induced Akt phosphorylation was significantly higher in T regs than in T convs, an effect that was specifically abrogated in T regs from Foxp3creInsrfl/fl mice (Fig. 1 C). Thus, Insr−/− T regs fail to respond to higher-than-physiological levels of insulin, and although high levels of insulin have been reported to signal via the insulin-like growth factor receptor (Varewijck and Janssen, 2012), at least judged by Akt phosphorylation, this did not appear to contribute significantly to the T reg response to insulin. Furthermore, anti-CD3/CD28 stimulated WT but not Insr−/− T regs produced less IL-10 in response to insulin (Fig. 1 D), confirming the inhibitory effect of insulin on a key T reg suppressive mechanism.
Figure 1.
T reg–specific Insr deletion in Foxp3creInsrfl/fl mice. (A and B) Sorted splenic T regs and T convs from Foxp3cre and Foxp3creInsrfl/fl mice were stimulated with anti-CD3/CD28 beads for 3 d, and cell lysates were analyzed for Insr protein by immunoblot (A) and mRNA expression by quantitative PCR (B). (C) Ser473-phosphorylated Akt by flow cytometry in sorted splenic T regs or T convs stimulated with insulin (10 µg/ml) for the indicated time. (D) IL-10 secretion from sorted splenic T regs stimulated with anti-CD3/28 beads and without or with increasing amounts of insulin for 5 d. Significance was determined by one-way ANOVA with Tukey’s test (B), two-way repeated-measures ANOVA with Tukey’s test (C), or two-way ANOVA with Bonferroni’s test (D). Data shown as mean ± SEM; n = 3 per group from three independent experiments. *, P < 0.05; **, P < 0.01; ****, P < 0.0001.
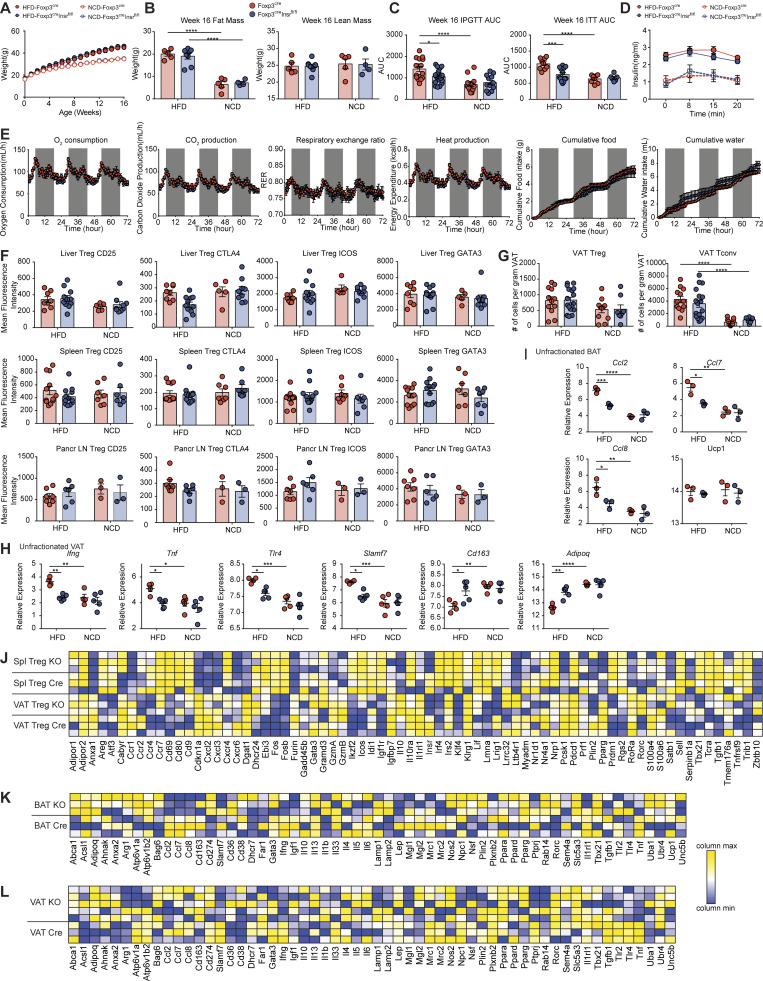
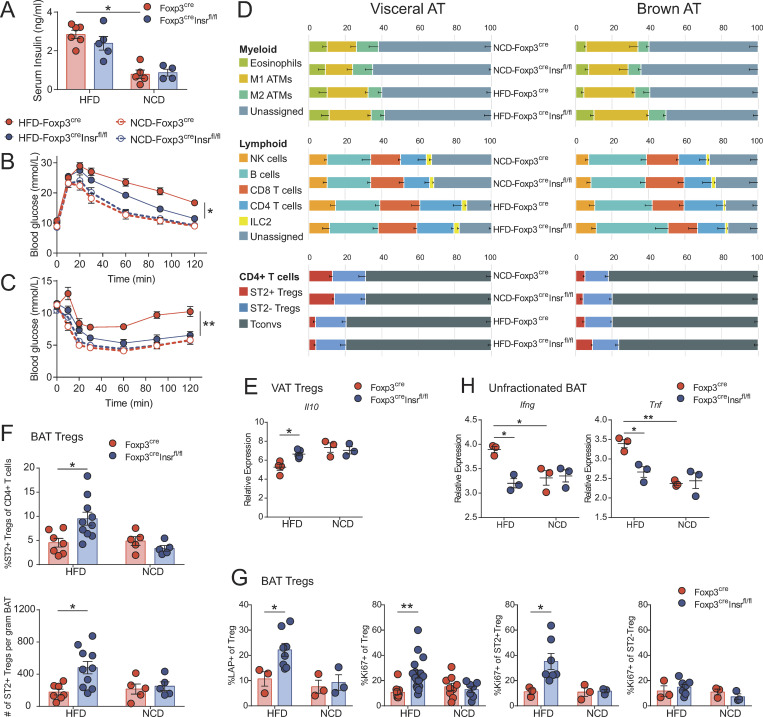
To explore the role of insulin signaling in T regs in the context of diet-induced obesity and hyperinsulinemia, 3-wk-old male Foxp3cre and Foxp3creInsrfl/fl mice were fed a high-fat diet (HFD) or normal chow diet (NCD) for 13 wk. All HFD mice became obese, with no difference in body weight or fat versus lean mass body composition between Foxp3cre and Foxp3creInsrfl/fl mice (Fig. S1, A and B). Regardless of genotype, all HFD mice developed hyperinsulinemia, suggesting that T reg–specific Insr deletion did not affect systemic insulin levels (Fig. 2 A). Whereas HFD Foxp3cre mice developed glucose intolerance and insulin resistance, HFD Foxp3creInsrfl/fl mice exhibited significantly improved glucose and insulin tolerance test (GTT and ITT, respectively) results (Fig. 2, B and C; and Fig. S1 C).
Figure S1.
Additional characteristics of the high-fat-diet cohort. Male Foxp3cre and Foxp3creInsrfl/fl mice were fed HFD or NCD for 13 wk from 3 wk of age. (A) Weight (n = 10 per group). (B) Fat and lean mass measured by EchoMRI at week 16 (n = 4–8 per group). (C) Area under the curve (AUC) of glucose and ITTs at week 16 (n = 5–20 per group). (D) Insulin secretion following glucose injection in GTT at week 16 (n = 5–8 per group). (E) After 13 wk of HFD, mice were singly housed in metabolic cages designed to mimic home-cage environment for 3 d consecutively. Oxygen consumption, carbon dioxide production, heat production, and cumulative food and water intake were measured (n = 8 per group). (F) Mean fluorescence intensity of CD25, CTLA4, ICOS, and GATA3 on T regs isolated from liver, spleen, and pancreatic lymph nodes at week 16 (n = 3–12 per group). (G) Absolute number of T regs and T convs in the VAT at week 16 (n = 7–18 per group). (H–L) Gene expression assays measured by nanoString nCounter (n = 3–5 per group). Selected inflammatory transcripts in unfractionated VAT (H) and unfractionated BAT (I). For HFD mice, heatmap of relative transcript levels in sorted splenic and VAT T regs (J), unfractionated BAT (K), and unfractionated VAT (L) are shown. KO, knockout. Significance was determined by one-way ANOVA with Tukey’s test. Data shown as mean ± SEM from two independent experiments. *, P < 0.05; **, P < 0.01; ***, P < 0.01; ****, P < 0.0001.
Figure 2.
Foxp3creInsrfl/fl mice are protected from diet-induced metabolic syndrome. Male Foxp3cre and Foxp3creInsrfl/fl mice were fed HFD or NCD for 13 wk from 3 wk of age. Metabolic parameters were measured in 16-wk-old mice. (A) Fasting serum insulin levels (n = 4–5 per group). (B and C) GTTs (B) and ITTs (C; n = 5–20 per group). (D) Flow cytometric immune profiling of VAT and BAT; gating shown in Fig. S2. ATMs, adipose tissue macrophages. Numbers are the means of n = 5–10 per group. Populations with significant difference (P < 0.05) between NCD-Foxp3cre and HFD-Foxp3cre mice in VAT: M1 ATMs, CD4 T cells, T regs, and ST2+ T regs. Populations with significant difference (P < 0.05) between HFD-Foxp3cre and HFD-Foxp3creInsrfl/fl mice in BAT: eosinophils, T regs, and ST2+ T regs. (E and H) Gene expression by nanoString in sorted VAT T regs (E) or unfractionated BAT (H; n = 3 per group, pooled from two independent cohorts). (F and G) Proportion, absolute number (F), and phenotype (G) of T regs within CD4+ T cells in BAT (n = 3–10 per group). Significance was determined by Kruskal-Wallis test with Dunn’s test (A, E, and H), two-way repeated-measures ANOVA with Tukey’s test (B and C), or one-way ANOVA with Tukey’s test (D, F, and G). Data shown as mean ± SEM from two independent experiments. *, P < 0.05; **, P < 0.01.
We detected no difference in plasma insulin between HFD Foxp3cre and Foxp3creInsrfl/fl mice during the first 20 min of the GTT, suggesting that the difference in GTT was not due to differential glucose-stimulated insulin production (Fig. S1 D). Additionally, a subset of HFD Foxp3cre and Foxp3creInsrfl/fl mice were placed in metabolic cages to measure oxygen consumption, carbon dioxide production, heat production, and cumulative food and water intake. These data revealed no difference between genotypes, indicating that differences in GTT were not due to a shift in oxidative substrate preference, increased heat production, or altered food/water intake (Fig. S1 E).
To examine the possibility that these metabolic improvements were due to changes in immune modulation, we examined the immune composition of spleen and key metabolic tissues. Among HFD mice, no major immune cell compositional changes were observed in spleen, pancreatic lymph nodes, or liver (not depicted), and T regs from these tissues expressed similar levels of CD25, CTLA4, ICOS, and GATA3 (Fig. S1 F and Fig. S2). Surprisingly, there was also no change in VAT immune cell composition, including ST2+ T reg proportions and numbers (Fig. 2 D and Fig. S1 G). However, VAT from HFD Foxp3creInsrfl/fl mice expressed significantly lower levels of a variety of inflammatory genes (Fig. S1, H and L), and consistent with our in vitro findings in Fig. 1 D, VAT T regs from HFD Foxp3cre mice exhibited reduced expression of Il10 compared with cells from Foxp3creInsrfl/fl (Fig. 2 E and Fig. S1 J).
Figure S2.
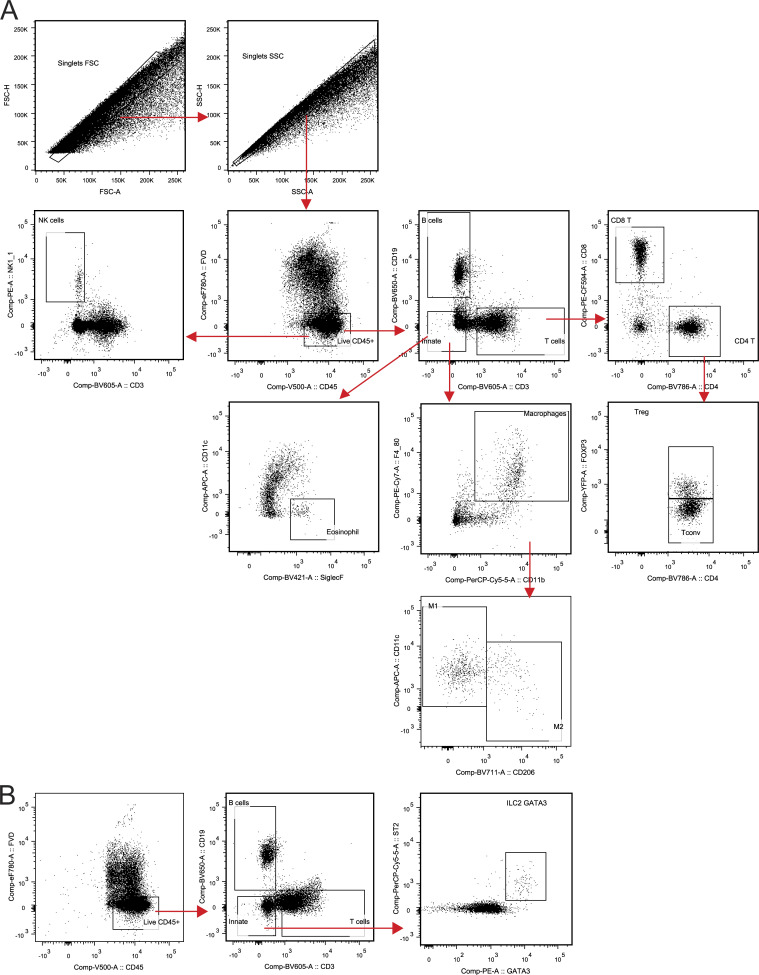
Gating strategy for immune profiling of BAT and VAT using flow cytometry. (A) Gating strategy used for eosinophils, macrophages, NK cells, B cells, CD8 T cells, and CD4 T cells. FSC, forward scatter; SSC, side scatter. (B) Gating strategy used for ILC2s.
In contrast to the minimal effect on immune cell composition in VAT, eosinophil and ST2+ T reg proportions were increased in the BAT of HFD Foxp3creInsrfl/fl mice (Fig. 2 D), with ST2+ T reg numbers and proportions in Foxp3creInsrfl/fl double those of Foxp3cre mice (Fig. 2 F). Further examination of BAT T regs revealed that Foxp3creInsrfl/fl mice exhibited higher proportions of LAP+ and Ki67+ cells specifically within the ST2+ rather than the ST2− T reg subset (Fig. 2 G). HFD also caused elevated BAT inflammatory gene expression (e.g., Ifng, Tnf, Ccl2, Ccl7, and Ccl8) in Foxp3cre mice, with a significant reduction in Foxp3creInsrfl/fl mice (Fig. 2 H and Fig. S1, I and K). BAT T regs are important for promoting thermogenic gene expression (e.g., Ucp1, Prdm16, and Cidea) after cold exposure (Kälin et al., 2017; Medrikova et al., 2015). In our mice, which were housed at room temperature, BAT Ucp1 expression was not affected by HFD, and there were no differences between Foxp3cre mice and Foxp3creInsrfl/fl mice (Fig. S1 I). Experiments with cold challenges to compare the expression of BAT thermogenic genes between Foxp3cre mice and Foxp3creInsrfl/fl mice will be an interesting future direction. Overall, these results show that T regs are directly affected by diet-induced hyperinsulinemia in vivo and that the negative effects of insulin on T regs were manifested in BAT as well as VAT.
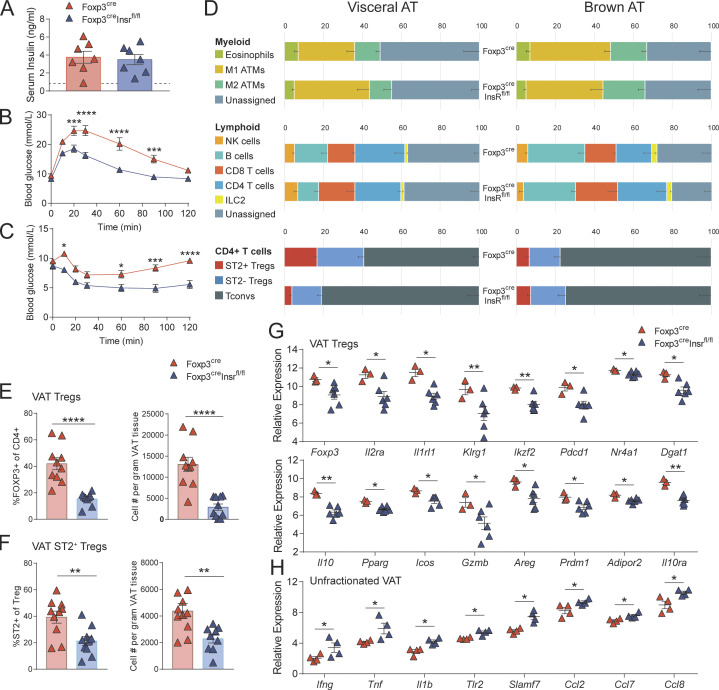
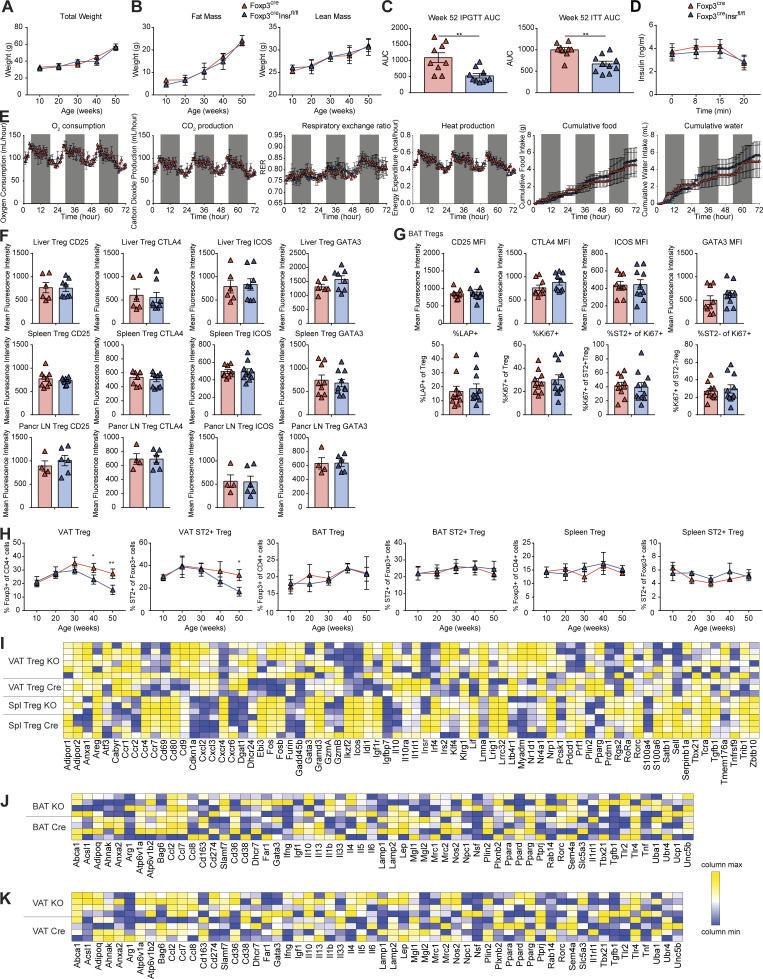
In contrast to their role in diet-induced obesity, VAT T regs are deleterious in age-associated insulin resistance (Bapat et al., 2015), so we next investigated the consequences of insulin signaling in T regs in mice with age-associated insulin resistance and hyperinsulinemia. NCD Foxp3cre and Foxp3creInsrfl/fl mice were aged to 52 wk, and all developed hyperinsulinemia (Fig. 3 A). Although no differences in weight or fat versus lean mass body composition were observed (Fig. S3, A and B), Foxp3creInsrfl/fl mice exhibited significantly improved glucose tolerance and insulin sensitivity (Fig. 3, B and C; and Fig. S3 C). As with HFD mice, these improved metabolic parameters were unrelated to changes in glucose-stimulated insulin production, oxidative substrate preference, heat production, or food/water intake (Fig. S3, D and E). There were also no major differences in immune composition in spleen, pancreatic lymph nodes, or liver (not depicted), and T regs from these tissues expressed similar proportions of T reg–associated markers (Fig. S3 F).
Figure 3.
Foxp3creInsrfl/fl mice are protected from age-associated metabolic syndrome. Male Foxp3cre and Foxp3creInsrfl/fl mice were fed NCD, and metabolic parameters were measured in 52–60-wk-old mice. (A) Fasting serum insulin levels. Dashed line represents mean serum insulin levels of healthy, young (16-wk-old) mice (n = 7 per group). (B and C) GTTs (B) and ITTs (C). (D) Flow cytometric immune profiling of VAT and BAT; gating shown in Fig. S2. ATMs, adipose tissue macrophages. Numbers are the mean of n = 10 per group. Significant difference (P < 0.01) between Foxp3cre and Foxp3creInsrfl/fl mice in VAT: T regs and ST2+ T regs. (E and F) Proportion and absolute numbers in VAT of T regs within CD4+ T cells (E) and ST2+ cells within T regs (F). (G and H) Gene expression by nanoString in sorted VAT T regs (G) or unfractionated VAT (H; n = 3–6 per group). Significance was determined by Student’s t test (A and D–F), Mann–Whitney U test (G and H), or two-way repeated-measures ANOVA with Bonferroni’s test (B and C). Data shown as mean ± SEM; for B–F, n = 10 per group from two independent experiments. *, P < 0.05; **, P < 0.01; ***, P < 0.001; ****, P < 0.0001.
Figure S3.
Additional characteristics of the aging cohort. Male Foxp3cre and Foxp3creInsrfl/fl mice were fed NCD for 52 wk. (A) Weight (n = 3–6 per group). (B) Fat and lean mass measured by EchoMRI (n = 3–6 per group). (C) Area under the curve (AUC) of GTTs and ITTs at week 52 (n = 10 per group). (D) Insulin secretion following glucose injection in GTT at week 52 (n = 4–8 per group). (E) After 52 wk of chow diet, mice were singly housed in metabolic cages designed to mimic home-cage environment for 3 d consecutively. Oxygen consumption, carbon dioxide production, heat production, and cumulative food and water intake were measured (n = 3–4 per group). (F) Mean fluorescence intensity of CD25, CTLA4, ICOS, and GATA3 on T regs isolated from liver, spleen, and pancreatic lymph nodes at week 52 (n = 3–10 per group). (G) Characteristics of BAT T regs at week 52 determined by flow cytometry (n = 9–12 per group). (H) Proportions of T regs and ST2+ T regs in VAT, BAT, and spleens of mice at various ages (n = 4–8 per group). (I–K) Gene expression assays measured by nanoString nCounter (n = 3–6 per group). Heatmap of relative transcript levels in sorted splenic and VAT T regs (I), unfractionated BAT (J), and unfractionated VAT (K) are shown. KO, knockout. Significance was determined by Student’s t test (C) and two-way ANOVA with Bonferroni’s test (H). Data shown as mean ± SEM from two independent experiments. *, P < 0.05; **, P < 0.01.
In contrast to HFD mice, aged Foxp3creInsrfl/fl mice exhibited a significantly altered immune composition in VAT but not in BAT (Fig. 3 D). Consistent with the negative role of VAT T regs in the context of aging (Bapat et al., 2015), Foxp3creInsrfl/fl mice had significantly reduced VAT T reg proportions and numbers, including both ST2+ and ST2− cells, compared with Foxp3cre mice (Fig. 3, E and F). In contrast, aged BAT T regs were not affected by Insr deletion (Fig. S3 G). This loss of T regs in Foxp3creInsrfl/fl mice occurred gradually over time and was observed specifically in VAT (Fig. S3 H). Additionally, compared with those in aged Foxp3cre mice, VAT T regs in aged Foxp3creInsrfl/fl mice exhibited reduced expression of transcripts associated with T reg function (Foxp3, Il2ra, Pdcd1, Il10, Icos, Gzmb, Il10ra, and Ikzf2) as well as with a previously identified VAT T reg–specific signature (Il1rl1, Klrg1, Dgat1, Pparg, Areg, Prdm1, Nr4a1, and Adipor2; Cipolletta et al., 2015; Fig. 3 G and Fig. S3 I). A caveat of these data is that we did not interrogate mRNA expression of ST2+ and ST2− T regs separately, so the altered proportions of these subsets in this model could contribute to observed differences.
Consistent with this apparent reduced T reg function, total VAT from Foxp3creInsrfl/fl mice exhibited increased inflammatory gene expression, including Ifng, Tnf, Il1b, Tlr2, Slamf7, Ccl2, Ccl7, and Ccl8 (Fig. 3 H and Fig. S3 K). No significant changes in transcript levels were detected in BAT (Fig. S3 J). Thus, consistent with a previous report (Bapat et al., 2015), aging-related insulin resistance is exacerbated by increased numbers of VAT T regs, and mechanistically this expansion is at least partially driven by T reg–intrinsic Insr signaling.
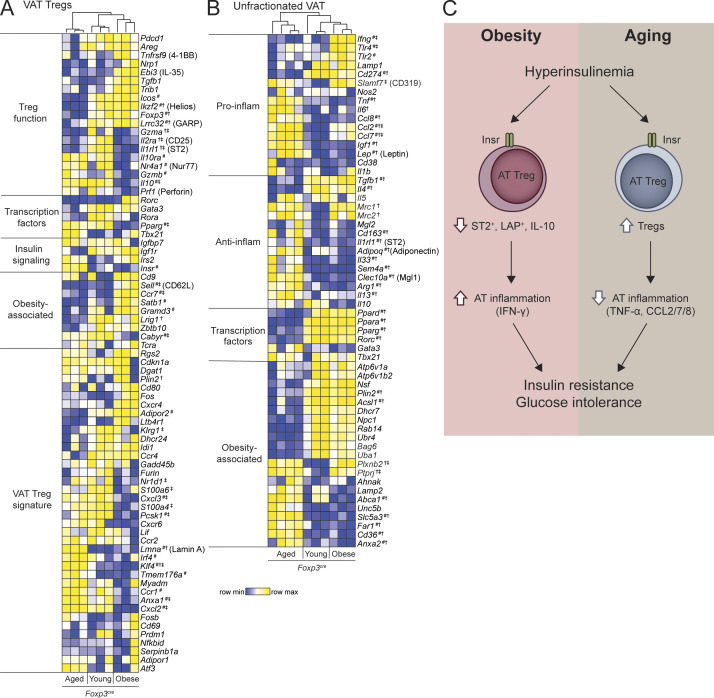
To ask why AT T regs were beneficial for diet-induced but detrimental for aging-associated metabolic syndrome, we examined gene expression of VAT Foxp3cre T regs from young (16-wk-old) lean, obese (13-wk HFD), and aged (52-wk-old) mice. Hierarchical clustering of VAT T reg signature genes revealed striking differences (Fig. 4 A). Consistent with previous reports (Cipolletta et al., 2015), compared with those of young lean mice, VAT T regs from obese mice lost expression of signature genes required for VAT adaptation, including Il2ra, Il1rl1, Il10, and Pparg but retained expression of core T reg genes (Foxp3 and Ikzf2) and T reg functional genes (Areg, Pdcd1, Tbfb1, and Lrrc32). In contrast, in aging, VAT T regs had diminished expression of both core (Foxp3 and Ikzf2) and functional (Lrrc32, Il2ra, and Il1rl1) T reg–associated genes (Fig. 4 A), indicating that distinct pathways underlie T reg dysfunction in these two contexts.
Figure 4.
T reg and VAT gene signatures differ in age-associated and diet-induced metabolic syndrome. (A and B) Unsupervised hierarchical clustering of gene expression determined by nanoString of sorted VAT T regs (A) or unfractionated VAT (B) from young (16-wk-old), obese (13-wk HFD), and aged (52-wk-old) Foxp3cre mice. Each column represents one animal. Additionally, statistical comparisons of single gene expression were performed using Kruskal–Wallis test with Dunn’s test; #, P < 0.05 between aged and obese groups; †, P < 0.05 between young and aged groups; ‡, P < 0.05 between young and obese groups. Data from two independent cohorts. (C) Schematic diagram summarizing the differential role of insulin signaling in AT T regs in diet-induced and age-associated metabolic syndrome.
How aging changes VAT T regs is an underexplored area of research. We found changes in expression of several genes that could be deleterious to T reg function. For example, high expression of Lamin A (encoded by Lmna) could augment Th1 differentiation and diminish T reg differentiation and suppressive function (Toribio-Fernández et al., 2018, 2019). We also found high expression of Irf4 and reduced expression of Ikzf2 in VAT T regs from aged mice. Although IRF4 plays a critical role in VAT T reg differentiation and adaptation in young mice (Vasanthakumar et al., 2015), it can also repress PD-1, Helios, CD73, and other molecules associated with T reg function (Wu et al., 2017), potentially explaining lower Ikzf2 expression. Notably, levels of Il10 in aged VAT T regs were equal to those in young, lean mice. This differential effect of diet versus age on VAT–T reg Il10 expression could be related to Pcsk1 expression, a proprotein convertase 1 that cleaves mouse Foxp3 and enhances Il10 expression (de Zoeten et al., 2009), which is only reduced in VAT T regs from obese, but not aged, mice. Gene expression in unfractionated VAT of Foxp3cre mice corroborated the disparate features of obesity versus age-associated metabolic syndrome (Fig. 4 B). Elevated transcript expression of Ifng, Tlr2, and Tlr4 was found in obese VAT, whereas aged VAT exhibited increased Tnf, Il6, Ccl2, Ccl7, Ccl8, Lep, and Igf1 (Fig. 4 B).
It is well established that VAT T regs play a key role in controlling diet-induced metabolic syndrome (Panduro et al., 2016), but the environmental cues driving loss of their cellular phenotype remained unknown. Here we found that diet-induced hyperinsulinemia drove AT T reg dysfunction by reducing expression of IL-10 and restraining expansion of ST2+ cells. Combined with our previous finding that insulin diminishes IL-10 production by T regs in an Akt/mTOR-dependent manner (Han et al., 2014), and the well-known ability of pharmacological inhibition of Akt or mTOR signaling to promote T reg expansion and function (Crellin et al., 2007; Huynh et al., 2015; Stallone et al., 2016), our data suggest that persistent insulin-mediated T reg stimulation likely compromised their function in vivo. The specific role of IL-10 in obesity remains controversial: two studies reported that Il10−/− mice fed HFD had no change in insulin sensitivity (Clementi et al., 2009; den Boer et al., 2006), whereas a recent study reported reduced adiposity and improved insulin sensitivity (Rajbhandari et al., 2018). However, given that multiple cell types produce and respond to IL-10, it is difficult to make direct comparisons between our T reg–focused study and systemic knockout studies.
In contrast to the well-characterized role of AT T regs in obesity, their role in age-associated metabolic syndrome has been largely unexplored. Age-associated insulin resistance is associated with excess VAT, since reduction of VAT mass through surgical means (Gabriely et al., 2002) or caloric restriction (Barzilai et al., 1998) improves metabolic parameters. T regs accumulate in VAT with age (Bapat et al., 2015; Cipolletta et al., 2015) but were paradoxically reported to be detrimental (Bapat et al., 2015). We confirmed and extended this observation by showing that their expansion is controlled by Insr signaling. In contrast to young, HFD mice, VAT T regs in aged Foxp3creInsrfl/fl mice had reduced expression of many T reg–associated genes, including Il10, leading us to conclude that the mechanisms of immune dysregulation are distinct in these two contexts. Indeed, our findings suggest that at least some aspects of inflammation may be favorable in aging, since T reg–specific Insr deletion dampened T reg expansion and augmented VAT inflammation, and yet ameliorated glucose intolerance and insulin resistance. This possibility is in accordance with the previous finding that depletion of aged VAT T regs led to improved metabolism, elevated TNF-α–driven VAT inflammation, and increased VAT remodeling (Bapat et al., 2015). While AT inflammation is often perceived as negatively contributing to metabolic dysfunction, it is important to note that this is also a physiological process that can occur during adipogenesis, in which healthy adipocytes recruit macrophages and express extra cellular matrix proteases to facilitate AT remodeling (Lee et al., 2013; Wernstedt Asterholm et al., 2014).
Regulation of T reg function by receptor tyrosine kinase signaling is a relatively uncharted field. Insulin was previously reported to promote T conv effector function in vitro and in viral clearance (Fischer et al., 2017; Tsai et al., 2018). Our data show that insulin also directly affects T regs in the context of hyperinsulinemia. Few other receptor tyrosine kinases have been explored in the context of T reg function: in cancer, amphiregulin augmented the function of EGFR-expressing T regs (Wang et al., 2016; Zaiss et al., 2013), while VEGF stimulation promoted VEGFR+ T reg proliferation (Terme et al., 2013). Further exploration into how receptor tyrosine kinases modulate T reg function represents a new avenue of research.
In conclusion, our data provide the first mechanistic evidence for how metabolic syndromes can cause T reg dysfunction (Fig. 4 C). Hyperinsulinemia has been proposed to have a causal role in the development of T2D (Carey et al., 2014; Mehran et al., 2012) since in humans, prevention of hyperinsulinemia induces weight loss (Alemzadeh et al., 1998; Lustig et al., 2006), and in mice, insulin reduction prevents both diet-induced and age-associated insulin resistance (Mehran et al., 2012; Templeman et al., 2015, 2017). Our study further bolsters this hypothesis and shows that some of the effects of hyperinsulinemia are mediated via altered AT T reg expansion and function and consequent changes in AT inflammation. A limitation of our study is that although we studied T regs from a number of tissues, we did not exhaustively examine T regs from every compartment, such as the intestine or the subcutaneous or inguinal AT, and thus insulin-mediated effects on T regs in other tissues could contribute to the overall metabolic phenotypes. Overall, our findings suggest that preventing the deleterious effects of Insr signaling in T regs may be a previously unknown approach to limit the pathological effects of hyperinsulinemia.
Materials and methods
Study approval
Animals were housed in the animal facility of BC Children’s Hospital Research Institute, and protocols were approved by the University of British Columbia Animal Care Committee (A18-0169).
Experimental animals and diet
All animal protocols were approved by the University of British Columbia Animal Care Committee. Foxp3YFP-Cre mice (Jackson Laboratory, 016959) and Insrfl/fl mice (Jackson Laboratory, 006955), both on a C57/Bl6 background, were crossed to generate Foxp3YFP-CreInsrwt/wt mice (control) and Foxp3YFP-creInsrfl/fl mice (T reg–Insr-knockout). Recently, we and others reported that the widely used Foxp3YFP-Cre mice displayed ectopic Cre recombination outside of the T reg population (Bittner-Eddy et al., 2019; Franckaert et al., 2015; Wu et al., 2020; Xie et al., 2019). To generate a sufficient number of animals while maintaining a matched genetic background, we used F4-generation mice obtained by breeding F3 littermates to each other, as described in Fig. 6 of Wu et al. (2020). To genotype F4-generation mice and select those with confirmed T reg–specific Insr deletion (<5% ectopic recombination detected in ear notch DNA), quantitative PCR was performed as described (Wu et al., 2020), with ear notch DNA using three sets of primers, each specifically amplifying only one allele: WT (5′-ACAAACTTTATAGGACTAGTGAGGT-3′, 5′-ACCACCATGTCCACCTTTCCC-3′), floxed (5′-GCTTGGCTGGACGTAAACTCCT-3′, 5′-ACCACCATGTCCACCTTTCCCA-3′), or recombined (5′-ACCGTGCCTAGAGACTCCAAGAC-3′, 5′-CTGAATAGCTGAGACCACAG-3′). WT Ccr5 (5′-CAGGCAACAGAGACTCTTGG-3′, 5′-TCATGTTCTCCTGTGGATCG-3′) and Il10rb (5′-ATGATTCCACCCCCTGAGA-3′, 5′-GAGCTGTGAAAGTCAGGTTCG-3′) were used as gDNA housekeeping genes. For HFD studies, 3-wk-old male mice were fed a high-fat/high-sucrose diet (HFD, 58 kcal% fat and sucrose, Research Diet, D12331) or NCD (Lab Diet, 5P76) for 13 wk. For aging studies, male mice were aged to 52 wk on NCD. Each study included two independent cohorts.
ITTs and GTTs
After 13 wk of diet, for i.p. GTT (IPGTT), the animals were fasted for 6 h and blood glucose was measured (time 0). Mice were then injected i.p. with 1.4 g/kg glucose (Sigma-Aldrich, G7021), followed by blood glucose measurements at 10, 20, 30, 60, 90, and 120 min. For ITT, mice were fasted for 4 h, followed by basal blood glucose (time 0) measurement. Mice were then injected i.p. with 1.25 U/kg insulin (Novolin, GE Toronto), followed by blood glucose measurements at 10, 20, 30, 60, 90, and 120 min. Blood was sampled from mouse tails, and blood glucose levels were assessed using a OneTouch Ultra Glucometer (Johnson & Johnson).
Measurement of metabolic parameters
Following HFD for 13 wk or NCD for 52 wk, a subset of mice was singly housed in metabolic cages designed to mimic home-cage environment (LabMaster TSE Systems) for 3 d consecutively. O2 consumption and CO2 production were measured via an open circuit indirect calorimetry system, with sensors sampling air from each cage once every 15 min to obtain individual measurements of respiratory function and food and water intake. Metabolic activity (respiratory exchange ratio) was calculated from the ratio of VCO2 (ml/h) produced to VO2 (ml/h) consumed throughout the day for each mouse. Food/water intakes were monitored every 15 min through weight sensors directly associated with food/water dispensers. Mice were allowed 2 d to acclimatize to the metabolic cage conditions.
Body composition analysis
Animal body composition was measured in conscious animals using quantitative magnetic resonance technology, which distinguishes differential proton states between lipids, lean tissues, and free water (EchoMRI-100, Echo Medical Systems).
Insulin ELISA
Blood was drawn from the saphenous vein of mice fasted for 4 h. Heparinized blood was centrifuged at 2,000 g for 15 min at 4°C to separate plasma. Insulin was quantified using STELLUX Chemiluminescent Immunoassays (ALPCO, 80-INSMR-CH01).
AT processing
Scapular BAT and epididymal VAT were harvested as described (Mann et al., 2014). BAT and VAT from each animal were minced and digested in 0.5 mg/ml collagenase II (Worthington Biochemical, LS004176) at 37°C for 45 min, passed through a 100-µm cell strainer, and centrifuged to obtain stromal vascular fraction cells. The cells were resuspended in 1 ml red blood cell lysis buffer (0.8% NH4Cl, Stemcell Technologies, 07800), incubated for 5 min at room temperature, washed with FACS buffer (PBS, 0.5% BSA, and 2 mM EDTA), and stained for flow cytometry. A small portion of AT was homogenized and lysed in gentleMACS M tubes using the gentleMACS Dissociator (Miltenyi Biotec) for RNA analysis.
Flow cytometry
For phenotypic analysis, cells were acquired on an LSRFortessa X-20 (BD Biosciences) and analyzed using FlowJo v10 (TreeStar). Antibodies used are listed in Table S1, and the gating strategy is shown in Fig. S2. To estimate absolute cell number, 123count eBeads (Thermo Fisher Scientific) were used according to the manufacturer’s protocol. To isolate T regs and T convs, flow cytometric sorting was performed on a FACSAria II (BD Biosciences). T regs were sorted as CD45+CD4+Foxp3(YFP)+ cells, and T convs were sorted as CD45+CD4+Foxp3(YFP)− cells. For quantifying the relative amount of phosphorylation on Akt Ser473 after insulin treatment, total splenic CD4+ cells were rested in RPMI 1640 with no serum for 4 h (time 0) and then stimulated with 10 µg/ml insulin for ≤30 min. The cells were immediately fixed at 5, 10, and 30 min and stained using anti-Akt AF647 (pS473; BD Biosciences, 561670; clone M89-61).
Immunoblotting
FACSorted splenic T convs and T regs were stimulated with 1:1 anti-CD3/CD28 beads (Thermo Fisher Scientific, 11452D) for 3 d, and then lysed in Laemmli lysis buffer (1% SDS, 10% glycerol, and 0.1 M Tris, pH 6.8) and boiled for 10 min. The lysates were sonicated for 4 min, and the protein contents were quantified using BCA assay (Thermo Fisher Scientific, 23225). 40 µg of lysates was run on an 8% SDS gel and transferred to a polyvinylidene fluoride membrane. Insr was blotted using anti-Insrβ mAb (Cell Signaling, 3020), and vinculin was blotted using anti-vinculin mAb (New England Biolabs, 13901).
Gene expression analysis
To measure Insr mRNA using quantitative PCR, FACSorted splenic T convs and T regs were stimulated with 1:1 anti-CD3/CD28 beads (Thermo Fisher Scientific, 11452D) for 3 d. RNA was isolated using OMEGA E.Z.N.A. Total RNA Kit (Omega Bio-Tek, R6834), reverse transcribed using qScript cDNA SuperMix (Quanta Bio, 95048), and quantified by SYBR Green–based reaction using PerfeCTa SYBR Green FastMix (Quanta Bio, 95074) on a ViiA 7 Real-Time PCR System (Thermo Fisher Scientific). Data were normalized to Sdha and Rpl13a, and fold changes were calculated with the ΔΔCT method. Primers used were Insr (5′-TGTGACATCTGCCCAGGAGCT-3′, 5′-GCATAGGAGCGGCGGATCTTTAG-3′), Sdha (5′-CCTAAACATGCAGAAGTCGATGC-3′, 5′-GCCTTCTTGCAATACACTCCCC-3′), and Rpl13a (5′-CTCAAGGTTGTTCGGCTGAA-3′, 5′-CTGTCACTGCCTGGTACTTCCA-3′). Additional mRNA expression was measured using two custom nanoString nCounter code sets. 100 ng of AT RNA or 4 µl of unpurified lysate from sorted T regs was analyzed on a nCounter SPRINT Profiler (NanoString Technologies). Background subtraction, sum normalization, and log2 transformation of mRNA counts were performed. The hierarchical clustering module (public GenePattern server, Broad Institute) was used to generate heatmaps and cluster trees by pairwise average linkage according to Spearman’s correlation coefficient. The accession no. for the NanoString data in GEO is GSE151016.
IL-10 cytometric bead array
Sorted splenic T convs and T regs were stimulated with 1:1 anti-CD3/CD28 beads (Thermo Fisher Scientific, 11452D) for 5 d in the presence or the absence of insulin, and the supernatant from the last day was analyzed for IL-10 using the BD mouse inflammation kit (BD Biosciences, 552364).
Statistical analysis of experimental data
Statistical analyses were performed in GraphPad Prism 7. Comparison of gene expression between two groups was performed with the Mann–Whitney U test, and for more than two groups, one-way ANOVA with Tukey’s test was performed, with the exception of Fig. 1, C and D, in which two-way ANOVA with Tukey’s test was performed. Multiplicity-adjusted P values are reported: *, P < 0.05; **, P < 0.01; ***, P < 0.001; ****, P < 0.0001. Data are shown as mean ± SEM.
Online supplemental material
Fig. S1 shows additional characteristics of the HFD cohort. Fig. S2 shows the flow cytometric gating strategy for the immune profiling of VAT and BAT. Fig. S3 shows the additional characteristics of the aging cohort. Table S1 lists the mAbs used.
Supplementary Material
lists antibodies used for flow cytometry.
Acknowledgments
This work was supported by the Canadian Diabetes Association (grant OG-3-14-4460-ML to M.K. Levings) and the Canadian Institutes of Health Research (grants FDN-154304 to M.K. Levings and PJT-148695 to W.T. Gibson). D. Wu is supported by a Canadian Institutes of Health Research Graduate Award.
Author contributions: D. Wu conceived the study, performed experiments, analyzed data, interpreted results, and wrote the manuscript. C.K. Wong performed mouse metabolic experiments and analyzed and interpreted the data. J.M. Han conceived the study. P.C. Orban assisted in experimental design and critically reviewed the manuscript. Q. Huang and J. Gillies performed experiments. M. Mojibian performed experiments, interpreted results, and provided advice. W.T. Gibson assisted in experimental design, critically reviewed the manuscript, and secured funding. M.K. Levings conceived the study, interpreted results, wrote the manuscript and secured funding.
References
- Alemzadeh R., Langley G., Upchurch L., Smith P., and Slonim A.E.. 1998. Beneficial effect of diazoxide in obese hyperinsulinemic adults. J. Clin. Endocrinol. Metab. 83:1911–1915. [DOI] [PubMed] [Google Scholar]
- Bapat S.P., Myoung Suh J., Fang S., Liu S., Zhang Y., Cheng A., Zhou C., Liang Y., LeBlanc M., Liddle C., et al. 2015. Depletion of fat-resident Treg cells prevents age-associated insulin resistance. Nature. 528:137–141. 10.1038/nature16151 [DOI] [PMC free article] [PubMed] [Google Scholar]
- Barzilai N., Banerjee S., Hawkins M., Chen W., and Rossetti L.. 1998. Caloric restriction reverses hepatic insulin resistance in aging rats by decreasing visceral fat. J. Clin. Invest. 101:1353–1361. 10.1172/JCI485 [DOI] [PMC free article] [PubMed] [Google Scholar]
- Becker M., Levings M.K., and Daniel C.. 2017. Adipose-tissue regulatory T cells: Critical players in adipose-immune crosstalk. Eur. J. Immunol. 47:1867–1874. 10.1002/eji.201646739 [DOI] [PubMed] [Google Scholar]
- Bittner-Eddy P.D., Fischer L.A., and Costalonga M.. 2019. Cre-loxP Reporter Mouse Reveals Stochastic Activity of the Foxp3 Promoter. Front. Immunol. 10:2228 10.3389/fimmu.2019.02228 [DOI] [PMC free article] [PubMed] [Google Scholar]
- Brestoff J.R., Kim B.S., Saenz S.A., Stine R.R., Monticelli L.A., Sonnenberg G.F., Thome J.J., Farber D.L., Lutfy K., Seale P., et al. 2015. Group 2 innate lymphoid cells promote beiging of white adipose tissue and limit obesity. Nature. 519:242–246. 10.1038/nature14115 [DOI] [PMC free article] [PubMed] [Google Scholar]
- Carey A.L., Vorlander C., Reddy-Luthmoodoo M., Natoli A.K., Formosa M.F., Bertovic D.A., Anderson M.J., Duffy S.J., and Kingwell B.A.. 2014. Reduced UCP-1 content in in vitro differentiated beige/brite adipocytes derived from preadipocytes of human subcutaneous white adipose tissues in obesity. PLoS One. 9 e91997 10.1371/journal.pone.0091997 [DOI] [PMC free article] [PubMed] [Google Scholar]
- Cipolletta D., Cohen P., Spiegelman B.M., Benoist C., and Mathis D.. 2015. Appearance and disappearance of the mRNA signature characteristic of Treg cells in visceral adipose tissue: age, diet, and PPARγ effects. Proc. Natl. Acad. Sci. USA. 112:482–487. 10.1073/pnas.1423486112 [DOI] [PMC free article] [PubMed] [Google Scholar]
- Cipolletta D., Feuerer M., Li A., Kamei N., Lee J., Shoelson S.E., Benoist C., and Mathis D.. 2012. PPAR-γ is a major driver of the accumulation and phenotype of adipose tissue Treg cells. Nature. 486:549–553. 10.1038/nature11132 [DOI] [PMC free article] [PubMed] [Google Scholar]
- Clementi A.H., Gaudy A.M., van Rooijen N., Pierce R.H., and Mooney R.A.. 2009. Loss of Kupffer cells in diet-induced obesity is associated with increased hepatic steatosis, STAT3 signaling, and further decreases in insulin signaling. Biochim. Biophys. Acta. 1792:1062–1072. 10.1016/j.bbadis.2009.08.007 [DOI] [PMC free article] [PubMed] [Google Scholar]
- Crellin N.K., Garcia R.V., and Levings M.K.. 2007. Altered activation of AKT is required for the suppressive function of human CD4+CD25+ T regulatory cells. Blood. 109:2014–2022. 10.1182/blood-2006-07-035279 [DOI] [PubMed] [Google Scholar]
- de Zoeten E.F., Lee I., Wang L., Chen C., Ge G., Wells A.D., Hancock W.W., and Ozkaynak E.. 2009. Foxp3 processing by proprotein convertases and control of regulatory T cell function. J. Biol. Chem. 284:5709–5716. 10.1074/jbc.M807322200 [DOI] [PMC free article] [PubMed] [Google Scholar]
- den Boer M.A., Voshol P.J., Schröder-van der Elst J.P., Korsheninnikova E., Ouwens D.M., Kuipers F., Havekes L.M., and Romijn J.A.. 2006. Endogenous interleukin-10 protects against hepatic steatosis but does not improve insulin sensitivity during high-fat feeding in mice. Endocrinology. 147:4553–4558. 10.1210/en.2006-0417 [DOI] [PubMed] [Google Scholar]
- Donath M.Y. 2014. Targeting inflammation in the treatment of type 2 diabetes: time to start. Nat. Rev. Drug Discov. 13:465–476. 10.1038/nrd4275 [DOI] [PubMed] [Google Scholar]
- Feuerer M., Herrero L., Cipolletta D., Naaz A., Wong J., Nayer A., Lee J., Goldfine A.B., Benoist C., Shoelson S., et al. 2009. Lean, but not obese, fat is enriched for a unique population of regulatory T cells that affect metabolic parameters. Nat. Med. 15:930–939. 10.1038/nm.2002 [DOI] [PMC free article] [PubMed] [Google Scholar]
- Fischer H.J., Sie C., Schumann E., Witte A.K., Dressel R., van den Brandt J., and Reichardt H.M.. 2017. The Insulin Receptor Plays a Critical Role in T Cell Function and Adaptive Immunity. J. Immunol. 198:1910–1920. 10.4049/jimmunol.1601011 [DOI] [PubMed] [Google Scholar]
- Franckaert D., Dooley J., Roos E., Floess S., Huehn J., Luche H., Fehling H.J., Liston A., Linterman M.A., and Schlenner S.M.. 2015. Promiscuous Foxp3-cre activity reveals a differential requirement for CD28 in Foxp3+ and Foxp3− T cells. Immunol. Cell Biol. 93:417–423. 10.1038/icb.2014.108 [DOI] [PMC free article] [PubMed] [Google Scholar]
- Gabriely I., Ma X.H., Yang X.M., Atzmon G., Rajala M.W., Berg A.H., Scherer P., Rossetti L., and Barzilai N.. 2002. Removal of visceral fat prevents insulin resistance and glucose intolerance of aging: an adipokine-mediated process? Diabetes. 51:2951–2958. 10.2337/diabetes.51.10.2951 [DOI] [PubMed] [Google Scholar]
- Han J.M., Patterson S.J., Speck M., Ehses J.A., and Levings M.K.. 2014. Insulin inhibits IL-10-mediated regulatory T cell function: implications for obesity. J. Immunol. 192:623–629. 10.4049/jimmunol.1302181 [DOI] [PubMed] [Google Scholar]
- Han J.M., Wu D., Denroche H.C., Yao Y., Verchere C.B., and Levings M.K.. 2015. IL-33 Reverses an Obesity-Induced Deficit in Visceral Adipose Tissue ST2+ T Regulatory Cells and Ameliorates Adipose Tissue Inflammation and Insulin Resistance. J. Immunol. 194:4777–4783. 10.4049/jimmunol.1500020 [DOI] [PubMed] [Google Scholar]
- Huynh A., DuPage M., Priyadharshini B., Sage P.T., Quiros J., Borges C.M., Townamchai N., Gerriets V.A., Rathmell J.C., Sharpe A.H., et al. 2015. Control of PI(3) kinase in Treg cells maintains homeostasis and lineage stability. Nat. Immunol. 16:188–196. 10.1038/ni.3077 [DOI] [PMC free article] [PubMed] [Google Scholar]
- Kälin S., Becker M., Ott V.B., Serr I., Hosp F., Mollah M.M.H., Keipert S., Lamp D., Rohner-Jeanrenaud F., Flynn V.K., et al. 2017. A Stat6/Pten Axis Links Regulatory T Cells with Adipose Tissue Function. Cell Metab. 26:475–492.e7. 10.1016/j.cmet.2017.08.008 [DOI] [PMC free article] [PubMed] [Google Scholar]
- Lee Y.H., Petkova A.P., and Granneman J.G.. 2013. Identification of an adipogenic niche for adipose tissue remodeling and restoration. Cell Metab. 18:355–367. 10.1016/j.cmet.2013.08.003 [DOI] [PMC free article] [PubMed] [Google Scholar]
- Lustig R.H., Greenway F., Velasquez-Mieyer P., Heimburger D., Schumacher D., Smith D., Smith W., Soler N., Warsi G., Berg W., et al. 2006. A multicenter, randomized, double-blind, placebo-controlled, dose-finding trial of a long-acting formulation of octreotide in promoting weight loss in obese adults with insulin hypersecretion. Int. J. Obes. 30:331–341. 10.1038/sj.ijo.0803074 [DOI] [PMC free article] [PubMed] [Google Scholar]
- Mann A., Thompson A., Robbins N., and Blomkalns A.L.. 2014. Localization, identification, and excision of murine adipose depots. J. Vis. Exp. (94):52174 10.3791/52174 [DOI] [PMC free article] [PubMed] [Google Scholar]
- Medrikova D., Sijmonsma T.P., Sowodniok K., Richards D.M., Delacher M., Sticht C., Gretz N., Schafmeier T., Feuerer M., and Herzig S.. 2015. Brown adipose tissue harbors a distinct sub-population of regulatory T cells. PLoS One. 10 e0118534 10.1371/journal.pone.0118534 [DOI] [PMC free article] [PubMed] [Google Scholar]
- Mehran A.E., Templeman N.M., Brigidi G.S., Lim G.E., Chu K.Y., Hu X., Botezelli J.D., Asadi A., Hoffman B.G., Kieffer T.J., et al. 2012. Hyperinsulinemia drives diet-induced obesity independently of brain insulin production. Cell Metab. 16:723–737. 10.1016/j.cmet.2012.10.019 [DOI] [PubMed] [Google Scholar]
- Nguyen K.D., Qiu Y., Cui X., Goh Y.P., Mwangi J., David T., Mukundan L., Brombacher F., Locksley R.M., and Chawla A.. 2011. Alternatively activated macrophages produce catecholamines to sustain adaptive thermogenesis. Nature. 480:104–108. 10.1038/nature10653 [DOI] [PMC free article] [PubMed] [Google Scholar]
- Panduro M., Benoist C., and Mathis D.. 2016. Tissue Tregs. Annu. Rev. Immunol. 34:609–633. 10.1146/annurev-immunol-032712-095948 [DOI] [PMC free article] [PubMed] [Google Scholar]
- Qiu Y., Nguyen K.D., Odegaard J.I., Cui X., Tian X., Locksley R.M., Palmiter R.D., and Chawla A.. 2014. Eosinophils and type 2 cytokine signaling in macrophages orchestrate development of functional beige fat. Cell. 157:1292–1308. 10.1016/j.cell.2014.03.066 [DOI] [PMC free article] [PubMed] [Google Scholar]
- Rajbhandari P., Thomas B.J., Feng A.C., Hong C., Wang J., Vergnes L., Sallam T., Wang B., Sandhu J., Seldin M.M., et al. 2018. IL-10 Signaling Remodels Adipose Chromatin Architecture to Limit Thermogenesis and Energy Expenditure. Cell. 172:218–233.e17. 10.1016/j.cell.2017.11.019 [DOI] [PMC free article] [PubMed] [Google Scholar]
- Stallone G., Infante B., Di Lorenzo A., Rascio F., Zaza G., and Grandaliano G.. 2016. mTOR inhibitors effects on regulatory T cells and on dendritic cells. J. Transl. Med. 14:152 10.1186/s12967-016-0916-7 [DOI] [PMC free article] [PubMed] [Google Scholar]
- Templeman N.M., Clee S.M., and Johnson J.D.. 2015. Suppression of hyperinsulinaemia in growing female mice provides long-term protection against obesity. Diabetologia. 58:2392–2402. 10.1007/s00125-015-3676-7 [DOI] [PMC free article] [PubMed] [Google Scholar]
- Templeman N.M., Flibotte S., Chik J.H.L., Sinha S., Lim G.E., Foster L.J., Nislow C., and Johnson J.D.. 2017. Reduced Circulating Insulin Enhances Insulin Sensitivity in Old Mice and Extends Lifespan. Cell Rep. 20:451–463. 10.1016/j.celrep.2017.06.048 [DOI] [PubMed] [Google Scholar]
- Terme M., Pernot S., Marcheteau E., Sandoval F., Benhamouda N., Colussi O., Dubreuil O., Carpentier A.F., Tartour E., and Taieb J.. 2013. VEGFA-VEGFR pathway blockade inhibits tumor-induced regulatory T-cell proliferation in colorectal cancer. Cancer Res. 73:539–549. 10.1158/0008-5472.CAN-12-2325 [DOI] [PubMed] [Google Scholar]
- Toribio-Fernández R., Herrero-Fernandez B., Zorita V., López J.A., Vázquez J., Criado G., Pablos J.L., Collas P., Sánchez-Madrid F., Andrés V., et al. 2019. Lamin A/C deficiency in CD4+ T-cells enhances regulatory T-cells and prevents inflammatory bowel disease. J. Pathol. 249:509–522. 10.1002/path.5332 [DOI] [PubMed] [Google Scholar]
- Toribio-Fernández R., Zorita V., Rocha-Perugini V., Iborra S., Martínez Del Hoyo G., Chevre R., Dorado B., Sancho D., Sanchez-Madrid F., Andrés V., et al. 2018. Lamin A/C augments Th1 differentiation and response against vaccinia virus and Leishmania major. Cell Death Dis. 9:9 10.1038/s41419-017-0007-6 [DOI] [PMC free article] [PubMed] [Google Scholar]
- Tsai S., Clemente-Casares X., Zhou A.C., Lei H., Ahn J.J., Chan Y.T., Choi O., Luck H., Woo M., Dunn S.E., et al. 2018. Insulin Receptor-Mediated Stimulation Boosts T Cell Immunity during Inflammation and Infection. Cell Metab. 28:922–934.e4. 10.1016/j.cmet.2018.08.003 [DOI] [PubMed] [Google Scholar]
- Varewijck A.J., and Janssen J.A.. 2012. Insulin and its analogues and their affinities for the IGF1 receptor. Endocr. Relat. Cancer. 19:F63–F75. 10.1530/ERC-12-0026 [DOI] [PubMed] [Google Scholar]
- Vasanthakumar A., Moro K., Xin A., Liao Y., Gloury R., Kawamoto S., Fagarasan S., Mielke L.A., Afshar-Sterle S., Masters S.L., et al. 2015. The transcriptional regulators IRF4, BATF and IL-33 orchestrate development and maintenance of adipose tissue-resident regulatory T cells. Nat. Immunol. 16:276–285. 10.1038/ni.3085 [DOI] [PubMed] [Google Scholar]
- Wang S., Zhang Y., Wang Y., Ye P., Li J., Li H., Ding Q., and Xia J.. 2016. Amphiregulin Confers Regulatory T Cell Suppressive Function and Tumor Invasion via the EGFR/GSK-3β/Foxp3 Axis. J. Biol. Chem. 291:21085–21095. 10.1074/jbc.M116.717892 [DOI] [PMC free article] [PubMed] [Google Scholar]
- Wernstedt Asterholm I., Tao C., Morley T.S., Wang Q.A., Delgado-Lopez F., Wang Z.V., and Scherer P.E.. 2014. Adipocyte inflammation is essential for healthy adipose tissue expansion and remodeling. Cell Metab. 20:103–118. 10.1016/j.cmet.2014.05.005 [DOI] [PMC free article] [PubMed] [Google Scholar]
- Wu D., Dawson N.A., and Levings M.K.. 2016. Obesity-Associated Adipose Tissue Inflammation and Transplantation. Am. J. Transplant. 16:743–750. 10.1111/ajt.13578 [DOI] [PubMed] [Google Scholar]
- Wu D., Han J.M., Yu X., Lam A.J., Hoeppli R.E., Pesenacker A.M., Huang Q., Chen V., Speake C., Yorke E., et al. 2019. Characterization of regulatory T cells in obese omental adipose tissue in humans. Eur. J. Immunol. 49:336–347. 10.1002/eji.201847570 [DOI] [PubMed] [Google Scholar]
- Wu D., Huang Q., Orban P.C., and Levings M.K.. 2020. Ectopic germline recombination activity of the widely used Foxp3-YFP-Cre mouse: a case report. Immunology. 159:231–241. 10.1111/imm.13153 [DOI] [PMC free article] [PubMed] [Google Scholar]
- Wu J., Zhang H., Shi X., Xiao X., Fan Y., Minze L.J., Wang J., Ghobrial R.M., Xia J., Sciammas R., et al. 2017. Ablation of Transcription Factor IRF4 Promotes Transplant Acceptance by Driving Allogenic CD4+ T Cell Dysfunction. Immunity. 47:1114–1128.e6. 10.1016/j.immuni.2017.11.003 [DOI] [PMC free article] [PubMed] [Google Scholar]
- Xie C., Zhu F., Wang J., Zhang W., Bellanti J.A., Li B., Brand D., Olsen N., and Zheng S.G.. 2019. Off-Target Deletion of Conditional Dbc1 Allele in the Foxp3(YFP-Cre) Mouse Line under Specific Setting. Cells. 8:1309 10.3390/cells8111309 [DOI] [PMC free article] [PubMed] [Google Scholar]
- Zaiss D.M., van Loosdregt J., Gorlani A., Bekker C.P., Gröne A., Sibilia M., van Bergen en Henegouwen P.M., Roovers R.C., Coffer P.J., and Sijts A.J.. 2013. Amphiregulin enhances regulatory T cell-suppressive function via the epidermal growth factor receptor. Immunity. 38:275–284. 10.1016/j.immuni.2012.09.023 [DOI] [PMC free article] [PubMed] [Google Scholar]
Associated Data
This section collects any data citations, data availability statements, or supplementary materials included in this article.
Supplementary Materials
lists antibodies used for flow cytometry.


