

Abstract
Desert dust aerosols affect Earth’s global energy balance through interactions with radiation1,2, clouds3,4, and ecosystems5. But the magnitudes of these effects are so uncertain that it remains unclear whether atmospheric dust has a net warming or cooling effect on global climate1,4,6. Consequently, it is still uncertain whether large changes in atmospheric dust loading over the past century have slowed or accelerated anthropogenic climate change4,7–9, and the climate impact of possible future alterations in dust loading is similarly disputed9,10. Here we use an integrative analysis of dust aerosol sizes and abundance to constrain the climatic impact of dust through direct interactions with radiation. Using a combination of observational, experimental, and model data, we find that atmospheric dust is substantially coarser than represented in current climate models. Since coarse dust warms global climate, the dust direct radiative effect (DRE) is likely less cooling than the ~0.4 W/m2 estimated by models in a current ensemble2,11–13. We constrain the dust DRE to - 0.20 (−0.48 to +0.20) W/m2, which suggests that the dust DRE produces only about half the cooling that current models estimate, and raises the possibility that dust DRE is actually net warming the planet.
The radiative effect of dust on global climate depends sensitively on both its size distribution and abundance1,2,14. However, current global model estimates of the atmospheric loading of dust with geometric diameter D ≤ 10 μm (PM10) vary widely from ~6 to 30 Tg4,15–17. Similarly, the size distribution of atmospheric dust varies substantially across models, with the fraction of dust in the clay size range (D ≤ 2 μm) varying by over a factor of three6. This uncertainty in dust size and abundance is partially driven by a critical limitation of global models: the need to prescribe poorly known attributes of dust particles. In particular, the assumed dust optical properties and size distribution at emission greatly affect the resultant size-resolved dust loading14,17. Each model parameterizes these properties differently, and in a manner not always consistent with experimental results6,12,18. This divergence in assumed dust properties contributes to a wide range of estimates of the size-resolved global dust loading6,17. Because fine dust cools global climate whereas coarse dust (D ≥ 5 μm) likely warms it2, this uncertainty in size-resolved dust loading contributes to a wide spread in model estimates of the dust DRE2,7,12,14,19.
Since the use of global models alone is thus unlikely to substantially narrow the uncertainty on dust climate effects20, we develop an alternative approach to determine the size-resolved global dust loading, which we subsequently use to constrain the dust DRE. We use an analytical framework that leverages observational and experimental constraints on dust properties, and uses global models only where such constraints are not available. Specifically, we link dust loading to the dust aerosol optical depth (DAOD), which we constrain by combining extensive ground-based and satellite observations with global model simulations21 (Fig. 1a). Since the globally-averaged DAOD quantifies the total extinction of solar radiation by dust in the atmosphere, we can use it to determine the dust loading if we also constrain the size distribution of atmospheric dust, and the efficiency Qext with which dust of a given size extinguishes solar radiation (see Materials and Methods).
Figure 1. New constraints on dust properties and prevalence.
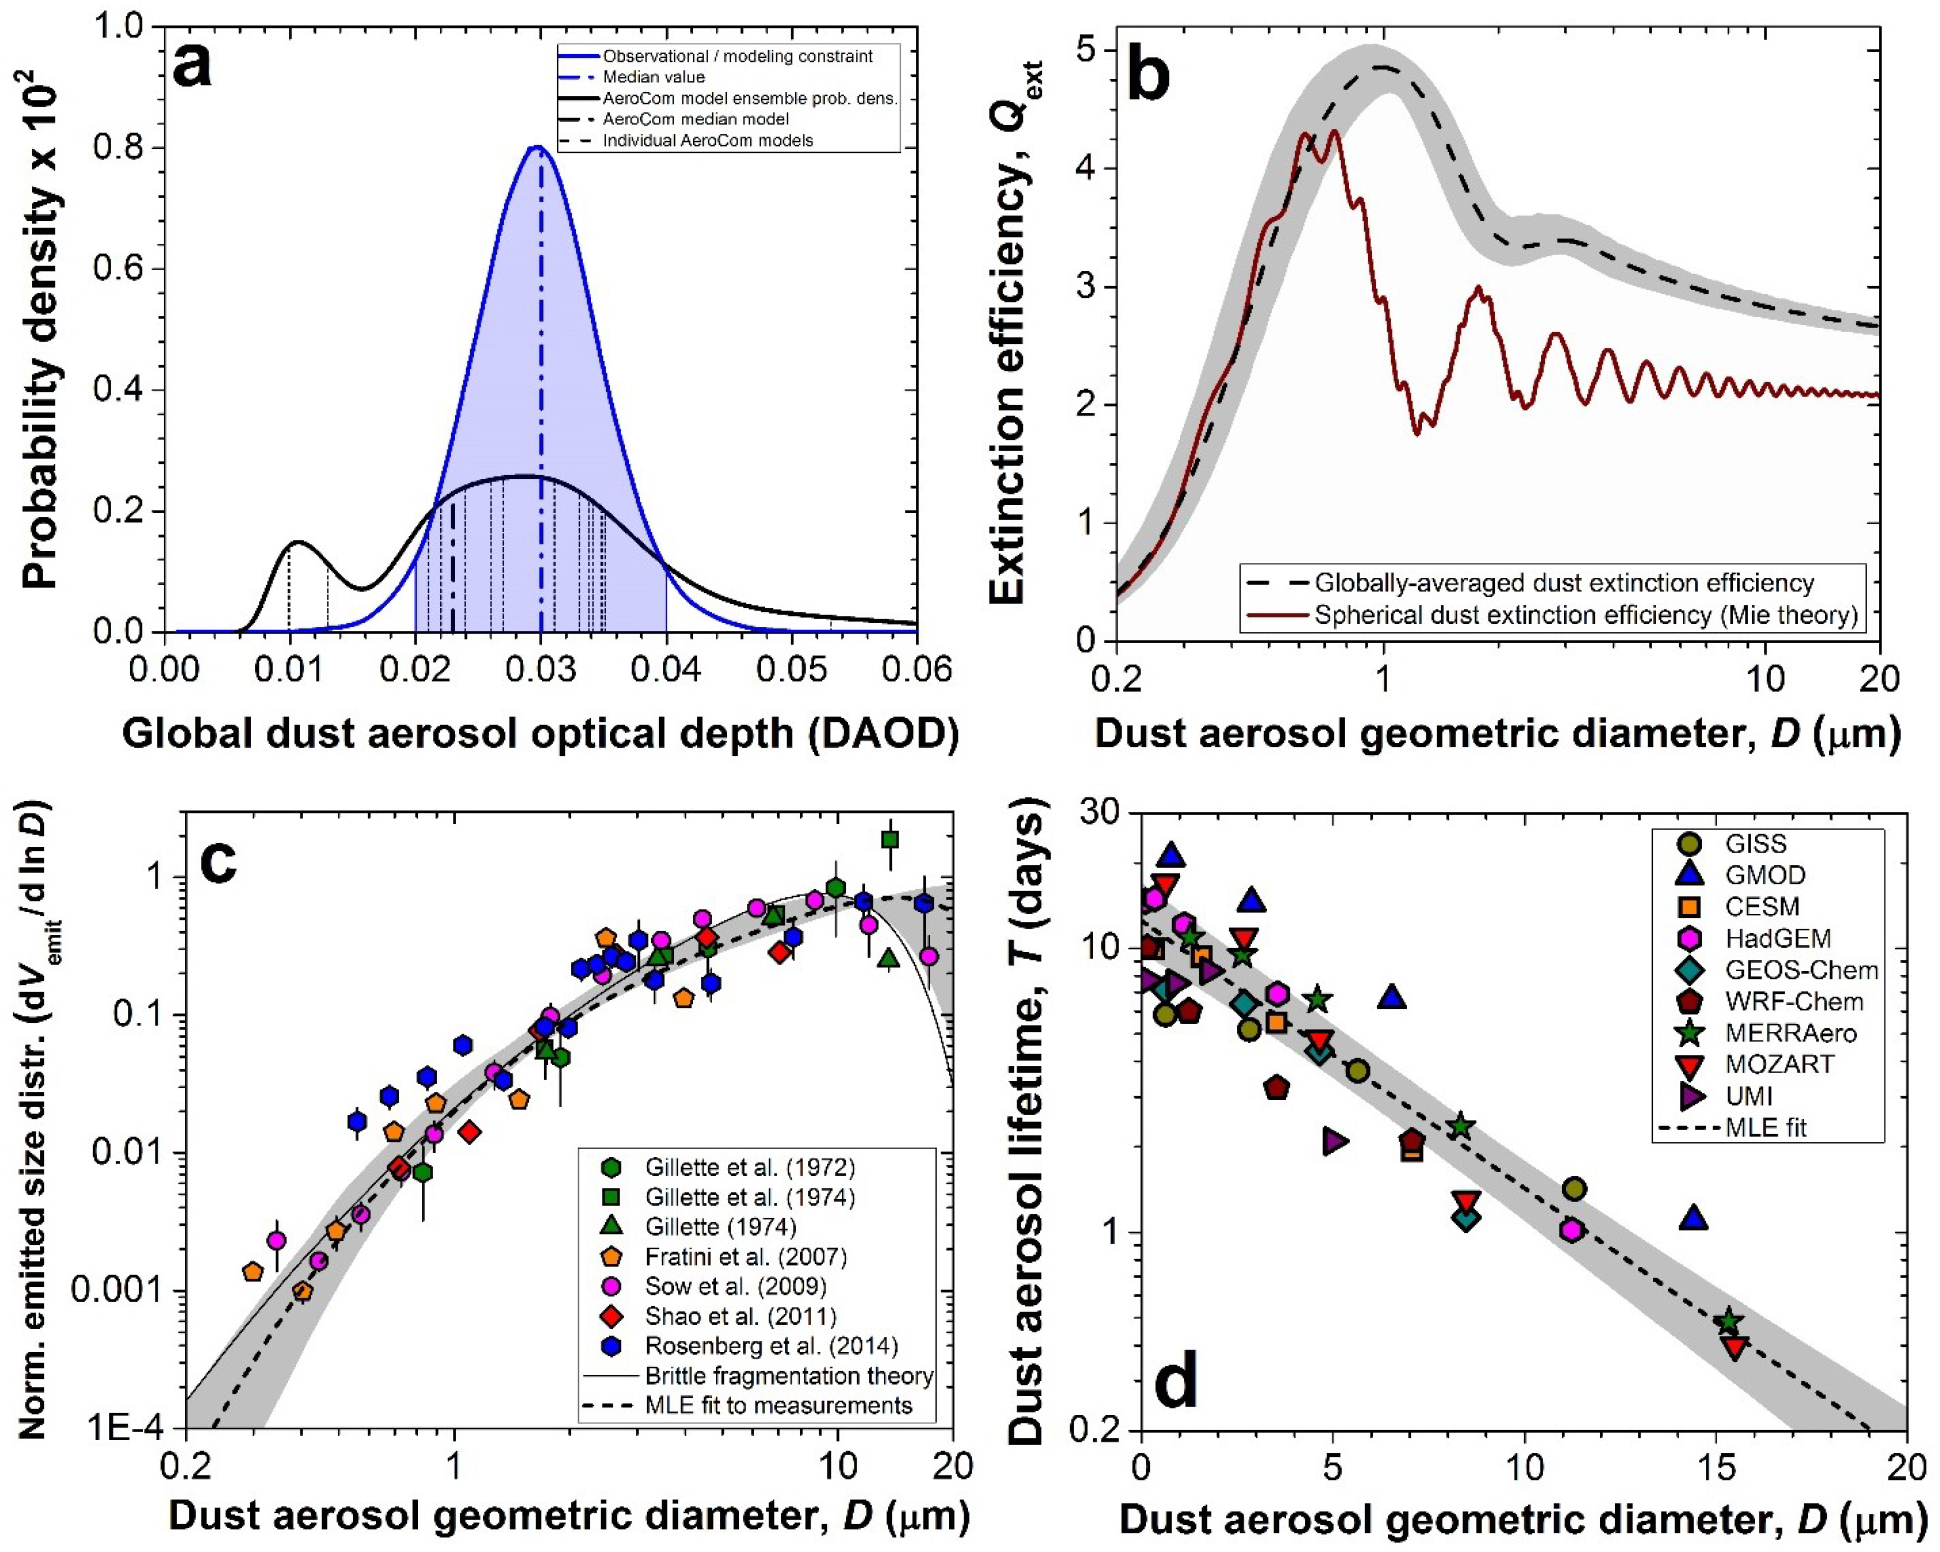
(a) Joint observational and modeling constraint on global DAOD21 (shading denotes 95% confidence interval (CI)), which is more precise than the AeroCom model ensemble17. (b) Joint experimental and modeling constraint on the globally-averaged dust extinction efficiency Qext, showing that “spherical” dust substantially underestimates Qext. For b-d, dashed lines and shading represent the maximum likelihood estimated (MLE) values and CI (see Materials and Methods). (c) Experimental constraint on the globally-averaged emitted dust size distribution (normalized to unity when summed over all sizes), obtained by combining five data sets in a statistical model. (d) Modeling constraint on the globally-averaged size-resolved dust lifetime, showing that lifetime decreases roughly exponentially with increasing dust size.
We constrain the globally-averaged dust extinction efficiency Qext (Fig. 1b) by combining experimental constraints on dust optical properties and shape with a dust single-scattering database22. We find that the common simplification to treat dust as spherical particles1,2,14 results in an underestimation of Qext by ~20–60% for dust with D ≥ 1 μm (Fig. 1b). This underestimation is largely caused by the greater surface-to-volume ratio of irregularly-shaped dust, relative to that of an equal-volume sphere23.
We obtain the size distribution of atmospheric dust from experimental constraints on the size distribution of emitted dust (Fig. 1c) and global modeling constraints on the atmospheric lifetime of emitted dust (Fig. 1d) (see Materials and Methods). We constrain the globally-averaged emitted dust size distribution using five data sets from a variety of dust source regions (Fig. 1c), which we combine using a statistical model that accounts for systematic errors inherent in each study’s measurement methodology (see Supplement). We find that clay-sized aerosols account for only 4.3 (3.5–5.7)% of the emitted mass with D ≤ 20 μm (PM20), which is substantially less than the 5–35% assumed in global models6. This finding is similar to a recent result6 based on brittle fragmentation theory (black line in Fig. 1c), which is reinforced here by the inclusion of three additional data sets. We constrain the globally-averaged size-resolved dust lifetime (Fig. 1d) using simulation results from nine global models, which we again combine using a statistical model (see Supplement). We find that the lifetime of submicron dust is 11 (9 – 15) days, and that it decreases roughly exponentially with increasing D. This occurs primarily because of the increase of gravitational deposition with particle diameter2,24. Despite their small emitted fraction, the long lifetime of clay-sized dust causes those particles to account for 15 (12–21)% of the atmospheric mass load, and their large surface-to-volume ratio and extinction efficiency (Fig. 1b) causes them to account for about half [46 (41–56)%] of the global DAOD (Fig. S1).
We obtain the normalized globally-averaged dust size distribution (Fig. 2a) by combining these constraints on the emitted dust size distribution and lifetime (see Materials and Methods). We find that dust in current global models is too fine (Fig. 2b), which is consistent with recent observations14,24 and was previously suggested on theoretical grounds6.
Figure 2. Size-resolved global loading of desert dust aerosols.
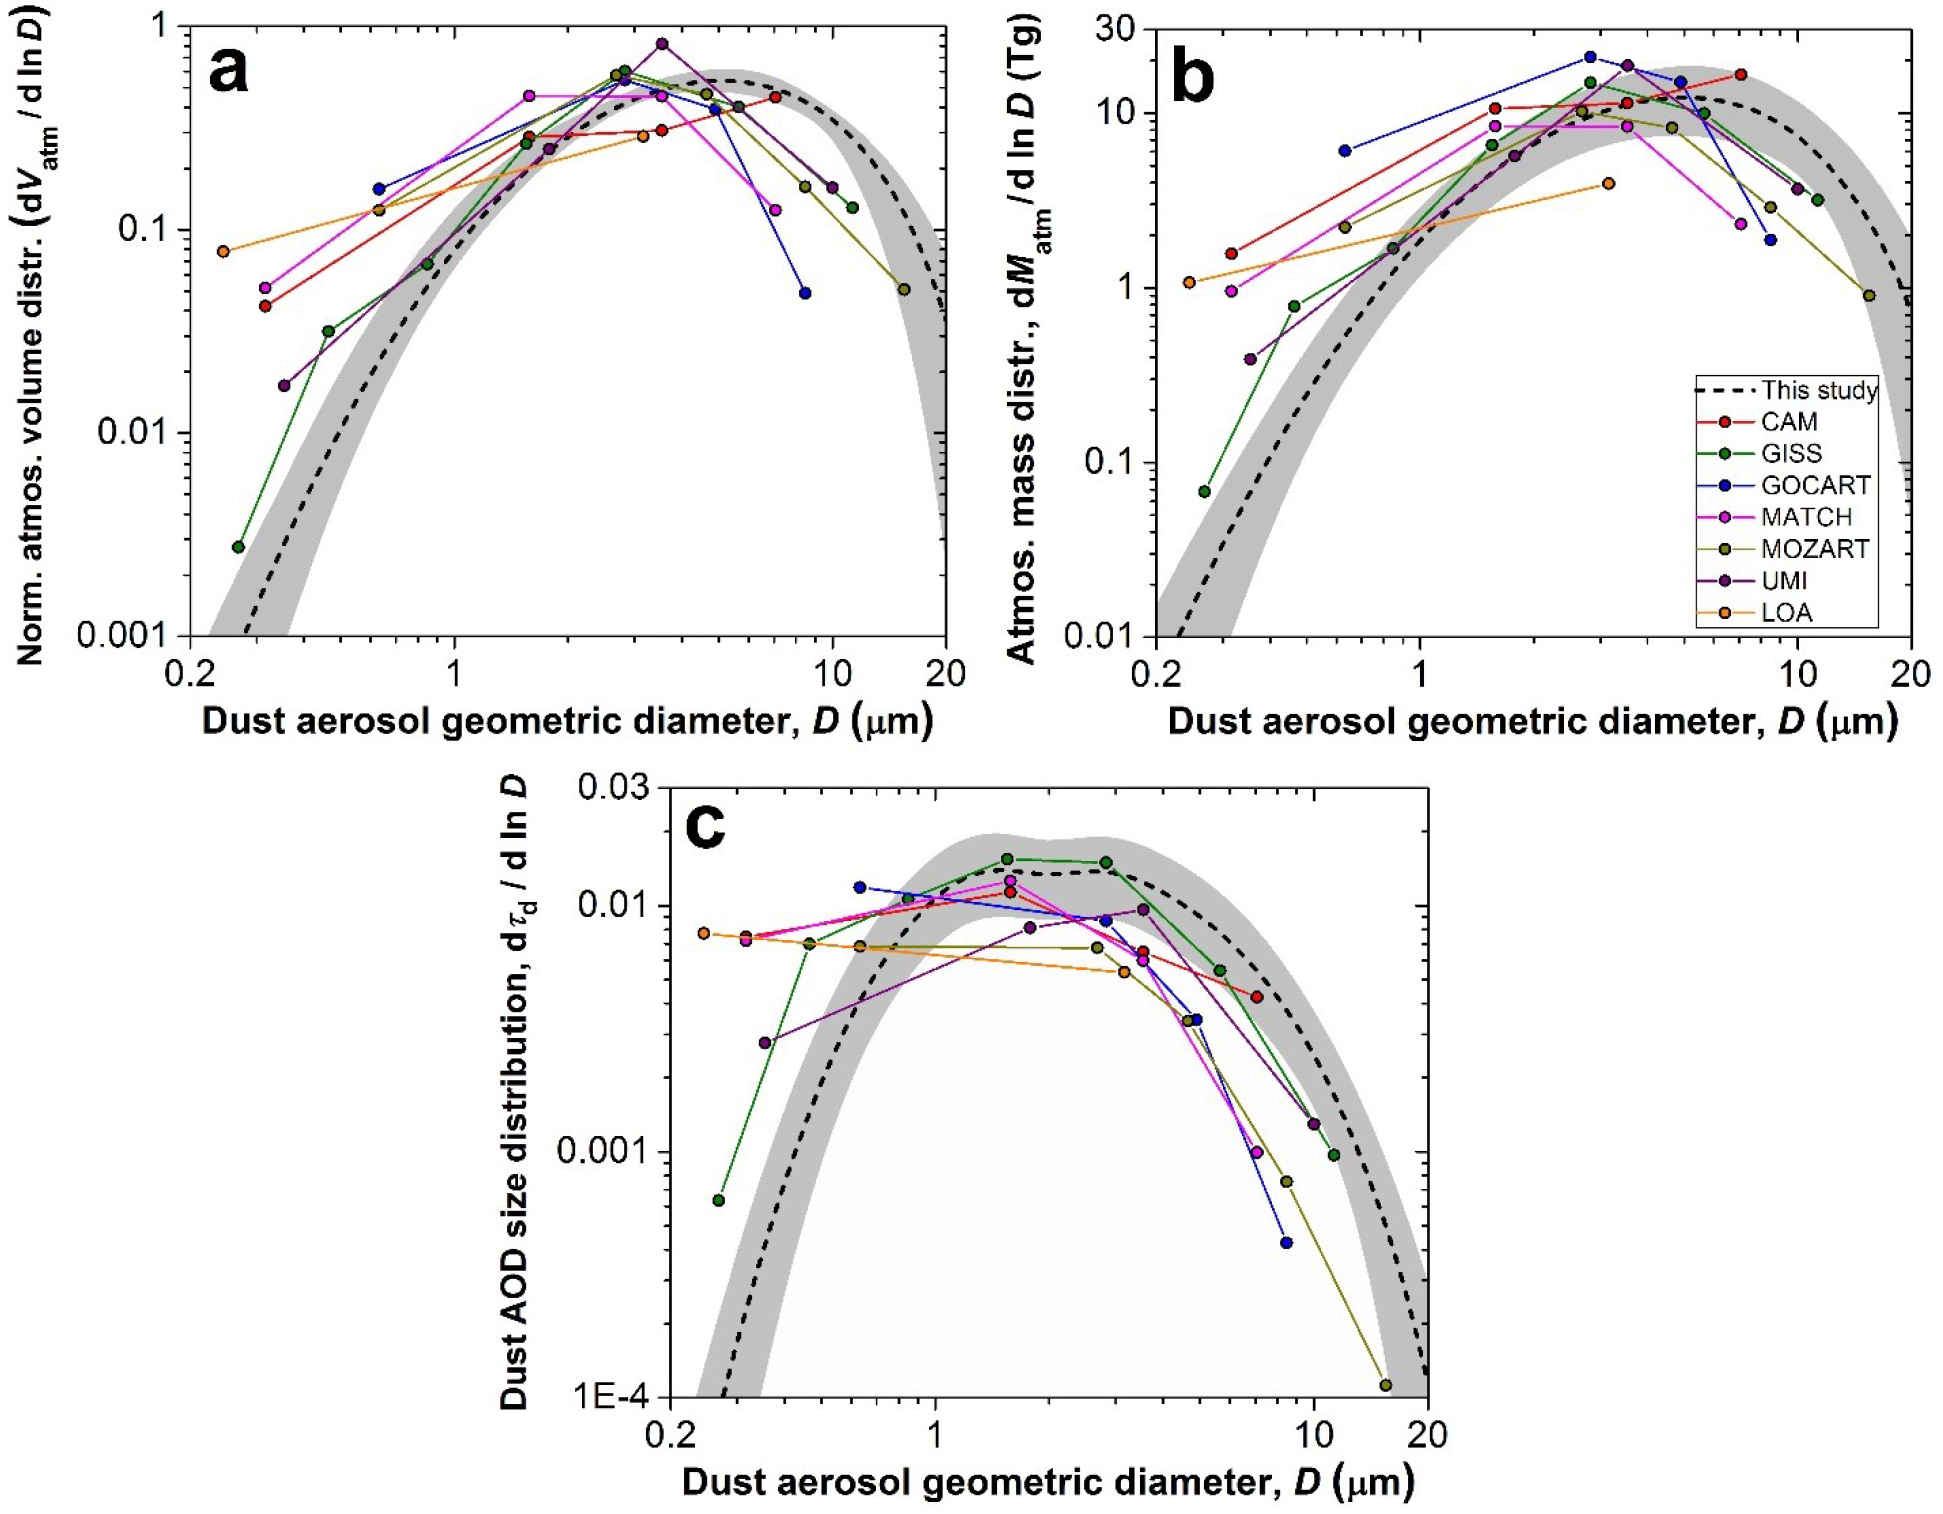
(a) The globally-averaged normalized volume distribution (shading represents CI) peaks at a coarser size than in current global models in the AeroCom ensemble17 (colored lines). Constraints on the (b) size-resolved atmospheric dust mass and (c) the dust AOD size distribution indicate that current global models contain too much fine dust and not enough coarse dust. In contrast to the volume distribution in panel (a), the mass distribution is not normalized, such that its integral over size equals the global dust load.
We combine the constraints on the atmospheric size distribution (Fig. 2a) with those on the DAOD (Fig. 1a) and the extinction efficiency (Fig. 1b) to obtain the global PM10 dust emission rate Femit and loading Latm (see Materials and Methods). We find that Femit = 1.7 (1.0 – 2.7)∙103 Tg/year and Latm = 20 (13 – 29) Tg (Fig. 3). The global emission rate and loading of PM20 dust are 3.4 (2.2–5.0)∙103 Tg/year and 23 (14 – 33) Tg, respectively (Fig. S1). Since results from the AeroCom ensemble indicate that the atmospheric loading of non-dust aerosols is around 10 Tg16, we conclude that desert dust likely dominates global aerosol by mass. Most of the AeroCom models, as well as the median model, simulate a dust emission rate and loading below our central estimates (Fig. 3)17, predominantly because of an underestimation of coarse dust (D > 5 μm; Figs. 2b and S2).
Figure 3. Global emission rate and atmospheric loading of desert dust aerosols.
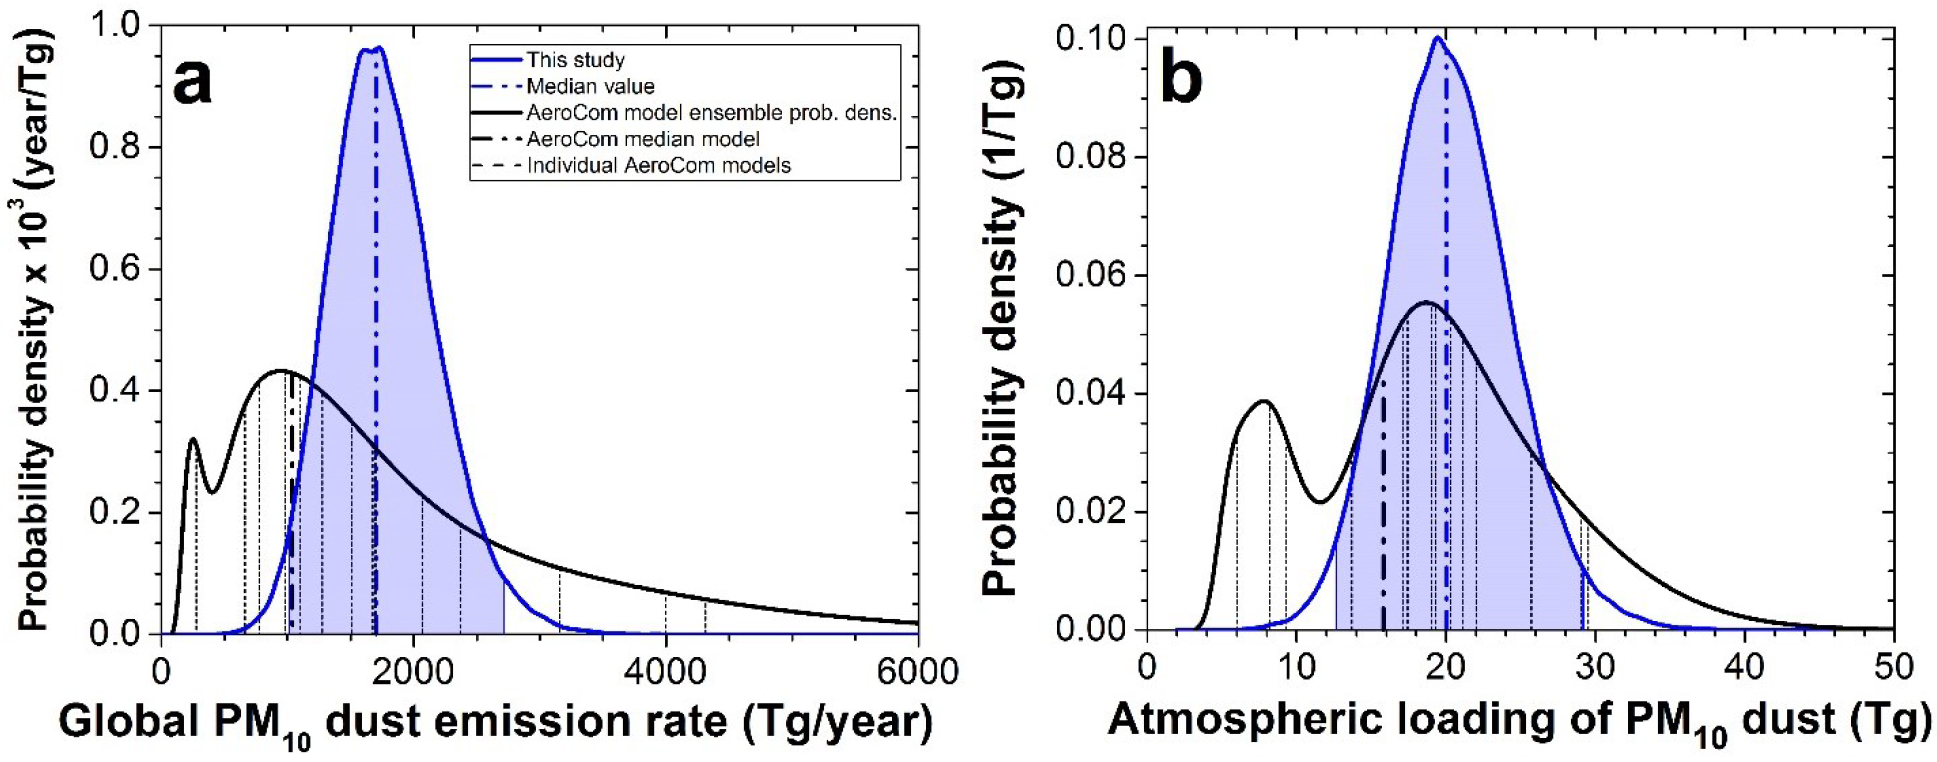
Probability densities of (a) the atmospheric dust loading and (b) the global dust emission rate (blue lines with shaded CI) indicate that some global models in the AeroCom ensemble17 underestimate dust emission and loading.
Because global models need to assume specific values for dust attributes, their results can be biased if the assigned values are not consistent with experimental results. In particular, inconsistent values for dust optical properties and the emitted particle size distribution generate biases in the size-resolved atmospheric dust loading12,14,15, and thus in the simulated dust effects on climate2,6,14. Current models assume an emitted dust size distribution that is much finer than measurements indicate (Fig. S2), which results in a substantial bias toward fine dust in the atmosphere (Fig. 2). Since fine dust mostly scatters, whereas coarse dust also absorbs solar radiation, this fine-size bias likely contributes to the underestimation of aerosol absorption in models25.
A second bias in models results from the assumption that dust is spherical5,15,19,20,26. This is problematic because simplifying the highly aspherical dust particles26 leads to a substantial underestimation of the extinction efficiency (Fig. 1b). For the atmospheric dust size distribution obtained here (Fig. 2a), the assumption of spherical dust results in an underestimation of the extinction produced by a unit mass of dust loading of 29 (24–34)%, which is consistent with recent results from deposited dust in ice cores27. This substantial bias is masked by excessive fine dust in models, which increases the extinction produced by a unit mass of dust (see Figs. 1d and S1). Global models furthermore slightly underestimate the global DAOD21 (Fig. 1a). The net result of these three biases is a slight underestimation of global dust loading (Fig. 3).
A crucial advantage of our analytical framework is that it is subject to fewer of these biases, because it integrates observational and experimental constraints. Despite important limitations of our approach (see Materials and Methods), we consider our constraints on the size-resolved global dust emission rate and loading (Figs. 2, 3) to be more accurate and robust than constraints derived from model ensembles4,15–17. As such, our constraints on the size-resolved dust loading can better inform dust effects on climate, and in particular the dust DRE1,2, which is highly sensitive to the atmospheric dust size distribution. Indeed, fine dust cools global climate by scattering solar radiation, whereas coarse dust (D ≥ 5 μm) likely warms by absorbing both solar and thermal radiation2 (Fig. S3). Consequently, our finding that atmospheric dust is coarser than represented in the current ensemble of global models17 implies that dust DRE is more positive than the −0.30 to −0.60 W/m2 estimated by AeroCom models2,11–13.
We determine the DRE of PM20 dust by combining results on the size-resolved extinction of SW radiation (Fig. 2c) with an ensemble of model simulations of the efficiency with which a unit of extinction is converted to DRE (Fig. S3; Materials and Methods). Using the size-resolved dust loading obtained by AeroCom models yields a DRE at top-of-atmosphere (TOA) of −0.46 (−0.78 to −0.03) W/m2, which is consistent with estimates by individual AeroCom models2,11–13 (Fig. 4). In contrast, using our constraints on the size-resolved dust loading yields a DRE of −0.20 (−0.48 to +0.20) W/m2 (Fig. 4). This represents a reduction of the most likely DRE by approximately a factor of two, and a 26% chance that the global DRE is actually positive.
Figure 4. Constraints on the global direct radiative effect (DRE) of PM20 dust.
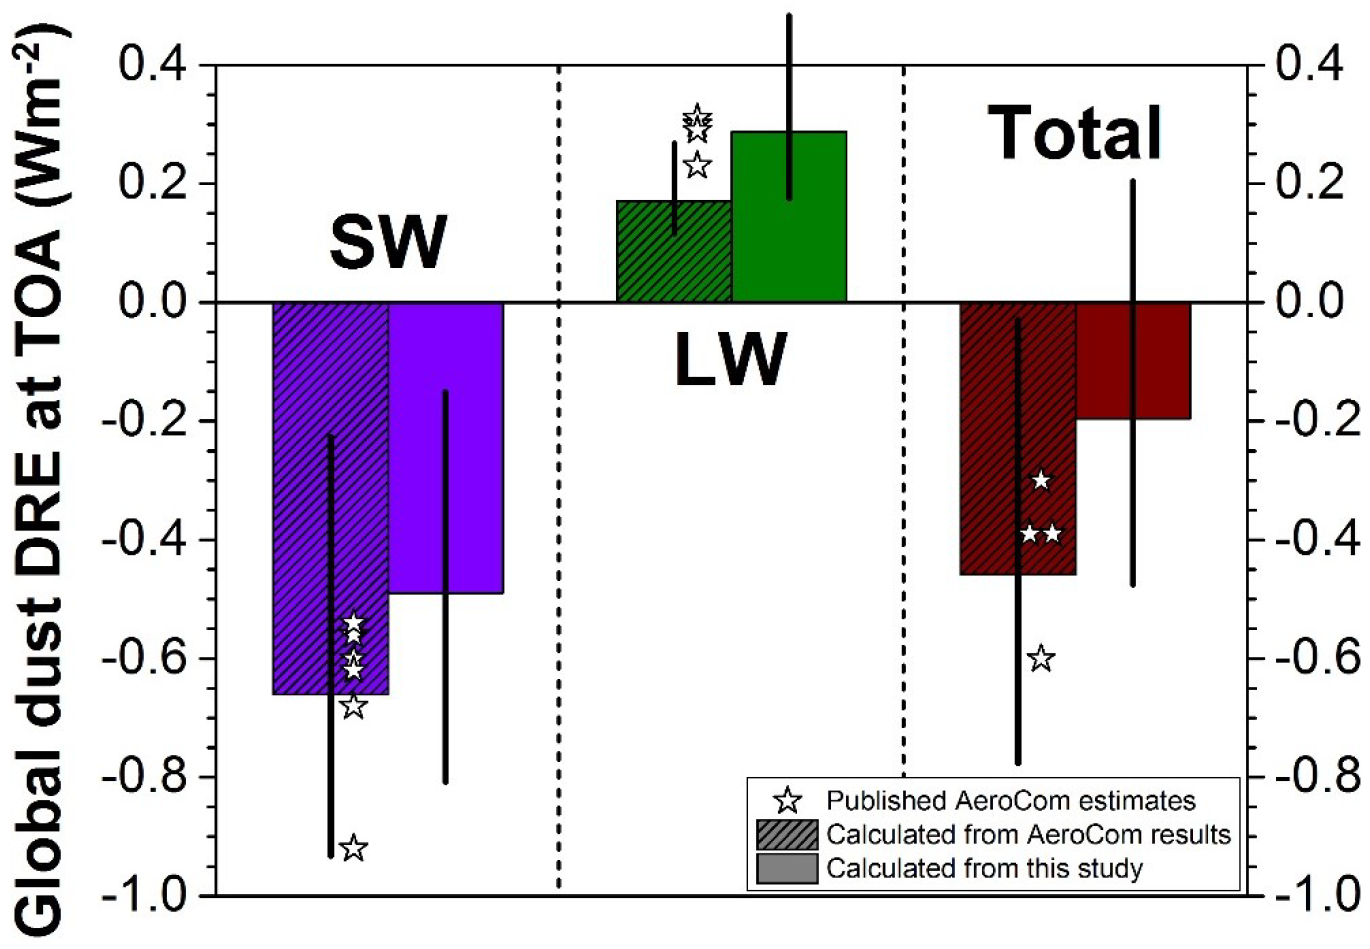
The fine-size bias in current models causes an overestimation of SW cooling and underestimation of LW warming (hatched bars). We correct these biases using our constraints on the global size-resolved dust load (Fig. 2b) and extinction efficiency (Fig. 1b), resulting in a more positive (warming) DRE at the top-of-atmosphere. Error bars denote 95% CI2,11–13.
Three different factors contribute to our result that the dust DRE is substantially more positive (warming) than accounted for by current AeroCom models17. First, correcting the fine-size bias in models reduces SW cooling by ~0.15 W/m2, both because fine dust predominantly scatters whereas coarse dust also absorbs, and because the short lifetime of coarse dust causes concentrates these particles over bright deserts, which reduces the cooling effect of scattering and enhances the warming effect of SW absorption. Second, the increase in coarse dust increases the warming arising from LW interactions by ~0.10 W/m2 (Fig. 4). Finally, very coarse dust (D > 10 μm) produces a positive DRE of +0.03 (+0.01 to +0.06) W/m2, which is neglected by about half the AeroCom models17.
Although our results indicate that the global dust DRE is substantially more positive than represented in current models (Fig. 4), the effects of the fine-size bias in current models are region-specific. This spatial variability in the dust DRE is primarily driven by regional differences in surface albedo and prevalence of clouds, and by the size-dependent dust lifetimes (Fig. 1d). Close to source regions, the coarse particles missing from current models produce additional warming (Fig. S4), especially over highly reflective arid regions. Further from source regions, much of this missing coarse dust has been deposited (Figure 1d and Refs.24,28). However, the excess of fine dust in current models (Fig. 2b) causes an overestimation of dust cooling far from source regions (Fig. S4), particularly over low reflectivity regions, such as oceans and forests. Our results thus imply a more positive dust DRE, both close to and far from source regions.
Our results suggest that dust cools the climate system substantially less than represented in current models, and raise the possibility that dust is actually net warming the planet. This has important implications for the role of changes in dust loading in past and future climate changes. Past increases in dust loading have likely slowed anthropogenic greenhouse warming less than current models suggest7,8, and might even have accelerated it. This is consistent with recent insights that aerosol radiative forcing might be less cooling than previously thought20. Similarly, anthropogenic dust emissions, which are estimated to account for about a quarter of total dust emissions29, might enhance, rather than oppose4, global warming. Our results further suggest that possible future increases in dust loading might dampen global climate change less than current models estimate10, and might even enhance it.
Materials and Methods
Analytical framework for constraining the size-resolved atmospheric dust loading.
Past constraints on the global dust loading and the resulting dust radiative effects have been obtained mostly from ensembles of global model simulations15–17. To simulate dust loading, these models must represent nonlinear small-scale processes, such as dust emission and deposition30, which are not resolved within largescale climate models. These small-scale processes are thus heavily parameterized31–33, introducing uncertainty in the simulated dust loading. In addition, model results can contain biases that arise from inconsistencies of assumed dust properties with respect to experimental and observational constraints6,12.
To overcome these limitations of global model ensembles, we have developed an analytical framework that constrains the global dust loading and its direct radiative effect using observational and experimental constraints, where available, to replace modeling results. Further, our framework directly links the global dust loading to a strong observational constraint on the magnitude of the global dust cycle: satellite measurements of the aerosol optical depth, which can be partitioned between that arising from dust and from other aerosols15,21,34. The dust aerosol optical depth (DAOD), which quantifies the extinction of solar radiation by dust, is constrained globally by years of retrievals from multiple satellites that have been calibrated against accurate ground-based measurements35. The global atmospheric loading of PM10 dust (Latm) can thus be expressed as,
| (1) |
where AEarth is the area of the Earth, τd is the globally-averaged DAOD at 550 nm wavelength, and ετ (m2/kg) is the mass extinction efficiency. We use the results of Ridley et al.21, who combined satellite measurements, ground-based measurements, and global transport model simulations to constrain the global DAOD to τd = 0.030 (0.020 – 0.040) (Fig. 1a).
The globally-averaged mass extinction efficiency ετ equals the summed projected surface area of a unit mass of dust loading, multiplied by the globally-averaged efficiency with which a unit projected dust surface area extinguishes radiation. Because these factors depend on the dust geometric diameter D (i.e., the diameter of a sphere with the same volume as the irregular dust particle), the contribution of each dust particle size to ετ must be weighted by the globally-averaged volume size distribution of atmospheric dust, , which is normalized (i.e., integrating over D yields unity). That is,
| (2) |
where A(D)/M(D) = 3/2ρdD is a spherical particle’s projected surface area per unit mass, ρd = (2.5 ± 0.2)∙103 kg/m3 is the density of dust aerosols (see Supplement); and Dmax = 20 μm is the diameter above which the contribution to the global DAOD can be neglected, as justified by our results (Fig. S1). We further define the globally-averaged extinction efficiency Qext(D) as the extinction cross-section normalized by πD2/4, the projected area of a sphere with diameter D. Since an irregular dust particle has more surface area than a spherical particle with the same volume, it will generally have a larger extinction efficiency23.
The globally-averaged size distribution of atmospheric dust, , is determined by three factors: (i) the normalized volume size distribution at emission , (ii) the globally-averaged size-resolved dust lifetime (T(D)), and (iii) any changes in the size of dust particles during transport due to chemical processing and aggregation with other aerosols, which is likely insignificant for African dust36 but might play a role for Asian dust37. Such changes in dust size during transport are neglected in many models due to a lack of mechanistic understanding2,7,29,31,38. By similarly neglecting this process, we obtain
| (3) |
where the mass-weighted average dust lifetime is given by
| (4) |
where we have used the fact that both the atmospheric and emitted volume size distributions are normalized; note that is also equal to Latm/Femit, where Femit is the global dust emission rate. The above equations yield ετ = 0.75 (0.62–0.95) m2/g, which is consistent with results from the AeroCom global model ensemble17. We use ετ to obtain the size-resolved global dust emission rate and loading (Fig. 2 and 3).
We use these constraints on the size-resolved dust loading to similarly constrain the dust direct radiative effect, ζ. Since ζ is generated by extinction of radiation by dust, it can be expressed as the product of the dust optical depth and the radiative effect produced per unit of optical depth20,
| (5) |
where we used Eqs. (1) and (2) to write in terms of the dust size distribution and extinction efficiency. The radiative effect efficiency Ω(D) is the all-sky DRE that dust of diameter D produces per unit DAOD. It depends on numerous properties of the Earth system, including the spatial and temporal variability of dust, the surface albedo, the vertical temperature profile, the distribution of radiatively-active species such as clouds and greenhouse gases, and the asymmetry parameter and single-scattering albedo of dust. The value of Ω(D) is thus not readily amenable to an analytical treatment, such that we use results from four global model simulations to estimate Ω(D) (see Supplementary Figure S3 and Supplementary Text).
We used a procedure similar to Eq. (5) to calculate the dust DRE that results from the atmospheric dust size distributions in AeroCom models (colored lines in Fig. 2b), for which we obtained the global extinction of atmospheric radiation as a function of dust size by combining the AeroCom dust size distributions (Fig. 2b) with the Mie theory extinction efficiency (brown line in Fig. 1b) assumed in AeroCom models5,15,19,20,26 (see Supplement for additional details).
Our analytical framework has important limitations. First, our results rely on the constraint on global DAOD from Ref.21 (Fig. 1a), which is consistent with both AeroCom model simulations17 and with the MERRA Aerosol Reanalysis product21. Nonetheless, the analysis in Ref.21 is subject to various possible biases, including due to the cloud-screening algorithm39, due to the separation of dust optical depth from that of all other aerosols, due to the remotely-sensed optical depth retrieval algorithm for aspherical particles40, and due to differences between remotely-sensed clear-sky aerosol optical depth and all-sky optical depth. The uncertainty due to many, but not all, of these biases were quantified in Ref.21, and have been propagated into the results presented here. Second, as is the case in many global models2,7, our analytical approach to constraining the size-resolved dust loading cannot explicitly account for changes in optical properties and size distribution during transport due to chemical processing, internal mixing with other aerosols, and absorption of water vapor38,41. However, our methodology does implicitly account for some of the effects of internal mixing because the globally-averaged dust extinction properties are based on both fresh and aged dust from a range of source regions (see Supplement). Third, our constraint on the dust extinction efficiency uses numerical modeling results in which dust is represented as an ensemble of tri-axial ellipsoids22. This shape is an imperfect representation of the highly heterogeneous and mineralogy-dependent shape and roughness of real dust, and thus might produce systematic errors23. Further, the shortest axis (height) of these ellipsoids is poorly constrained due to a scarcity of measurements26, which also prevent the propagation of uncertainty in the particle height distribution (see Supplement). We thus likely underestimate the uncertainty on the dust extinction efficiency. Fourth, our analytical framework uses globally-averaged properties of dust to calculate the global size-resolved dust loading and resulting dust radiative effects. The neglect of regional heterogeneity in dust properties could introduce errors by not accounting for covariance between dust properties. An example of this would be if the index of refraction or shape of dust depended substantially on particle size. However, experimental results suggest such covariances are small42,43. Fifth, our constraints on the global dust DRE at TOA (Fig. 4) rely on an ensemble of four global model simulations of the size-resolved dust DRE (Fig. S3). These models assume specific optical properties that, although broadly consistent with remote sensing and in situ measurements (see Supplement), are not subject to the detailed experimental constraints that we have used for constraining the emitted dust size distribution and extinction efficiency. Sixth, our constraints likely underestimate the warming effect of LW scattering interactions, which are not accounted for in most global models. We therefore follow the treatment of Miller et al.2, which is the only global modeling study that we are aware of that has accounted for the contribution of LW scattering to the dust DRE. Specifically, we assume that the DRE from LW scattering equals 30% of that produced by LW absorption. Since the DRE from LW scattering is likely of similar magnitude to that arising from LW absorption interactions44, our constraint on the LW DRE should be seen as conservative.
A final limitation of our approach is that it is currently impossible to observationally constrain the globally-averaged dust lifetime. Consequently, we rely on an ensemble of model results (Fig. 1d), which could contain systematic biases. Since there are few observational constraints to test deposition schemes in models32,34, the uncertainty of dust lifetime might be incompletely represented. Further, some models underestimate the prevalence of coarse dust far from source regions14,21,31, which could be partially explained by the fine-size bias in models (Fig. 2). However, this underestimation of coarse dust can also be due to processes missing from models, such as aggregation during transport, numerical errors in the size distribution treatment, the neglected effect of asphericity on dust settling, electrostatic charging, or errors in the (dry) deposition parameterization28,45,46. Such systematic biases towards underrepresentation of long-range coarse dust transport could have caused our results to underestimate the global dust emission loading. However, this would strengthen our conclusions that dust loading is slightly underestimated, that atmospheric dust is coarser than represented in current models, and that the dust DRE is more positive than accounted for in current models.
Constraining the globally-averaged size-resolved shortwave extinction efficiency.
The extinction efficiency of the global population of dust particles depends on (i) its average real refractive index, (ii) its average imaginary refractive index, and (iii) the distribution of dust particle shapes. Based on extensive measurements, we take the globally-averaged real index of refraction at 550 nm as n = 1.53 ± 0.03 (see Supplement). The uncertainty in the imaginary index of refraction k is substantially larger, partially due to regional variations in shortwave-absorbing minerals like hematite19,47,48. However, since absorption accounts for only a small fraction of the total extinction, its influence on our constraint on the extinction efficiency (Fig. 1b) is limited. We take k as a lognormal distribution with log(−k) = −2.5 ± 0.3 (see Supplement). Finally, measurements and theory indicate that the distribution of dust shapes in the atmosphere can be represented as tri-axial ellipsoids22 with a height-to-major axis ratio of εh = ~0.33326,49, and a deviation of the aspect ratio from 1 (spherical) described by a lognormal distribution42 with a median aspect ratio of and a geometric standard deviation of . We converted these parameters to Qext(D) using a dust single-scattering database22. Specifically, we assumed that each of these parameters is independent, and obtained a large number (104) of parameter sets (m, n, , and ) by randomly choosing values from the probability distribution of each parameter. We used the resulting sets of values for Qext(D), obtained from the single-scattering database22, to obtain the median and CI (dashed line and shading in Fig. 1b). We calculated the extinction efficiency of spherical dust with identical index of refraction using Mie theory50 (brown line in Fig. 1b).
Constraining the globally-averaged dust size distribution at emission.
We interpreted each of the five emitted dust size distribution data sets51–57 as a measure of the globally-averaged size distribution of emitted dust. We did so because (i) differences between measurements from different soils within a given study are very small51–53,57, implying that differences in the emitted dust size distribution between different soils are relatively small6, and (ii) the wind speed at emission has no statistically significant influence on the size distribution of emitted PM10 dust58. These observations from dust flux measurements are supported by the invariance of in situ dust size distributions to source region59 and wind speed60. We fit each of the five data sets51–57 with an analytical form derived from brittle fragmentation theory6. We then combined these five analytical functions representing each data set in a statistical model that accounts for systematic errors inherent in each study’s measurement methodology. This allowed us to better constrain the emitted dust size distribution than otherwise possible. We obtained the most likely globally-averaged emitted dust size distribution using a maximum likelihood estimate (MLE; dashed line in Fig. 1c), and obtained the uncertainty (shaded area in Fig. 1c) using a modified bootstrap procedure. See Supplement for additional details.
Constraining the globally-averaged dust lifetime.
We constrained the globally-averaged and size-resolved dust lifetime using an ensemble of global model results from previous studies47,61–64, supplemented with simulations from the global transport models WRF-Chem, GEOS-Chem, and HadGEM (see Supplement). We fit an exponential function to each of the nine simulation results, which we combined in a statistical model to obtain the MLE of the globally-averaged size-resolved dust lifetime. We obtained the uncertainty (shaded area in Fig. 1d) using a modified bootstrapping procedure. See Supplement for additional details.
Analysis of AeroCom model simulations.
We used results from the Aerosol Comparison between Observations and Models (AeroCom) project16,17 as representative of the current generation of global models. We included the probability distributions of simulation results from these models in Figs. 1a and 3, which were obtained using kernel density estimation with a Gaussian kernel with standard smoothing parameter following equation (3.31) in Ref.65. Results from the ‘median’ AeroCom model were obtained by Ref.17 by taking the median of each dust cycle variable for each grid box and month. AeroCom results in Fig. 3 from models that simulated a dust size range larger than PM10 were corrected based on our constraints on the dust size distribution at emission (Fig. 1c) and in the atmosphere (Fig. 2a), respectively. Results from the subset of seven AeroCom models that reported the simulated dust size distributions (see Supplement) are included in Fig. 2. Some of these AeroCom models simulated a dust diameter range smaller than 20 μm, for which we similarly used our constraints to correct the normalized size distributions of atmospheric (Fig. 2a) and emitted (Fig. S2) dust to the PM20 range.
Supplementary Material
Acknowledgements
We thank Virginie Bouchard, Bingqi Yi, Kuo-Nan Liou, Ping Yang, Aradhna Tripati, David Neelin, Jacob Bortnik, Raleigh Martin, Kate Ledger, Amato Evan, Shanna Shaked, and Ralph Kahn for helpful comments and discussions, and thank Philip Rosenberg for providing the data from Ref.57. We acknowledge support from National Science Foundation (NSF) grant 1552519 (J.F.K.), NASA grants NN14AP38G (D.A.R. and C.L.H.) and NNG14HH42I (R.L.M.), and from the U.S. Department of Energy as part of the Regional & Global Climate Modeling program (C.Z.).
References
- 1.Tegen I & Lacis AA Modeling of particle size distribution and its influence on the radiative properties of mineral dust aerosol. J. Geophys. Res.-Atmos 101, 19237–19244 (1996). [Google Scholar]
- 2.Miller RL et al. Mineral dust aerosols in the NASA goddard institute for Space Sciences ModelE atmospheric general circulation model. J. Geophys. Res.-Atmos 111, D06208, doi: 10.1029/2005jd005796 (2006). [DOI] [Google Scholar]
- 3.DeMott PJ et al. Predicting global atmospheric ice nuclei distributions and their impacts on climate. Proc. Natl. Acad. Sci. U. S. A 107, 11217–11222, doi: 10.1073/pnas.0910818107 (2010). [DOI] [PMC free article] [PubMed] [Google Scholar]
- 4.Boucher O et al. in Climate Change 2013: The Physical Science Basis. Contribution of Working Group I to the Fifth Assessment Report of the Intergovernmental Panel on Climate Change (eds Stocker TF et al.) pp. 571–658 (Cambridge University Press, 2013). [Google Scholar]
- 5.Jickells TD et al. Global iron connections between desert dust, ocean biogeochemistry, and climate. Science 308, 67–71 (2005). [DOI] [PubMed] [Google Scholar]
- 6.Kok JF A scaling theory for the size distribution of emitted dust aerosols suggests climate models underestimate the size of the global dust cycle. Proc. Natl. Acad. Sci. U. S. A 108, 1016–1021, doi: 10.1073/pnas.1014798108 (2011). [DOI] [PMC free article] [PubMed] [Google Scholar]
- 7.Mahowald NM et al. Observed 20th century desert dust variability: impact on climate and biogeochemistry. Atmospheric Chemistry and Physics 10, 10875–10893, doi: 10.5194/acp-10-10875-2010 (2010). [DOI] [Google Scholar]
- 8.Stanelle T, Bey I, Raddatz T, Reick C & Tegen I Anthropogenically induced changes in twentieth century mineral dust burden and the associated impact on radiative forcing. J. Geophys. Res.-Atmos 119, 13526–13546, doi: 10.1002/2014jd022062 (2014). [DOI] [Google Scholar]
- 9.Evan AT, Flamant C, Gaetani M & Guichard F The past, present and future of African dust. Nature 531, 493–+ (2016). [DOI] [PubMed] [Google Scholar]
- 10.Allen RJ, Landuyt W & SRumbold ST An increase in aerosol burden and radiative effects in a warmer world. Nature Climate Change 6, 269–274 (2016). [Google Scholar]
- 11.Mahowald NM et al. Climate response and radiative forcing from mineral aerosols during the last glacial maximum, pre-industrial, current and doubled-carbon dioxide climates. Geophysical Research Letters 33, L20705, doi: 10.1029/2006gl026126 (2006). [DOI] [Google Scholar]
- 12.Balkanski Y, Schulz M, Claquin T & Guibert S Reevaluation of Mineral aerosol radiative forcings suggests a better agreement with satellite and AERONET data. Atmospheric Chemistry and Physics 7, 81–95 (2007). [Google Scholar]
- 13.Forster P et al. in Climate Change 2007: The Physical Science Basis. (ed Solomon S, Qin D, Manning M, Chen Z, Marquis M, Averyt KB, Tignor M and Miller HL) (Cambridge University Press, 2007). [Google Scholar]
- 14.Mahowald N et al. The size distribution of desert dust aerosols and its impact on the Earth system. Aeolian Research 15, 53–71, doi: 10.1016/j.aeolia.2013.09.002 (2014). [DOI] [Google Scholar]
- 15.Zender CS, Miller RL & Tegen I Quantifying mineral dust mass budgets: Terminology, constraints, and current estimates. Eos 85, 509–512 (2004). [Google Scholar]
- 16.Textor C et al. Analysis and quantification of the diversities of aerosol life cycles within AeroCom. Atmospheric Chemistry and Physics 6, 1777–1813 (2006). [Google Scholar]
- 17.Huneeus N et al. Global dust model intercomparison in AeroCom phase I. Atmospheric Chemistry and Physics 11, 7781–7816, doi: 10.5194/acp-11-7781-2011 (2011). [DOI] [Google Scholar]
- 18.Evan AT, Flamant C, Fiedler S & Doherty O An analysis of aeolian dust in climate models. Geophysical Research Letters 41, 5996–6001, doi: 10.1002/2014GL060545 (2014). [DOI] [Google Scholar]
- 19.Heald CL et al. Contrasting the direct radiative effect and direct radiative forcing of aerosols. Atmospheric Chemistry and Physics 14, 5513–5527, doi: 10.5194/acp-14-5513-2014 (2014). [DOI] [Google Scholar]
- 20.Stevens B Rethinking the Lower Bound on Aerosol Radiative Forcing. Journal of Climate 28, 4794–4819, doi: 10.1175/jcli-d-14-00656.1 (2015). [DOI] [Google Scholar]
- 21.Ridley DA, Heald CL, Kok JF & Zhao C An observationally-constrained estimate of global dust aerosol optical depth. Atmospheric Chemistry and Physics 16, 15097–15117, doi: 10.5194/acp-2016-385 (2016). [DOI] [Google Scholar]
- 22.Meng ZK et al. Single-scattering properties of tri-axial ellipsoidal mineral dust aerosols: A database for application to radiative transfer calculations. Journal of Aerosol Science 41, 501–512, doi: 10.1016/j.jaerosci.2010.02.008 (2010). [DOI] [Google Scholar]
- 23.Kalashnikova OV & Sokolik IN Modeling the radiative properties of nonspherical soil-derived mineral aerosols. Journal of Quantitative Spectroscopy & Radiative Transfer 87, 137–166, doi: 10.1016/j.jqsrt.2003.12.026 (2004). [DOI] [Google Scholar]
- 24.Van der Does M, Korte LF, Munday CI, Brummer G-J & Stuut J-BW Particle size traces modern Saharan dust transport and deposition across the equatorial North Atlantic. Atmos. Chem. Phys 16, 13697–13710, doi: 10.5194/acp-16-13697-2016 (2016). [DOI] [Google Scholar]
- 25.Lacagnina C et al. Aerosol single-scattering albedo over the global oceans: Comparing PARASOL retrievals with AERONET, OMI, and AeroCom models estimates. J. Geophys. Res.-Atmos 120, 9814–9836, doi: 10.1002/2015jd023501 (2015). [DOI] [Google Scholar]
- 26.Okada K, Heintzenberg J, Kai KJ & Qin Y Shape of atmospheric mineral particles collected in three Chinese arid-regions. Geophysical Research Letters 28, 3123–3126 (2001). [Google Scholar]
- 27.Potenza MAC et al. Shape and size constraints on dust optical properties from the Dome C ice core, Antarctica. Scientific Reports 6, doi: 10.1038/srep28162 (2016). [DOI] [PMC free article] [PubMed] [Google Scholar]
- 28.Ryder CL, Highwood EJ, Lai TM, Sodeman H & Masham JH Impact of atmospheric transport on the evolution of microphysical and optical properties of Saharan dust. Geophysical Research Letters 40, doi: 10.1002/grl.50482 (2013). [DOI] [Google Scholar]
- 29.Ginoux P, Prospero JM, Gill TE, Hsu NC & Zhao M Global-scale attribution of anthropogenic and natural dust sources and their emission rates based on MODIS Deep Blue aerosol products. Reviews of Geophysics 50, Rg3005, doi: 10.1029/2012rg000388 (2012). [DOI] [Google Scholar]
- 30.Kok JF, Parteli EJR, Michaels TI & Karam DB The physics of wind-blown sand and dust. Reports on Progress in Physics 75, 106901, doi: 10.1088/0034-4885/75/10/106901 (2012). [DOI] [PubMed] [Google Scholar]
- 31.Ginoux P et al. Sources and distributions of dust aerosols simulated with the GOCART model. J. Geophys. Res 106, 20255–20273 (2001). [Google Scholar]
- 32.Zender CS, Bian HS & Newman D Mineral Dust Entrainment and Deposition (DEAD) model: Description and 1990s dust climatology. J. Geophys. Res.-Atmos 108, 4416, doi: 10.1029/2002jd002775 (2003). [DOI] [Google Scholar]
- 33.Kok JF et al. An improved dust emission model - Part 1: Model description and comparison against measurements. Atmospheric Chemistry and Physics 14, 13023–13041, doi: 10.5194/acp-14-13023-2014 (2014). [DOI] [Google Scholar]
- 34.Cakmur RV et al. Constraining the magnitude of the global dust cycle by minimizing the difference between a model and observations. J. Geophys. Res.-Atmos 111, D06207, doi: 10.1029/2005jd005791 (2006). [DOI] [Google Scholar]
- 35.Kahn RA Reducing the Uncertainties in Direct Aerosol Radiative Forcing. Surveys in Geophysics 33, 701–721, doi: 10.1007/s10712-011-9153-z (2012). [DOI] [Google Scholar]
- 36.Denjean C et al. Long-range transport across the Atlantic in summertime does not enhance the hygroscopicity of African mineral dust. Geophysical Research Letters 42, 7835–7843, doi: 10.1002/2015gl065693 (2015). [DOI] [Google Scholar]
- 37.Seinfeld JH et al. ACE-ASIA - Regional climatic and atmospheric chemical effects of Asian dust and pollution. Bulletin of the American Meteorological Society 85, 367–+, doi: 10.1175/bams-85-3-367 (2004). [DOI] [Google Scholar]
- 38.Weinzierl B et al. Airborne measurements of dust layer properties, particle size distribution and mixing state of Saharan dust during SAMUM 2006. Tellus Series B-Chemical and Physical Meteorology 61, 96–117, doi: 10.1111/j.1600-0889.2008.00392.x (2009). [DOI] [Google Scholar]
- 39.Baddock MC, Ginoux P, Bullard JE & Gill TE Do MODIS-defined dust sources have a geomorphological signature? Geophysical Research Letters 43, 2606–2613, doi: 10.1002/2015gl067327 (2016). [DOI] [Google Scholar]
- 40.Hsu NC, Tsay SC, King MD & Herman JR Aerosol properties over bright-reflecting source regions. Ieee Transactions on Geoscience and Remote Sensing 42, 557–569, doi: 10.1109/tgrs.2004.824067 (2004). [DOI] [Google Scholar]
- 41.Ginoux P et al. Mixing of dust and NH3 observed globally over anthropogenic dust sources. Atmospheric Chemistry and Physics 12, 7351–7363, doi: 10.5194/acp-12-7351-2012 (2012). [DOI] [Google Scholar]
- 42.Kandler K et al. Chemical composition and complex refractive index of Saharan Mineral Dust at Izana, Tenerife (Spain) derived by electron microscopy. Atmos. Environ 41, 8058–8074, doi: 10.1016/j.atmosenv.2007.06.047 (2007). [DOI] [Google Scholar]
- 43.Kandler K et al. Size distribution, mass concentration, chemical and mineralogical composition and derived optical parameters of the boundary layer aerosol at Tinfou, Morocco, during SAMUM 2006. Tellus Ser. B-Chem. Phys. Meteorol 61, 32–50, doi: 10.1111/j.16000889.2008.00385.x (2009). [DOI] [Google Scholar]
- 44.Dufresne JL, Gautier C, Ricchiazzi P & Fouquart Y Longwave scattering effects of mineral aerosols. J. Atmos. Sci 59, 1959–1966, doi: (2002). [DOI] [Google Scholar]
- 45.Zhao C et al. Uncertainty in modeling dust mass balance and radiative forcing from size parameterization. Atmospheric Chemistry and Physics 13, 10733–10753, doi: 10.5194/acp-13-10733-2013 (2013). [DOI] [Google Scholar]
- 46.Ginoux P Effects of nonsphericity on mineral dust modeling. J. Geophys. Res.-Atmos 108, 4052, doi: 10.1029/2002jd002516 (2003). [DOI] [Google Scholar]
- 47.Perlwitz JP, Garcia-Pando CP & Miller RL Predicting the mineral composition of dust aerosols - Part 1: Representing key processes. Atmospheric Chemistry and Physics 15, 11593–11627 (2015). [Google Scholar]
- 48.Scanza R et al. Modeling dust as component minerals in the Community Atmosphere Model: development of framework and impact on radiative forcing. Atmos. Chem. Phys 15, 537–561 (2015). [Google Scholar]
- 49.Chou C et al. Size distribution, shape, and composition of mineral dust aerosols collected during the African Monsoon Multidisciplinary Analysis Special Observation Period 0: Dust and Biomass-Burning Experiment field campaign in Niger, January 2006. J. Geophys. Res.-Atmos 113, D00c10, doi: 10.1029/2008jd009897 (2008). [DOI] [Google Scholar]
- 50.Mätzler C MATLAB Functions for Mie Scattering and Absorption. (Institut für Angewandte Physik, Bern, Switzerland, 2002). [Google Scholar]
- 51.Gillette DA, Blifford IH & Fenster CR Measurements of aerosol size distributions and vertical fluxes of aerosols on land subject to wind erosion. J. Appl. Meteor 11, 977–987 (1972). [Google Scholar]
- 52.Gillette DA On the production of soil wind erosion having the potential for long range transport. J. Rech. Atmos 8, 734–744 (1974). [Google Scholar]
- 53.Gillette DA, Blifford IH & Fryrear DW Influence of wind velocity on size distributions of aerosols generated by wind erosion of soils. Journal of Geophysical Research 79, 4068–4075 (1974). [Google Scholar]
- 54.Fratini G, Ciccioli P, Febo A, Forgione A & Valentini R Size-segregated fluxes of mineral dust from a desert area of northern China by eddy covariance. Atmospheric Chemistry and Physics 7, 2839–2854 (2007). [Google Scholar]
- 55.Sow M, Alfaro SC, Rajot JL & Marticorena B Size resolved dust emission fluxes measured in Niger during 3 dust storms of the AMMA experiment. Atmospheric Chemistry and Physics 9, 3881–3891 (2009). [Google Scholar]
- 56.Shao Y, Ishizuka M, Mikami M & Leys JF Parameterization of size-resolved dust emission and validation with measurements. J. Geophys. Res.-Atmos 116, D08203, doi: 10.1029/2010jd014527 (2011). [DOI] [Google Scholar]
- 57.Rosenberg PD et al. Quantifying particle size and turbulent scale dependence of dust flux in the Sahara using aircraft measurements. J. Geophys. Res.-Atmos 119, 7577–7598, doi: 10.1002/2013jd021255 (2014). [DOI] [Google Scholar]
- 58.Kok JF Does the size distribution of mineral dust aerosols depend on the wind speed at emission? Atmospheric Chemistry and Physics 11, 10149–10156, doi: 10.5194/acp-11-10149-2011 (2011). [DOI] [Google Scholar]
- 59.Denjean C et al. Size distribution and optical properties of African mineral dust after intercontinental transport. J. Geophys. Res.-Atmos 121, 7117–7138, doi: 10.1002/2016jd024783 (2016). [DOI] [Google Scholar]
- 60.Reid JS et al. Dynamics of southwest Asian dust particle size characteristics with implications for global dust research. J. Geophys. Res.-Atmos 113, D14212, doi: 10.1029/2007jd009752 (2008). [DOI] [Google Scholar]
- 61.Yue X, Wang H, Wang Z & Fan K Simulation of dust aerosol radiative feedback using the Global Transport Model of Dust: 1. Dust cycle and validation. J. Geophys. Res.-Atmos 114, doi: 10.1029/2008jd010995 (2009). [DOI] [Google Scholar]
- 62.Kok JF, Albani S, Mahowald NM & Ward DS An improved dust emission model - Part 2: Evaluation in the Community Earth System Model, with implications for the use of dust source functions. Atmospheric Chemistry and Physics 14, 13043–13061, doi: 10.5194/acp-14-13043-2014 (2014). [DOI] [Google Scholar]
- 63.Liu X et al. Uncertainties in global aerosol simulations: Assessment using three meteorological data sets. J. Geophys. Res.-Atmos 112, doi: 10.1029/2006jd008216 (2007). [DOI] [Google Scholar]
- 64.Liu J, Mauzerall DL, Horowitz LW, Ginoux P & Fiore AM Evaluating inter-continental transport of fine aerosols: (1) Methodology, global aerosol distribution and optical depth. Atmos. Environ 43, 4327–4338, doi: 10.1016/j.atmosenv.2009.03.054 (2009). [DOI] [Google Scholar]
- 65.Silverman BW Density estimation for statistics and data analysis. (Chapman and Hall, 1986). [Google Scholar]
Associated Data
This section collects any data citations, data availability statements, or supplementary materials included in this article.