

Abstract
In coming decades, warmer winters are likely to ease range constraints on many cold-limited forest insects1–5. Recent unprecedented expansion of the southern pine beetle (SPB, Dendroctonus frontalis) into New Jersey, New York, and Connecticut in concert with warming annual temperature minima highlights the risk that this insect pest poses to the pine forests of the northern United States and Canada under continued climate change6. Here we present projections of northward expansion in SPB-suitable climates using a statistical bioclimatic range modeling approach and current-generation general circulation model (GCM) output under the Representative Concentration Pathway (RCP) 4.5 and 8.5 emissions scenarios. Our results show that by the middle of the 21st century, the climate is likely to be suitable for SPB expansion into vast areas of previously unaffected forests throughout the northeastern United States and into southeastern Canada. This scenario would pose a significant economic and ecological risk to the affected regions, including disruption of local ecosystem services7, shifts in forest structure8, and threats to native biodiversity9.
SPB is a major forest pest in the southeastern United States responsible for 14 million m3 of timber losses worth an estimated US$1.7 billion over 1990–200410. SPB has historically been most damaging in southeastern states, with limited activity in the northern portion of its range including Ohio, Pennsylvania, and Maryland. However, SPB outbreaks have become increasingly problematic and extensive in southern New Jersey since 2001, and populations have been detected for the first time on Long Island, New York, in 2014 and in Connecticut in 20156,11.
A link between SPB outbreaks and winter cold extremes has long been recognized12, and minimum air temperatures between −14 and −20°C have been observed to cause critical overwintering mortality in SPB4,13,14. The recent northward expansion of SPB has occurred amidst regionally warming winters and decreasing incidences of cold extremes15. Since mean annual temperatures in the northeastern United States are projected to rise by 2–6°C by 210015, with possibly larger increases in winter cold extremes16,17, the climatic constraints limiting SPB incursion further into northern pine forests will likely recede dramatically in the coming decades. Here we present a projected timeline for the expansion of SPB-suitable climates in eastern North America under continued climate change through 2090.
Previous modelling experiments of SPB range expansion under climate change have used statistical and physiological relationships between SPB outbreaks and weather established within the historic range, assuming that these relationships hold at the expansion frontier, and have applied uniform climatic perturbations that overlook the temporal complexity and spatial heterogeneity of projected warming4,5. In this study, we address these shortcomings by developing a statistical model linking recent SPB range expansion to changing incidence of cold extremes, and by using spatially-explicit current-generation GCM projections.
We also robustly analyze the sources and magnitudes of uncertainty in this timeline of expansion. In climate prediction, there are generally three components of total uncertainty: internal variability (natural stochastic climate variability), inter-GCM variability (resulting from differences in construction between GCMs), and scenario uncertainty (due to variation between plausible future emissions scenarios). Our phloem temperature model, which simulates thermal inertia of tree stems, introduces an additional source of uncertainty related to the thermal buffering coefficient, the K-value, which depends on tree diameter (see Methods). Uncertainty estimation in past projections of insect range expansion under climate change has examined only variable emissions scenarios, ignoring other sources of uncertainty1–3. While inter-model variability and scenario uncertainty are technically reducible, internal variability is fundamentally irreducible and therefore defines the theoretical minimum uncertainty in estimated timelines of SPB-suitable climate expansion (see Supplementary Information). In this study, we estimate the proportion of total uncertainty in our projections arising from various sources to understand its potential reducibility and role in informing adaptive management decisions (e.g. prescribed fire, forest harvesting18).
SPB’s spread across southern New Jersey has occurred amid a warming trend: for example, the −10°C winter minimum phloem temperature isotherm has migrated northwards by 0.6° latitude (~65km) per decade since 1980 (P<0.01) (Fig. 1a). Meanwhile, the latitude of the northernmost SPB sighting has drifted north by 0.8° latitude (~85km) per decade since 2002 (P=0.01). Inter-annual north-south variation in SPB’s northern range frontier only weakly correspond to extreme temperature minima (Fig. 1a) and likely depend on ecological factors of less consequence to longer-term changes including forest conditions, host-tree vigor, and predator dynamics19. SPB is absent in all New Jersey grid cells experiencing phloem temperatures less than −16°C (corresponding to air temperatures of −18 to −20°C) (Fig. 1b), substantiating a lethal minimum temperature constraint on SPB. Our estimate of this limiting temperature concurs with past estimates within SPB’s historical range4, suggesting that recent range expansion is because of warming and not plasticity in the cold tolerance of northern SPB populations13.
Figure 1: Spatial correspondence between recent SPB expansion and warming annual minimum phloem temperatures.
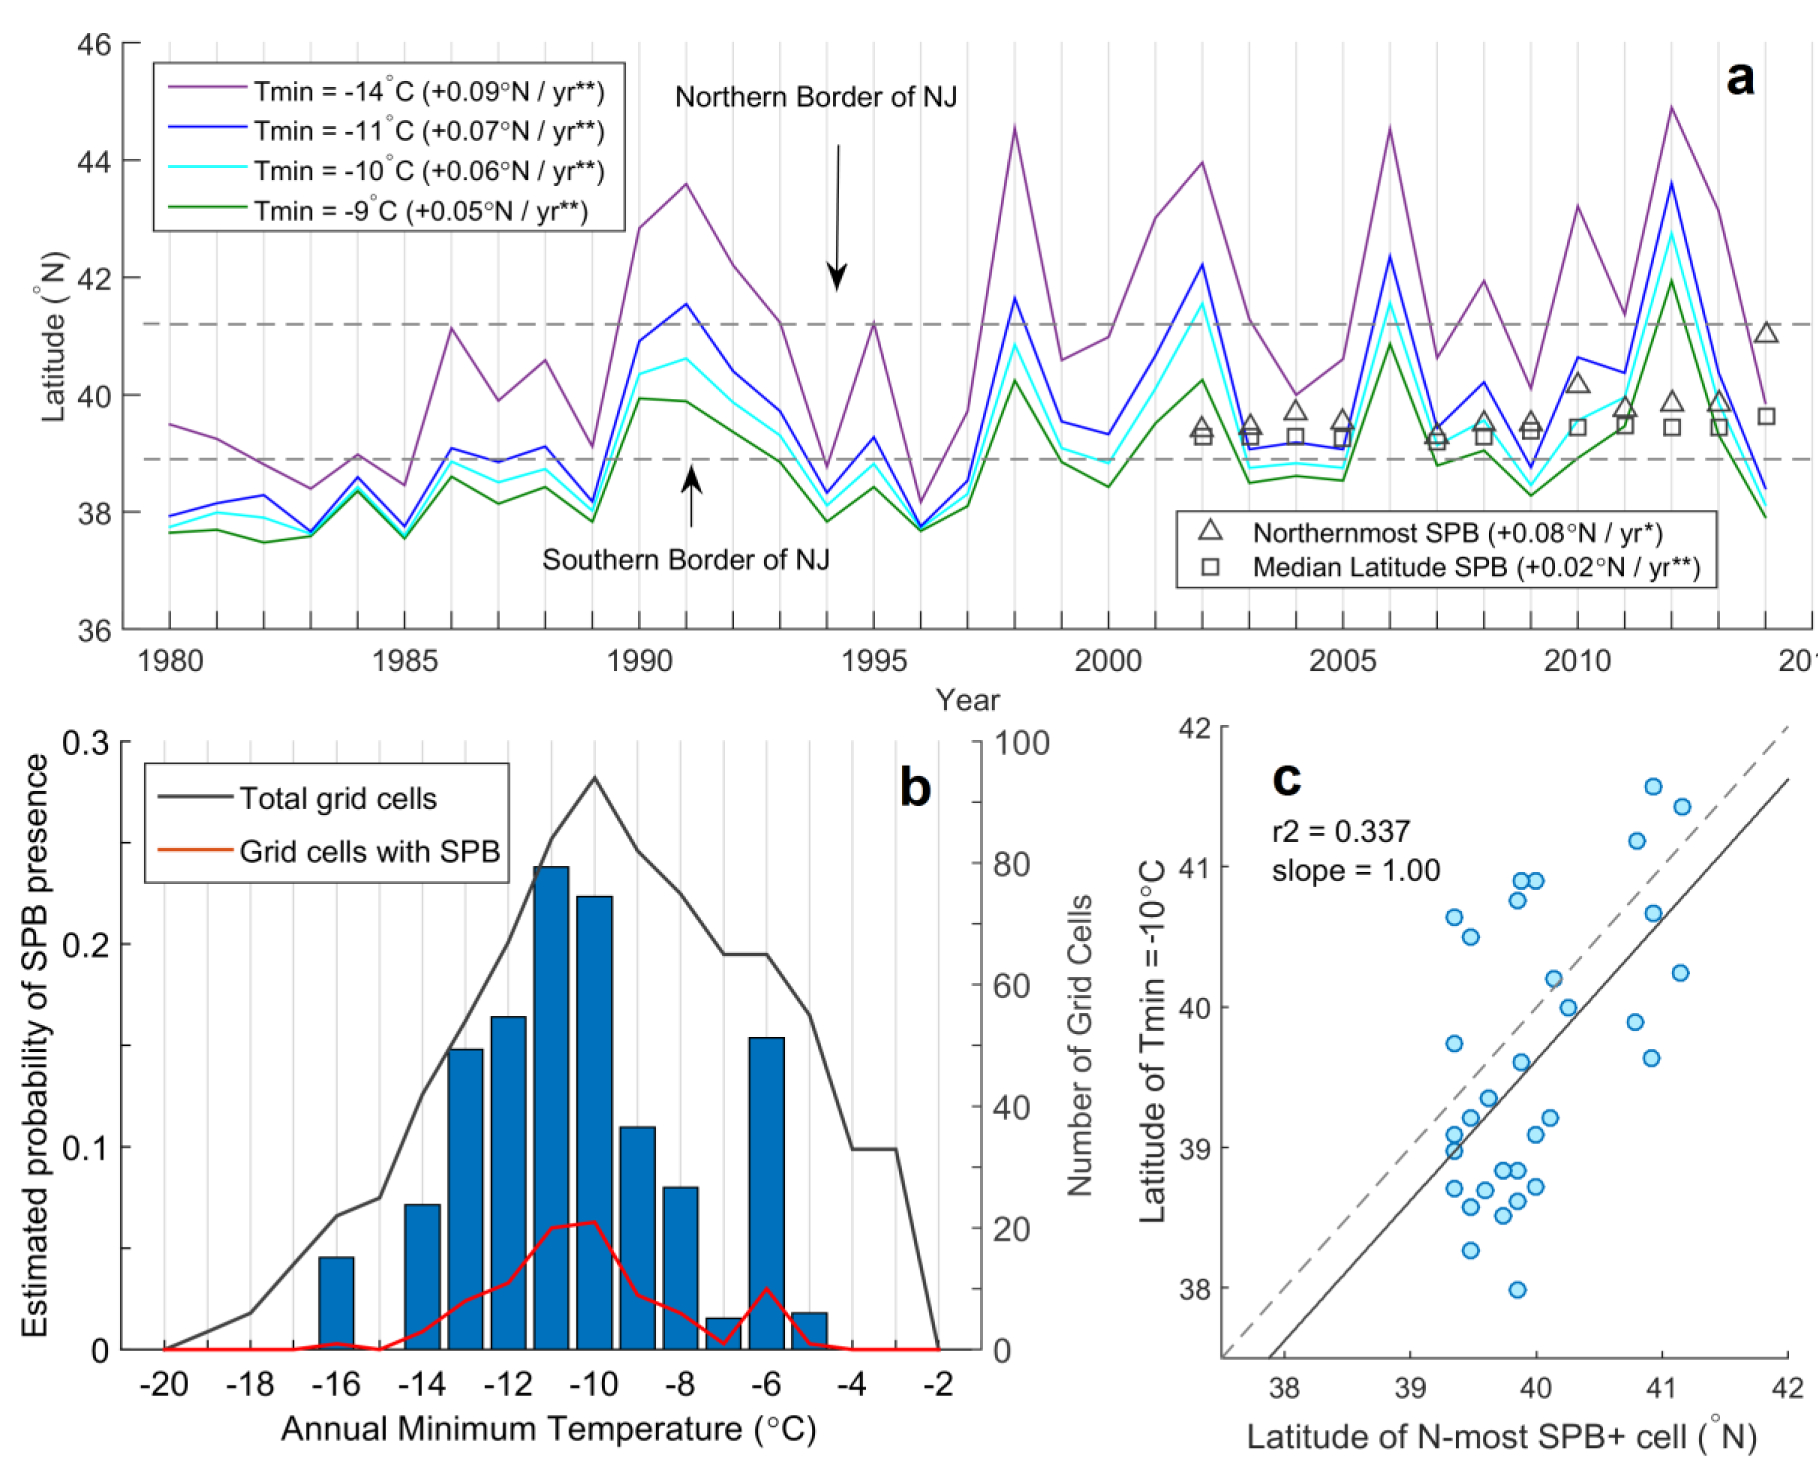
(a) Southernmost latitudes of occurrence for various minimum winter phloem temperatures over 1980–2014 (solid lines), maximum (triangles) and median (squares) latitude of SPB presence across New Jersey over 2002–2014 (no data for 2006). Linear trends in latitudes are shown in legends (double asterisks denote P<0.01, single asterisks denote P<0.05). (b) Total cells (black line), cells with SPB presence (red line), and estimated probability of SPB presence (bars) over 1°C annual minimum phloem temperature bins. Data are aggregated across New Jersey over 2002–2014. (c) Latitude of northernmost SPB-positive grid cell versus southernmost latitude of critical phloem temperature at corresponding longitudes over 2002–2014 for the range-predicting temperature of −10°C (n=36). The one-to-one relationship is shown in dashes.
Among a series of candidate range-predicting minimum phloem temperatures, we found that the latitude of the −10°C-isotherm best correlated with the latitude of the northernmost SPB occurrence across 6 longitudinal bins (r2 = 0.34, Fig. 1c, Supplementary Fig. 2, Supplementary Table 3). This temperature exceeded the lethal limit of −16°C, likely because low beetle survival at or below −16°C reduced the likelihood of a sighting. We therefore designated the year after which winter minimum phloem temperatures remain above −10°C for ten consecutive years as the year of emergence of a SPB-suitable climate. This ten-year window can be applied consistently to each annual time step over 2006–2080 (see Supplementary Information).
Based on the 27-GCM mean (Supplementary Table 1), we project increases in annual minimum air temperature of 3.5–7.5°C for RCP 4.5 and 8.5 across the northeastern United States and southeastern Canada by 2050–2070, with annual minimum phloem temperatures rising by a slightly smaller 3.0–7.0°C (Supplementary Fig. 3). These projections are consistent with other studies using CMIP516 and other model suites17. Given this warming trend and our criteria for SPB-suitable climates, vast areas across the northeastern United States and southern Ontario and Quebec are projected to become climatically hospitable to SPB populations before 2080 (Fig. 2a), according to multi-run mean projections. We project sufficient warming for the establishment of SPB along the Atlantic coast to Nova Scotia before 2020, and from southern New England through Wisconsin between 2040 and 2060 (Fig. 2a). The projected years of emergence for areas already affected by SPB in New Jersey and New York agree with observations. These results are relatively robust to alternative range-predicting temperatures (Fig. 3, see Methods).
Figure 2: Projected year of emergence of an SPB-suitable climate, defined as the year for which minimum phloem temperature of −10°C is not reached in the following decade.

(a) mean of full set of 162 model runs (27 GCMs, two emissions scenarios, and three K-values); (b) 25th percentile of the full set; (c) same as (b) but for the 75th percentile; (d) minimum of internal variability range across 60 runs (10 CSIRO-MK3 ensemble members, two emissions scenarios, and three K-values); (e) same as (d) but for the maximum.
Figure 3: Projected year of emergence of SPB-suitable climate using alternative definitions of SPB-suitability.

Next-best range-predicting temperatures of (a) −9°C and (b) −11°C, and (c) the lethal temperature of −16°C. Results are presented as differences compared to main results using −10°C (Figure 2). Stippling indicates grid cells for which results are highly robust (difference <5 years across all alternative definitions).
There is considerable uncertainty in the above multi-run mean results. Among 162 model runs using differing GCMs, emissions scenarios, and K-values (see Methods), the earliest projected year of emergence differs from the latest by 43 years (Fig. 2b–c). To understand the origin of this uncertainty, we estimated the proportion of total uncertainty arising from the four sources (Fig. 4a): internal variability (12%), emissions scenario (13%), inter-GCM (58%), and K-value (17%). While uncertainty from internal variability is theoretically fully irreducible and comprises a plurality of total uncertainty in some areas (Fig. 4b), the emissions scenario and inter-GCM portions are effectively irreducible in the near term (see Supplementary Information). This finding suggests that forest managers should consider the range of plausible years of emergence in setting adaptation priorities and strategies.
Figure 4: Drivers of uncertainty in projected year of emergence of SPB suitable climates.

(a) Estimated partitioning of total year of emergence uncertainty into its four components: internal variability (dark blue), differences between GCMs (light blue), emissions scenarios (RCP, green), and K-values (yellow). (b) Estimated percentage of the total uncertainty resulting from internal variability across the study region, ranging from 10–50% among non-coastal grid-cells. Although reduction of all sources of uncertainty is technically challenging, uncertainty due to internal variability is theoretically irreducible and therefore unavoidable in setting adaptation priorities and strategies (see Supplementary Information).
In addition to sufficiently mild winters, SPB requires suitable host tree species with sufficient areal density to survive in a given location. To identify where and when SPB-suitable climates coincide with SPB-susceptible forests, we mapped the ranges of forest types defined by dominant pine species alongside isolines representing multi-run mean years of SPB-suitable climate emergence across the study region (Fig. 5a). These forest type ranges are expected to shift under climate change20, but because projected changes in dominant species are small through 210021, we approximated them as static in our analysis. We also mapped the basal area density of the various pine species over the study region to identify pine-sparse areas that may inhibit further SPB spread (Fig. 5b).
Figure 5: Projected SPB expansion into ranges of forests with suitable dominant pine species.

(a) Lines of equal year of emergence of SPB-suitable climate (black lines) and ranges of forest types defined by dominant pine species across the northeastern U.S. and southeastern Canada. Climates suitable for SPB are projected to reach 78% of previously unaffected North American pitch pine (red, Pinus rigida) forests by 2050, and 71% of red pine (green, P. resinosa) and 48% of jack pine (blue, P. banksiana) forests by 2080. (b) Aggregate basal area density (m2/ha) of selected Pinus species across the northeastern United States. SPB has already dispersed across large areas of low pine density along its expansion trajectory.
By 2050, 78% of the 124,000 km2 range of pitch pine (Pinus rigida) forests extending from southern Maine to eastern Ohio are projected to feature newly-SPB suitable climates. This forest ecosystem is particularly vulnerable to SPB and has already suffered unprecedented widespread tree mortality in New Jersey and New York6,11. Our projections demonstrate a significant risk to pitch pine forests within 35 years, including broad disruption of local ecosystem services7, shifts in forest structure8, and threats to native biodiversity9.
By 2080, we project that SPB-suitable climates will reach 71% of the red pine (P. resinosa) and 48% of jack pine (P. banksiana) forest ranges that extend across more than 706,000 km2 in the northeastern United States northwards through subarctic Canada (Fig. 5a). It is uncertain whether SPB will thrive in forests dominated by these pine species. However, SPB is highly polyphagous among pine species in its historical range22, and tree attacks have recently been documented for the first time in red and white (P. strobus) pines on Long Island, New York and Connecticut (personal communication). Although successful reproduction of SPB in white pine has not yet been documented, a moderate density of more suitable pitch and red pine across the region may provide a pathway for expansion (Supplementary Fig. 6, see Supplementary Information).
Pine-sparse hardwood forests in the northern United States may present a barrier to continued SPB dispersal into the red and jack pine forests further north. However, SPB has already traversed large pine-sparse regions in the eastern United States, and forests further north feature a higher, more continuous density of pine (Fig. 5b). The Great Lakes pine forests are separated to the south and east by a larger pine-sparse zone. Our projections indicate that the pine-dense Canadian forests north of the Great Lakes will become climatically suitable by 2050–2080, opening a plausible route for SPB spread to these forests (Fig. 5a).
Although SPB has already been detected in western Connecticut in 2015, we project these areas to be climatically suitable for SPB only after 2025. Long range SPB dispersal is poorly understood23 and may occur over greater distances than previously thought24 (e.g. 2010, Fig. 1a). These earlier-than-predicted sightings could reflect a tendency of SPB to disperse far beyond its climatically-constrained range22, as observed in New Jersey in 2014 (Fig. 1a), but fail to survive a subsequent winter and establish stable populations. In this case, our model might accurately project longer-term range expansion despite omitting shorter-term leaps. By contrast, sustained future SPB presence in these areas would suggest that our model underestimates the pace of expansion. Continued SPB monitoring will enable a rigorous assessment of this aspect of our model’s performance and further research into the relationship between long-term and intermittent range expansions.
Further ecological and climatological factors not simulated in our study, such as drought, fire, and community-level interactions, may affect future SPB range expansion. By mid-century, the northeastern United States is likely to experience elevated drought risk and 10–40 additional extreme heat days per year15. Some forest types are more susceptible to attack by bark beetle when stressed by drought and extreme heat25; however, the link between drought and SPB may be weaker26 or more nuanced27 than for other beetle species. In contrast to some conifer-infesting beetles, SPB has not been strongly linked to natural or prescribed fire28. However this association may become clearer if fire regimes shift under climate change. Although SPB may encounter suppression by or release from predators and competitors in newly suitable areas, SPB’s primary predator (Thanasimus dubius) is widely distributed in eastern North America29 and has not strongly influenced recent expansion. Finally, while our analysis projects future change in SPB-suitable areas, the degree of SPB damage to forests depends on outbreak intensity, which is linked to climate, forest conditions and management, and SPB population dynamics18. Further monitoring and research are needed to understand how these factors may affect the regional impacts of SPB into the future (see Supplementary Information).
Our study reveals a plausible new threat from SPB to vast areas of pine forest in eastern North America by 2050 and into subarctic Canada after 2080 under continued climate change. Meaningful global greenhouse gas emissions mitigation can reduce the projected risks only after 2050, as projected warming is largely independent of emissions scenario for the coming few decades30. Further monitoring and research concerning the additional determinants of SPB range not simulated in our projections, such as the suitability of northern pine species and the role of drought, will improve the understanding of SPB’s implications for northern pine forests. Despite these uncertainties, our results suggest that the mounting threat posed by SPB to regional ecosystems, biodiversity, and economies is likely to become increasingly relevant to forestry managers and policy makers as climate change proceeds.
Methods
The dynamics of phloem heating and cooling in response to winter temperature variation is an important determinant of the minimum winter temperature that an overwintering SPB is exposed to. To simulate the thermal buffering of tree stems, we modeled phloem temperatures using a linear Newtonian heat flux model with thermal buffering coefficient values (K-values) representative of regional forest structure14. This phloem temperature model was used for both historical and projected future temperatures.
For the historical portion of our analysis, we drove the phloem temperature model using bias-corrected historical air temperature data with 30km grid resolution at 3-hourly intervals from North American Regional Reanalysis31 (see Supplementary Information). To identify the critical minimum phloem temperature for SPB in New Jersey, we mapped the presence or absence of SPB based on aerial pest detection surveys over 2002–201432 (data missing for 2006) onto the annual minimum phloem temperature grids. We then estimated the probability of SPB occurrence at minimum temperatures ranging from −20 to −2°C as the number of cells with SPB divided by the total number of cells with given minimum temperature. The probability of SPB occurrence dropped to 0 for all temperatures less than −16°C, indicating a lethal minimum temperature.
To select the phloem temperature that best predicted the northern range limit of SPB, we assessed a window of 7 candidate temperatures (−8 through −14°C) centered on the temperature of peak probability of SPB occurrence (−11°C). We collated 36 annual grid cells with active SPB populations across 6 longitudinal bins and for each cell observed the southernmost latitude at which each of seven candidate critical temperatures occurred at the cell’s longitude (to account for varying climates from coastal to interior New Jersey). We then fit linear trends to scatter plots of the latitude of northernmost SPB populations versus latitudes of the candidate minimum temperatures (Supplementary Fig. 2). A linear regression with slope of one, intercept of zero, and r2 of one would indicate perfect correspondence in space between the northern limit of SPB range and southernmost occurrence of that candidate minimum temperature (see Supplementary Information). We found that the critical temperature of −10°C best matched these criteria, with slope of 1.00, r2 = 0.34, and an intercept of ~0.4° of latitude (Fig. 1c, Supplementary Fig. 2, Supplementary Table 3, see Supplementary Information). Two other candidate temperatures (−9°C and −11°C) satisfied these criteria nearly as well, so we treated them as alternate plausible range-predicting temperatures in the sensitivity analysis.
Future daily phloem temperatures over 2006–2090 were projected independently for 27 CMIP5 GCMs33 under the RCP 4.5 and 8.5 emissions scenarios34 (Supplementary Table 1) in conjunction with the phloem temperature model. Model-specific mean temperature biases due to factors such as varying parameterization schemes and internal model dynamics ranged from 3–5°C relative to the NCEP reanalysis35. To correct these biases, we divided the daily maximum and minimum temperature distributions for NCEP reanalysis and each model into ten 10-percentile bins and corrected the mean bias between the model and the reanalysis for each bin17 (Supplementary Fig. 4). This method accounts for generally larger bias near the high and low tails (Supplementary Fig. 5). Residual biases were minimal except on the periphery of the study area.
Year of emergence of an SPB-suitable climate was estimated as the first year in which the critical minimum temperature of −10°C was not reached in the following decade. This ten-year window was chosen as it could be applied consistently to each annual time step over 2006–2080. We present the mean year of emergence across all −10°C runs in Fig. 2a. To examine the sensitivity of these multi-run mean results to varying plausible definitions for the emergence of SPB suitability, we recomputed the year of emergence projections for the next-best range predicting temperatures of SPB’s northern frontier (−9°C and −11°C, Fig. 3a–b). We also examined the results using the lethal minimum temperature of −16°C13 (Fig. 3c, Supplementary Information). The alternate results (Fig. 3) are presented as differences in the multi-run mean year of emergence from the −10°C result in Fig. 2a. Projections using the next-best predictors of SPB’s northern frontier (−9°C and −11°C, Fig. 3a–b) differed from those under the −10°C definition by ≤2 years on region-wide average, indicating low sensitivity of the results to alternative range-predicting temperatures. Projections based on the lethal minimum temperature (−16°C, Fig. 3c)13,14 as opposed to the range-predicting temperatures were 14 years earlier on region-wide average; these results may be considered an earliest plausible projected timeline of SPB emergence (see Supplementary Information).
Total uncertainty in the year of emergence projections was estimated by considering the full set of 162 model runs generated from the combination of 27 CMIP5 GCMs, two emissions scenarios (RCP4.5 & 8.5), and three K values. We presented the 25th and 75th percentiles of this full set as the central range of year of emergence results (Fig. 2b–c). To estimate the partitioning of the total uncertainty into its constituent sources, we employed two different methods. For the emissions scenario, GCM, and K-value sources, we estimated the percentage of uncertainty arising from each source as its year of emergence range over the year of emergence range of the full set (see Supplementary Information). For internal variability, we applied a similar method using a suite of 60 results based on a 10-member ensemble of the CSIRO-MK3 GCM36 driven by the 2 emissions scenarios and 3 K-values (Fig. 2d–e). We present these rescaled partitioned uncertainties in Fig. 4a, along with a map of the internal variability ratio in Fig. 4b (see Supplementary Information).
Lines of equal year of emergence were fit to the multi-run mean year of emergence maps and were manually smoothed in some areas to reduce implausible precision induced by the contour fitting algorithm, especially near coastal grid cells (Fig. 5a). Data on the spatial extent of pitch, red, and jack pine forests was obtained from the US Forest Service Forest Inventory and Analysis Program (Fig. 5a)37, and we mapped basal area density of pine species using a derived raster imputation basal area map also from the US Forest Service (Fig. 5b)38. The area of forest newly climatically suitable for SBP was calculated as the suitable area in 2050 (for pitch pine) or 2080 (for red and jack pine) minus the suitable area in 2007 (no jack or red pine forests were suitable for SPB in 2007).
Supplementary Material
Acknowledgements.
We acknowledge the World Climate Research Programme’s Working Group on Coupled Modelling, which is responsible for CMIP, and we thank the climate modeling groups for producing and making available their model output. For CMIP the U.S. Department of Energy’s Program for Climate Model Diagnosis and Intercomparison provides coordinating support and led development of software infrastructure in partnership with the Global Organization for Earth System Science Portals. U.S. Department of Interior Northeast Climate Science Center provided funding for this research along with support from the National Science Foundation grant DGE-11-44155.
Footnotes
Competing financial interests. The authors declare no competing financial interests.
Supplementary Methods is linked to the online version of the paper.
References
- 1.Paradis A, Elkinton J, Hayhoe K & Buonaccorsi J Role of winter temperature and climate change on the survival and future range expansion of the hemlock woolly adelgid (Adelges tsugae) in eastern North America. Mitig. Adapt. Strateg. Glob. Chang 13, 541–554 (2008). [Google Scholar]
- 2.Ogden NH et al. Climate change and the potential for range expansion of the Lyme disease vector Ixodes scapularis in Canada. Int. J. Parasitol 36, 63–70 (2006). [DOI] [PubMed] [Google Scholar]
- 3.Rochlin I, Ninivaggi DV, Hutchinson ML & Farajollahi A Climate Change and Range Expansion of the Asian Tiger Mosquito (Aedes albopictus) in Northeastern USA: Implications for Public Health Practitioners. PLoS One 8, 1–9 (2013). [DOI] [PMC free article] [PubMed] [Google Scholar]
- 4.Ungerer MJ, Ayres MP & Lombardero MJ Climate and the northern distribution limits of Dendroctonus frontalis Zimmermann (Coleoptera: Scolytidae). J. Biogeogr 26, 1133–1145 (1999). [Google Scholar]
- 5.Williams DW & Liebhold AM Climate change and the outbreak ranges of two North American bark beetles. Agric. For. Entomol 4, 87–99 (2002). [Google Scholar]
- 6.Dodds KJ & Krist F Destructive Southern Pine Beetle Begins Invading Northeastern Forests -- GIS Story Map. (2015). at <http://usfs.maps.arcgis.com/apps/MapTour/index.html?appid=3dfab0794d5e4f0f886590da8765f4f5.>
- 7.Mikkelson KM et al. Bark beetle infestation impacts on nutrient cycling, water quality and interdependent hydrological effects. Biogeochemistry 115, 1–21 (2013). [Google Scholar]
- 8.Harrington TB, Xu MG & Edwards MB Structural characteristics of late-successional pine-hardwood forest following recent infestation by southern pine beetle in the Georgia Piedmont, USA. Nat. Areas Journal 20, 360–365 (2000). [Google Scholar]
- 9.Wagner D, Nelson MW & Schweitzer DF Shrubland Lepidoptera of southern New England and southeastern New York: ecology, conservation, and management. For. Ecol. Manage 185, 95–112 (2003). [Google Scholar]
- 10.Pye JM, Price TS, Clarke SR & Huggett RJ A History of Southern Pine Beetle Outbreaks in the Southeastern United States through 2004. USFS Southern Research Station (2008).
- 11.USFS; Forest Health Highlights -- New Jersey Northeastern Area State and Private Forestry. (2014). [Google Scholar]
- 12.Beal JA Temperature Extremes as a Factor in the Ecology of the Southern Pine Beetle. J. For 31, 329–336 (1933). [Google Scholar]
- 13.Lombardero MJ, Ayres MP, Ayres BD & Reeve JD Cold tolerance of four species of bark beetle (Coleoptera : Scolytidae) in North America. Environ. Entomol 29, 421–432 (2000). [Google Scholar]
- 14.Trân JK, Ylioja T, Billings RF, Régnière J & Ayres MP Impact of minimum winter temperatures on the population dynamics of Dendroctonus frontalis. Ecol. Appl 17, 882–899 (2007). [DOI] [PubMed] [Google Scholar]
- 15.Horton R et al. Chapter 16: Northeast. Clim. Chang. Impacts United States Third Natl. Clim. Assess 371–395 (2014). [Google Scholar]
- 16.Sillmann J, Kharin VV, Zwiers FW, Zhang X & Bronaugh D Climate extremes indices in the CMIP5 multimodel ensemble: Part 2. Future climate projections. J. Geophys. Res. Atmos 118, 2473–2493 (2013). [Google Scholar]
- 17.Horton RM, Coffel ED, Winter JM, Bader DA & Al HET Projected changes in extreme temperature events based on the NARCCAP model suite. Geophys. Res. Lett 42, 1–10 (2015). [Google Scholar]
- 18.Nowak JT, Meeker JR, Coyle DR, Steiner CA & Brownie C Southern Pine Beetle Infestations in Relation to Forest Stand Conditions, Previous Thinning, Southern Pine Beetle Prevention Program. J. For 113, 1–9 (2015). [Google Scholar]
- 19.Ayres MP, Martinson SJ & Friedenberg NA in The Southern Pine Beetle Encyclopedia. 75–89 (USDA Forest Service Southern Research Station, 2011). [Google Scholar]
- 20.Iverson LR & Mckenzie D Tree-species range shifts in a changing climate : detecting, modeling, assisting. Landsc. Ecol 28, 879–889 (2013). [Google Scholar]
- 21.Wang WJ, He HS, Thompson FR, Jacob III & Dijak WD Changes in forest biomass and tree species distribution under climate change in the northeastern United States. Landsc. Ecol 1–15 (2016). doi: 10.1007/s10980-016-0429-z [DOI] [Google Scholar]
- 22.Thatcher RC, Searcy JL, Coster JE & Hertel GD The Southern Pine Beetle (United States Forest Service Science and Edcuation Administration, 1980). [Google Scholar]
- 23.Turchin P & Thoeny WT Quantifying Dispersal of Southern Pine Beetles With Mark Recapture Experiments and a Diffusion-Model. Ecol. Appl 3, 187–198 (1993). [DOI] [PubMed] [Google Scholar]
- 24.Jackson PL, Straussfogel D, Lindgren BS, Mitchell S & Murphy B Radar observation and aerial capture of mountain pine beetle, Dendroctonus ponderosae Hopk. ( Coleoptera : Scolytidae ) in flight above the forest canopy. Can. J. For. Res 38, 2313–2327 (2008). [Google Scholar]
- 25.Berg EE, David Henry J, Fastie CL, De Volder AD & Matsuoka SM Spruce beetle outbreaks on the Kenai Peninsula, Alaska, and Kluane National Park and Reserve, Yukon Territory: Relationship to summer temperatures and regional differences in disturbance regimes. For. Ecol. Manage 227, 219–232 (2006). [Google Scholar]
- 26.Kolb TE et al. Observed and anticipated impacts of drought on forest insects and diseases in the United States. For. Ecol. Manage 380, 321–334 (2016). [Google Scholar]
- 27.Lorio PL, Stephenb FM & Paine TD Environment and ontogeny modify loblolly pine response to induced acute water deficits and bark beetle attack. 73, (1995). [Google Scholar]
- 28.Sullivan BT, Fettig CJ, Otrosina WJ, Dalusky MJ & Berisford CW Association between severity of prescribed burns and subsequent activity of conifer-infesting beetles in stands of longleaf pine. For. Ecol. Manage 185, 327–340 (2003). [Google Scholar]
- 29.Wolcott AB Catalogue of North American beetles of the family Cleridae Fieldiana Zoology (Chicago Natural History Museum, 1947). [Google Scholar]
- 30.Collins M et al. in Intergovernmental Panel on Climate Change, Working Group I Contribution to the IPCC Fifth Assessment Report (AR5)(Cambridge Univ Press, New York: ) (Stocker TF et al. ) (Cambridge University Press, 2013). [Google Scholar]
- 31.Mesinger F et al. North American Regional Reanalysis. Bull. Am. Meteorol. Soc 87, 343–360 (2006). [Google Scholar]
- 32.USFS. Forest Health Protection and its partners. 2015.
- 33.Taylor KE, Stouffer RJ & Meehl G. a. An Overview of CMIP5 and the Experiment Design. Bull. Am. Meteorol. Soc 93, 485–498 (2012). [Google Scholar]
- 34.Moss RH et al. The next generation of scenarios for climate change research and assessment. Nature 463, 747–56 (2010). [DOI] [PubMed] [Google Scholar]
- 35.Kanamitsu M et al. NCEP–DOE AMIP-II Reanalysis (R-2). Bull. Am. Meteorol. Soc 83, 1631–1643 (2002). [Google Scholar]
- 36.Gordon H, et al. The CSIRO Mk3 Climate System Model. CSIRO Atmos. Res. Tech. Pap 60, (2002). [Google Scholar]
- 37.USFS; Forest Inventory and Analysis National Program. (2015). at <http://www.nrs.fs.fed.us/fia/data-tools/state-reports/> [Google Scholar]
- 38.Wilson BT, Lister AJ, Riemann RI & Griffith DM Live tree species basal area of the contiguous United States (2000–2009). (2013). [Google Scholar]
Associated Data
This section collects any data citations, data availability statements, or supplementary materials included in this article.