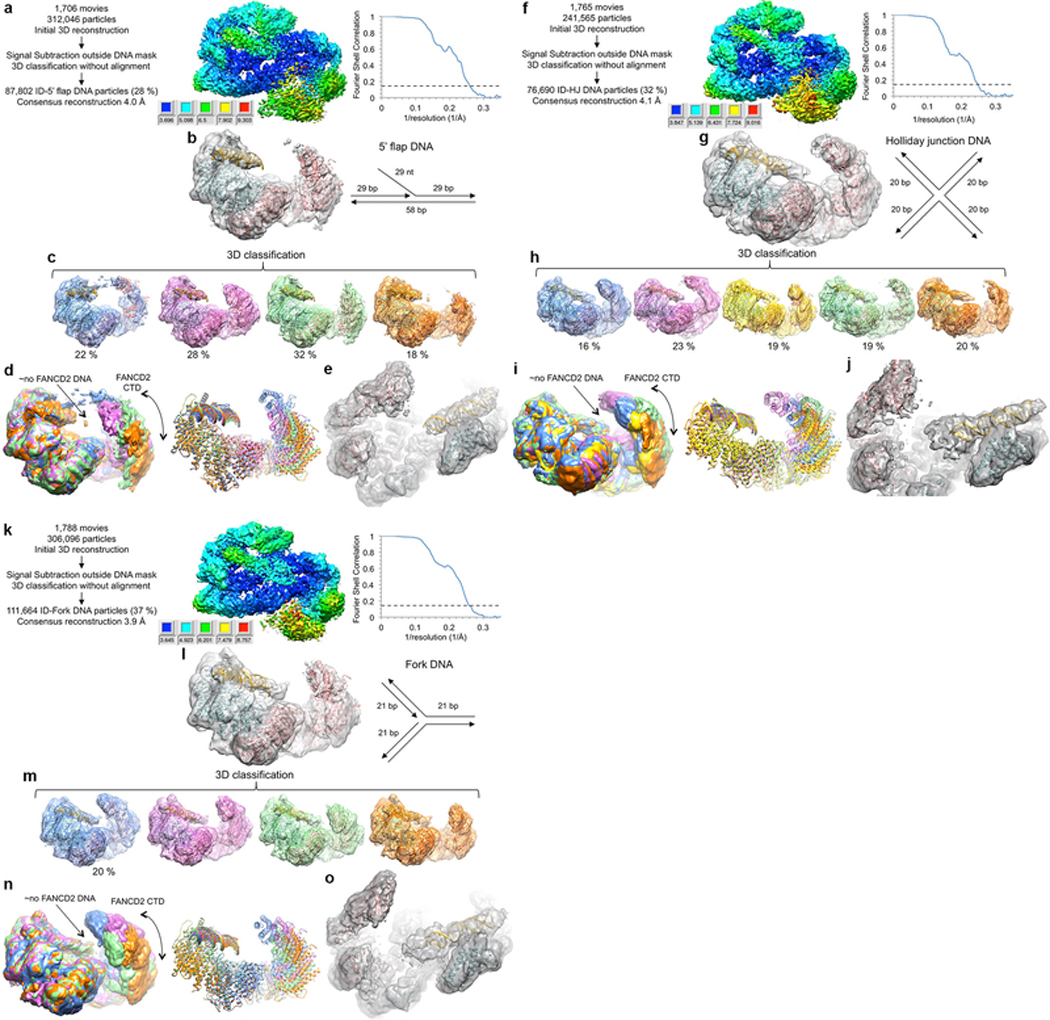
Extended Data Figure 5 |. Cryo-EM reconstructions of the non-ubiquitinated ID complex bound to 5’ flap DNA, Holliday junction DNA, and replication fork DNA.

a, Flow chart of single particle cryo-EM data processing. The consensus reconstruction map, temperature-factor sharpened and masked, is colored by local resolution estimated with the RELION3 postprocess program. Graph on the right shows gold-standard FSC plot between two independently refined half-maps for the consensus reconstruction with 87,802 particles. Dashed line marks the FSC cutoff of 0.143 that the FSC curve intersects at 4.0 Å. b, Cryo-EM map from the consensus reconstruction without temperature-factor sharpening. Also shown are cartoon representations of the FANCI (cyan), FANCD2 (pink) and FANCI-bound dsDNA (gold) from the ID-ICL DNA complex rigid-body fitted as multiple domains into the map. Schematic of the 5’ flap DNA is shown to the right of the map. c, 3D classification of the particles showing the conformational flexibility of FANCD2. Maps shown are after the particles from each 3D class were further refined in RELION to 4.7, 4.3, 4.3 and 4.9 Å, respectively. The maps are without temperature-factor sharpening to make the DNA easier to see. The ID complex and dsDNA, rigid body fitted into each map are also shown. d, The five 3D classes are superimposed by aligning the FANCI-portion of each map (left), or of each pdb (right) colored as in c. The lack of FANCD2-bound dsDNA is indicated by the label “ño FANCD2 DNA”. The density of the FANCD2 CTD is significantly weaker and flatter than the similarly calculated maps of the of the ID-ICL DNA complex. The curved arrow indicates the motion suggested by the 3D classification. In the most compact class (blue map), there is density extending from the FANCD2 CTD to the FANCI CTD. While we could not improve this density due to the limited number of particles, it suggests that the flexibility of the FANCD2 CTD may be important for the closing of the structure on ubiquitination. e, Close-up view of the best 3D class (pink in c) after 3D refinement of the particles prior to post processing. Orientation is similar to Figure 1c in the main text. Neither this map nor those of the other 3D classes have any evidence for a localized fork junction or for the 5’ ssDNA flap, suggesting the 5’ flap DNA binds to FANCI in multiple registers with no specificity for the junction. f, Flow chart of cryo-EM data processing for the ID complex bound to Holliday junction DNA. The consensus reconstruction map, temperature-factor sharpened and masked, is colored by local resolution estimated with the RELION3 postprocess program. Right graph shows the gold-standard FSC plot between two independently refined half-maps for the consensus reconstruction with 76,690 particles, with an FSC value of 0.143 (dashed line) at 4.1 Å. g, Cryo-EM map from the consensus reconstruction prior to post processing. Also shown are cartoon representations of the FANCI (cyan), FANCD2 (pink) and FANCI-bound dsDNA (gold) from the ID-ICL DNA complex rigid-body fitted into the map. Schematic of the Holliday junction DNA used is shown to the right of the map. h, 3D classification of the particles showing the conformational flexibility of FANCD2. Maps shown are after the particles from each 3D class were further refined in RELION to 6.9, 4.7, 6.6, 4.7 and 6.5 Å, respectively. The maps are without temperature-factor sharpening. The ID complex and dsDNA, rigid body fitted into each map are also shown. i, The five 3D classes are superimposed by aligning the FANCI-portion of each map (left), or of each pdb (right) colored as in h. j, Close-up view of the best 3D class (green in h) after 3D refinement of the particles prior to post processing. Unlike the map with the 5’ flap DNA, this map shows some bifurcation at one end of the duplex suggestive of the presence of the Holliday junction at a preferred location. This may be due to its shorter duplexes of 20 bp being just long enough to fill the FANCI groove. k, Cryo-EM data processing flow chart of ID bound to replication fork DNA. The consensus reconstruction map, temperature-factor sharpened and masked, is colored by local resolution estimated with the RELION3 postprocess program. The graph on the right shows the gold-standard FSC plot between two independently refined half-maps for the consensus reconstruction with 111,664 particles, with an FSC value of 0.143 (dashed line) at 3.9 Å. l, Cryo-EM map from the consensus reconstruction prior to post processing. Also shown are cartoon representations of the FANCI (cyan), FANCD2 (pink) and FANCI-bound dsDNA (gold) from the ID-ICL DNA complex rigid-body fitted into the map. Schematic of the replication fork DNA used is shown to the right of the map. m, 3D classification of the particles showing the conformational flexibility of FANCD2. Maps shown are after the particles from each 3D class were further refined in RELION to 4.8, 4.7, 4.6 and 4.4 Å, respectively. The maps are without temperature-factor sharpening. The ID complex and dsDNA, rigid body fitted into each map are also shown. n, The five 3D classes are superimposed by aligning the FANCI-portion of each map (left), or of each pdb (right) colored as in m. o, Close-up view of the best 3D class (orange in m) after 3D refinement of the particles prior to post processing.
