Abstract
Triglycerides (triacylglycerols, TGs) store metabolic energy in organisms and have industrial uses for foods and fuels. Excessive accumulation of TGs in humans causes obesity and is associated with metabolic diseases1. TG synthesis is catalyzed by acyl-CoA:diacylglycerol acyltransferase (DGAT) enzymes2–4 whose structures and catalytic mechanisms are unknown. Here we determined the structure of dimeric human DGAT1, a member of the membrane-bound O-acyltransferase (MBOAT) family, by cryo-electron microscopy at 3.0-Å resolution. DGAT1 forms a homodimer through N-terminal segments and a hydrophobic interface, with putative active sites within the membrane region. A structure obtained with oleoyl-CoA substrate resolved at 3.2-Å shows that the CoA moiety binds DGAT1 on the cytosolic side and the acyl group lies deep within a hydrophobic channel, positioning the acyl-CoA thioester bond near an invariant catalytic histidine residue. The reaction center is located inside a large cavity, which opens laterally to the membrane bilayer, providing lipid access to the active site. A lipid-like density, possibly an acyl-acceptor molecule, is located within the reaction center, orthogonal to acyl-CoA. Insights provided by the DGAT1 structures, together with mutagenesis and functional studies, give rise to a model of catalysis for DGAT’s generation of TGs.
The TG biosynthesis pathway was elucidated nearly 60 years ago5, and the DGAT enzymes were identified ~20 years ago2–4. Mammalian TG synthesis is catalyzed by DGAT1 (Extended Data Fig. 1a) and DGAT2 enzymes belonging to different protein families with distinct predicted membrane topologies6. Both enzymes utilize fatty acyl-CoA and diacylglycerol (DAG) substrates, although DGAT1 has a broader acyl-acceptor substrate specificity (Extended Data Fig. 1a)7. DGAT1 and DGAT2 have distinct roles in cells8 and physiology9,10, but together account for most mammalian TG synthesis11. Despite these insights, the enzymatic mechanism of TG synthesis has been unknown.
We investigated DGAT1, a member of the MBOAT family, which includes enzymes that acylate proteins (e.g., ghrelin, Wnt, hedgehog) or lipids (e.g., DAG, sterols)12. DGAT1 is a polytopic ER membrane protein2,13 with a conserved histidine (His415 in human DGAT1) that is likely involved in catalysis13–16. Recently, a crystal structure for a prokaryotic MBOAT, DltB, was reported17. However, DtlB catalyzes the transfer of an alanyl moiety to teichoic acid, and therefore its structure provides limited insights into the mechanism of lipid acylating MBOATs.
Structure determination of human DGAT1
We determined the DGAT1 molecular structure by cryo-electron microscopy (cryo-EM). Human DGAT1 was purified in digitonin, and gel-filtration chromatography revealed two DGAT1-containing peaks, presumably representing different oligomeric states (Extended Data Fig. 1b–c). Initial studies of the major peak (peak 2 in Extended Data Fig. 1b) failed to yield high-resolution structures. We therefore reconstituted DGAT1 from the two peak fractions (Extended Data Fig. 1b–c) into PMAL-C8 amphipol (Extended Data Fig. 1d–f). Gel-filtration analysis revealed that the reconstituted DGAT1 also displayed two peaks (red and blue arrows, Extended Data Fig. 1d). The later elution peak was found to be DGAT1 dimers; the earlier peak likely represented DGAT1 tetramers (Extended Data Fig. 1g), which were previously observed13,14. These two DGAT1 populations showed comparable activities (Extended Data Fig. 1f).
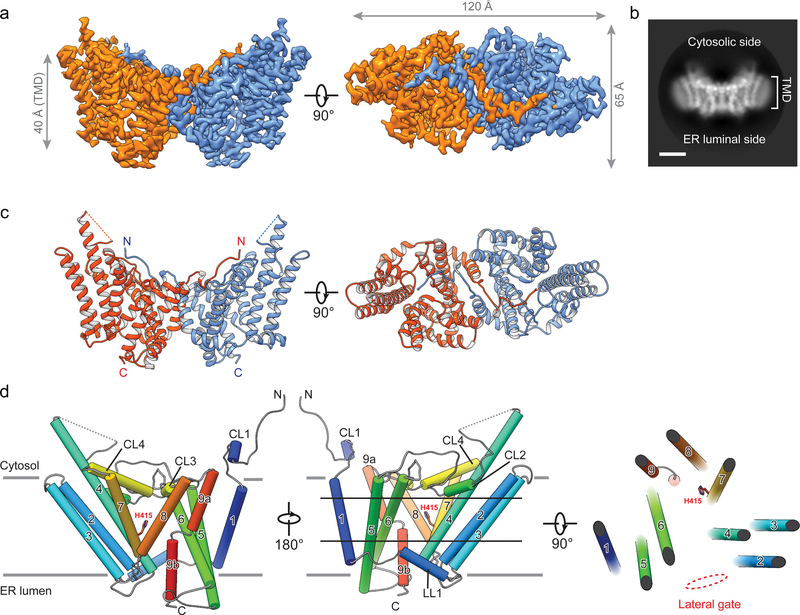
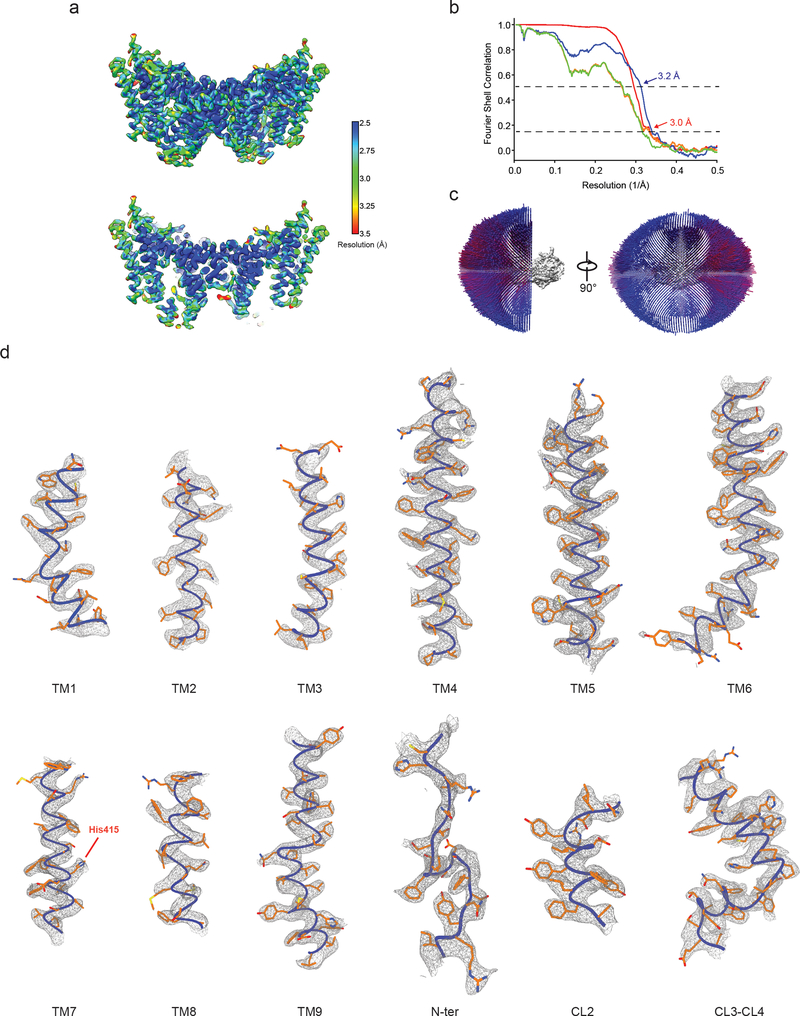
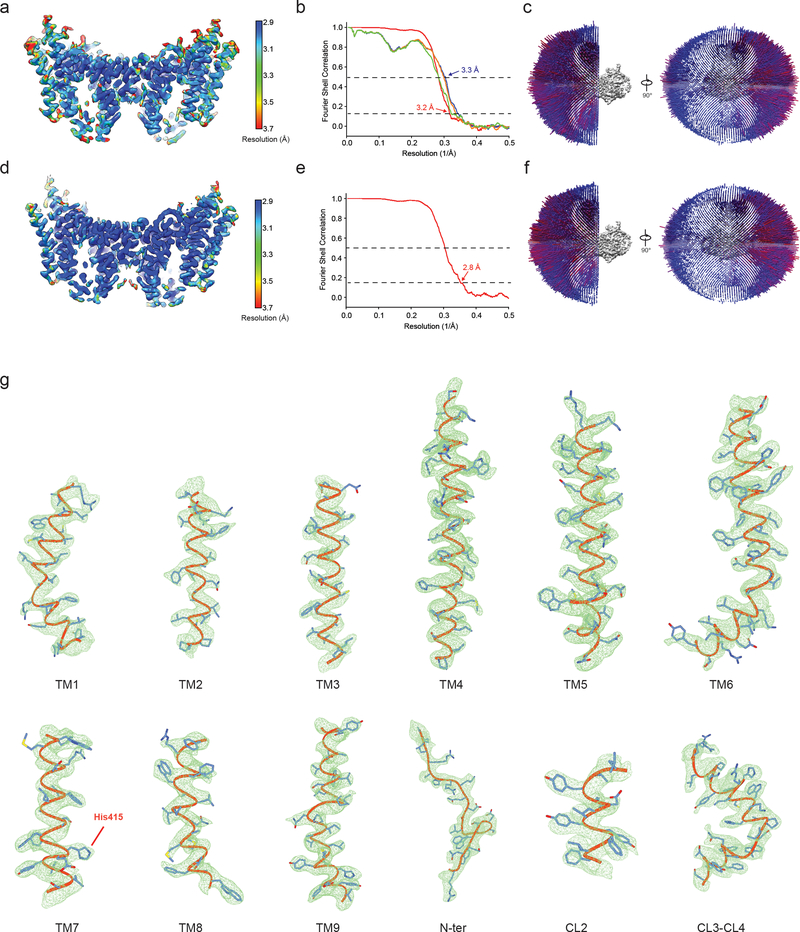
The amphipol reconstitution improved DGAT1 particle homogeneity (Extended Data Fig. 1g), enabling us to use DGAT1 in the later elution peak (blue arrow, Extended Data Fig. 1d) to generate a cryo-EM three-dimensional (3D) reconstruction at 3.0 Å overall resolution (Extended Data Figs. 2–3, Extended Data Table 1). This cryo-EM map showed well-defined side chain densities for most amino acid residues, enabling unambiguous model building (Extended Data Fig. 3d). The first 65 amino acids and a loop region (amino acids 229–238) were invisible, likely due to flexibility. A belt-shaped density of PMAL-C8 surrounded most of DGAT1 (Fig. 1a–b, Extended Data Fig. 2d), consistent with DGAT1 being mostly embedded in the membrane13.
Fig. 1 |. Cryo-EM structure of human DGAT1.
a, Cryo-EM map of human DGAT1, colored by monomer, viewed along the membrane plane or from the cytosolic side. Map is contoured at 6 σ. TMD, transmembrane domain. b, Representative 2D average of DGAT1 cryo-EM images. A micelle-like density surrounds the major portion of DGAT1. Bar, 40Å. c, Ribbon representation of the human DGAT1 dimer. The dashed line indicates a disordered segment (residues 229–238) not resolved in the cryo-EM map. d, Topology of DGAT1 monomer. The conserved His415 is shown. The red dashed oval (right panel) indicates the membrane-embedded lateral gate to the central cavity.
Overall architecture of human DGAT1
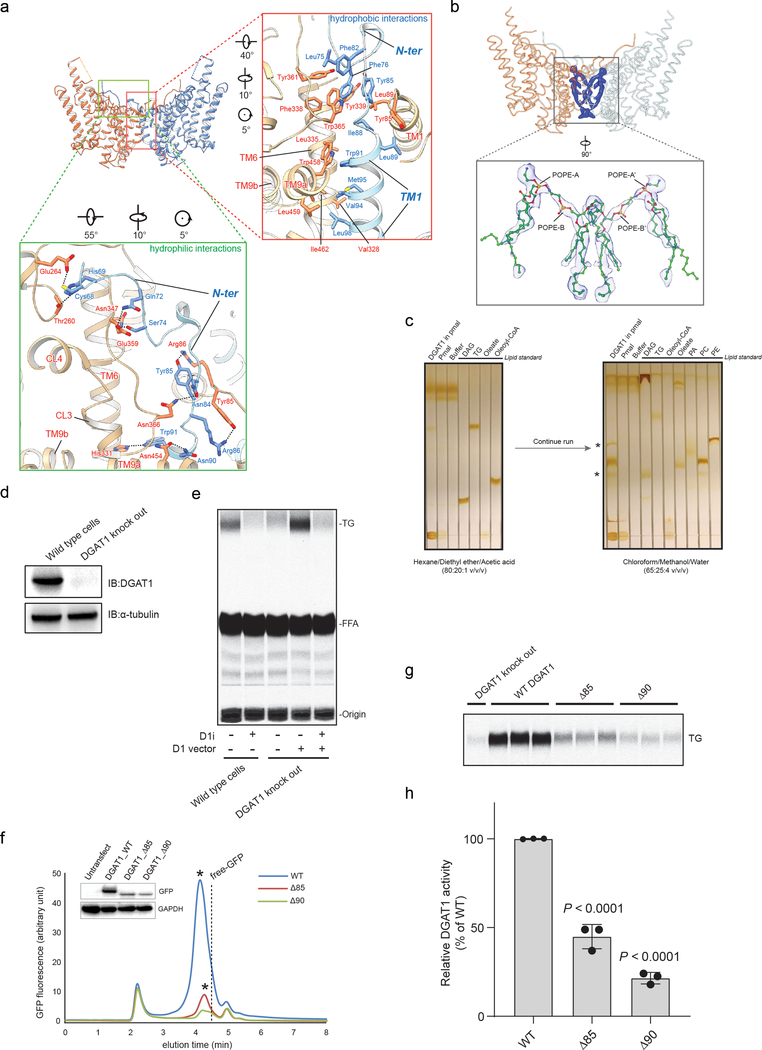
The cryo-EM map reveals that DGAT1 forms a dimer (Fig. 1a–c). Each DGAT1 subunit has nine transmembrane helices (TMs), with N- and C-termini located on the cytosolic and ER-luminal sides of the membrane, respectively (Fig. 1c–d). Short helices in cytosolic loop (CL) and luminal loop (LL) regions, including CL1–4 and LL1, orient in parallel to the membrane surface (Fig. 1d). The DGAT1 dimer forms through extensive hydrogen bond interactions of the first resolved 20 residues (His69–Gly87) with a cytosolic surface groove on the opposing subunit, and through hydrophobic interactions of the TM1 region of Phe82–Ile98 with the other monomer (Extended Data Fig. 4a). Extra densities, not accounted for by DGAT1 protein and whose shapes and sizes are consistent with four phospholipids, were present at the dimer interface and appear to contribute to the contacts between the DGAT1 monomers (Extended Data Fig. 4b). Consistently, phospholipids were identified in extracts of purified DGAT1 after amphipol reconstitution (Extended Data Fig. 4c).
To assess the functional importance of dimerization, we measured acyl-transferase activities in lysates of N-terminal truncation mutants expressed in cells lacking DGAT1 (Extended Data Fig. 4d–e). Similar to previous reports13,15, deletion of the first 85 or 90 residues of DGAT1 led to lower protein expression levels and reduced, yet detectable, activity (Extended Data Fig. 4f–h). After solubilizing and purifying the Δ85-mutant protein in detergent, it exhibited a near absence of enzyme activity (Extended Data Fig. 10c), indicating that the N-terminal region is required for optimal activity.
DGAT1’s active site is within the membrane
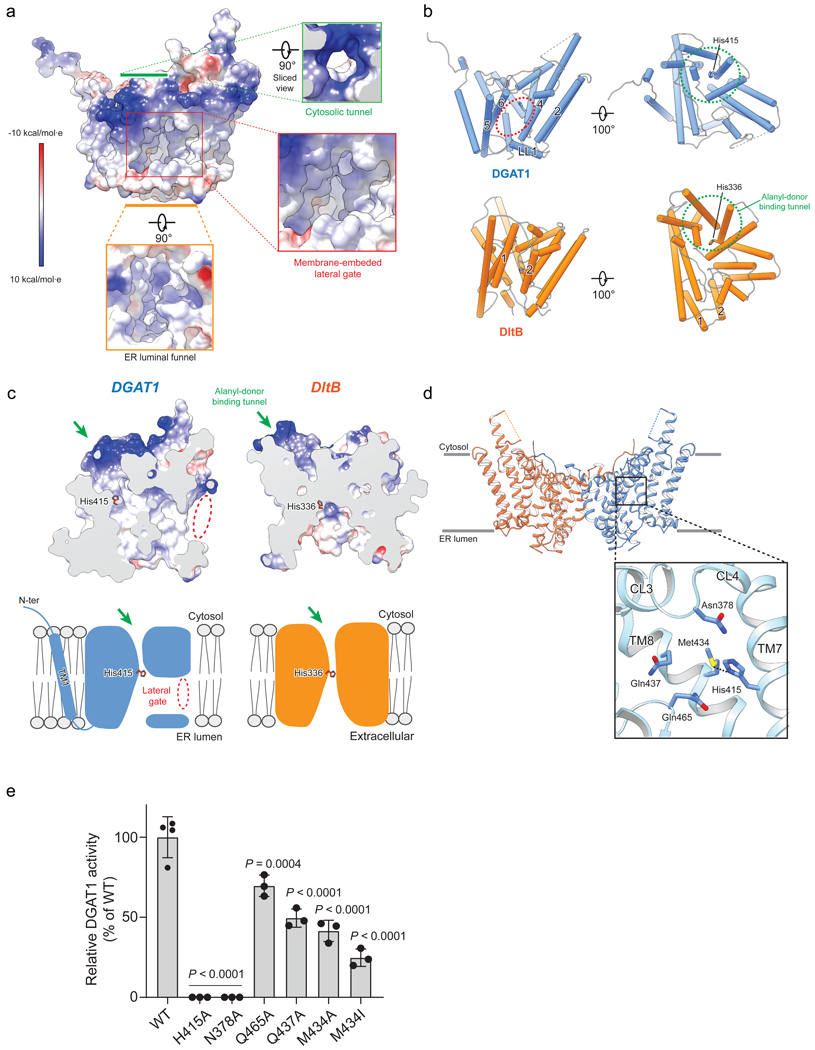
The TMs of DGAT1 form a large central cavity within the membrane that is open to the bilayer via a wide lateral gate (Fig. 2a–b) lined by TMs 2, 4, 5, 6 and LL1 (Figs. 1d, 2b). The conserved catalytic histidine (His415)13 is buried inside the central cavity (Figs. 1d, 2d). Besides the lateral gate, this cavity can be accessed from openings on the cytosolic and luminal sides (Fig. 2a, c).
Fig. 2 |. DGAT1 reaction center and structural comparison with DltB.
a, Three major openings leading to the DGAT1 putative catalytic center include a cytosolic tunnel (green box), an ER-luminal funnel (orange box), and a membrane-embedded lateral gate (red box). The electrostatic surface is shown. b, DGAT1 structural comparison with DltB. DGAT1 and DltB structures are superimposed and separately shown as cylinders. The lateral gate in DGAT1 (red dashed oval) is absent in DltB due to the presence of TM1 and TM2 that block membrane access to the catalytic center. A cytosolic tunnel in DGAT1 (green box in a) is also present in DltB and functions as a binding tunnel for alanyl-donor protein DltC (green dashed circle). c, Sliced surface-views of superimposed DGAT1 and DltB as in b, and the cartoon representations in the lower panel illustrating the common and distinct structural features. Red oval indicates the lateral gate shown in a, and green arrow indicates the cytosolic tunnel shown in a and b. Note the N-terminus and TM1 of DGAT1 appear as extra structural elements compared with DltB (also see Extended Data Fig. 7a, b). d, Zoomed-in view of DGAT1 active center. The conserved His415 and highly conserved polar residues in their vicinity are shown as sticks. A hydrogen bond between His415 and Met434 (3.1Å) is shown as dashed line. e, DGAT1 activities of wild type (WT) and reaction center mutants expressed in DGAT1 knockout cells. Activities were normalized to the amount of DGAT1 protein expressed, mean ±SD, n=4 independent experiments for WT, n=3 independent experiments for all mutants. One-way ANOVA with Dunnett’s post hoc test was applied.
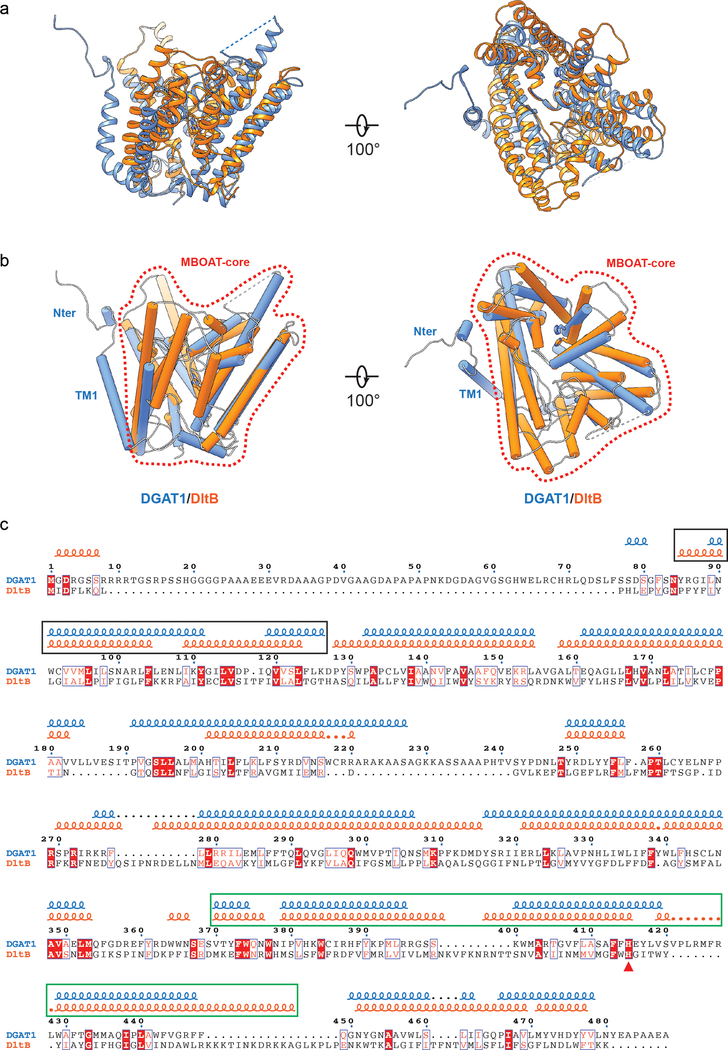
Structural comparison of DGAT1 and DltB17 revealed an overall similar folding, in which the majority of TMs form a concave-shaped ridge at either side of the membrane and the conserved histidine is located in the central region embedded in the membrane (Fig. 2b–c). A DALI search with the DGAT1 structure showed that this architecture appears to be unique for DGAT1 and DltB. We therefore refer to this conserved domain structure as the “MBOAT-core” (Extended Data Fig. 5a–c). Within the MBOAT core, a tunnel-like region equivalent to DltB’s alanyl donor binding pocket is also present in DGAT1 (Fig. 2b, green circle). Despite their overall similarity, the lateral gate found in DGAT1 is absent from DltB. Instead, the N-terminal TM1 and TM2 of DltB are in close proximity, blocking lateral access to the central cavity from the membrane (Fig. 2b, Extended Data Figs. 5a–b). This suggests that the acyl-acceptor lipid substrates for DGAT1, such as DAG, access the active site through the lateral gate within the membrane, whereas DltB, which alanylates extracellular teichoic acid, does not require a membrane opening for substrates. This hypothesis is consistent with a computationally predicted structure of ghrelin O-acyltransferase18, an MBOAT that acylates the secreted peptide hormone ghrelin at the ER luminal side, in which the TM region lacks an opening within the lipid bilayer.
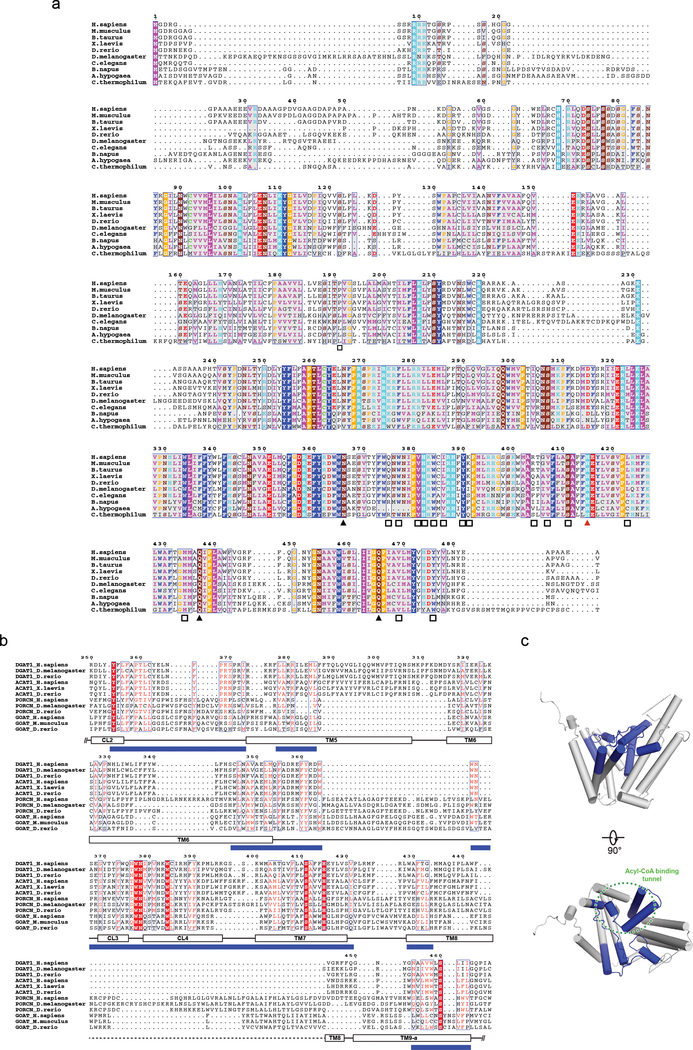
The putative active site of DGAT1 contains not only the invariant His415 but also several highly conserved nearby polar residues, including Asn378, Gln437, and Gln465, with their side chains oriented towards the cavity center (Fig. 2d, Extended Data Fig. 6a). The orientation of His415 appears to be stabilized by a hydrogen bond of its Nδ1 atom with the Sδ atom of Met434 (Fig. 2d). Single alanine mutations of His415 or Asn378 abolished DGAT1 activity, whereas Gln437Ala, Met434Ala, or Gln465Ala mutations reduced activity by 50–75% (Fig. 2e). Together, these studies suggest that the central cavity of DGAT1 within the membrane is the catalytic site.
Acyl-CoA binding to DGAT1
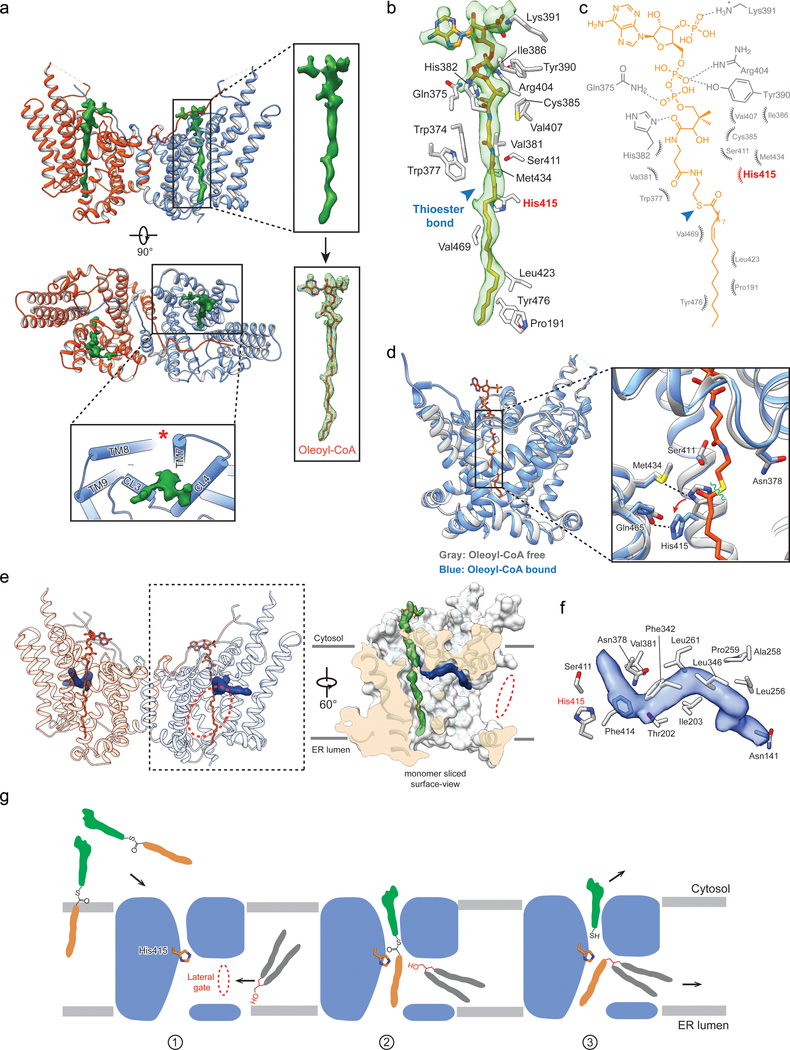
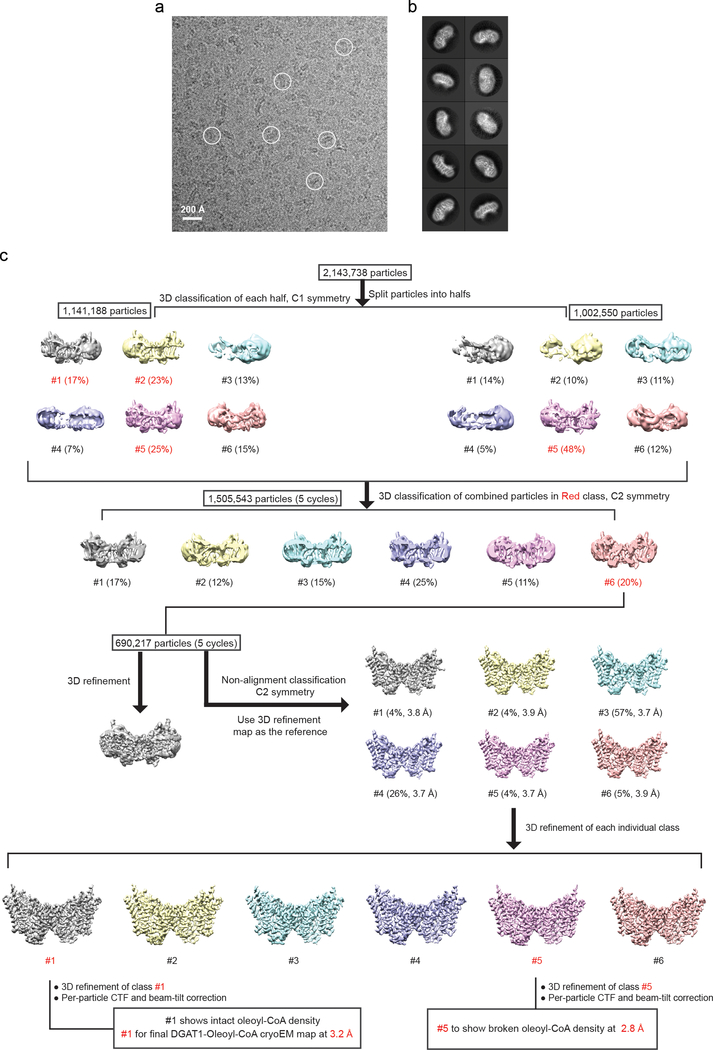
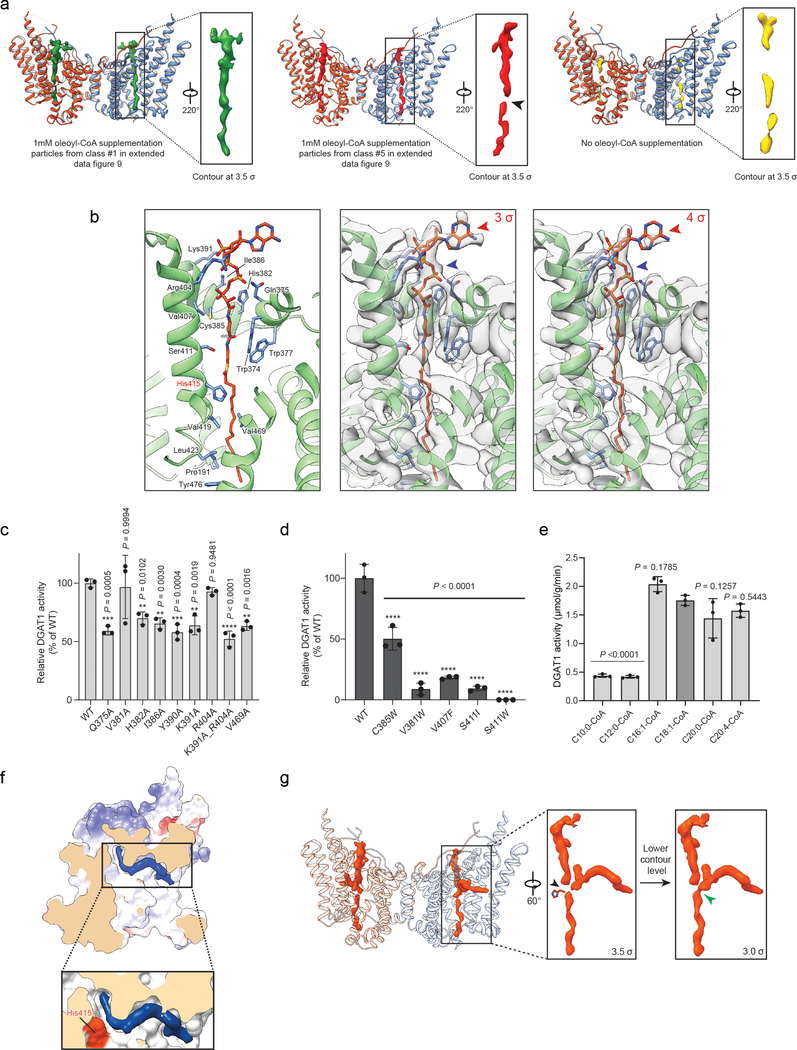
To investigate DGAT1-mediated acyl-CoA binding and acyl chain transfer, we characterized the structure of human DGAT1 in the presence of oleoyl-CoA, a preferred substrate3, and generated two cryo-EM maps at 3.2 and 2.8 Å resolution (Extended Data Figs 7–8). These two maps are essentially identical for DGAT1 protein and show strong densities for the bound oleoyl-CoA (Fig. 3a, Extended Data Fig. 9a). In the 3.2-Å resolution map, a complete oleoyl-CoA molecule is visible (Fig. 3a), representing an unprocessed substrate. In the cryo-EM maps calculated with other particle images, the oleoyl-CoA density appears to be broken at the thioester bond (Extended Data Fig. 9a), possibly representing a state after catalytic cleavage. However, validation that the cleaved acyl-CoA is a post-reaction state requires further investigation.
Fig. 3 |. Cryo-EM structures of DGAT1 complexed with a fatty acyl-donor substrate and a lipid-like molecule resembling an acyl-acceptor substrate.
a, Cryo-EM structure of human DGAT1 bound to an intact oleoyl-CoA molecule (green density at 3.5 σ contour level). Zoomed-in view shows the modeled oleoyl-CoA molecule superimposed with the EM density. Lower panel illustrates the cytosolic tunnel of DGAT1, consisting of TMs 7–9 and CL3–4, that interacts with oleoyl-CoA substrate. Red asterisk indicates the gap between TM7 and TM8 in the cytosolic membrane leaflet. b and c, Interactions between oleoyl-CoA and DGAT1. Residues interacting with oleoyl-CoA within a 4-Å distance are shown. Detailed molecular interactions are depicted in c. Polar interactions (dashed lines) and interaction distances are labeled. Non-dipolar interactions are shown as spiked arcs. Blue arrowhead indicates the thioester bond in acyl-CoA substrate. d, Conformational changes in the DGAT1 active center upon oleoyl-CoA binding. Red arrow indicates the His415 conformational change before (gray) and after (blue) oleoyl-CoA binding, and dashed lines indicate the hydrogen bonds between His415 and Met434 without oleoyl-CoA and between His415 and Gln465 (2.4 Å) upon binding to oleoyl-CoA. Asn378 that is essential for DGAT1 activity is also shown. Green wavy line indicates the scissile bond in the thioester group during acyl-transfer reaction. e, Unidentified lipid-shaped density (blue) residing in the DGAT1 central cavity. The lateral gate (red dashed circle) and oleoyl-CoA molecules (sticks) are shown. Right panel is a surface representation to show orientation of the lipid-like density in the monomer of DGAT1/acyl-CoA complex structure. f, Residues accommodating the lipid-like density (transparent blue surface) shown in the acyl-CoA free DGAT1 structure. g, Hypothetical model for DGAT1-catalyzed TG formation. See text for details.
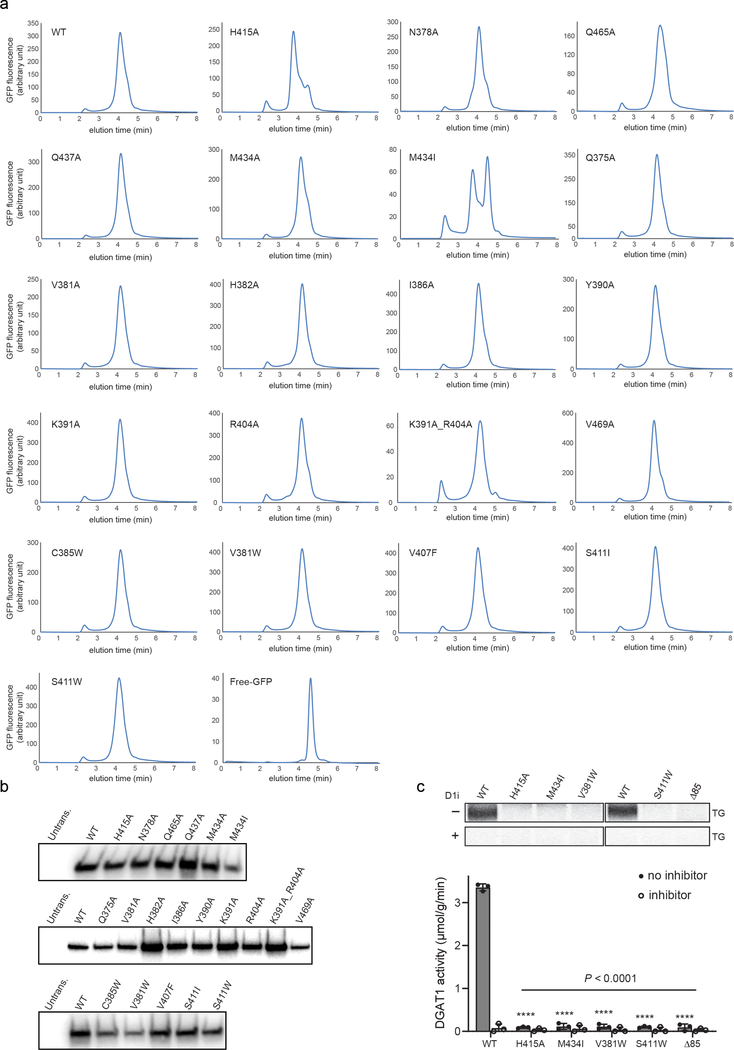
Our structure of DGAT1 bound to intact oleoyl-CoA revealed that the acyl-CoA molecule occupies the cytosolic tunnel, with the CoA moiety at the cytosolic face and its acyl chain extending through the reaction center toward the ER lumen (Fig. 3a). This orientation of the acyl-CoA is consistent with acyl-CoAs being synthesized on the cytosolic side of the ER membrane19. Acyl-CoA and DGAT1 interaction is mediated predominately through the 4′-phosphopantetheine moiety in the oleoyl-CoA molecule (Fig. 3b–c). The adenosine group of the CoA contributes minimally to interactions with DGAT1. The relatively weak cryo-EM density in this region suggests that the adenosine is mobile and could possibly adopt various conformations (Extended Data Fig. 9b). In contrast, the density for the 4′-phosphopantetheine moiety and surrounding residues are clearly visible (Extended Data Fig. 9b). Single alanine mutations of the residues interacting with oleoyl-CoA decreased DGAT1 activity levels, but none by more than 50% (Extended Data Fig. 9c). More bulky hydrophobic sidechain mutations, intended to block the binding of acyl-CoA to the tunnel (Val381Trp, Cys385Trp, Val407Phe and Ser411Ile) decreased DGAT1 activity; a Ser411Trp mutation, which we predicted would block the tunnel, completely inactivated DGAT1 (Extended Data Fig. 9d). The loss of activity was apparently not due to protein misfolding (Extended Data Fig. 10a–b). Activity was also validated by using purified DGAT1 (Val381Trp and Ser411Trp) mutants (Extended Data Fig. 10c).
The oleoyl-CoA in the tunnel is surrounded by TMs 7–9, CL3, and CL4, leaving a gap between TM7 and TM8 at the level of cytosolic membrane leaflet (Fig. 3a, asterisk). This gap might accept membrane-partitioned acyl-CoA substrates, although soluble acyl-CoA could also enter the channel from the cytoplasm. The distal end of the acyl-chain of oleoyl-CoA interacts with DGAT1 deep within the hydrophobic channel, predicting that the binding of longer acyl-chains may help to accurately position the acyl-donor substrate for the reaction. Consistently, DGAT1 was more active with longer-acyl chain substrates (C16–20) than shorter ones (C10–12) (Extended Data Fig. 9e). The enzyme exhibited activity for a variety of saturated and unsaturated long chain fatty acyl-CoAs (Extended Data Fig. 9e), as reported3,20. An analysis of the conservation of DGAT1 and selected MBOAT sequences showed that the acyl-CoA binding tunnel within the MBOAT-core of DGAT1 is the most conserved region among MBOAT enzymes (Extended Data Fig. 6b, c). This tunnel is analogous to the pocket in DltB for binding DltC, the alanyl-donor protein (Fig. 2b–c, Extended Data Fig. 5b–c)17.
Comparison of the structures of DGAT1 with or without bound acyl-CoA reveals no large conformational differences (Fig. 3d), similar to the minor structural changes for DltB upon DltC binding17. However, several residues near the cleavage site of acyl-CoA, including Ser411, show altered conformations upon acyl-CoA binding. Among these, His415 flips towards the ER luminal side when acyl-CoA binds (Fig. 3d). This change involves the breaking of the hydrogen bond between His415 and Met434, which opens the tunnel to accommodate the acyl-CoA substrate and enables the formation of a hydrogen bond between His415 Nε2 atom and Gln465 Oε1 atom (Fig. 3d), positioning His415 near the thioester bond of the acyl-CoA. Thus, acyl-CoA binding to DGAT1 results in small but important conformational changes in the active site region that may prime the enzyme for catalysis.
A putative acyl acceptor
The cleavage site for oleoyl-CoA is presumably within a short distance from a lipid acceptor, such as DAG. Interestingly, our cryo-EM maps (with or without oleoyl-CoA) revealed a strong, elongated, lipid-like density in the central cavity (Fig. 3e), orthogonal to the bound oleoyl-CoA and in close proximity to His415 (Fig. 3e–f). The shape of this density is consistent with a DAG that was co-purified with the enzyme (Extended Data Fig. 4c). Hydrophobic residues, including Phe342, Leu261, Val381, and the highly conserved Asn378, line the region and form a channel surrounding the lipid-like density (Fig. 3f). The channel exhibits a bent, hydrophobic pathway that appears to allow the binding of apolar linear or curvilinear molecules (Extended Data Fig. 9f). The bent architecture of this tunnel may explain how DGAT1 distinguishes acyl acceptors, such as DAG or long-chain alcohols7 from more planar and rigid substrates, such as cholesterol, which is acylated by acyl CoA:cholesterol acyltransferases21. In the cryo-EM map of DGAT1 containing a cleaved oleoyl-CoA, the cleaved acyl chain is merged onto the orthogonally orientated density, giving rise to a density with a three-way branched shape resembling TG (Extended Data Fig. 9g). Further studies are required to determine the identity of the lipid-like density and to elucidate the basis of acyl-acceptor preferences of DGAT1.
Discussion
Our cryo-EM structures of human DGAT1, obtained in the absence and presence of bound fatty acyl-CoA substrate, reveal the detailed molecular architecture of this mammalian MBOAT and, together with extensive functional studies, provide mechanistic insight into the catalysis of lipid acylation mediated by DGAT1. Our results reveal the dimeric architecture of DGAT1, the arrangement of crucial residues within the catalytic center, the structural basis for acyl-CoA binding and thioester cleavage, and a potential mechanism of acyl-transfer to a lipid acceptor.
Based on our data, we propose a model for TG synthesis mediated by DGAT1 in which an acyl-CoA substrate binds, from the cytosolic side, via a combination of electrostatic features of the cytosolic face and a deep, hydrophobic tunnel (Fig. 3b–c). When an acyl acceptor, such as DAG, binds in an orthogonal hydrophobic tunnel accessed from within the lipid bilayer, the acyl chain from acyl-CoA is transferred to the acceptor in a reaction involving the conserved His41522, ultimately generating CoA-SH and TG (see model, Fig. 3g). The crucial Asn378 may serve to interact with the acyl-acceptor substrate. The reaction products are released to the cytoplasm (CoA-SH) and the membrane bilayer (TG), where the latter can initiate lipid droplet formation23. Additional structural and biochemical studies are needed to test this model and delineate the catalytic mechanism.
Our structure shows that the N-terminal region of DGAT1 mediates dimerization, whereas the analogous region of DltB monomer instead blocks the lateral gate to the membrane. This suggests evolutionary functional adaptations that occurred within MBOATs to accommodate different substrates. Previous studies indicated that the N-terminal region of DGAT1 mediates its oligomerization13,15, and may be involved in acyl-CoA binding and enzyme regulation15,16. Because our structure lacks N-terminal segments, it does not allow new insight into the latter possibilities.
The DGAT1 structure provides a framework for understanding mutations in human DGAT1, which causes congenital diarrhea24. Most of these DGAT1 mutations result in loss of protein expression, but as additional mutations are identified, they can now be mapped onto the enzyme structure to predict the functional consequences. The DGAT1 structure may also further our understanding of the mechanisms of DGAT1 inhibitors that have been developed for treating metabolic diseases25,26.
Methods
Protein expression and purification
DGAT1 from Homo sapiens (UniPort ID: O75970) was expressed in HEK293 GnTi-cells using the BacMam system. In brief, the DGAT1 cDNA sequence was cloned into a pFastBacMam vector constructed with the mammalian CMV promoter. The protein was fused with an N-terminal 8 × His tag followed by a maltose-binding protein (MBP). A TEV cleavage site was inserted between the MBP and DGAT1 sequences. The bacmid for expressing the MBP-fusion protein was generated in DH10Bac Escherichia coli cells (ThermoFisher) by transformation of the construct. Baculovirus was generated by transfecting Spodoptera frugiperda (Sf9) cells (Expression Systems) cultured at 27 °C in ESF921 medium (Expression Systems) with the bacmid using the BaculoPORTER transfection reagent (Genlantis). After that, the baculovirus was amplified twice in Sf9 cells to obtain sufficient virus for large-scale infection. HEK293 GnTi-cells were grown in suspension at 37 °C in FreeStyle 293 Expression Medium (ThermoFisher) supplemented with 1% FBS and 1× Glutamax solution (Gibco). When the cells reached a density of 2.0–2.5 × 10⁶ cells per ml, baculovirus was added to the culture at 5% (v/v). After 15 hours infection at 37 °C, the culture was supplemented with 10 mM sodium butyrate to boost the expression. After further growth for ~36 hours, cells were harvested and washed once in PBS, and cell pellets were flash frozen in liquid nitrogen and stored at –80 °C or placed on ice for immediate use.
All protein purification steps were performed at 4 °C. Cell pellets collected from 1 L cell culture were resuspended in 80 mL TSGE buffer (50 mM Tris-HCl, pH 8.0, 400 mM NaCl, 10% (v/v) glycerol and 1 mM EDTA) and supplemented with 1 × complete protease inhibitor cocktail (Roche). To lyse the cells, GDN detergent (Anatrace) was added into the solution at a final concentration of 0.5% (w/v), and the mixture was generally agitated for 1 hour before MgCl2 was added to a final concentration of 5 mM. The mixture was agitated for 1 more hour. Insoluble debris was removed by centrifugation, and the supernatant was incubated with prewashed amylose resin for 2 hours. The resin was carefully washed to remove contaminant proteins. The MBP-fused DGAT1 protein was eluted in TSGE buffer containing 20 mM maltose and 0.1% (w/v) digitonin (Sigma-Aldrich). The eluate containing MBP-DGAT1 was concentrated, and the MBP tag was cleaved by TEV protease. The protein was then further purified by size-exclusion chromatography on a Superose 6 column (GE Healthcare) in TSM buffer (50 mM Tris-HCl, pH 7.5, 400 mM NaCl, 10 mM MgCl2) supplemented with 0.05% (w/v) digitonin. The peak fractions containing DGAT1 were collected and concentrated. For preparation of samples for cryo-EM analysis, the purified DGAT1 in detergent was mixed with PMAL-C8 (Anatrace) at a 1:3–1:5 (w/w) ratio, followed by gentle agitation overnight in cold room. Detergent was then removed with Bio-Beads SM-2 (Bio-Rad) for 1 hour, and the beads were subsequently removed over a disposable polyprep column. The eluent was cleared by passage through a 0.22-μm filter before further purification by gel filtration with TSM buffer. The peak containing DGAT1 was collected for further use. For some assays of partially purified DGAT1 mutant proteins, recombinant proteins were transiently expressed in HEK293 cells and purified by 8 × His tag before activity measurements were performed.
EM sample preparation and data acquisition
Negatively stained specimens were prepared using an established protocol with minor modifications27. Specifically, 2.5 μL of purified DGAT1 in PMAL-C8 at 0.03–0.05 mg/mL were applied to glow-discharged copper EM grids covered with a thin layer of continuous carbon film, and the grids were stained with 1.5% (w/v) uranyl formate for 30 seconds. There grids were imaged on a Tecnai T12 microscope (Thermo Fisher Scientific) operated at 120 kV and equipped with a 4k × 4k charge-coupled device camera (UltraScan 4000; Gatan). A nominal magnification of 67,000× corresponding with a pixel size of 1.68 Å on the specimen and a defocus of ~1.5 μm were used to record the images.
For cryo-EM samples, 2–3 μL of purified DGAT1 in PMAL-C8 was applied to Quantifoil holey carbon grid (Cu R1.2/1.3; 400 mesh) that glow discharged for 30 seconds. Optimal particle distribution was obtained with a protein concentration of 4–5 mg/mL. After applying protein, the grids were blotted with a Whatman #1 filter paper for 5 s with ~ 95% humidity at 4 °C and plunge frozen in liquid ethane cooled by liquid nitrogen using a Vitrobot Mark IV system (Thermo Fisher Scientific). For the oleoyl-CoA treated sample, oleoyl-CoA freshly prepared in water was added into the concentrated DGAT1 at 5.5 mg/ml in PMAL-C8 with a final concentration of 1 mM. The mixture was incubated on ice for 1 hour before freezing the cryo-EM grids. Cryo-EM data were collected on a Titan Krios electron microscope (Thermo Fisher Scientific). Image were recorded using SerialEM28. Refer to Table S1 for the detailed data collection parameters.
EM data processing
For negative stain EM data, the images were binned over 2 × 2 pixels, yielding a pixel size of 3.36 Å, for further processing using Simplified Application Managing Utilities for EM labs (SAMUEL) scripts29. For cryo-EM data, drift correction was performed using MitionCor230, and images were binned 2 × 2 by Fourier cropping to a pixel size of 3.3 Å. The defocus values were determined using CTFFIND431 and motion-corrected sums without dose-weighting. Motion-corrected sums with dose-weighting were used for all other steps of image processing. Particle picking was performed using a semi-automated procedure32. The 2D classification of selected particle images were performed using samclasscas.py, which uses SPIDER operations to run 10 cycles of correspondence analysis, K-means classification, and multireference alignment, or RELION 2D classification33,34. Initial 3D models were generated with 2D averages using SPIDER 3D projection matching refinement (samrefine.py) starting from a cylindrical density that mimics the general shape and size of DGAT1. The 3D classification and refinement were performed using relion3_refine_mpi in RELION. One round of 3D classification without applying symmetry was performed to remove bad particles. Subsequently, particle images that generated 2D class averages showing clear structural features were combined for one round of 2D classification followed by 3D refinement with C2 symmetry. Refer Extend Data Fig. 2 and 9 for the detailed data processing procedure. All refinements followed the gold-standard procedure in which two half datasets are refined independently. The overall resolutions were estimated based on the gold-standard Fourier shell correlation (FSC) = 0.143 criterion. Local resolution variation of cryo-EM maps was calculated using RasMap35. The amplitude information of the final maps was corrected by applying a negative B factor using relion_postprocessing with the –auto_bfac option. The details related to data processing are summarized in Extended Data Table 1.
Model building and refinement
DGAT1 density maps in MRC/CCP4 format were converted to the structure factors MTZ format with map_to_structure_factors. Then a rough initial model was obtained in by using map_to_model module on the auto-sharpened map. All these functional modules were implemented in PHENIX suite36. The modeling building was then performed manually in COOT37. The DGAT1 map shows clear densities for most transmembrane helices that allowed a confident sequence registration by aromatic and other residues with bulky side chains to these α-helical regions in the density map. The linker domains that connect the TM-helical regions were then built by connecting helical domains, with large and well-resolved side chains serving as markers. After building the DGAT1 monomer model, the coordinate file was docked into DGAT1 dimer map in UCSF Chimera38 to generate the dimer model. Then the dimer model was manually adjusted and refined in PHENIX real-space refinement package36. The refined model was visually inspected and adjusted in COOT37, and the resulting map was further put back through the real-space refinement procedure to undergo further refinement. After several cycles of manual model adjustments and computational refinement, the ligands for oleoyl-CoA and POPE lipids were placed into the residual active site electron density. Atomic coordinates and geometric restraints for the ligands were generated using the GRADE server (Global Phasing). Then the protein coordinates with ligands were refined. This iterative refinement process was repeated until the dimer model reached optimal geometric statistics as evaluated by MorProbility39. The regions show weak signals were omitted in the final model. The protein-protein and protein-ligand interactions in the structures were analyzed by LigPlot40.
Generation of DGAT1 KO cells
DGAT1-knockout SUM159 cell line in wild-type background were generated by CRISPR/Cas9 gene editing41. The sequence 5′-CCACGGTAGTTGCTGAAGCCACT-3′ was used as a gRNA to direct Cas9 into exon 2 of the DGAT1 locus. Cells were selected with 1.5 μg/ml puromycin for 48 hrs. Genomic DNA of clones was amplified by PCR (sense: 5′-GAGAGCTTTGCCCACTGTAGG -3′, antisense: 5′-CTGGGTGACAGAGCCTGTTC-3′). PCR products were sequenced and revealed a clone (designated 2.10) with two deletion alleles, a 1-bp deletion (5′-AGTGGCTTCAGCAACTACCGTGGCATCCTGAACTGG-3′ -5′-AGTGGCTTCAGCAACTCCGTGGCATCCTGAACTGG-3′) and predicted to result in a 14-bp deletion (5′-AGTGGCTTCAGCAACTACCGTGGCATCCTGAACTGG-3′ → 5′-AGTGGCTTCAGCAACGAACTGG-3′). These deletions result in frameshifts and premature stop codons within the first 100 amino acids. The knockout was verified by immunoblotting.
DGAT1 mutagenesis and activity assay
DGAT1 mutants were generated by the QuickChange Site-Directed Mutagenesis kit (Agilent) by using the protocol provided by the manufacturer. The desired mutations were confirmed by DNA sequencing. Plasmid was amplified in Stbl2 competent cells (ThermoFisher) before transfection. For the acyl-transferase activity, DGAT1 activity was measured in vitro as published42. In brief, DGAT1−/− SUM159 cells, generated by the CRISPR/Cas9 system, were transfected with constructs to express wild type or mutant DGAT1 with the FuGENE HD transfection reagent (Promega) per the manufacturer’s instructions. Cells were harvested three days after transfection, and the cell pellet was washed with PBS before being snap-frozen in liquid nitrogen and stored in −80 °C. The cell pellet was lysed by sonication in ice-cold lysis buffer containing 250 mM sucrose, 50 mM Tris-HCL (pH 7.4) and EDTA-free protease inhibitor cocktail (Sigma-Aldrich). The unbroken debris was removed by centrifugation at 5000 rpm, 4°C for 5 minutes on a bench-top centrifuge. Each 100 μL of cell lysate (equivalent to ~ 5 × 10⁵ cells) was incubated with 25 μM DGAT2 inhibitor PF-06424439 (Sigma-Aldrich) on ice for 30 minutes. Then, 100 μL of reaction mixture was added to the cell lysate to a final concentrations of 100 mM Tris-HCl (pH 7.4), 25 mM MgCl2, 0.625 g/L delipidated BSA, 200 μM 1,2-dioleoylglycerol and 50 μM oleoyl-CoA containing 0.2 μCi [14C]-oleoyl-CoA as a tracer (American Radiolabeled Chemicals). In some experiments DGAT1 inhibitor PF-04620110 (Sigma-Aldrich) was added at final concentration of 10 μM into the reaction mixture. For activity assays comparing different acyl-CoA substrates, 0.2 μCi [14C]-1,2 diacylglycerol was spiked into 200 μM cold DAG substrate, and 50 μM acyl-CoA with different acyl-CoA substrate was used for individual reactions. Reactions were carried out at 37 °C with gentle agitation for 30 minutes or as indicated. The reactions were quenched by adding chloroform/methanol (2:1 v/v), followed by 2% phosphoric acid for phase separation. The organic phase was harvested, dried, resuspended in chloroform and loaded on a silica gel TLC plate (Analtech). Lipids were resolved in a solvent system consisting of hexane, diethyl ether and acetic acid (80:20:1 v/v/v). The radioactivity of the TG bands was revealed by Typhoon FLA 7000 phosphor imager (GE Healthcare Life Sciences) and quantified by Quantity One (V4.6.6). The final activity was normalized to the DGAT1 protein amount in the cell lysate that was measured by immunoblotting against DGAT1 or the GFP tag fused at DGAT1 N-terminal end42. A known amount of purified DGAT1 served as the control for quantification of DGAT1 from cell lysate.
Extended Data
Extended Data Fig. 1 |. Purification and characterization of human DGAT1.
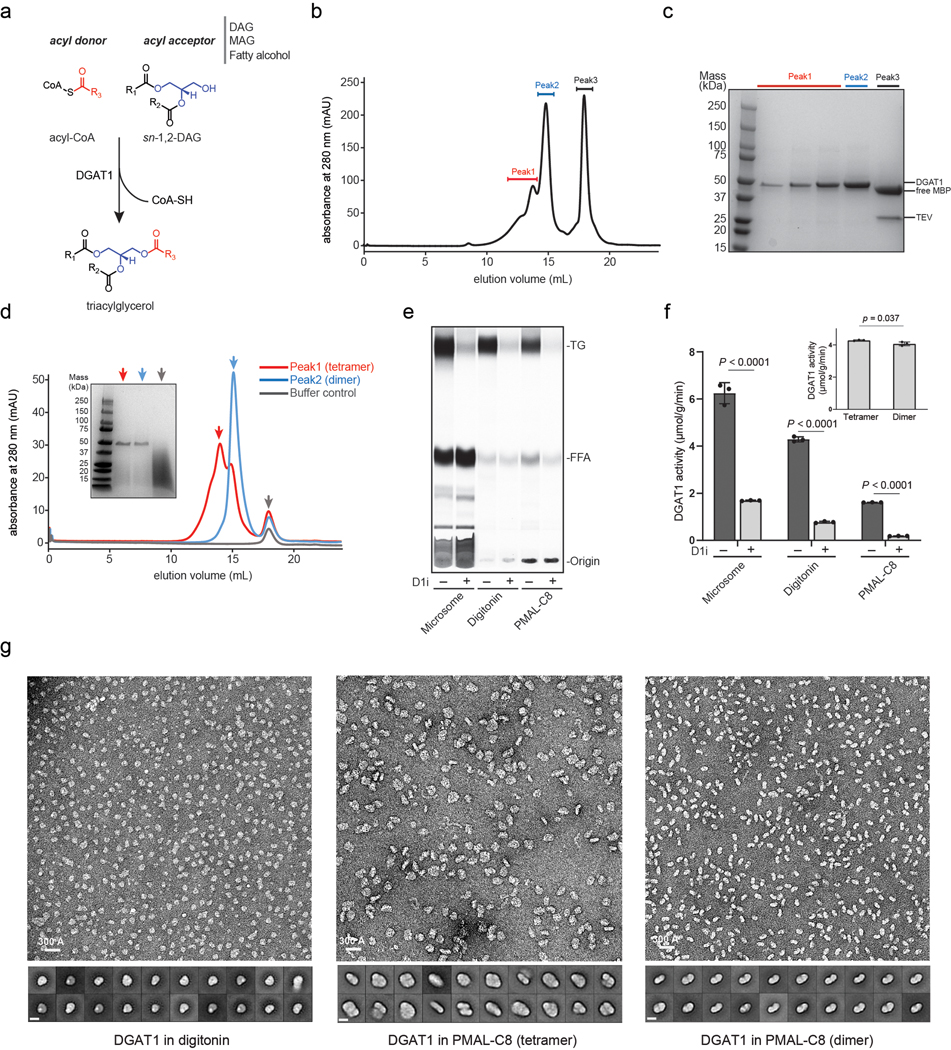
a, The acyl-transfer reaction catalyzed by DGAT1. The enzyme utilizes acyl-CoA as the sole acyl donor and recognizes different lipid molecules (i.e., diacylglycerol/DAG, monoacylcerol/MAG and fatty alcohol) as the acyl acceptor. The panel shows the reaction with sn-1,2-DAG as the acyl-acceptor and triacylglycerol/TG as the product. The acyl-group in acyl-CoA is colored in red, and the glycerol backbone in DAG is colored in blue. b and c, Gel-filtration profile and SDS-PAGE analysis of purified DGAT1 digitonin. The peak 1 and 2 containing purified DGAT1 by SDS-PAGE analysis were separately collected and pooled. d, Gel-filtration of DGAT1 reconstituted in the amphipol PMAL-C8 that was purified from b. A red (tetramer) and blue (dimer) arrow denote the different oligomerization states of DGAT1. The SDS-PAGE analysis of each peak is shown in the insert. e, Activity analysis of DGAT1-overexpressed microsome or purified enzyme with or without DGAT1 inhibitor (D1i). The protein from the digitonin sample of peak 2 in b and PMAL-C8 sample of the dimer peak in d were used for the assay. The reaction product of TG was separated and analyzed by TLC. FFA, free fatty acid. f, Quantification of TG product shown in e by phosphorimaging. The insert shows the activity of DGAT1 tetramer and dimer from d (mean ± SD, n=3 independent experiments). Analysis was performed using two-way ANOVA with Sidak’s post hoc test. g, Representative negative-stain EM micrograph and 2D averages of purified DGAT1 in digitonin (peak 2 in b), and the tetramer and dimer species of DGAT1 in PMAL-C8 (red and blue peaks in d), respectively. The bar in 2D average is 100 Å. Data shown in b-e and g were repeated at least three times with similar results.
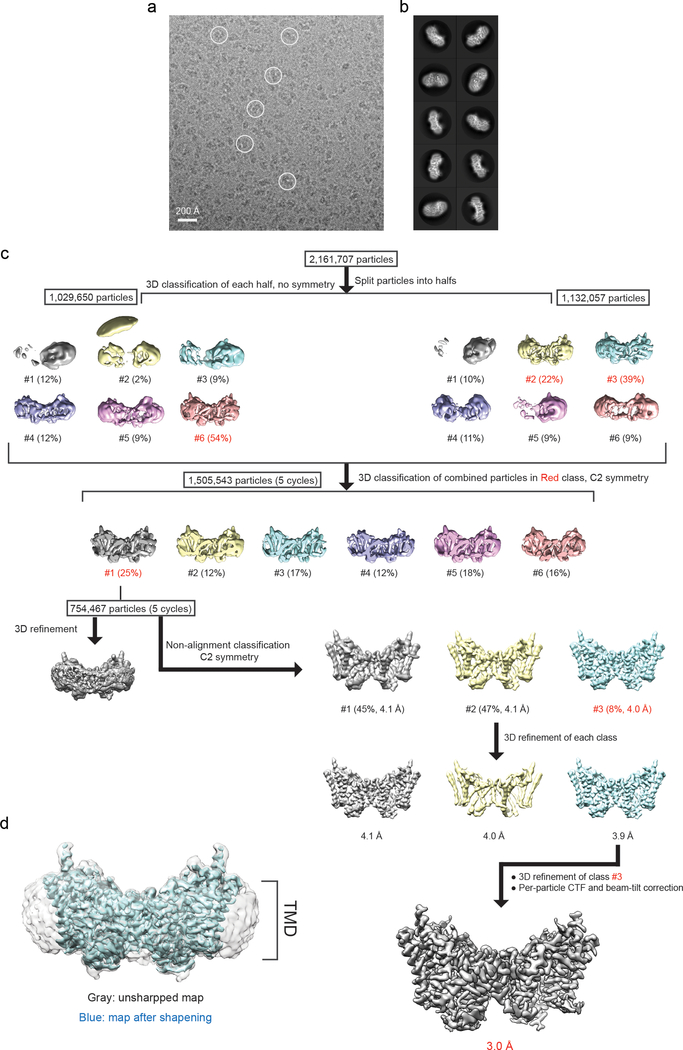
Extended Data Fig. 2 |. Cryo-EM image processing of human DGAT1 in PMAL-C8.
a, Representative cryo-EM image of DGAT1 in PMAL-C8. Some DGAT1 particles are outlined by circles. b, 2D class averages of cryo-EM particle images. The box size of 2D averages is 210 Å. c, Three-dimensional classification and refinement of cryo-EM particles. The initial particle stack was split into two stacks due to the large number of particles for 3D classification. After the first round of classification without imposing symmetry, all of the particles classified into one best class (#1 contains the most abundant 25% particles) in the final five iterations (indicated as ‘5 cycles’) were kept for further processing. This subset of particles was further classified into three classes by non-alignment classification with C2 symmetry. Afterwards, another round of refinement was performed on each individual class. Among them, class #3 exhibited the highest estimated resolution by Relion and the best sidechain signals by visual inspection and was kept for per-particle CTF and beam-tilt corrections. The resulting cryo-EM map was used for the final cryo-EM maps are contoured at 5 σ. d, Unsharpened map (gray) superimposed with the final DGAT1 cryo-EM map (blue) showing the detergent micelle-like signals around DGAT1.
Extended Data Fig. 3 |. Single-particle cryo-EM analysis of DGAT1 reconstituted in PMAL-C8.
a, Local resolution of the final cryo-EM map of DGAT1. A sliced view of local resolution is shown in the lower panel. b, FSC curves: gold-standard FSC curve between the two half maps with indicated resolution at FSC = 0.143 (red); FSC curve between the atomic model and the final map with indicated resolution at FSC = 0.5 (blue); FSC curve between half map 1 (orange) or half map 2 (green) and the atomic model refined against half map 1. c, Cutaway views of angular distribution of particle images included in the final 3D reconstruction. d, Cryo-EM densities superimposed with the atomic model for individual transmembrane helices (TM1 – 9), resolved N-terminal region (N-ter), and helices in the cytosolic loop region (CL2 – 4). The conserved His415 is also labeled. Maps are contoured at 4 σ.
Extended Data Fig. 4 |. Dimer assembly of DGAT1 and phospholipid molecules residing at the dimer interface.
a, Structural details of the DGAT1 dimer interaction. The resolved N-terminal domain (N-ter, amino acids 68–86) of DGAT1 forms a hydrogen-bond network with the opposing subunit depicted in green box. Dashed lines denotes hydrogen-bonding pair of residues. Hydrophobic interactions mediating DGAT1 dimer are shown in red box. b, Densities attributed to phospholipid lipids at the DGAT1 dimer interface are shown as blue surface. The lower panel shows four 1-palmitoyl-2-oleoyl-sn-glycero-3-phosphoethanolamine/POPE molecules modeled into the density, each pair of POPE densities was symmetry-related and labeled as POPE-A/B and POPE-A′/B′. Maps are contoured at 2.5 σ. c, TLC analysis of lipids that co-purified with DGAT1 by iodine staining. The asterisks indicate the presence of PE and DAG in purified DGAT1. d and e, The SUM159 DGAT1 knockout cell-line system analyzed by western blot in d and DGAT1 activity analysis by using lysates from SUM159 DGAT1 knock-out cells or cells transiently overexpressing DGAT1 in e. f, Truncation of N-termini reduces DGAT1 expression. Fluorescence size-exclusion chromatography (FSEC) and western blot analyses of two N-terminal truncation lacking the first 85 and 90 residues. The asterisks in the gel-filtration profiles denote the DGAT1-containing peak. The dashed line marks the peaking containing free GFP. g and h, Truncation of N-terminal region reduces DGAT1 activity. TLC analysis of TG products are shown in g. Each assay was performed in triplicates. The final TG product were normalized to the protein expression level with the quantification results showing in h. Mean ±SD, n=3 independent experiments. Analysis was performed using one-way ANOVA with Dunnett’s post hoc test was applied. Data shown in c was performed once; data in d-g were repeated three times with similar results.
Extended Data Fig. 5 |. Structural comparison of DGAT1 with DltB.
a, Structural superposition of DGAT1 (blue) and DltB (orange, PDB ID: 6BUI)17. The two structures were superimposed with an rmsd of 1.39 Å over 360 matched Cα positions. b, Same as a but the protein structures were shown as cylinders with the conserved histidine shown as sticks. The area denoted by the red dashed line exhibits a similar overall architecture among DGAT1 and DltB (MBOAT-core) that is not found in other protein structures. Note that beyond this common area, the resolved N-terminal and TM1 region in DGAT1 appear as extra structural elements beyond the MBOAT-core region as compared to DltB. c, Structure-based sequence alignment of DGAT1 and DltB. The squiggles on the top represent α-helices in DGAT1 (blue) and DltB (orange). Sequences in the black rectangle indicate the most structurally variable region in the two enzymes. In DGAT1, these regions are involved in dimer formation, whereas in DltB, the equivalent two helices (TM1 and TM2) seal off the lateral cavity within the membrane (see main text). Sequence in green rectangle denotes the alanyl-donor binding pocket in DltB. The red triangle denotes the conserved histidine. The alignment was performed with PROMALS3D43, and the final alignment figure was generated with ESPript 3.044.
Extended Data Fig. 6 |. DGAT1 sequence alignment and conservation analysis of MBOAT enzymes.
a, Sequence alignment of DGAT1 enzymes from different species. The color scheme of amino acids is based on their physicochemical properties. A red triangle denotes the highly conserved histidine residue; black triangles denote highly conserved polar residues in DGAT1’s active center; black squares denote residues interacting with oleoyl-CoA. The residue numbers for human DGAT1 are indicated at the top. The sequence alignment was performed with T-COFFEE45, and the final alignment figure was generated with ESPript 3.044. b, Sequence alignment of MBOAT enzymes that acylate lipids (DGAT1, ACAT1) or proteins (PORCN, GOAT). Structural information of DGAT1 was incorporated into the alignment, where the regions containing cluster of conserved residues among MOBAT enzymes were labeled as blue box. Note the alignment starts at Arg250 of DGAT1. c, Mapping the conserved blue region shown in b into the DGAT1 structure. The DGAT1 structure is shown as gray cylinders. Blue areas denote the conserved region among MBOATs. Note the acyl-CoA binding tunnel in DGAT1 containing the most conserved region among MBOATs (blue area in b) is highlighted by the dashed circle.
Extended Data Fig. 7 |. Cryo-EM image processing of human DGAT1 supplemented with acyl-CoA substrate.
a, Representative cryo-EM image of DGAT1 with oleoyl-CoA. Some DGAT1 particles are marked by circles. b, 2D class averages of cryo-EM particle images with the box size of 210Å. c, Three-dimensional classification and refinement of cryo-EM particle images. The processing flow is similar to the data set without acyl-CoA treatment (Extended Data Fig. 2). After the second round of 3D classification, all particles classified into class #6 during the final five iterations (indicated as ‘5 cycles’) were kept for next round of non-alignment classification into six classes. Particles in each class (estimated resolution shown in parentheses) were individually refined. After per-particle CTF and beam-tilt corrections, two resulting maps were chosen to represent DGAT1 complexed with the intact and broken oleoyl-CoA molecule.
Extended Data Fig. 8 |. Single-particle cryo-EM analysis of DGAT1 with acyl-CoA substrate.
a, Local resolution of the final cryo-EM map of DGAT1 (shown as sliced view) complex with an intact oleoyl-CoA molecule. b, FSC curves: gold-standard FSC curve between the two half maps with indicated resolution at FSC = 0.143 (red); FSC curve between the atomic model and the final map with indicated resolution at FSC = 0.5 (blue); FSC curve between half map 1 (orange) or half map 2 (green) and the atomic model refined against half map. c, Cutaway views of angular distribution of particle images included in the final 3D reconstruction. d-f, Similar to a-c, but shown the cryo-EM analysis of the map with a broken oleoyl-CoA density. Note in e only FSC curve between half maps was calculated. g, Cryo-EM densities that with the intact oleoyl-CoA density (shown in a-c) superimposed with the atomic model for individual transmembrane helices similar to that shown in Extended Data Fig. 3d. Maps are contoured at 4 σ.
Extended Data Fig. 9 |. Cryo-EM density analysis of the bound acyl-CoA and lipid-like density and mutagenesis study of residues interacting with oleoyl-CoA substrate.
a, A side-by-side density comparison of the bound oleoyl-CoA molecule, oleoyl-CoA with a broken density, and density in the acyl-CoA binding pocket without oleoyl-CoA treatment. b, Cryo-EM density map of the oleoyl-CoA molecule and the surrounding region. Maps are shown at different contour level to illustrate mobility of the adenosine moiety (red arrowhead) of oleoyl-CoA. In contrast, the phosphopantetheine region (green arrowhead) exhibits a stronger density signal. c, Activities of acyl-CoA binding tunnel alanine mutants of DGAT1 expressed in DGAT1 knockout cells. d, Activities of the bulky sidechain substitutions of residues in the acyl-CoA binding tunnel. Activities in c and d were normalized to the amount of DGAT1 protein expressed (mean ± SD, n=3 independent experiments). Analysis was performed using one-way ANOVA with Dunnett’s post hoc test. e, Effect of the acyl-chain of the acyl-donor substrate on DGAT1 activity. The analyses used purified DGAT1 in amphipol (mean ± SD, n=3 independent experiments). Analysis was performed using one-way ANOVA with Dunnett’s post hoc test comparing C18:1-CoA to other acyl-CoA substrates (colored in dark gray). f, The zoomed-in views of the lipid-like density in the oleoyl-CoA–free DGAT1 monomer structure shown as surface representation. The protein surface at His415 in the zoomed-in view is colored in orange. Map is contoured at 3.5 σ. g, Cryo-EM density in orange showing both the bound acyl-CoA with a broken signal and the lipid like density. A black arrowhead denotes the disconnected acyl chain in oleoyl-CoA molecule. A cyan arrowhead indicates the connected density between the acyl-chain of oleoyl-CoA and the uncharacterized lipid-like density at lower contour level.
Extended Data Fig. 10 |. FSEC, western blot and activity analyses of DGAT1 mutants.
a, FSEC profiles of wild type and all tested mutants in this study. DGAT1 and mutants were transiently expressed as GFP-fusion proteins in HEK293 cells. The folding of each mutant was analyzed by size-exclusion chromatography monitoring GFP fluorescence. All tested mutants exhibit peaks similar to the wild-type DGAT1 protein, suggesting their correct overall protein folding. b, Western blot analyses of wild type and tested DGAT1 mutant proteins expressing in SUM159 DGAT1 knockout cells. Untrans., untransfected control. c, Activity of wild type and selected DGAT1 mutants purified by His-tag affinity chromatography purification. The upper panel of the raw TLC plates showed the formation of TG. The assays were performed with or without DGAT1 inhibitor (D1i) (mean ± SD, n=3 independent experiments). One-way ANOVA with Dunnett’s post hoc test was applied. Data shown in a-c were repeated twice with similar results.
Extended Data Table 1 |.
Cryo-EM data collection, refinement and validation statistics
| DGAT1 in PMAL-C8 (EMD-21461) (PDB 6VYI) | DGAT1 with intact oleoyl-CoA (EMDB-21481) (PDB 6VZ1) | DGAT1 with broken oleoyl-CoA density (EMDB-21488) | |
|---|---|---|---|
| Data collection and processing | |||
| Magnification | 105,000 | 105,000 | 105,000 |
| Voltage (kV) | 300 | 300 | 300 |
| Electron exposure (e-/Å2) | 52 | 43 | 43 |
| Defocus range (μm) | 1.5–3.0 | 1.0 – 2.5 | 1.0 −2.5 |
| Pixel size (Å) | 0.825 | 0.83 | 0.83 |
| Symmetry imposed | C2 | C2 | C2 |
| Initial particle images (no.) | 2,161,707 | 2,143,738 | 2,143,738 |
| Final particle images (no.) | 61,608 | 28,165 | 27,750 |
| Map resolution (Å) | 3.0 | 3.2 | 2.8 |
| FSC threshold | 0.143 | 0.143 | 0.143 |
| Map resolution range (Å) | 211.2–3.0 | 212.5–3.2 | 212.5–2.8 |
| Refinement | |||
| Initial model used (PDB code) | NA | NA | |
| Model resolution (Å) | |||
| FSC threshold | 0.143 | 0.143 | |
| Model resolution range (Å) | 211.2–3.0 | 212.5–3.2 | |
| Map sharpening B factor (Å2) | −120 | −103 | |
| Model composition | |||
| Non-hydrogen atoms | 6916 | 7112 | |
| Protein residues | 812 | 822 | |
| Ligands | 4 | 6 | |
| B factors (Å2) | |||
| Protein | 53.8 | 67.4 | |
| Ligand | 44.4 | 67.7 | |
| R.m.s. deviations | |||
| Bond lengths (Å) | 0.01 | 0.01 | |
| Bond angles (°) | 0.74 | 0.85 | |
| Validation | |||
| MolProbity score | 2.1 | 2.1 | |
| Clashscore | 9.3 | 9.9 | |
| Poor rotamers (%) | 0 | 0 | |
| Ramachandran plot | |||
| Favored (%) | 88.8 | 87.9 | |
| Allowed (%) | 11.2 | 12.1 | |
| Disallowed (%) | 0 | 0 |
Acknowledgments
We thank Z. Li, S. Sterling, R. Walsh and S. Rawson at the Harvard cryo-EM center and C. Xu, K. Song and K. Lee at the University of Massachusetts cryo-EM facility for EM data collection; members of the Liao and Farese & Walther laboratories for helpful discussions, B. Schulman (Max Planck Institute of Biochemistry) and T. Rapoport (Harvard Medical School) for comments on the manuscript, and G. Howard for editorial assistance. This work was supported by National Institutes of Health grants R01GM124348 (to R.V. Farese Jr.), and R01GM097194 (to T.C. Walther). X. Sui was supported by the American Heart Association postdoctoral fellowship 18POST34030308. T.C. Walther is an investigator of the Howard Hughes Medical Institute.
Footnotes
Data availability
The three-dimensional cryo-EM density maps have been deposited into the Electron Microscopy Data Bank under accession numbers EMD-21461 (oleoyl-CoA free), EMD-21481 (with intact oleoyl-CoA) and EMD-21488 (with cleaved oleoyl-CoA). The coordinates are deposited into the Protein Data Bank with accession numbers 6VYI (oleoyl-CoA free) and 6VZ1 (with intact oleoyl-CoA). All other un-deposited model and data are available upon request.
Competing interests declaration
The authors declare no competing interests.
References
- 1.Cohen JC, Horton JD & Hobbs HH Human fatty liver disease: old questions and new insights. Science 332, 1519–1523, doi: 10.1126/science.1204265 (2011). [DOI] [PMC free article] [PubMed] [Google Scholar]
- 2.Cases S. et al. Identification of a gene encoding an acyl CoA:diacylglycerol acyltransferase, a key enzyme in triacylglycerol synthesis. Proceedings of the National Academy of Sciences of the United States of America 95, 13018–13023, doi: 10.1073/pnas.95.22.13018 (1998). [DOI] [PMC free article] [PubMed] [Google Scholar]
- 3.Cases S. et al. Cloning of DGAT2, a second mammalian diacylglycerol acyltransferase, and related family members. The Journal of biological chemistry 276, 38870–38876, doi: 10.1074/jbc.M106219200 (2001). [DOI] [PubMed] [Google Scholar]
- 4.Lardizabal KD et al. DGAT2 is a new diacylglycerol acyltransferase gene family: purification, cloning, and expression in insect cells of two polypeptides from Mortierella ramanniana with diacylglycerol acyltransferase activity. The Journal of biological chemistry 276, 38862–38869, doi: 10.1074/jbc.M106168200 (2001). [DOI] [PubMed] [Google Scholar]
- 5.Weiss SB, Kennedy EP & Kiyasu JY The enzymatic synthesis of triglycerides. The Journal of biological chemistry 235, 40–44 (1960). [PubMed] [Google Scholar]
- 6.Yen CL, Stone SJ, Koliwad S, Harris C. & Farese RV Jr. Thematic review series: glycerolipids. DGAT enzymes and triacylglycerol biosynthesis. Journal of lipid research 49, 2283–2301, doi: 10.1194/jlr.R800018-JLR200 (2008). [DOI] [PMC free article] [PubMed] [Google Scholar]
- 7.Yen CL, Monetti M, Burri BJ & Farese RV Jr. The triacylglycerol synthesis enzyme DGAT1 also catalyzes the synthesis of diacylglycerols, waxes, and retinyl esters. Journal of lipid research 46, 1502–1511, doi: 10.1194/jlr.M500036-JLR200 (2005). [DOI] [PubMed] [Google Scholar]
- 8.Wilfling F. et al. Triacylglycerol synthesis enzymes mediate lipid droplet growth by relocalizing from the ER to lipid droplets. Developmental cell 24, 384–399, doi: 10.1016/j.devcel.2013.01.013 (2013). [DOI] [PMC free article] [PubMed] [Google Scholar]
- 9.Chitraju C. et al. Triglyceride Synthesis by DGAT1 Protects Adipocytes from Lipid-Induced ER Stress during Lipolysis. Cell metabolism 26, 407–418 e403, doi: 10.1016/j.cmet.2017.07.012 (2017). [DOI] [PMC free article] [PubMed] [Google Scholar]
- 10.Chitraju C, Walther TC & Farese RV Jr. The triglyceride synthesis enzymes DGAT1 and DGAT2 have distinct and overlapping functions in adipocytes. Journal of lipid research 60, 1112–1120, doi: 10.1194/jlr.M093112 (2019). [DOI] [PMC free article] [PubMed] [Google Scholar]
- 11.Stone SJ et al. Lipopenia and skin barrier abnormalities in DGAT2-deficient mice. The Journal of biological chemistry 279, 11767–11776, doi: 10.1074/jbc.M311000200 (2004). [DOI] [PubMed] [Google Scholar]
- 12.Hofmann K. A superfamily of membrane-bound O-acyltransferases with implications for wnt signaling. Trends in biochemical sciences 25, 111–112, doi: 10.1016/s0968-0004(99)01539-x (2000). [DOI] [PubMed] [Google Scholar]
- 13.McFie PJ, Stone SL, Banman SL & Stone SJ Topological orientation of acyl-CoA:diacylglycerol acyltransferase-1 (DGAT1) and identification of a putative active site histidine and the role of the n terminus in dimer/tetramer formation. The Journal of biological chemistry 285, 37377–37387, doi: 10.1074/jbc.M110.163691 (2010). [DOI] [PMC free article] [PubMed] [Google Scholar]
- 14.Cheng D. et al. Human acyl-CoA:diacylglycerol acyltransferase is a tetrameric protein. The Biochemical journal 359, 707–714, doi: 10.1042/0264-6021:3590707 (2001). [DOI] [PMC free article] [PubMed] [Google Scholar]
- 15.Caldo KMP et al. Diacylglycerol Acyltransferase 1 Is Regulated by Its N-Terminal Domain in Response to Allosteric Effectors. Plant physiology 175, 667–680, doi: 10.1104/pp.17.00934 (2017). [DOI] [PMC free article] [PubMed] [Google Scholar]
- 16.Panigrahi R. et al. Intrinsic disorder in the regulatory N-terminal domain of diacylglycerol acyltransferase 1 from Brassica napus. Scientific reports 8, 16665, doi: 10.1038/s41598-018-34339-1 (2018). [DOI] [PMC free article] [PubMed] [Google Scholar]
- 17.Ma D. et al. Crystal structure of a membrane-bound O-acyltransferase. Nature 562, 286–290, doi: 10.1038/s41586-018-0568-2 (2018). [DOI] [PMC free article] [PubMed] [Google Scholar]
- 18.Campana MB et al. The ghrelin O-acyltransferase structure reveals a catalytic channel for transmembrane hormone acylation. The Journal of biological chemistry 294, 14166–14174, doi: 10.1074/jbc.AC119.009749 (2019). [DOI] [PMC free article] [PubMed] [Google Scholar]
- 19.Grevengoed TJ, Klett EL & Coleman RA Acyl-CoA metabolism and partitioning. Annual review of nutrition 34, 1–30, doi: 10.1146/annurev-nutr-071813-105541 (2014). [DOI] [PMC free article] [PubMed] [Google Scholar]
- 20.Caldo KM, Greer MS, Chen G, Lemieux MJ & Weselake RJ Purification and properties of recombinant Brassica napus diacylglycerol acyltransferase 1. FEBS letters 589, 773–778, doi: 10.1016/j.febslet.2015.02.008 (2015). [DOI] [PubMed] [Google Scholar]
- 21.Chang TY, Li BL, Chang CC & Urano Y. Acyl-coenzyme A:cholesterol acyltransferases. American journal of physiology. Endocrinology and metabolism 297, E1–9, doi: 10.1152/ajpendo.90926.2008 (2009). [DOI] [PMC free article] [PubMed] [Google Scholar]
- 22.Rottig A. & Steinbuchel A. Acyltransferases in bacteria. Microbiology and molecular biology reviews : MMBR 77, 277–321, doi: 10.1128/MMBR.00010-13 (2013). [DOI] [PMC free article] [PubMed] [Google Scholar]
- 23.Walther TC, Chung J. & Farese RV Jr. Lipid Droplet Biogenesis. Annual review of cell and developmental biology 33, 491–510, doi: 10.1146/annurev-cellbio-100616-060608 (2017). [DOI] [PMC free article] [PubMed] [Google Scholar]
- 24.Haas JT et al. DGAT1 mutation is linked to a congenital diarrheal disorder. The Journal of clinical investigation 122, 4680–4684, doi: 10.1172/JCI64873 (2012). [DOI] [PMC free article] [PubMed] [Google Scholar]
- 25.Cao J. et al. Targeting Acyl-CoA:diacylglycerol acyltransferase 1 (DGAT1) with small molecule inhibitors for the treatment of metabolic diseases. The Journal of biological chemistry 286, 41838–41851, doi: 10.1074/jbc.M111.245456 (2011). [DOI] [PMC free article] [PubMed] [Google Scholar]
- 26.He S. et al. Discovery of a Potent and Selective DGAT1 Inhibitor with a Piperidinyl-oxy-cyclohexanecarboxylic Acid Moiety. ACS medicinal chemistry letters 5, 1082–1087, doi: 10.1021/ml5003426 (2014). [DOI] [PMC free article] [PubMed] [Google Scholar]
Method References
- 27.Booth DS, Avila-Sakar A. & Cheng Y. Visualizing proteins and macromolecular complexes by negative stain EM: from grid preparation to image acquisition. Journal of visualized experiments : JoVE, doi: 10.3791/3227 (2011). [DOI] [PMC free article] [PubMed] [Google Scholar]
- 28.Mastronarde DN Automated electron microscope tomography using robust prediction of specimen movements. Journal of structural biology 152, 36–51, doi: 10.1016/j.jsb.2005.07.007 (2005). [DOI] [PubMed] [Google Scholar]
- 29.Liao M, Cao E, Julius D. & Cheng Y. Single particle electron cryo-microscopy of a mammalian ion channel. Current opinion in structural biology 27, 1–7, doi: 10.1016/j.sbi.2014.02.005 (2014). [DOI] [PMC free article] [PubMed] [Google Scholar]
- 30.Zheng SQ et al. MotionCor2: anisotropic correction of beam-induced motion for improved cryo-electron microscopy. Nature methods 14, 331–332, doi: 10.1038/nmeth.4193 (2017). [DOI] [PMC free article] [PubMed] [Google Scholar]
- 31.Rohou A. & Grigorieff N. CTFFIND4: Fast and accurate defocus estimation from electron micrographs. Journal of structural biology 192, 216–221, doi: 10.1016/j.jsb.2015.08.008 (2015). [DOI] [PMC free article] [PubMed] [Google Scholar]
- 32.Ru H. et al. Molecular Mechanism of V(D)J Recombination from Synaptic RAG1-RAG2 Complex Structures. Cell 163, 1138–1152, doi: 10.1016/j.cell.2015.10.055 (2015). [DOI] [PMC free article] [PubMed] [Google Scholar]
- 33.Scheres SH A Bayesian view on cryo-EM structure determination. Journal of molecular biology 415, 406–418, doi: 10.1016/j.jmb.2011.11.010 (2012). [DOI] [PMC free article] [PubMed] [Google Scholar]
- 34.Scheres SH RELION: implementation of a Bayesian approach to cryo-EM structure determination. Journal of structural biology 180, 519–530, doi: 10.1016/j.jsb.2012.09.006 (2012). [DOI] [PMC free article] [PubMed] [Google Scholar]
- 35.Kucukelbir A, Sigworth FJ & Tagare HD Quantifying the local resolution of cryo-EM density maps. Nature methods 11, 63–65, doi: 10.1038/nmeth.2727 (2014). [DOI] [PMC free article] [PubMed] [Google Scholar]
- 36.Adams PD et al. PHENIX: a comprehensive Python-based system for macromolecular structure solution. Acta crystallographica. Section D, Biological crystallography 66, 213–221, doi: 10.1107/S0907444909052925 (2010). [DOI] [PMC free article] [PubMed] [Google Scholar]
- 37.Emsley P. & Cowtan K. Coot: model-building tools for molecular graphics. Acta crystallographica. Section D, Biological crystallography 60, 2126–2132, doi: 10.1107/S0907444904019158 (2004). [DOI] [PubMed] [Google Scholar]
- 38.Pettersen EF et al. UCSF Chimera--a visualization system for exploratory research and analysis. Journal of computational chemistry 25, 1605–1612, doi: 10.1002/jcc.20084 (2004). [DOI] [PubMed] [Google Scholar]
- 39.Chen VB et al. MolProbity: all-atom structure validation for macromolecular crystallography. Acta crystallographica. Section D, Biological crystallography 66, 12–21, doi: 10.1107/S0907444909042073 (2010). [DOI] [PMC free article] [PubMed] [Google Scholar]
- 40.Wallace AC, Laskowski RA & Thornton JM LIGPLOT: a program to generate schematic diagrams of protein-ligand interactions. Protein engineering 8, 127–134, doi: 10.1093/protein/8.2.127 (1995). [DOI] [PubMed] [Google Scholar]
- 41.Ran FA et al. Genome engineering using the CRISPR-Cas9 system. Nature protocols 8, 2281–2308, doi: 10.1038/nprot.2013.143 (2013). [DOI] [PMC free article] [PubMed] [Google Scholar]
- 42.Gluchowski NL et al. Identification and characterization of a novel DGAT1 missense mutation associated with congenital diarrhea. Journal of lipid research 58, 1230–1237, doi: 10.1194/jlr.P075119 (2017). [DOI] [PMC free article] [PubMed] [Google Scholar]
- 43.Pei J, Kim BH & Grishin NV PROMALS3D: a tool for multiple protein sequence and structure alignments. Nucleic acids research 36, 2295–2300, doi: 10.1093/nar/gkn072 (2008). [DOI] [PMC free article] [PubMed] [Google Scholar]
- 44.Robert X. & Gouet P. Deciphering key features in protein structures with the new ENDscript server. Nucleic acids research 42, W320–324, doi: 10.1093/nar/gku316 (2014). [DOI] [PMC free article] [PubMed] [Google Scholar]
- 45.Notredame C, Higgins DG & Heringa J. T-Coffee: A novel method for fast and accurate multiple sequence alignment. Journal of molecular biology 302, 205–217, doi: 10.1006/jmbi.2000.4042 (2000). [DOI] [PubMed] [Google Scholar]


