Abstract
It is important for antitumor drugs to accumulate at the tumor site and penetrate deeply to play a role in treatment. However, it is difficult for the drugs to reach the destination on account of the complex tumor microenvironment such as elevated tumor interstitial fluid pressure (IFP) and solid stress. Here, we report a type of nanocarrier composed entirely of Camellia oleifera protein (COP), which could lower tumor IFP and solid stress. Its physicochemical properties, cellular uptake, in vitro cytotoxicity and tumor perfusion, biodistribution, and in vivo antitumor efficiency were evaluated. It was found that COP NPs had good cellular uptake ability and cytocompatibility. When loading doxorubicin, COP NPs showed an in vitro concentration-dependent cytotoxicity. Importantly, the tumor IFP and solid stress were greatly reduced after injecting COP NPs into tumor-bearing mice, leading to more drug accumulating in the tumor and a longer survival time for tumor-bearing mice. Therefore, our study provided a new strategy to improve the tumor microenvironment and to achieve better antitumor efficiency.
1. Introduction
In recent years, many efforts have been made to use nanoparticles as carriers for enhancing the penetration, accumulation and retention time of antitumor drugs in the tumor area.1–6 Nanoparticles enter tumor tissues through the mutant tumor blood vessels and remain in the tumor area for a longer time than in normal organs due to the weaker lymphatic drainage.7 However, there are still complex tumor microenvironments preventing nanoparticles from efficient drug delivery, such as elevated tumor interstitial fluid pressure (IFP) and tumor solid stress.8–10 Thus, many efforts have been made to improve the tumor microenvironment for better drug delivery efficiency.11–14 Jain’s group found that losartan could inhibit the synthesis of collagen I and hyaluronan in the tumor, lower tumor solid stress and increase the tumor vascular perfusion, improving the delivery of nanoparticles to interstitial and intratumoral areas.15,16 The normalization of tumor blood vessels by anti-vascular endothelial growth factor receptor 2 (VEGFR2) could improve the tumor microenvironment and enhance the therapeutic effect.17 Shen’s group modified cationic nanostructured lipid carriers with gelatin and effectively lowered tumor IFP to help the antitumor drug suppress tumor growth and pulmonary metastasis.18 Our group designed nanoparticles based on soy protein and found that these phenylboronic acid-decorated nanoparticles could lower tumor IFP and solid stress to a great degree. The improved tumor microenvironment finally helped free doxorubicin (DOX) accumulate more in the tumor site than control groups, inhibit tumor growth and prolong the survival time of tumor-bearing mice.19 Inspired by this discovery of soy protein nanoparticles, we further explored other plant proteins that could regulate the tumor microenvironment.
Camellia oleifera protein (COP) extracted from camellia seed meal is an acidic glycoprotein, containing all essential human amino acids. The isoelectric point of COP is about 3.6 and the glycopeptide linkage is an O-linkage.20 COP has good physiological activities.21–23 However, intrinsic chemical and biological activities of COP have not been fully exploited, and the potential applications of COP as nanocarriers are not investigated.
Here we reported a type of nanoparticle composed entirely of COP with the ability to improve the tumor microenvironment by lowering tumor IFP and solid stress. COP nanoparticles were prepared by polymerizing acrylic acid monomers in the presence of COP to form nanoparticles (COP–PAANPs).24–26 After crosslinking COP alone, PAA was removed from the nanoparticles, obtaining single Camellia oleifera protein nanoparticles (COP NPs).27 The in vitro and in vivo biological effects of COP NPs were investigated (Scheme 1).
Scheme 1.
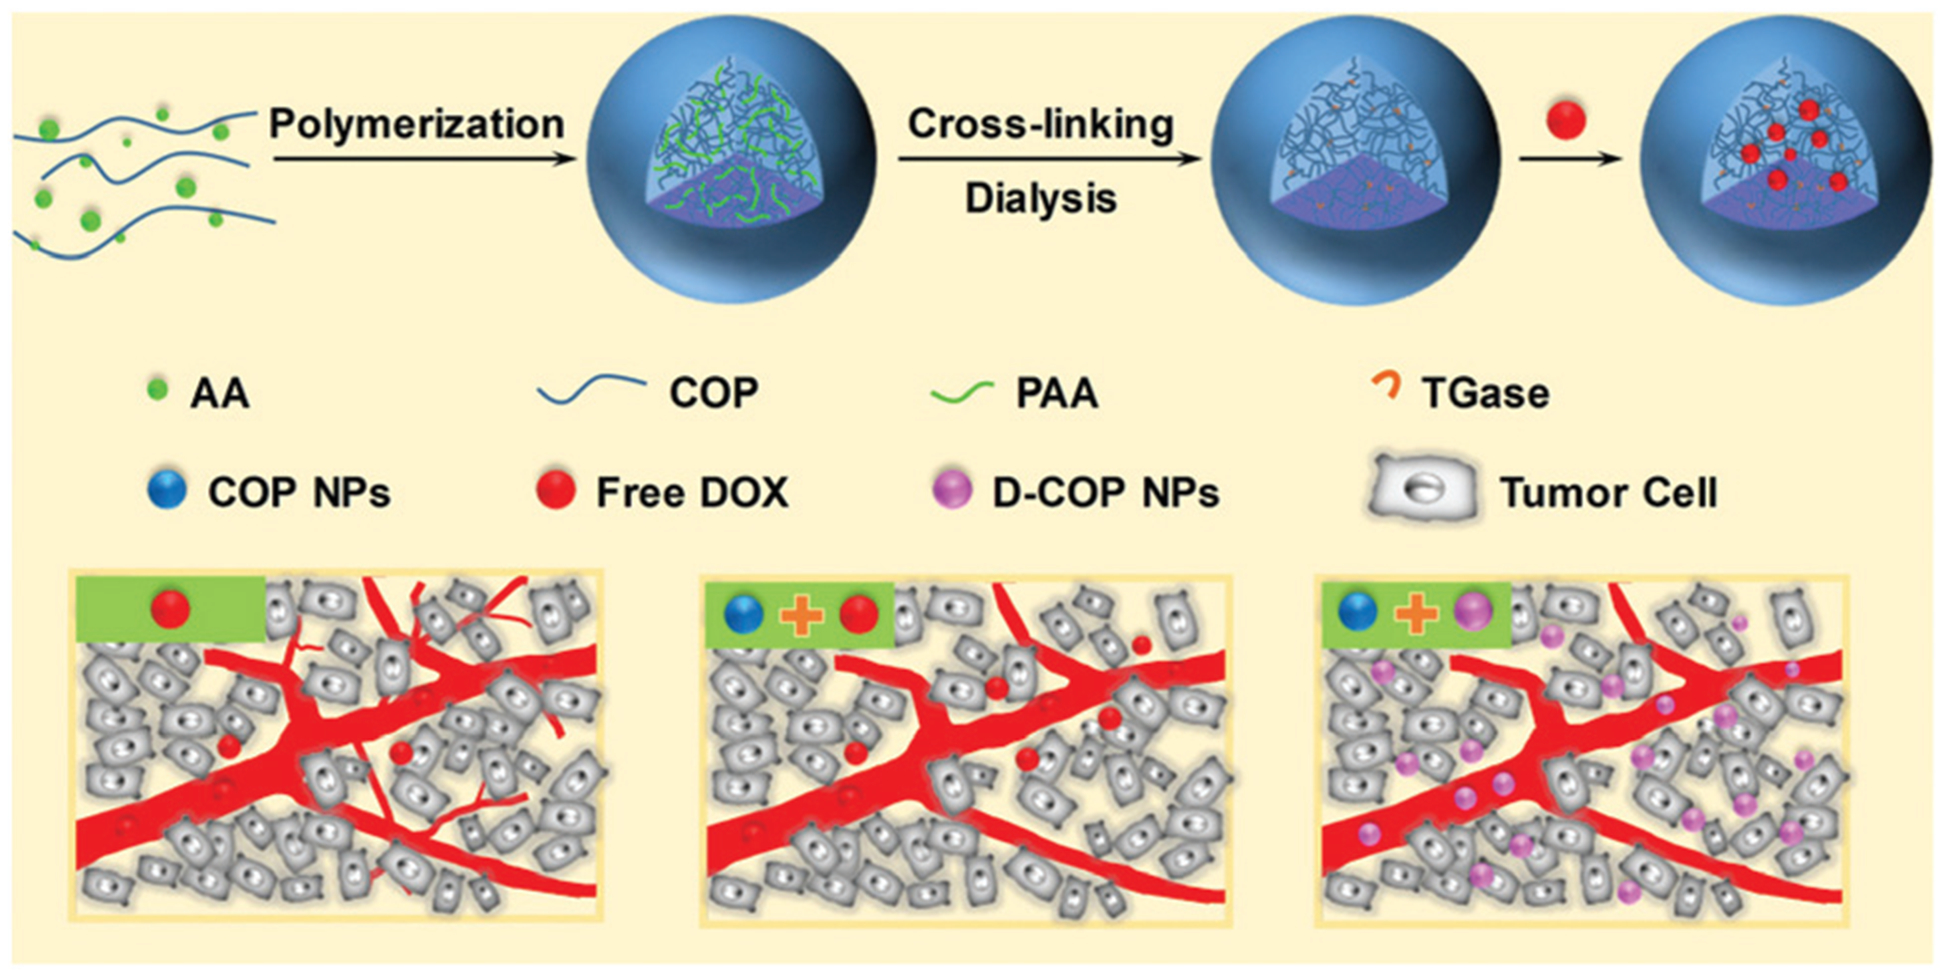
Schematic illustration of the preparation of Camellia oleifera protein nanoparticles and improved accumulation and penetration of DOX after tumor microenvironment improvement with these nanoparticles.
2. Materials and methods
2.1. Materials
Camellia oleifera seed meal was bought from Xinyu Yuezhou Oil and Grease Co., Ltd (Jiangxi Province, China). Transglutaminase (TGase) was given as a gift from Taixing Xinpu Chemical Co., Ltd (Jiangsu Province, China). Acrylic acid (AA) and 4,4′-azobis(4-cyanovaleric acid) (ACVA) were obtained from J&K Scientific Co., Ltd (Beijing, China). Rhodamine B (Rb), 3-(4,5-dimethylthiazol-2-yl)-2,5-diphenyltetrazolium bromide (MTT), Hoechst 33258, Hoechst 33342, 4′,6-diamidino-2-phenylindole (DAPI), Dulbecco’s modified Eagle’s medium (DMEM) and doxorubicin (DOX·HCl) were purchased from Jiangsu Keygen Biotech Co., Ltd (Jiangsu Province, China). Rat anti-mouse CD31, donkey anti-rat Alexa-488, anti-collagen I antibody, anti-hyaluronic acid antibody, anti-TGF-β1 antibody and goat anti-rabbit IgG H&L (Alexa Fluor 488) were obtained from Abcam Trading Co., Ltd (Shanghai, China). All other reagents were of analytical grade and used without further purification.
Murine hepatic tumor cells (H22) and mouse colon carcinoma cells (CT26) were obtained from the Shanghai Institute of Cell Biology (Shanghai, China). Male ICR and BALB/c mice (4–6 week old, weighing 18–20 g) were provided by the Animal Center of Drum Tower Hospital (Nanjing, China). All animal studies were performed in compliance with the guidelines set by the Animal Care Committee at Drum-Tower Hospital.
2.2. Separation and purification of COP
The Camellia oleifera seed meal was dissolved in 90% ethanol at a weight to volume ratio of one to nine and stirred for 2 h at 55 °C. The solution was filtered and the filtered residue was extracted with Tris-HCl buffer solution (pH = 8.0) at 4 °C for 8 h. The extracted solution was then precipitated with ammonium sulfate and dialyzed in distilled water. The obtained COP was lyophilized and analyzed by sodium dodecyl sulfate polyacrylamide gel electrophoresis (SDS-PAGE).
2.3. Synthesis of COP NPs
40 mg purified COP and 30 μL AA were dissolved in 10 mL distilled water and the pH was adjusted to 3.0. A certain amount of initiator ACVA was added and the solution was heated to 90 °C under the protection of argon. When the solution started to appear blue, the COP–PAA nanoparticles were formed. Then the reaction was continued for another 20 min. The solution was filtered with a filter paper after being cooled to room temperature, and then a certain amount of cross-linking agent TGase was added into the solution to crosslink the COP component in the nanoparticles at a pH of 5.5 and 37 °C for 72 h. The cross-linked nanoparticles were dialyzed in distilled water with a cutoff molecular weight of 100 kDa for 72 h to remove residual PAA and AA.
2.4. Characterization of COP NPs
The mean diameter and size distribution of COP NPs in deionized water were detected by dynamic light scattering (DLS) (Brookhaven, NanoBrook Omni, USA). The morphology of COP NPs was observed with transmission electron microscopy (TEM) (JEM-1011, Japan). The stability of COP NPs in deionized water, phosphate buffered saline (PBS), saline and DMEM was continuously observed through DLS within four days. The infrared spectra of the lyophilized COP, COP–PAA NPs and COP NPs were recorded with a Fourier transform infrared spectrometer (FT-IR, Nicolet iS10, USA).
2.5. Preparation of fluorescent dyed COP NPs and DOX-loaded COP NPs
1 mg rhodamine B (Rb) dissolved in 200 μL dimethyl sulfoxide (DMSO) was added to 800 μL COP NPs (5 mg mL−1) and stirred overnight in the dark. The Rb-labeled COP NPs were dialyzed in PBS (0.01 M, pH = 7.4) to remove free rhodamine B. For the preparation of DOX-loaded COP NPs (D-COP NPs), 2 mg DOX·HCl dissolved in 200 μL distilled water was added to 800 μL COP NPs (5 mg mL−1) and stirred overnight in the dark. The D-COP NPs were centrifuged at high speed and the concentration of free DOX left in the centrifugal liquid was detected using UV-vis spectrometry (UV-5300, Shanghai Metash Instruments Co., Ltd, China). The drug loading content (DLC) and drug loading efficiency (DLE) were calculated as our previous work.19 The in vitro DOX release was carried out by putting 0.5 mL D-COP NPs in a dialysis bag (MWCO, 14 kDa), dipping these bags in 5 mL PBS (0.01 M, pH = 5.0, 6.0 or 7.4) and vibrating the system at 37 °C in the dark. The PBS was replaced at certain times, collected for detecting the absorbance with UV-vis spectrometry and the cumulative release concentration was calculated.
2.6. Cellular uptake and penetration in multicellular tumor spheroids
CT26 and H22 cell lines were chosen to evaluate the cellular uptake ability of COP NPs. The CT26 cells were seeded at a density of 1 × 10⁵ per well in a six-well plate with a cover glass for 24 h and H22 cells were seeded at a density of 2.5 × 10⁵ per well. Rb-Labeled or DOX-loaded COP NPs were added and co-incubated for 4 h at 37 °C. The cells were washed more than three times with sterile PBS to remove free Rb-labeled or DOX-loaded nanoparticles and fixed with 4% paraformaldehyde. Hoechst 33258 was used to dye the cell nuclei for 10 min and washed to remove the free dye. The final cellular uptake ability of COP NPs was examined by confocal laser scanning microscopy (CLSM, Zeiss LSM 710, Germany).
The CT26 cell line was chosen to prepare the three-dimensional (3-D) multicellular tumor spheroids (MCTs) to simulate tumor tissues in vitro according to our earlier work.28 When the diameter of these MCTs became larger than 200 μm, a 5 mL Eppendorf tube was used to pick a certain number of MCTs and Rb-labeled nanoparticles were added and co-cultured for 24 h at 37 °C. Finally, the MCTs were washed with PBS and observed by CLSM.
2.7. In vitro cytotoxicity of D-COP NPs
CT26 and H22 cell lines were chosen to evaluate the in vitro cytotoxicity of DOX-loaded COP NPs by MTT assay. Blank COP NPs and free DOX were chosen as control groups. For the CT26 cell line, a density of 5000 cells per well were placed on 96-well plates with culture medium for 24 h, and the cells were co-cultured with several determined concentrations of COP NPs, free DOX, and D-COP NPs for another 24 h or 48 h, respectively. The culture medium was carefully replaced with 180 μL fresh medium per well and 20 μL sterile PBS containing 100 μg MTT per well was added to interact with living cells to produce formazan. Finally, the medium was sucked out and 150 μL DMSO was added to dissolve the formazan. For the H22 cell line, a density of 5000 cells per well with 90 μL culture medium were added and cultured for 24 h. 10 μL sample per well with determined concentrations was added and cultured for 24 h or 48 h. 10 μL culture medium with MTT (5 mg mL−1) was added and 90 μL DMSO was added after 4 h. A microplate reader (Huadong, DG-5031, NJ) was used to detect the absorbance of formazan at 570 nm.
2.8. Measurement of tumor IFP and solid stress
H22 tumor-bearing ICR mice were chosen to measure the tumor IFP, while CT26 tumor-bearing BALB/c mice were chosen to measure the solid stress. First, the H22 cell line was planted at the left flank of ICR mice and the mice were observed every other day until the tumor grew up to 1 cm3. Then, these mice were randomized into several groups and different doses of COP NPs were intravenously (i.v.) injected through the tail vein. A multi-channel physiological signal acquisition system (Chengdu Instrument Factory, China) was used to measure the tumor IFP at several determined time points. The best injection condition was selected. The tumor-bearing mice were treated once, twice and thrice individually under the best injection dose with 24 h interval. Finally, the mice were divided into two groups, one group with no treatment and the other group were treated thrice. Hoechst 33342 was i.v. injected to intuitively evaluate tumor perfusion after the change of tumor IFP.19 The CT26 cell line was planted into the BALB/c mice at the left flank and the mice were observed until the tumor volume closed to 1 cm3. The best injection condition above was selected and the BALB/c mice were treated once, twice, and thrice to measure the change in solid stress. The tumors were collected and cut through the middle to about 80% along the longest diameter. They were then dipped into saline and the tumor opening was recorded.19 To explore the possible mechanisms, H22 tumors were collected, fixed with 4% paraformaldehyde, dehydrated with 30% sucrose, froze and cut into slices with a thickness of 9 μm. Antibodies of collagen I, hyaluronan and TGF-β1 were used to stain the tumor slices and Alexa 488 (goat anti rabbit) was chosen as the secondary antibody.
2.9. Penetration of COP NPs in vivo
H22 tumor-bearing mice were selected to explore the penetration and accumulation ability of COP NPs in the tumor area. The mice were divided into three groups. One group of them was pretreated with a selected dose of COP NPs thrice and then Rb-labeled COP NPs were i.v. injected. For the other two groups without pretreatment, saline and Rb-labeled COP NPs were i.v. injected, respectively. The mice were sacrificed after 24 h and the tumors were cut into slices like above. Monoclonal antibody CD31 and secondary antibody Alexa 488 (donkey anti-rat) were chosen to mark the tumor blood vessels.
2.10. Biodistribution of DOX in H22 tumor-bearing mice
H22 tumor-bearing mice were chosen to measure the drug delivery efficiency of COP NPs in vivo. When the tumors reached about 500 mm3, the mice were divided into four groups randomly. The tumor microenvironments of groups 2 and 4 were improved by the intravenous injection of COP NPs at a dosage of 120 mg kg−1 once every day for three days. Then groups 1 and 2 were treated with free DOX (4 mg kg−1) while groups 3 and 4 with D-COP NPs (4 mg kg−1 DOX, equally). The mice were sacrificed at several determined time points and blood together with major organs, such as heart, liver, spleen, lungs, kidneys and tumors, were collected. The blood was centrifuged. The supernatant and weighed major organs were extracted in 70% ethanol with 0.3 M HCl, respectively. After centrifugation of the extract, the fluorescence intensity of DOX in the supernatant was detected by using a fluorescence spectrometer (Steady-State Fluorescence Spectroscopy, Horiba Jobin Yvon, FM-4NIR).
2.11. Antitumor efficiency of D-COP NPs
H22 cells were planted at the left flank of ICR mice and these ICR mice were observed every day. When the tumor grew up to about 50 mm3, the mice were divided into six groups randomly and groups 2, 4 and 6 were pretreated with the injection of 120 mg kg−1 COP NPs once every day for three days. Then, groups 1 and 2 were injected with saline, groups 3 and 4 were injected with free DOX (4 mg kg−1), groups 5 and 6 were injected with D-COP NPs (4 mg kg−1 DOX, equally) and this day was marked as day 1. The diameter of the tumor was measured every other day by using a Vernier caliper and the longest diameter (a) and shortest diameter (b) were recorded after treatment. The tumor volume (V) was calculated as V = a × b2/2.29 The tumor growth inhibition (TGI) was calculated as TGI = (1 − VF/Vcontrol) × 100%. The body weight and number of surviving mice were recorded every other day.
2.12. Statistical analysis
Data are reported as mean ± S.D. Student’s t-test was used to compare the difference and P value less than 0.05 was considered statistically significant.
3. Results and discussion
3.1. Preparation of COP NPs
Theoretically, the COP protein is composed of 148 amino acids and has a molecular weight of 16.87 kDa.30 Here the molecular weight of purified COP was about 16–17 kDa detected using SDS-PAGE (Fig. S1, ESI†), and the purity was acceptable based on the result of SDS-PAGE. The COP–PAA NPs were formed by the non-covalent interaction between PAA generated and COP during the polymerization of AA. The nanoparticles were then stabilized through the selective cross-linking of COP by TGase, a protein catalyst capable of catalyzing the acyl transfer reaction between the γ-carboxyl group of glutamine residue and primary amine.31,32 The COP–PAA nanoparticles cross-linked by TGase had a strong stability to environmental changes, and were expected to extend the blood circulation time.33 Because COP was cross-linked by TGase, the PAA component which non-covalently interacted with COP could be removed by dialysis in PBS (0.01 M, pH = 7.4), and thus pure full COP NPs were obtained finally. The FT-IR spectra before and after the dialysis of the nanoparticles are shown in Fig. 1A. Before the dialysis, the nanoparticles had a strong absorption at 1714 cm−1 for the vibration of the CvO group in PAA and 1644–1645 cm−1 for the vibration of the amide bond of COP, while the CvO absorption disappeared and the amide bond was held after dialysis, indicating that PAA was totally removed from nanoparticles and single COP component NPs were obtained. The hydrodynamic diameter of COP NPs was about 87 nm detected by DLS (Fig. 1B) and these nanoparticles were uniformly distributed in a spherical shape with an average particle size of about 65 nm observed by TEM (Fig. 1C). The obtained COP NPs were stable in different solutions for four days at least and suitable for the next in vitro and in vivo biological experiment (Fig. 1D).
Fig. 1.
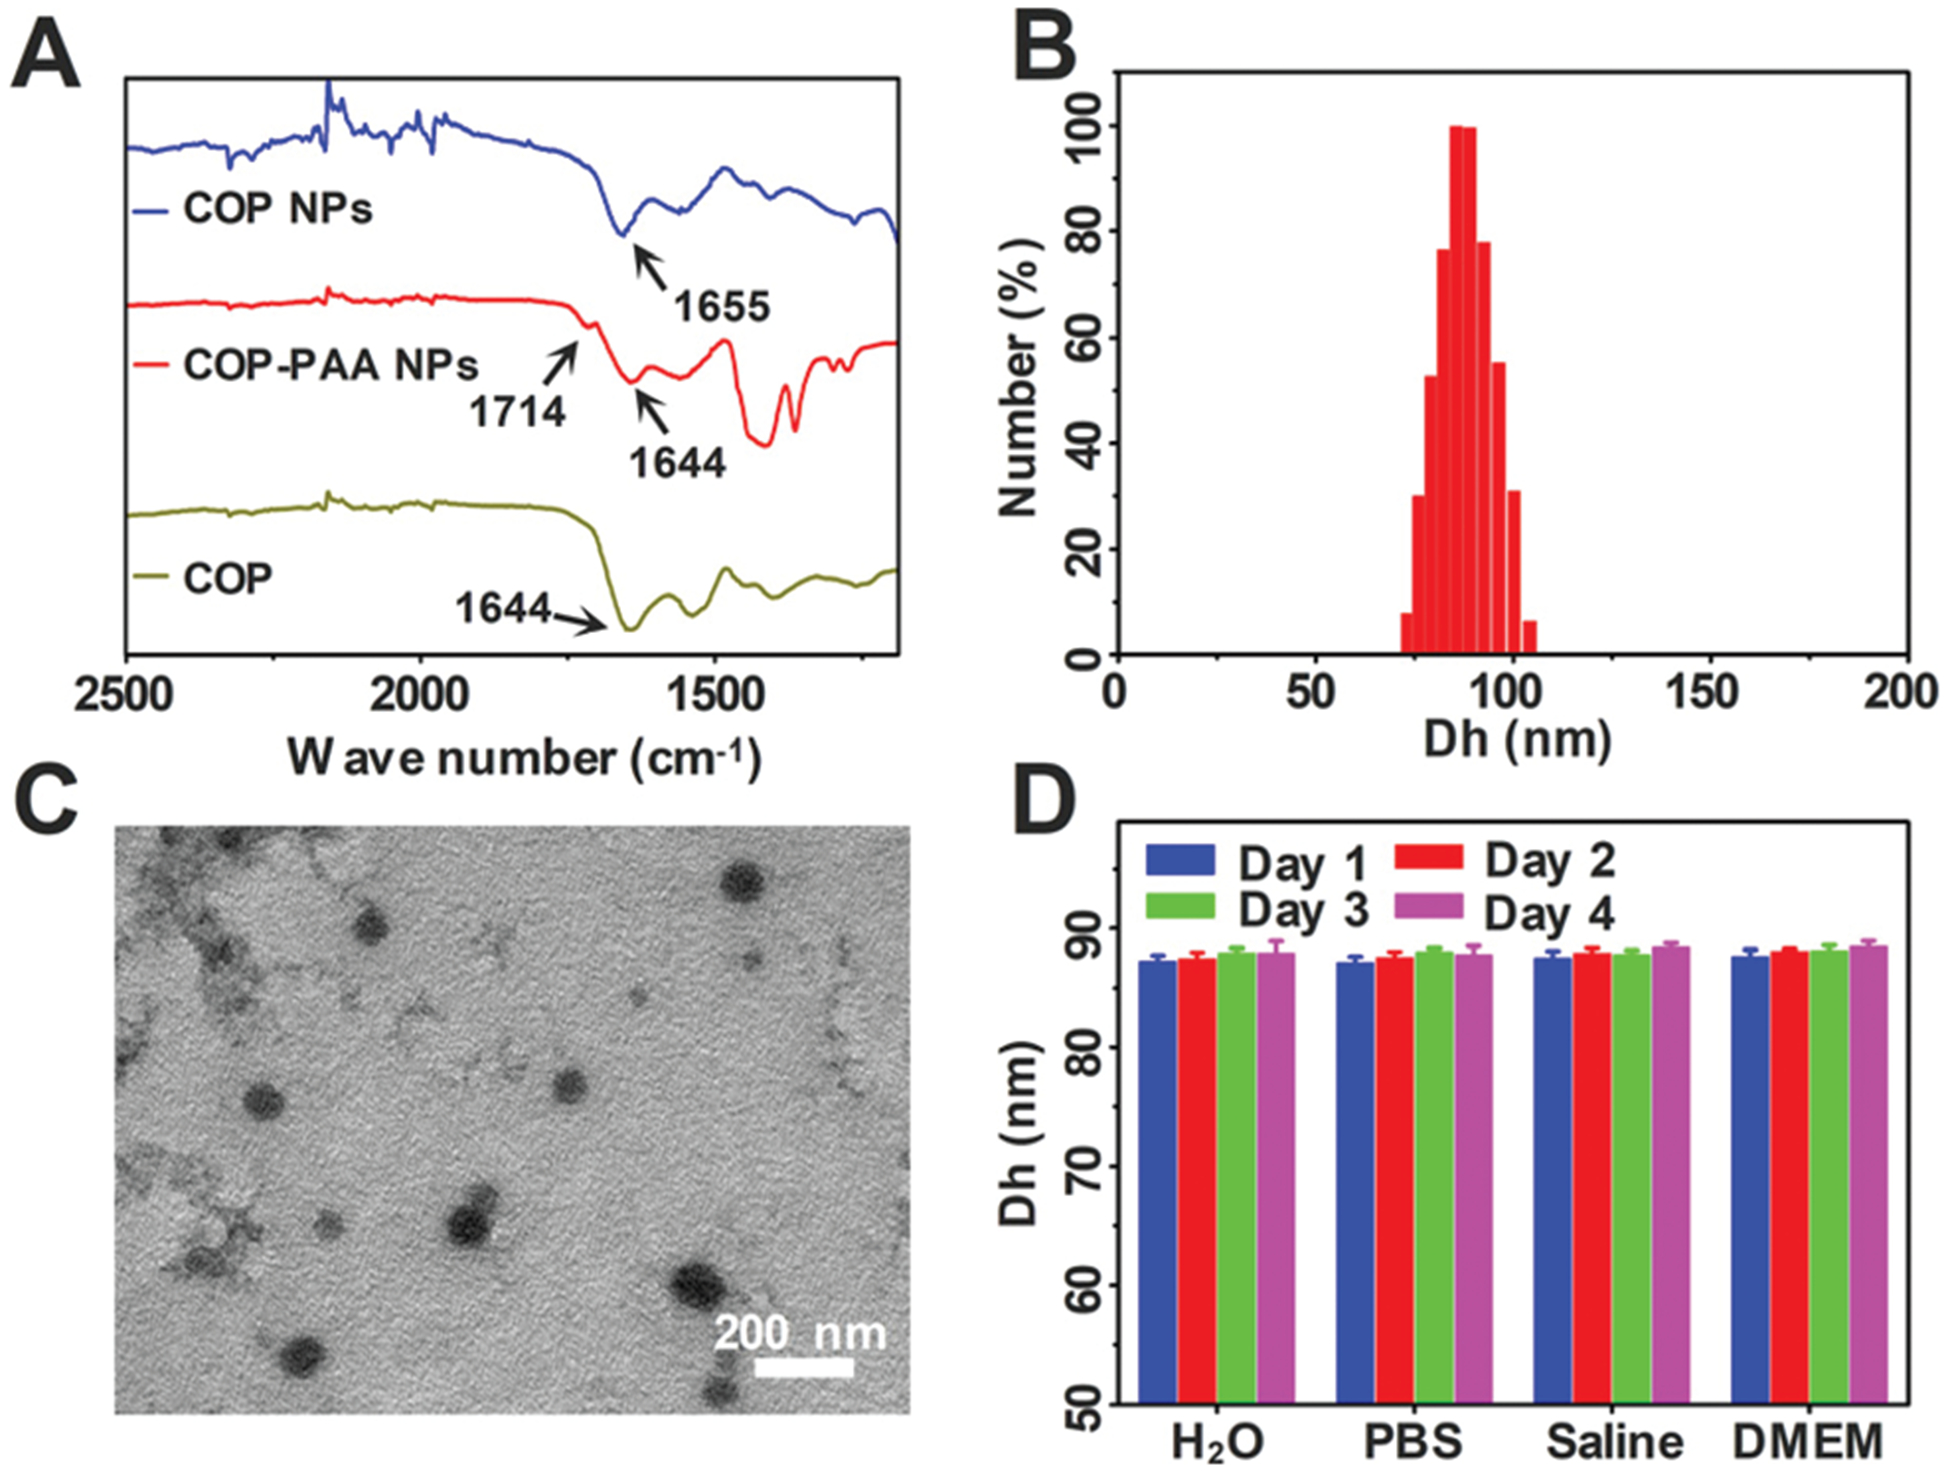
(A) The FT-IR spectra of purified COP, COP–PAA NPs and COP NPs; (B) the hydrodynamic diameter distribution of COP NPs; (C) TEM image of COP NPs; (D) the stability of COP NPs in ultrapure water, PBS (0.01 M, pH = 7.4), saline and DMEM. Data are represented as mean ± SD (N = 3).
3.2. Cellular uptake and penetration in MCTs
To observe the cellular uptake behavior of COP NPs, rhodamine B was used to label COP NPs. After co-incubation with CT26 and H22 for 4 h, respectively, it could be seen that the Rb-labeled COP NPs were evenly dispersed in the cytoplasm without a typical punctuated fluorescence pattern in CT26 and H22 cells, and only a few COP NPs could penetrate the nuclear membrane to enter the cellular nucleus (Fig. 2). Here the CT26 cell is a type of adherent cell while the H22 cell is a kind of suspended cell. Apparently, COP NPs could well internalized by both adherent cells and suspended cells. This might be attributed to the strong cell entry ability of COP NPs. The cellular uptake behavior of DOX-loaded COP NPs was also observed after co-incubation with CT26 and H22 for 4 h, respectively. DOX dispersed mostly in the cytoplasm of CT26 cells and in the cellular nucleus of H22 cells (Fig. S2, ESI†). This might be ascribed to the drug release from DOX-loaded COP NPs, and the released DOX could penetrate the cellular nucleus itself.
Fig. 2.
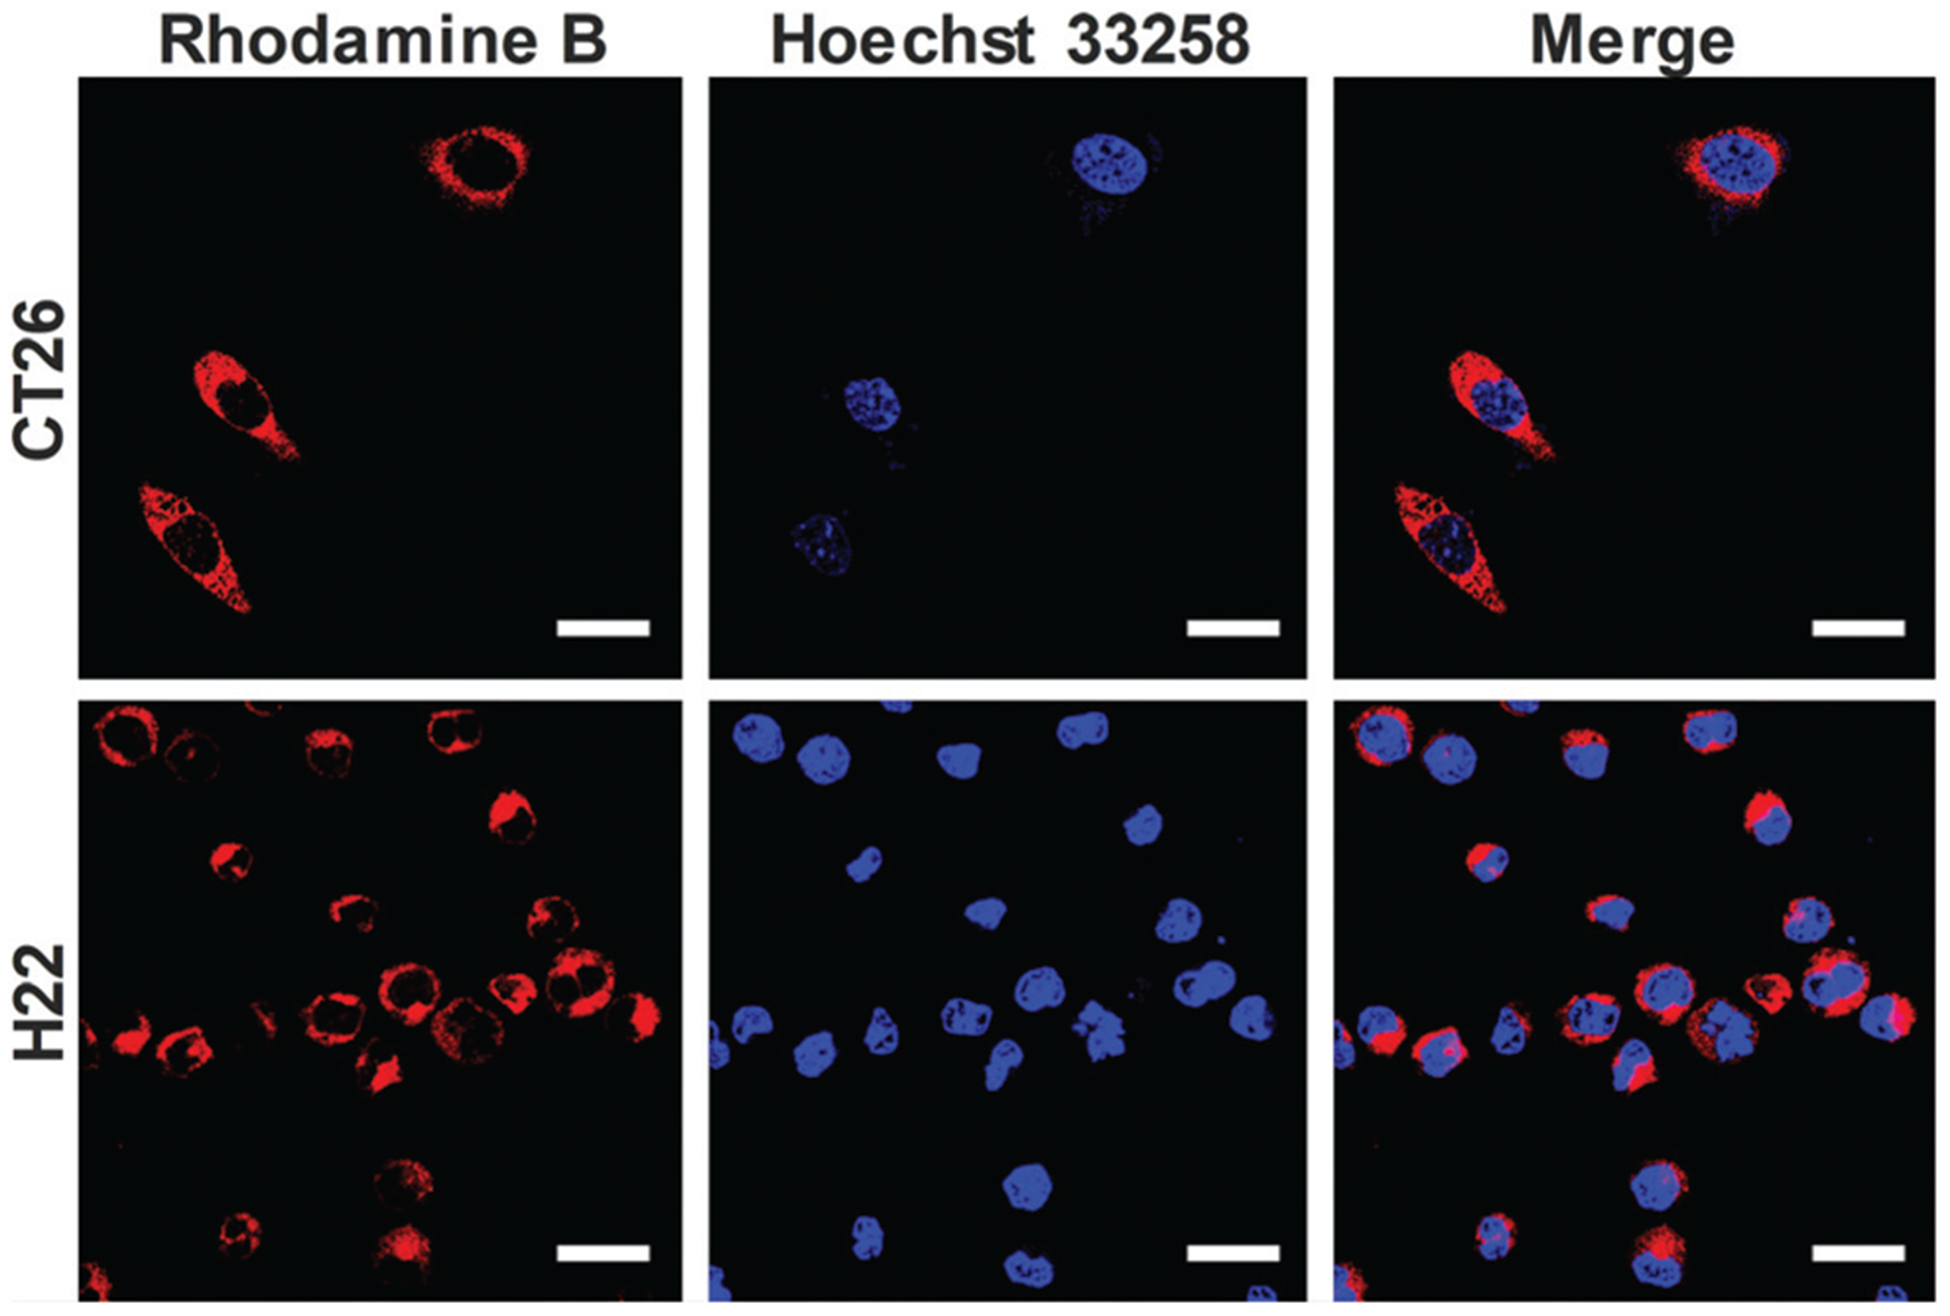
CLSM images of CT26 and H22 cells incubated with Rb-labeled COP NPs. Red represents nanoparticles and blue represents the cell nucleus. Scale bar = 20 μm.
To observe the penetration behavior of COP NPs in tumor tissues, MCTs were used to simulate tumor tissues due to their compact cell accumulation and extracellular matrix. Here we chose CT26 cells to prepare MCTs to evaluate the permeability of COP NPs in 3-D cells in vitro. After the co-incubation of Rb-labeled COP NPs with CT26 MCTs for 24 h, the MCTs were collected and observed by CLSM. We could see that the nanoparticles penetrated into the MCTs from the edge to interior and most of the nanoparticles concentrated on the 40–60 μm site away from the edges of MCTs, meaning that COP NPs could penetrate and accumulate in CT26 MCTs, and have a good penetration ability (Fig. 3). The average penetration depth of COP NPs in CT26 MCTs was about 135 μm, measured by ZEN software (Fig. S3, ESI†).
Fig. 3.

Representative Z-stack CLSM images of CT-26 MCTs incubated with Rb-labeled COP NPs for 24 h. The images were obtained every 20 μm from the maximum focal plane. Scale bar = 100 μm.
3.3. Release behavior and cytotoxicity of D-COP NPs in vitro
To obtain a drug-loaded COP nanoparticulate system, DOX was loaded into COP NPs through the electrostatic interaction between the amino group in DOX and carboxylic groups in COP NPs. The DLC could be regulated by changing the feed ratio of DOX and COP NPs. In this work, a drug-loaded content (DLC) of 27% was obtained and the corresponding DLE was 84.68%. A pH dependent release behavior of DOX from D-COP NPs in vitro was found and more DOX released as pH decreased (Fig. S4, ESI†). The cumulated release of DOX after 144 h in pH 5.0 reached 80%, which was two fold higher than that in pH 6.0 and three fold higher than that in pH 7.4. This might be ascribed to the weaker interaction between the amino and carboxylic groups and higher solubility of DOX when pH decreased.
The cytotoxicity of D-COP NPs in vitro was evaluated by MTT assay and free DOX and blank COP NPs were chosen as control groups. The blank COP NPs had no significant cytotoxicity against CT26 and H22 cells (Fig. 4A and B), suggesting the good cytocompatibility of these nanoparticles. The cytotoxicity of D-COP NPs was dose-dependent and lower than free DOX after being co-cultured for 24 h at the same concentration due to the slow release of DOX from D-COP NPs (Fig. 4C and D). After being co-cultured for 48 h, the cytotoxicity of D-COP NPs was higher than free DOX at the same concentration, further confirming the slow release of DOX from D-COP NPs (Fig. S5, ESI†). The half maximal inhibitory concentration (IC50) of D-COP NPs against CT26 and H22 was 16.9 μM and 13.9 μM after being co-cultured for 24 h, and 7.9 μM and 5.4 μM after being co-cultured for 48 h.
Fig. 4.
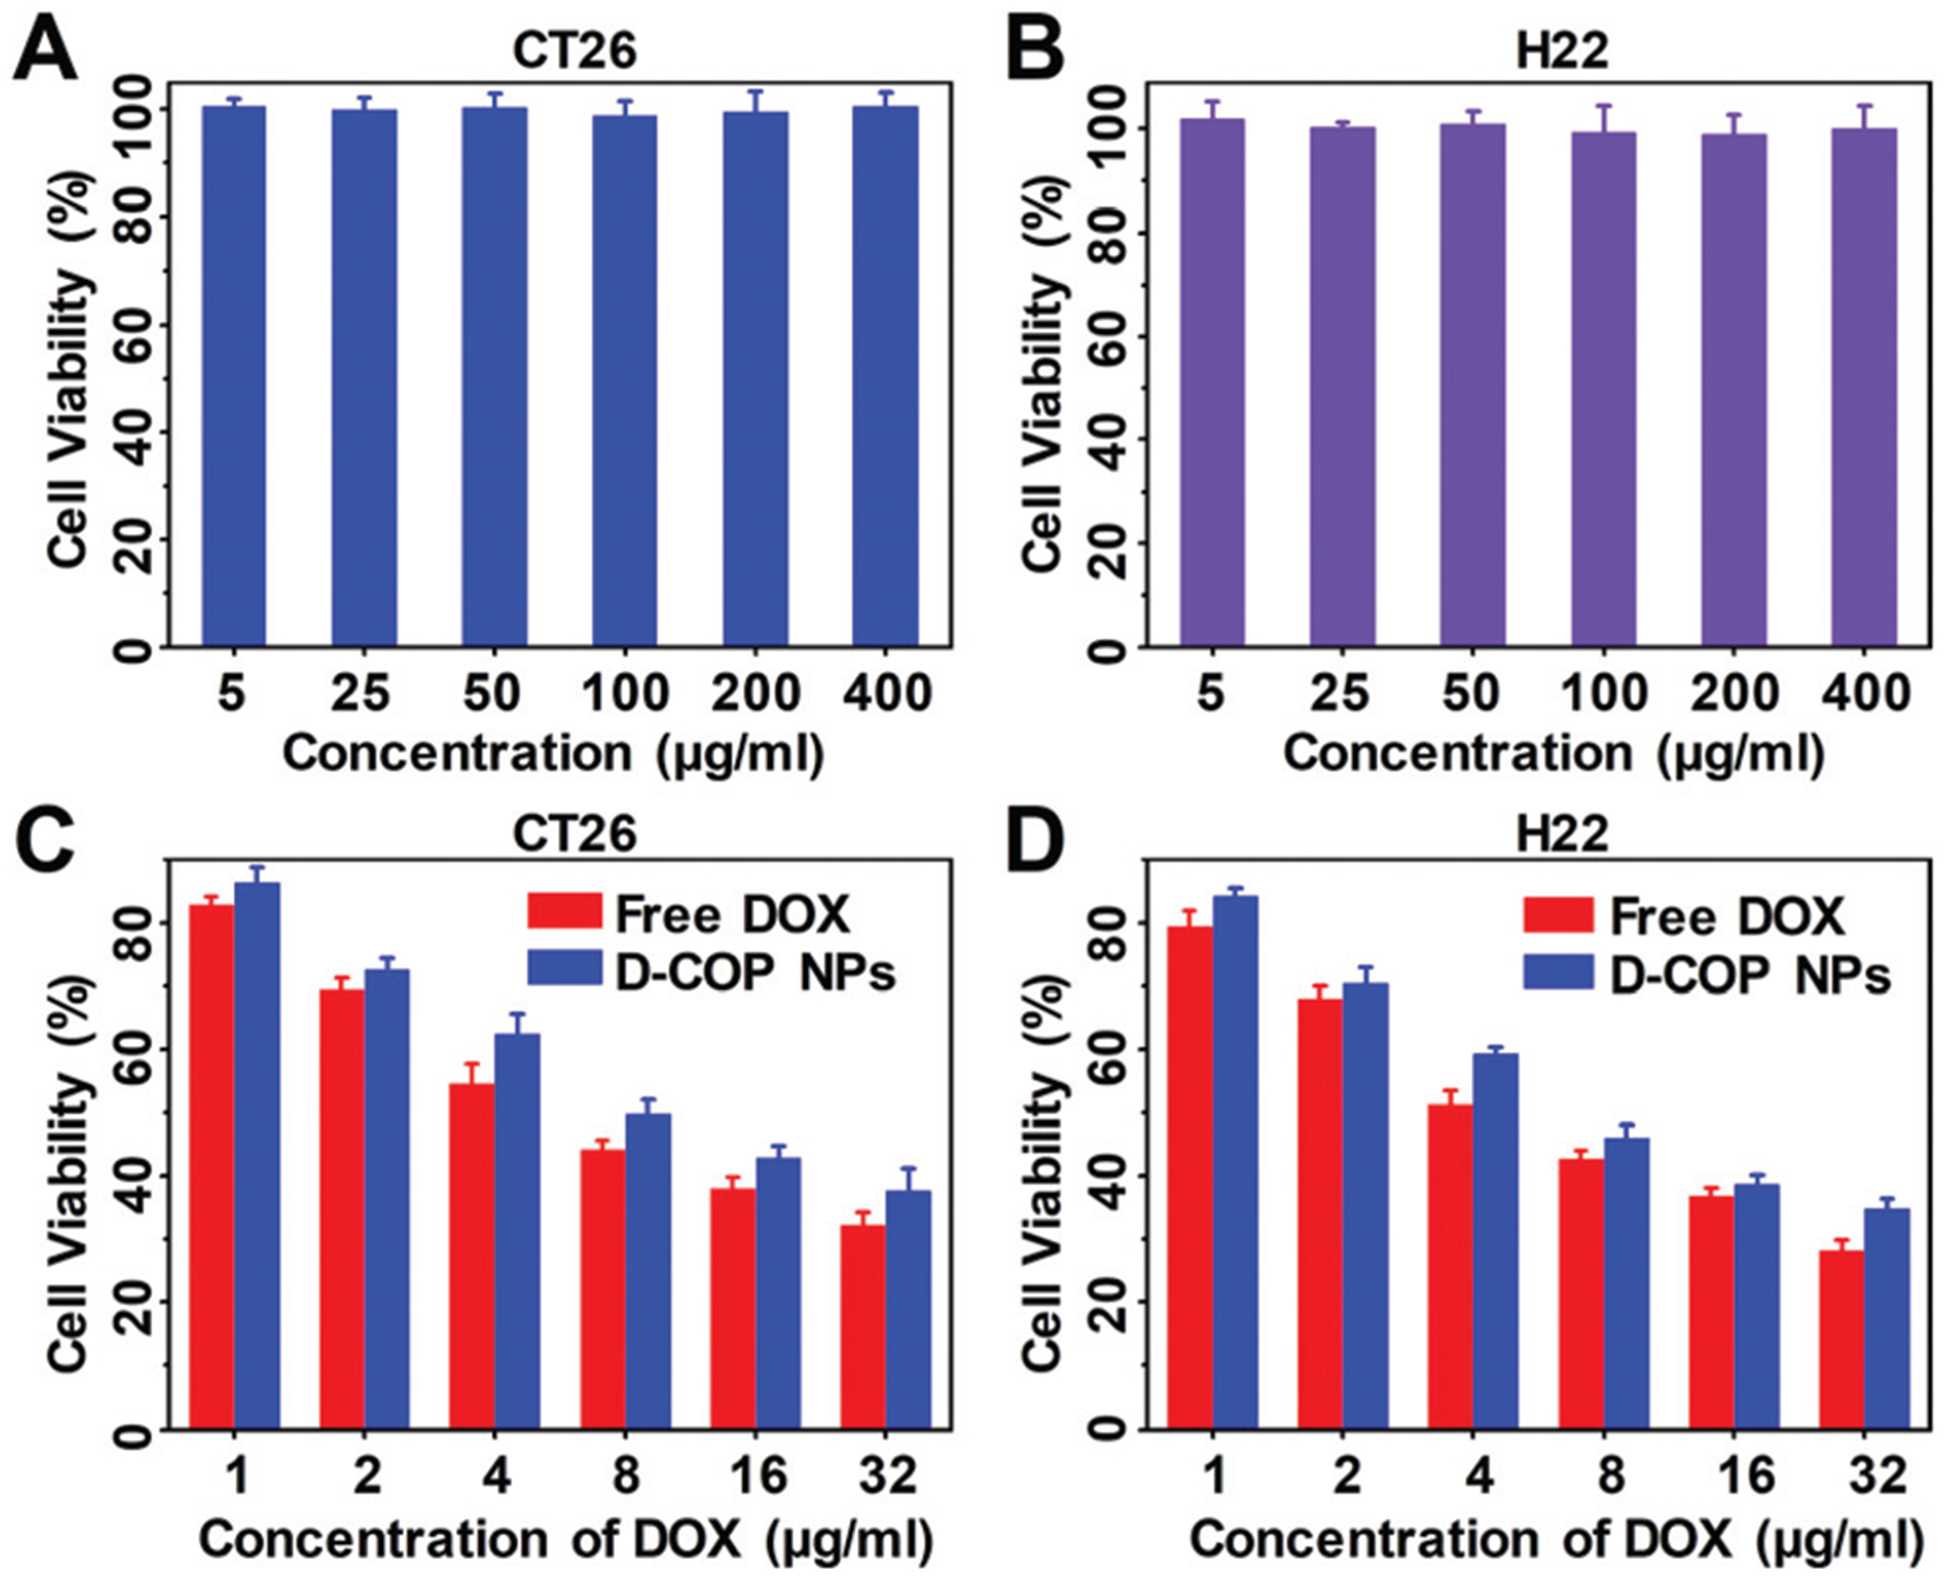
The cytotoxicity of COP NPs against (A) CT26 cells and (B) H22 cells after being co-cultured for 24 h. The cytotoxicity of free DOX and D-COP NPs against (C) CT26 cells and (D) H22 cells after being co-cultured for 24 h. Data are represented as mean ± SD (N = 3).
3.4. Measurement of tumor IFP and solid stress
The complex tumor microenvironment severely hinders the delivery of nanoparticles. By reducing the tumor IFP and solid stress, the transport efficiency of nanoparticles can be well improved. According to our previous work,16 we investigated three effects on tumor IFP, that is, the dose of COP NPs, action duration and number of injections. The COP NPs were intravenously injected into H22 tumor-bearing mice and then the tumor IFP was measured. After injection, a 35% reduction in tumor IFP was observed. With the increase of injection dose from 40 mg kg−1 to 200 mg kg−1, a significant reduction in the IFP of the H22 tumor was observed (Fig. 5A). Meanwhile, an increase in the dose of intravenous injection brought a prolonged action time, leading to the fact that lowered IFP can be maintained over a long time period. As shown in Fig. 5A, 120 mg kg−1 appeared to be an optimal dose that led to a remarked IFP reduction and a long action time. Also 24 h was chosen as the optimum duration time, and these two parameters were selected for the following experiments. There also was a significant difference in IFP recovery after changing the injection times. With an increase in the injection times, the recovery time of decreased tumor IFP was prolonged. There were significant differences in tumor IFP on the fourth day when comparing being injected once, twice and thrice (Fig. 5B). Apparently, three times of injection were optimal and selected in the following experiments. To evaluate the benefits after a drop in tumor IFP, the tumor perfusion was observed. A dye Hoechst 33342 was selected to visualize the change in tumor perfusion after tumor IFP reduction (Fig. 5C). Compared to that of tumor-bearing mice which had not received COP NPs, the tumor perfusion of the mice that received COP NPs had a significant increase and the mean fluorescence intensity was 1.5 fold stronger than control groups (Fig. 5D).
Fig. 5.
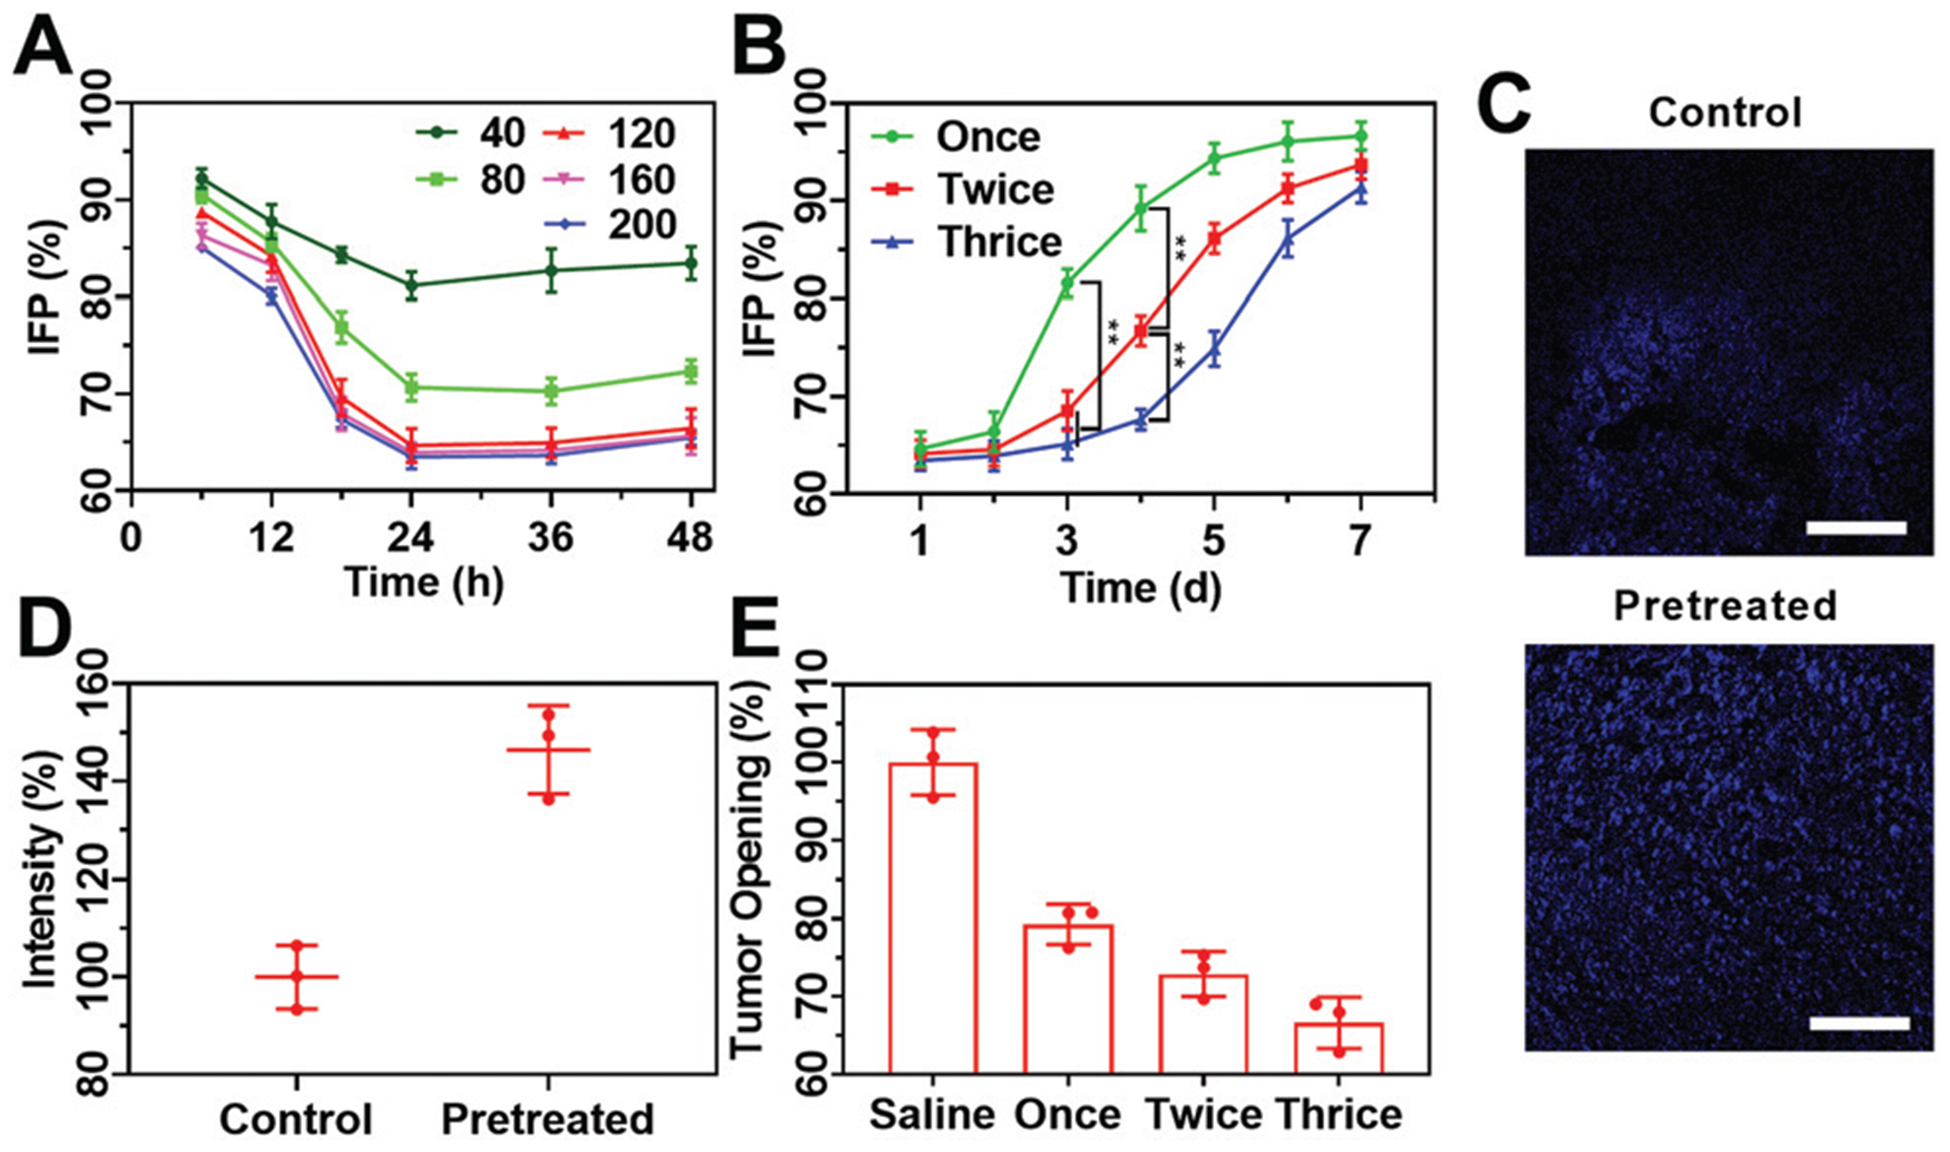
(A) Variation tendency of tumor IFP of H22 tumor-bearing mice with different injection doses (40, 80, 120, 160 and 200 mg kg−1) and interval times (6, 12, 18, 24, 36 and 48 h); (B) the tendency of tumor IFP during a week after receiving different treatments with a dose of 120 mg kg−1 and measured at 24 h after the last injection; (C) CLSM images of sectioned H22 tumor tissues stained with Hoechst 33342 with and without being pretreated with COP NPs thrice with an injection dose of 120 mg kg−1. Scale bar = 100 μm; (D) the average fluorescence intensity of Hoechst 33342 in three randomly selected equal areas from (C) quantified by ImageJ; (E) solid stress of CT26 tumors at 24 h after the injection of COP NPs at a dose of 120 mg kg−1. Data are represented as mean ± SD (N = 3).
The infinite proliferation of tumor cells also causes solid stress in the tumor interior which hampers drug delivery. To evaluate the influence of COP NPs on tumor solid stress, the mice bearing CT26 tumor were chosen as animal models. The CT26 tumor-bearing mice were intravenously injected with COP NPs at a dose of 120 mg kg−1 once, twice and thrice, respectively. It could be seen that the solid stress of CT26 tumors decreased after being treated with COP NPs (Fig. 5E). Among the three groups with different injection times, the solid stress of CT26 tumors was the lowest after three times of injection and it was only 66.6% of that of the mice without injection. Thus, COP NPs have intrinsic biological activities which can reduce both the IFP and solid stress of the tumor significantly.
Excessive formation of interstitial matrix molecules such as collagen and hyaluronan was one of the possible reasons for the increase in solid stress.34 To explore the mechanism by which COP NPs reduce tumor IFP and solid stress, collagen I, hyaluronan and TGF-β1 of H22 tumor sections were stained and observed by CLSM (Fig. S6, ESI†). The semi-quantitative fluorescence intensity showed no significant difference before and after being treated with COP NPs (Fig. S7, ESI†). In contrast, the compressed tumor vessels changed before and after treatment (Fig. 6A). The average diameter of the blood vessels for the treated group was 1.4 fold larger than that of the control group (Fig. 6B). Apparently, the compressed tumor vessels were decompressed after the injection of COP NPs. This might be the reason for reducing tumor IFP by COP NPs and explained the improvement of tumor perfusion after the injection of COP NPs.
Fig. 6.
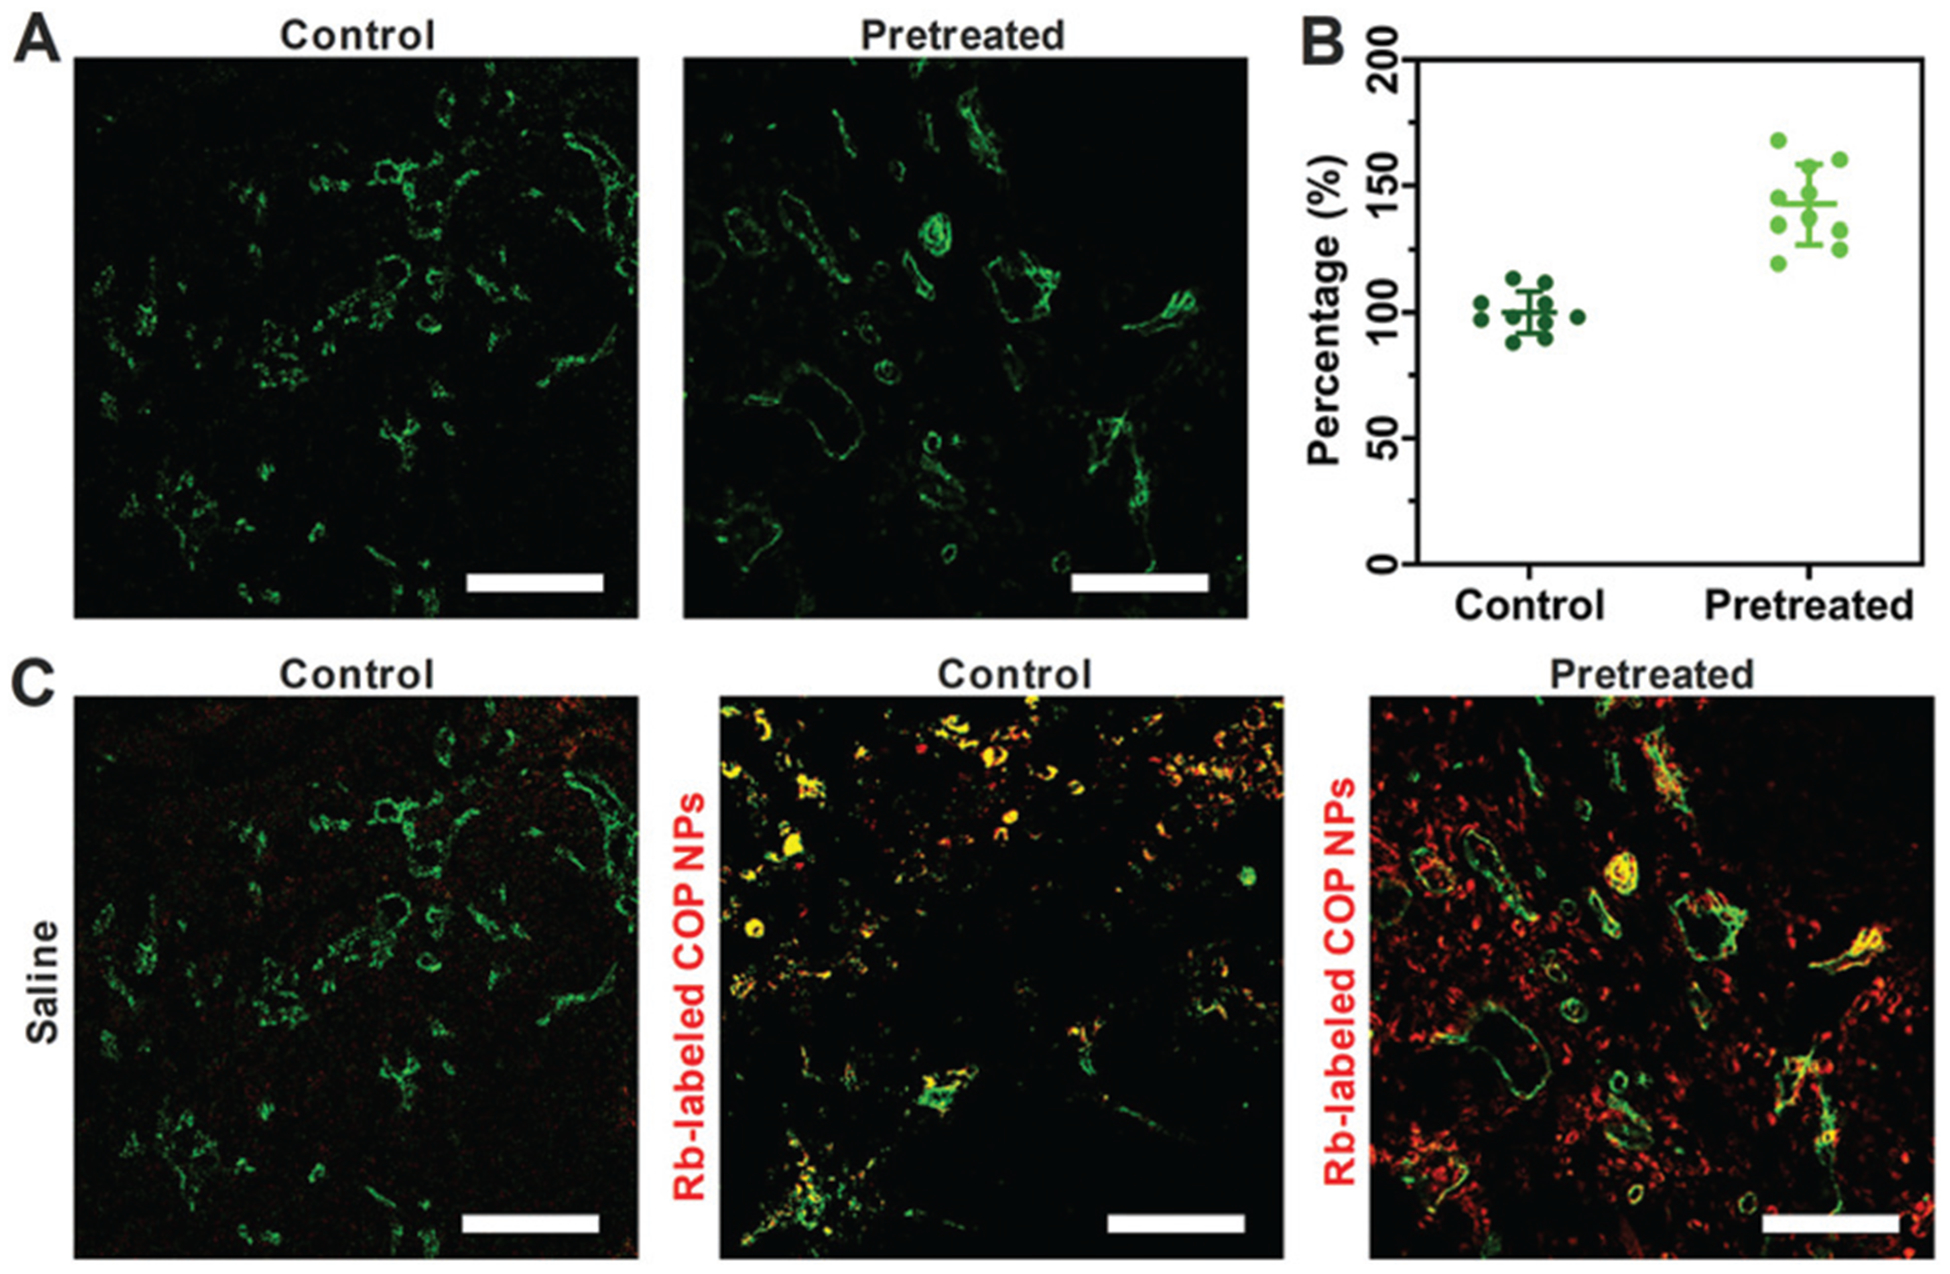
(A) CLSM images of tumor vessels (green) stained with CD31 with and without pretreatment with COP NPs thrice with an injection dose of 120 mg kg−1. Scale bar = 100 μm. (B) The average diameter of the tumor blood vessels from (A) measured by ImageJ. The control group was normalized as 100%. (C) CLSM images of tumor penetration of Rb-labeled COP NPs. Green means tumor blood vessels stained with CD31, red means the location of Rb-labeled COP NPs and yellow means the co-localization of blood vessels and nanoparticles. Scale bar = 100 μm.
3.5. Tumor penetration of COP NPs in vivo
To evaluate the effect of tumor IFP reduction on the accumulation and penetration of COP NPs at the tumor site, the mice bearing H22 tumor were intravenously injected with COP NPs thrice in advance, and then Rb-labeled nanoparticles were intravenously injected into the H22 tumor-bearing mice after 24 h. The mice were sacrificed 24 h later and the tumors were collected. Then the tumors were cut into slices, stained with CD31 and Alexa 488 and observed by CLSM finally. We could see that most of the Rb-labeled COP NPs were located in the vicinity of vessels with little diffusion for the groups with no COP NP pretreatment. On the other hand, for the group pretreated with 120 mg kg−1 COP NPs thrice, there were more Rb-labeled nanoparticles in the tumor site and they penetrated farther away from the tumor vessels than control groups (Fig. 6C). It is obvious that lower tumor IFP could help nanoparticles accumulate more and penetrate deeper in tumor tissues.
3.6. Biodistribution of D-COP NPs
To examine the delivery improvement after lowering tumor IFP, the biodistribution of free DOX and DOX-loaded COP NPs was performed. The H22 tumor-bearing mice were first divided into four groups. The second and fourth groups were treated once with COP NPs each day for three days. After 24 h, the first and second groups were intravenously injected with DOX (4 mg kg−1) and named free DOX and pre-DOX groups, respectively. The third and fourth groups were intravenously injected with D-COP NPs (4 mg kg−1 DOX, equally) and named D-COP NP and pre-D-COP NP groups, respectively. The amounts of DOX in blood and major organs were measured and calculated as the percentage of injection dose (% ID) per milliliter or per gram. As shown in Fig. 7A, the blood circula-tory half-life time (t1/2) of DOX was 0.91 h (free DOX group), 0.98 h (pre-DOX group), 13.44 h (D-COP NP group) and 12.16 h (pre-D-COP NP group). Apparently, free DOX has the same blood half-life time whether the injection of COP NPs was in advance or not. On the other hand, D-COP NPs greatly prolonged the blood circulation time of DOX and the t1/2 was about 15 fold longer than free DOX (Fig. 7A). Interestingly, pretreatment using COP NPs increased the DOX concentration in the tumor site. The drug concentration in the tumor site after lowering tumor IFP was higher than that in the untreated group under the same treatment method at each time point. The highest concentration of DOX in the tumor site was 5.4% ID g−1 for the D-COP NP group and 7.7% ID g−1 for the pre-D-COP NP group at 12 h post-injection (Fig. 7B). The tumor area under curve (AUC) based on the concentration over time was used to compare the amount of DOX accumulated in the tumor site. The tumor AUC of free DOX increased from 42.4% ID h g−1 to 85.4% ID h g−1 after being pretreated. For drug-loaded COP NPs, the tumor AUC of DOX increased from 176.0% ID h g−1 to 263.3% ID h g−1 for D-COP NPs after being pretreated (Fig. 7C). The tumor AUC of the pre-DOX group was 2 fold larger than that of the free DOX group and that of the pre-D-COP NP group was 1.5 fold larger than that of the D-COP NP group, indicating that reducing tumor IFP and solid stress can enhance DOX accumulation at the tumor site. The tumor AUC of the D-COP NP group was 4 fold larger than that of the free DOX group and that of the pre-D-COP NP group was 3 fold larger than that of the pre-DOX group, indicating that COP NPs are an effective drug nanocarrier system to improve drug delivery. Although COP NPs increased the accumulation of DOX in liver and spleen, they reduced the distribution of DOX in heart, lungs and kidneys compared to free DOX (Fig. 7D and Fig. S8, ESI†). Thus, the tumor accumulation of DOX is greatly improved by the improved tumor microenvironment through using COP NPs.
Fig. 7.
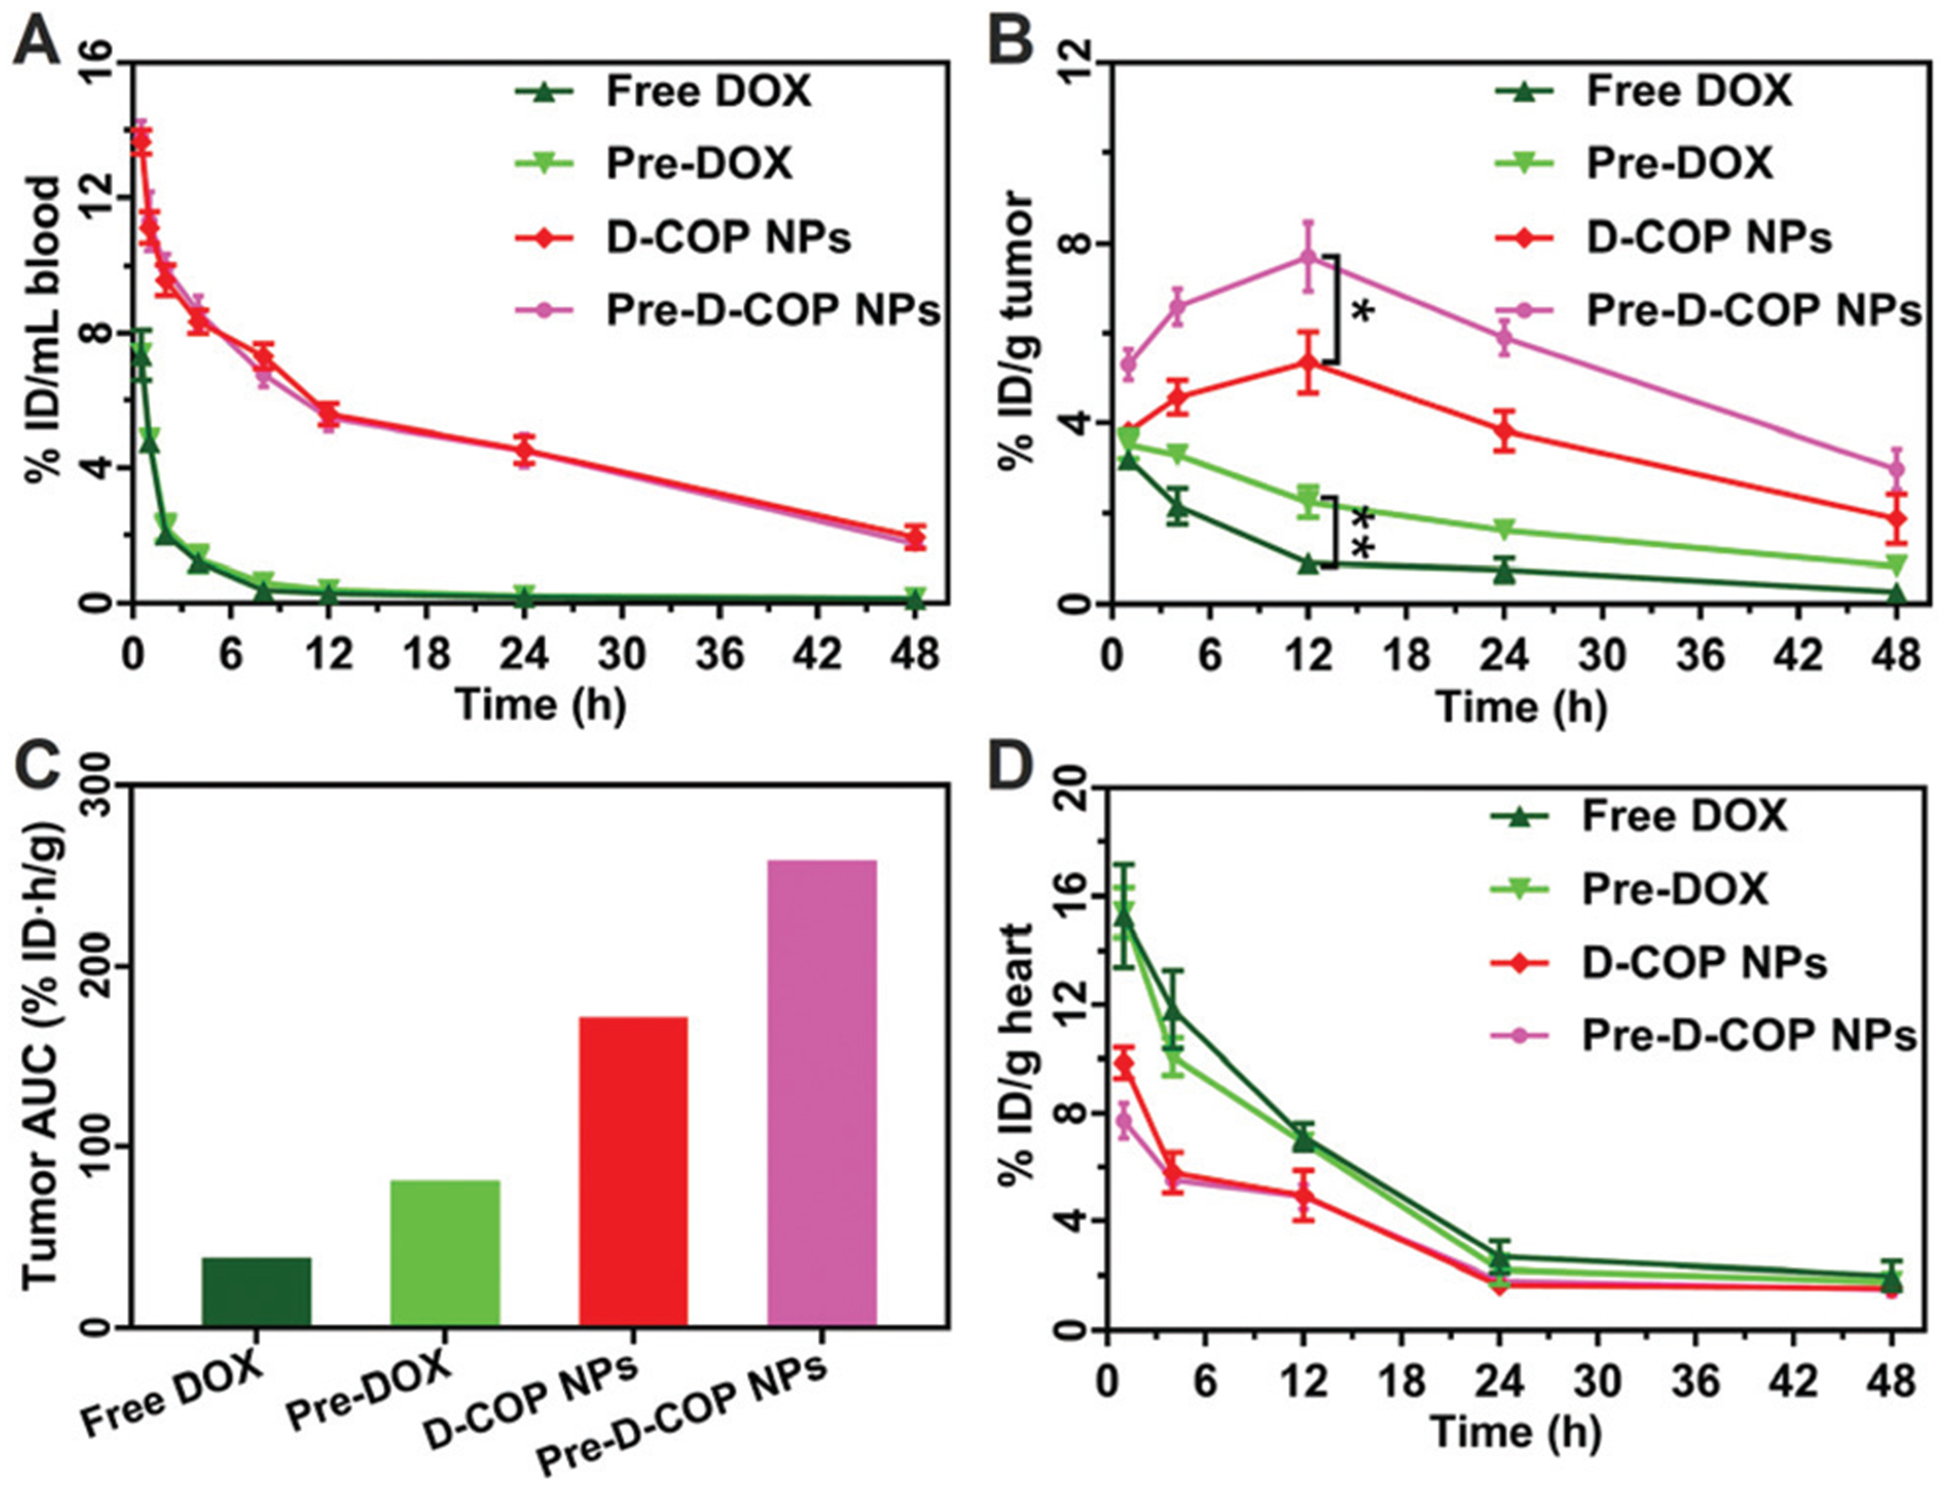
(A) Blood circulation of DOX in H22 tumor-bearing mice after i.v. injection of free DOX and D-COP NPs; (B) biodistribution of DOX in the tumor; (C) tumor AUC based on the concentration of DOX in the tumor area over time; (D) biodistribution of DOX in heart. Data are represented as mean ± SD (N = 3).
3.7. Antitumor efficiency of D-COP NPs
Next the H22 tumor bearing mice were used to evaluate the antitumor efficiency with or without the treatment of COP NPs. The mice were randomized into six groups, and the second, fourth and sixth groups were pretreated with COP NPs once each day for three days. Then, groups 1 (saline) and 2 (pre-saline) were injected with saline, groups 3 (free DOX) and 4 (pre-DOX) were injected with free DOX at a dose of 4 mg kg−1, and groups 5 (D-COP NPs) and 6 (pre-D-COP NPs) were injected with D-COP NPs (4 mg kg−1 DOX, equally). The tumor volume in both saline groups increased rapidly regardless of whether pretreated. Compared with the normal saline group, the free DOX group inhibited tumor growth a little, and the D-COP NP group had the best inhibitory effect on tumors (Fig. 8A). After being pretreated with COP NPs, the tumor volumes of both free DOX and D-COP NP groups had significant difference from the corresponding unpretreated groups on the fifteenth day (Fig. 8B), that is, the tumor volumes became smaller than that of the corresponding unpretreated group. The TGI of free DOX, pre-DOX, D-COP NPs and pre-D-COP NPs was 13.61%, 47.25%, 67.19% and 81.54% on the fifteenth day after the injection of DOX, respectively. The tumor volume of mice on the fifteenth day in the free DOX group was 1.7 fold larger than that in the pre-DOX group and the value of the D-COP NP group was 1.8 fold larger than that of the pre-D-COP NP group. The antitumor efficiency of free DOX and D-COP NPs is greatly enhanced by lowering tumor IFP and solid stress. Besides, the tumor volume of the free DOX group was 2.6 fold larger than that of the D-COP NP group, indicating that D-COP NPs have significant tumor inhibition ability. The median survival time of H22 tumor-bearing mice in six groups was 25, 29, 33, 39, 45 and 59 days for saline, pre-saline, free DOX, pre-DOX, D-COP NP and pre-D-COP NP groups, respectively (Fig. 8C). The survival trend is in good agreement with the changes in tumor volume and further proves the effect of lowering tumor IFP and solid stress on improving antitumor efficiency. It was also noted that the body weight of tumor-bearing mice slowly increased, except for a slight decrease in the first five days in the free DOX groups (Fig. 8D), indicating the biosafety of COP-NPs and D-COP NPs.
Fig. 8.
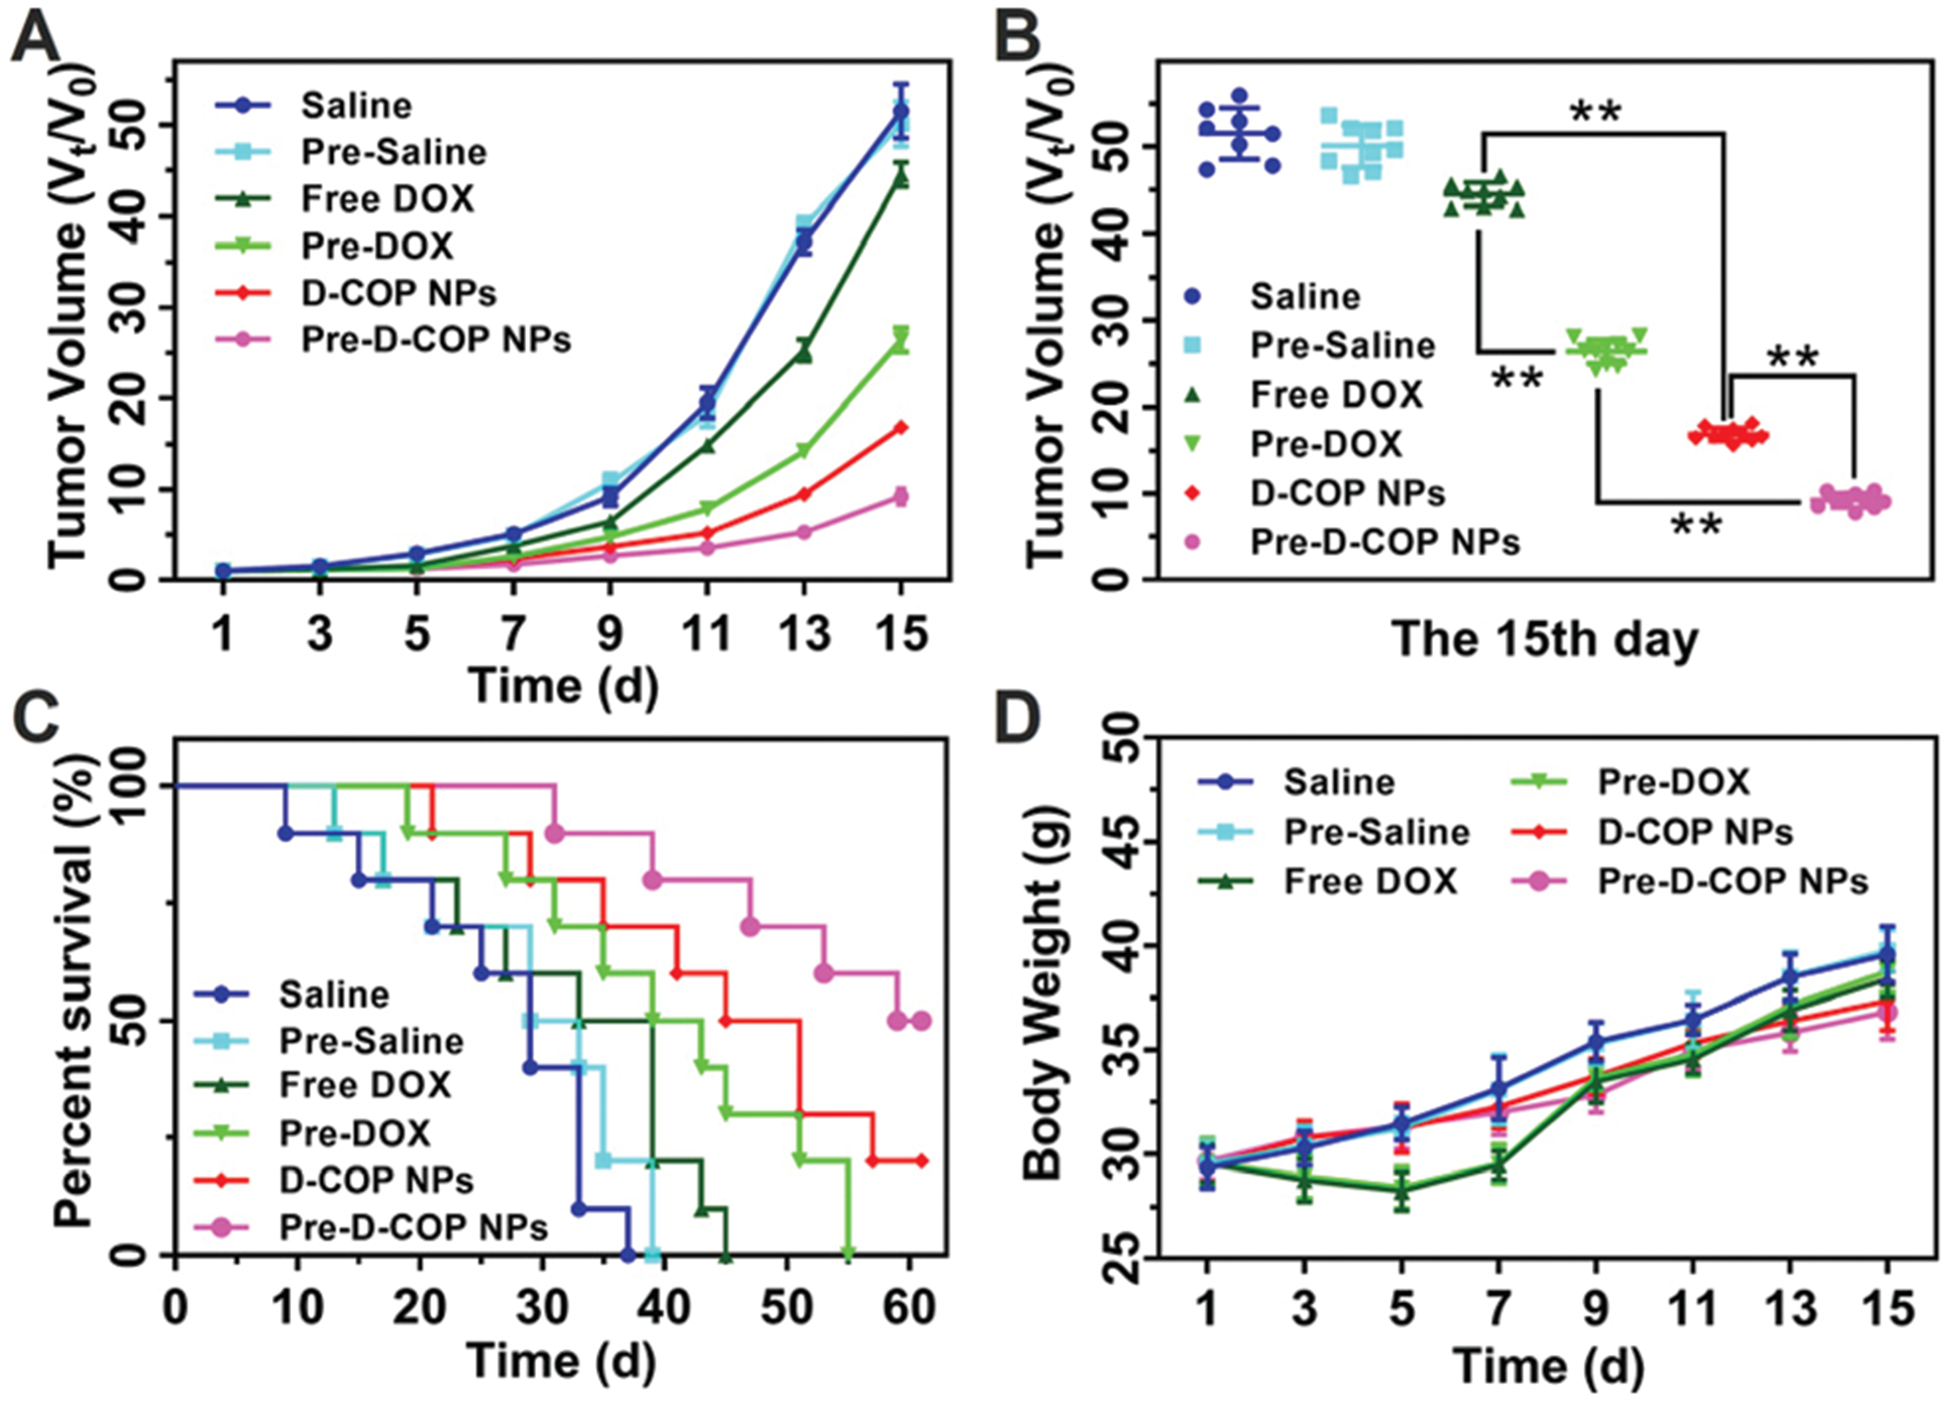
(A) Tumor volume of H22 tumor-bearing mice after receiving different treatments; (B) tumor volume of H22 tumor-bearing mice on the fifteenth day; (C) percent survival of H22 tumor-bearing mice after different treatments. (D) Body weight change of H22 tumor-bearing mice after receiving different treatments. Data are represented as mean ± SD (N = 10).
4. Conclusions
Single COP component NPs were successfully prepared by polymerizing the AA monomer in the presence of COP in complete aqueous medium, followed by removing PAA after cross-linking the COP of nanoparticles with TGase. These COP NPs had good dispersion and spherical morphology. It could improve the tumor microenvironment of tumor-bearing mice by lowering tumor IFP and solid stress. The mechanism was proposed to be the vasodilation of tumor blood vessels in the tumor. After being pretreated with COP NPs three times, there were more antitumor drugs accumulated in the tumor area and the antitumor efficiency of the H22 tumor-bearing mice was significantly improved. This provides a new strategy for chemotherapy by improving the tumor microenvironment before taking antitumor drugs.
Supplementary Material
Acknowledgements
This work was supported by the National Key R & D Program of China (No. 2017YFA0701301, 2017YFA0205400) and the National Natural Science Foundation of China (No. 51690153, 21720102005).
Footnotes
Electronic supplementary information (ESI) available. See DOI: 10.1039/d0bm00516a
Conflicts of interest
There are no conflicts to declare.
Notes and references
- 1.Ding D, Zhu ZS, Li RT, Li XL, Wu W, Jiang XQ and Liu BR, ACS Nano, 2011, 5, 2520–2534. [DOI] [PubMed] [Google Scholar]
- 2.Zhu ZS, Xie C, Liu Q, Zhen X, Zheng XC, Wu W, Li RT, Ding Y, Jiang XQ and Liu BR, Biomaterials, 2011, 32, 9525–9535. [DOI] [PubMed] [Google Scholar]
- 3.Wang X, Yang CC, Zhang YJ, Zhen X, Wu W and Jiang XQ, Biomaterials, 2014, 35, 6439–6453. [DOI] [PubMed] [Google Scholar]
- 4.Zhang ZK, Liu CR, Li C, Wu W and Jiang XQ, Research, 2019, 2019, 1–13. [Google Scholar]
- 5.Oh JY, Kim HS, Palanikumar L, Go EM, Jana B, Park SA, Kim HY, Kim K, Seo JK, Kwak SK, Kim C, Kang S and Ryu JH, Nat. Commun, 2018, 9, 4548–4556. [DOI] [PMC free article] [PubMed] [Google Scholar]
- 6.Zhang YJ, Zhang ZK, Chen WZ, Li C, Wu W and Jiang XQ, Acta. Polym. Sin, 2017, 2, 1–9. [Google Scholar]
- 7.Erhan A, Timothy JR, James MK, Brian MB, Peter CE, Mark K and James HA, ACS Nano, 2008, 2, 2075–2084.19206454 [Google Scholar]
- 8.Jain RK, Martin JD and Stylianopoulos T, Annu. Rev. Biomed. Eng, 2014, 16, 321–346. [DOI] [PMC free article] [PubMed] [Google Scholar]
- 9.Stylianopoulos T, Martin JD, Chauhan VP, Jain SR, Diop-Frimpong B, Bardeesy N, Smith BL, Ferrone CR, Hornicek FJ, Boucher Y, Munn LL and Jain RK, Proc. Natl. Acad. Sci. U. S. A, 2012, 109, 15101–15108. [DOI] [PMC free article] [PubMed] [Google Scholar]
- 10.Huo D, Jiang XQ and Hu Y, Adv. Mater, 2019, 1904337. [DOI] [PubMed] [Google Scholar]
- 11.Zhao YX, Cao JH, Melamed A, Worley M, Gockley A, Jones D, Nia HT, Zhang YL, Stylianopoulos T, Kumar AS, Mpekris F, Datta M, Sun Y, Wu LM, Gao X, Yeku O, Carmen MG, Spriggs DR, Jain RK and Xu L, Proc. Natl. Acad. Sci. U. S. A, 2019, 116, 2210–2219. [DOI] [PMC free article] [PubMed] [Google Scholar]
- 12.Stylianopoulos T and Jain RK, Proc. Natl. Acad. Sci. U. S. A, 2013, 110, 18632–18637. [DOI] [PMC free article] [PubMed] [Google Scholar]
- 13.Chen WZ, Zhen X, Wu W and Jiang XQ, Sci. China: Chem, 2020, 63, 648–664. [Google Scholar]
- 14.Zhang D, Wu W and Jiang XQ, Acta Polym. Sin, 2019, 50, 199–208. [Google Scholar]
- 15.Diop-Frimpong B, Chauhan VP, Krane S, Boucher Y and Jain RK, Proc. Natl. Acad. Sci. U. S. A, 2011, 108, 2909–2914. [DOI] [PMC free article] [PubMed] [Google Scholar]
- 16.Chauhan VP, Martin JD, Liu H, Lacorre DA, Jain SR, Kozin SV, Stylianopoulos T, Mousa AS, Han X, Adstamongkonkul P, Popovic Z, Huang P, Bawendi MG, Boucher Y and Jain RK, Nat. Commun, 2013, 4, 2516–2526. [DOI] [PMC free article] [PubMed] [Google Scholar]
- 17.Huang YH, Yuan JP, Righi E, Kamoun WS, Ancukiewicz M, Nezivar J, Santosuosso M, Martin JD, Martin MR, Vianello F, Leblanc P, Munn LL, Huang P, Duda DG, Fukumura D, Jain RK and Poznansky MC, Proc. Natl. Acad. Sci. U. S. A, 2012, 109, 17561–17566. [DOI] [PMC free article] [PubMed] [Google Scholar]
- 18.Gao X, Zhang J, Huang Z, Zuo TT, Lu Q, Wu GY and Shen Q, ACS Appl. Mater. Interfaces, 2017, 9, 29457–29468. [DOI] [PubMed] [Google Scholar]
- 19.Qian XP, Ge L, Yuan KJ, Li C, Zhen X, Cai WB, Cheng RS and Jiang XQ, Theranostics, 2019, 9, 7417–7430. [DOI] [PMC free article] [PubMed] [Google Scholar]
- 20.Li TT, Zhang H and Wu CE, Sci. Technol. Food Ind, 2014, 35, 100–104. [Google Scholar]
- 21.Li HZ, Deng ZY, Li J, Fan YW, Hu JN and Liu R, Zhongguo Shipin Xuebao, 2013, 13, 40–45. [Google Scholar]
- 22.Li TT, Zhang H, Wu CE and Fan GJ, Trans. Chin. Soc. Agric. Mach, 2012, 43, 148–155. [Google Scholar]
- 23.Li TT, Wu CE, Meng XY, Fan GJ, Cao YF, Ying RF and Tang Y, J. Funct. Foods, 2020, 64, 103594–103603. [Google Scholar]
- 24.Guo R, Zhang LY, Jiang ZP, Cao Y, Ding Y and Jiang XQ, Biomacromolecules, 2007, 8, 843–850. [DOI] [PubMed] [Google Scholar]
- 25.Ding D, Wang J, Chen Y, Wu W and Jiang XQ, Sci. China: Chem, 2011, 54, 392–396. [Google Scholar]
- 26.Wang J, Zhang ZH, Wang X, Wu W and Jiang XQ, J. Controlled Release, 2013, 168, 1–9. [DOI] [PubMed] [Google Scholar]
- 27.Liu CJ, Yao W, Zhang LZ, Qian HQ, Wu W and Jiang XQ, Chem. Commun, 2010, 46, 7566–7568. [DOI] [PubMed] [Google Scholar]
- 28.Wang X, Zhen X, Wang J, Zhang JL, Wu W and Jiang XQ, Biomaterials, 2013, 34, 4667–4679. [DOI] [PubMed] [Google Scholar]
- 29.Tetsuro K, Kazunarl S, Hideaki K and Yukthisa M, Cancer Res, 1994, 54, 5143–5147.7522956 [Google Scholar]
- 30.Thirugnanasambantham K, Prabu G, Palanisamy S, Chandrabose SRS and Mandal AKA, Appl. Biochem. Biotechnol, 2013, 169, 1405–1417. [DOI] [PubMed] [Google Scholar]
- 31.Teixeira LS, Feijen J, Blitterswijk CA, Dijkstra PJ and Karperien M, Biomaterials, 2012, 33, 1281–1290. [DOI] [PubMed] [Google Scholar]
- 32.Motoki M, Aso H, Seguro K and Nio N, Agric. Biol. Chem, 1987, 51, 993–996. [Google Scholar]
- 33.Smiddy MA, Martin JEGH, Kelly AL, de Kruif CG and Huppertz T, J. Dairy Sci, 2006, 89, 1906–1914. [DOI] [PubMed] [Google Scholar]
- 34.Chauhan VP, Stylianopoulos T, Boucher Y and Jain RK, Annu. Rev. Chem. Biomol. Eng, 2011, 2, 281–298. [DOI] [PubMed] [Google Scholar]
Associated Data
This section collects any data citations, data availability statements, or supplementary materials included in this article.


