

Abstract
Kinases are important targets for drug development. However, accounting for the impact of possible structural rearrangements on the binding of kinase inhibitors is complicated by the extensive flexibility of their catalytic domain. The dynamic N-lobe contains four particular mobile structural elements: the Asp-Phe-Gly (DFG) motif, the phosphate (P) positioning loop, the activation (A) loop, and the αC helix. In our previous study [Meng et al, JCTC. 14, 2721 (2018)], we combined various simulation techniques with Markov state modeling (MSM) to explore the free energy landscape of Abl kinase beyond conformations that are known from X-ray crystallography. Here we examine the resulting Markov model in greater detail by analyzing its metastable states. A characterization of the states in terms of their DFG state, P-loop and αC conformations is presented and compared to existing classification schemes. Several metastable states are found to be structurally close to known crystal structures of different kinases in complex with a variety of inhibitors. These results suggest that the set of conformations accessible to tyrosine kinases may be shared within the entire family, and that the conformational dynamics of one kinase in the absence of any ligand can provide meaningful information about possible target conformations for inhibitors of any member of the kinase family.
Graphical Abstract

1. Introduction
Tyrosine kinases are enzymes that catalyze the transfer of the γ-phosphate of an adenosine triphosphate (ATP) molecule to a tyrosine residue of a substrate protein. Tyrosine kinases are crucial regulators of cellular signaling and are linked with a broad range of diseases and in particular cancers. For example, the natural function of Abelson non-receptor tyrosine kinase (Abl) is in cell migration, adhesion, and differentiation, as well as in apoptosis.1 Abl shows constitutively high catalytic activity in patients with chronic myelogenous leukemia (CML), where it is present as the abnormal BCR-Abl fusion protein as a consequence of the translocation of genetic material between chromosome 9 and chromosome 22 (Philadelphia chromosome).2 The discovery of a specific Abl kinase inhibitor, the anti-cancer drug imatinib (Gleevec),3,4 demonstrated spectacularly that this class of signaling enzymes represented a rich set of therapeutic targets. The human genome encodes more than 500 protein kinases, making the kinome one of the largest gene families.5 For this reason, the discovery of kinase-specific inhibitors is intensely pursued by the pharmaceutical industry.
Thwarting these efforts, however, is the fact that kinases constitute a particularly dynamic and flexible class of proteins,6,7 as exemplified by the multiple conformational variants observed among the different kinase crystallographic structures in the protein data bank (PDB).7 The highly conserved catalytic domain of kinases comprises a relatively static C-terminal lobe and a relatively dynamic N-terminal lobe (Fig. 1). The N-lobe contains four structural elements that display different conformations: (a) the activation loop (A-loop), (b) the phosphate positioning loop (P-loop) or Glycine rich loop, (c) the αC-helix, and (d) the Asp-Phe-Gly (DFG) motif, that is located at the N-terminal end of the A-loop. These four structural elements form part of the adenosine triphosphate (ATP) binding pocket and the (hydrophobic) back pocket.8 The P-loop can adopt primarily a kinked or an extended conformation; additional variants are infrequently observed. The αC-helix can undergo a partial rotation orthogonal to its main axis resulting in the commonly named in or out states to allow the formation of a highly conserved Lys-Glu salt bridge that is critical for kinase catalytic activity. The conformation of the DFG motif can be mainly classified as the in state, where the Asp side chain points into the ATP binding site and the Phe side chain points toward the hydrophobic back pocket and the out state, where Asp and Phe side chains swap orientations. The A-loop is often unresolved, even in high resolution crystal structures, which is indicative of its high flexibility. Moreover there is experimental evidence that parts of the N-lobe can unfold and are refolded by the Hsp90 chaperone9 which points to even greater flexibility.
Figure 1:

Overview of the conformational variability of the catalytic domain (kinase domain) of Abl. In e) the active conformation of Abl (based on PDB structure 2F4J, residues 235–498) is shown. The flexible structural elements are shown in color: the P-loop (phosphate-positioning loop) is shown in blue, the αC in orange, the A-loop (activation loop) in green. The DFG motif is shown in “licorice” representation and colored in red (D), violet (F), white (G). The highlighted structural elements can adopt different conformations: b) The P-loop is mainly in the kinked (blue) or extended (cyan) conformation. c) αC conformations range between in (orange) and out (yellow) positions. d) The DFG motif is mainly in the D-in (or simply in, ball-and-stick representation) or the D-out (or simply out, “licorice” representation) state. a) The A-loop adopts many conformations that range between closed (emerald green) and extended (lime green).
In the case of Abl, there is additional experimental evidence for flexibility. NMR studies have shown that the N-lobe of the catalytic domain is highly flexible in the absence of ATP.10 Stopped-flow experiments of Abl kinase binding to the drug imatinib indicate that the binding proceeds through an induced-fit mechanism.11 Since an induced-fit mechanism in the binding direction corresponds to a conformational-selection mechanism in the unbinding direction,12 this indicates that even in the presence of a ligand like imatinib, conformational changes can take place. Additional evidence for Abl flexibility comes from the finding that Abl is a strong Hsp90 client.9 These findings suggest that Abl kinase is flexible both in its apo and holo forms, with greater flexibility in the apo and lesser flexibility in the holo form. Still, it remains unclear, what conformations Abl can adopt, what the propensities of the different metastable states are and what characterizes them conformationally.
These observations provide strong motivation to explore the conformational landscape of Abl using molecular dynamics (MD) simulations. A powerful framework to treat structural variability of these complex biomolecular systems is provided by Markov state models (MSM).13–16 The idea is to exploit the information from a large number of intermediate-length, explicit-solvent MD trajectories in order to construct a reduced stochastic model of the system. An MSM consists of a manageable number of conformational microstates and a matrix of transition probabilities (or, equivalently, transition rates) between them (i.e., a master equation), which can be used to fully describe the system at long timescales. At a fundamental level, MSMs build upon the general concept that the long-time dynamical motions of proteins may be approximately represented on the basis of transition rate models.17–19 The information content of MSMs is obtained by counting “state-to-state transitions” rather than simply by counting the spontaneous “occurrences of a state” as in traditional equilibrium sampling. For this reason, MSMs can be used as a tool to systematically analyze the information content from a large number of relatively short MD trajectories. Individually, each of these short MD simulations do not have to be representative of the equilibrium dynamics of the system; they may be started strategically such that the resulting simulations sample rare and relevant molecular events.20,21 Exploiting this feature of MSMs, we previously elaborated and tested a “MSM multi-source seeding strategy” for the discovery of the relevant conformational variants of a given tyrosine kinase.22 The idea is to generate a large number of moderately short trajectories by starting MD simulations from all available X-ray structures of the target kinase, as well as relevant homologs. Also included were unobserved combinations of conformational variants via a piecewise-mixing of of the main structural elements (A-loop, αC helix, P-loop, and DFG motif) taken from different X-ray structures.22 MSMs were constructed from a total of 800 μs of aggregate MD data to explore the free energy landscape of Abl beyond the conformations that are known from X-ray crystallography.
An important question that we attempted to address in this previous effort was whether a meaningful MSM for a given kinase target could be generated by relying exclusively on structural data of homolog kinases, in the absence of any crystallographic information about the kinase target itself. We could demonstrate that the MSM-derived conformational landscape generated exclusively from crystal structures of non-Abl kinase homologs was essentially equivalent to an MSM generated by relying on Abl crystal structures, thereby strengthening our confidence in the overall robustness of the approach. Furthermore, we identified one novel conformational state of Abl that was not present in the PDB, but existed in the internal Lilly database (Abl in complex with a purine-based ligand WHI-P154, PDB ID 6BL8), demonstrating that sampling of the apo kinase can successfully lead to the discovery of de novo alternative structures with a bound ligand.
While these previous results are very encouraging, the analysis was intentionally limited to simple projections onto pre-defined sets of order parameters that describe the conformations of the A-loop, αC helix, P-loop, and DFG motif. In particular, no attempts were made to determine kinetically metastable states from the MSM. The availability of this MSM based on a rich data set of MD trajectories offers us the opportunity to deepen our analysis of the computational methodology. Here, we analyze the MD data with kinetic clustering (or latent space modeling) methods from the world of Markov modeling. We apply the robust Perron-cluster cluster algorithm (PCCA+)23 to the MSM that was estimated in ref. 22 to find metastable states of apo-Abl kinase. We describe the macrostates structurally by plotting probability maps of order parameters characterizing the conformations of the four flexible structural elements and by comparing the macrostates to all Abl and non-Abl X-ray structures that are available in the PDB. The analysis helps to identify relevant order parameters and helps to provide a lexicon of key conformational variants to discuss apo and holo states of kinases. Some well known conformations, such as the canonical Abl-imatinib binding mode24 as well as an alternative Syk-like binding mode,25 are found within the set of metastable states extracted from the MSM (generated from MD simulations of Abl in the absence of any ligand). Extensive comparison of the metastable states with available crystal structures leads to the identification of multiple binding-competent (“druggable”) conformations. This analysis serves our long term goal to map out - in full atomistic detail - the conformational flexibility of Abl kinase, in terms of the equilibrium population and the kinetic transition rates between the meaningful conformational states.
2. Theory
In the following, we briefly review the steps that are necessary to construct MSMs and identify metastable states using the PCCA+ algorithm.
2.1. Construction of an MSM from MD simulations
MSM estimation from the aggregate MD data proceeds in three steps. First, the conformational space is discretized into a large number of Voronoi cells, also known as microstates . Clustering is often preceded by a dimension reduction method like PCA26,27 or TICA28–30. Second, transitions between microstates are counted at a lag time τ and tabulated into the count matrix C(τ). Each element contains the number of transitions from microstate si to microstate sj that were observed in the MD trajectories. More formally, the elements can be expressed as covariances between the indicator functions of the microstates
| (1) |
where
| (2) |
Third, the transition matrix T is computed from the count matrix. Each element Tij represents the conditional probability to find the system in microstate sj at time t + τ given that it was in microstate si at the earlier time t. Since MD simulations obey the principle of detailed balance31, one often seeks a reversible transition matrix that is compatible with detailed balance too, even if this balance is not completely reflected in the finite simulation data. Practically the transition matrix is found by maximizing the (log-)likelihood of the transition probabilities16,32
| (3) |
under constraints of normalization and detailed balance, that is πiTij = πjTij for all i, j where π is the stationary distribution. It has been shown, that for the proper selection of microstates the transition matrix fulfills the Markov property
| (4) |
which can be used to compute long-timescale properties from short-time estimates.16 If the sampling is ergodic, it becomes possible to extrapolate even to infinite lag time and to compute the stationary distribution of the transition matrix, which can be identified with a coarse-grained version of the Boltzmann distribution.
In a previous study of apo-Abl kinase22, we exploited the wealth of kinase crystal structures found in the PDB and developed the “piece-wise mixing of conformational variants” algorithm to create additional starting points for the MD simulations.
In the MSM built for Abl kinase, the microstates were defined using k-means clustering in the product space formed by order parameters for the P-loop, the αC helix, the A-loop, the DFG-motif, and the regulatory spine.22 A total of 10000 microstates were used to model the kinetics of apo-Abl kinase. To achieve some intuitive understanding, it is desirable to describe the kinetics of the system with a far smaller number of conformational states and/or order parameters.
2.2. Identification of metastable states
To identify the metastable states of Abl kinase, we rely on the kinetic clustering algorithm PCCA+. In contrast to other clustering methods that use the density of the data33,34 to infer the free-energy barriers separating the different metastable states, MSMs and PCCA+ use the kinetic information contained in the MD trajectories.
Kinetic clustering has a solid mathematical foundation in the theory of Markov operators and is in principle a parameter-free technique. The theory of the transfer operator13 provides a framework, where the concept of a cluster can be mathematically formalized and from which algorithms can be derived23, that can then be applied to MSMs of MD data.
Once an MSM has been built with a fine discretization of state space, it is possible to convert the transition matrix T with a large number of microstates into a smaller transition matrix T′. We denote this coarse-graining operation (or projection) by T′ = PTQ. A sensible criterion for the choice of the projection matrices P,Q is to conserve the long-timescale kinetics of the original transition matrix.23 That is, we require the predictions from the coarse-grained transition matrix to be the same as the coarse-grained predictions of the original, full transition matrix for all multiples of the lag time
| (5) |
In ref. 23 it was shown that such a transformation can be constructed as follows
| (6) |
| (7) |
where Π is a diagonal matrix with the stationary distribution π along its diagonal, and its transposed are rectangular matri ces that map from the finely-discretized space of N states to the reduced space of n states. M is applied to vectors of microstate indicator functions . If the initial discretization of the conformational space was fine enough, such a coordinate transform can express quite complicated functions despite its linearity. Direct lumping of microstates can be expressed by a matrix M, that takes a value of one for the microstates to be lumped and a value of zero for all other microstates.23 In later works, Eqs. 6, 7 were generalized to non-reversible settings such that knowledge of π is no longer required for kinetic coarse-graining.
It was shown in ref. 23 that a matrix M, that fulfills identity (5), can be constructed from the dominant right eigenvectors of the transition matrix for reversible kinetics. That is, the columns mi are linear combinations of the n leading right eigenvectors of the full transition matrix T. If the empirical transition matrix is not reversible, the generalized singular vectors35 or the Schur vectors36 of T provide a valid basis for constructing M. Non-reversible transition matrices can appear either because the underlying dynamics that govern the protein motions are intrinsically non-reversible such as when time-varying external fields are applied during an MD simulation or because the MD simulation was not sufficient to sample transitions between states in both directions.35
Various criteria have been proposed for selecting the number of metastable states (see ref. 37 for a review) but none of them has seen wide adoption by the Markov modeling community, except for truncating the eigenspectrum at the spectral gap of the complete MSM, if any such gap can be detected. The issue is exacerbated by estimation errors of the implied timescales, which may obscure or falsely hint at the presence of a gap.16,38 However, because a set of n membership vectors is equivalent to the set of the n leading eigenvectors, any number of metastable states is, in principle, a valid choice and Eq. 5 will hold in the subspace of the n leading eigenvectors. Nevertheless the ability of the coarse-grained MSM to predict the kinetics of observables will be limited to those observables that can be expressed as linear combinations of the leading eigenvectors.39 In the absence of a large spectral gap, one may approach the problem from the side of the observables and chose the number of states such that relevant observables are resolved by the metastable states. In the choice of n for the MSM of Abl kinase, we make sure that important observables like the main DFG-states and P-loop states remain distinguishable after coarse-graining.
In the following, we will refer to the mestastable states identified by the PCCA+ kinetic clustering as macrostates, or equivalently as metastable states.
2.3. Interpretation of metastable states
The matrix M can be understood as a probabilistic map from the full state space to a reduced state space. Each element Mij is a number between 0 and 1 and indicates the degree of membership of microstate i in metastable state j. These fuzzy macrostates can be converted into crisply defined macrostates by assigning microstates exclusively to that macrostate to which they have the highest membership, essentially converting the mapping enforced by M to a simple lumping procedure with matrix elements Mij equal to either 0 or 1. This conversion, however, introduces an additional systematic error because the resulting crisp coarse-grained transition matrix in general breaks condition (5). It can be justified, if the free-energy barriers that separate the states are very high, in which case most elements of M are close to 0 or 1.16 Metastable states can be visualized by drawing molecular conformations from the crisp macrostates, from the high-membership regions of the macrostates, or by drawing conformations with a probability that includes the membership as a factor.40
Much like the modes from principal component analysis (PCA)26,27, the eigenvectors of the transition matrix, from which M is constructed, are identified automatically and are global functions of the protein conformation. This means that they can in principle involve the coordinates of all atoms of the protein. In contrast to PCA modes however, MSM eigenvectors are directly related to the metastable states of the system. For the kinase, this means that the dynamic modes do not necessarily have to coincide with the motion of a single structural element. The same applies for the metastable states. They are not necessarily characterized by the conformation of a single structural element. That’s why the automatic coarse-graining has to be supplemented with interpretation in terms of structural features.
3. Results and Discussion
Using PCCA+, we coarse-grained the original 10000 microstates from the previously published MSM22 into 30 metastable macrostates. When ordered by magnitude, the relaxation timescales of the full MSM decay quickly with rank. The 30’th timescale is in the single microsecond range, suggesting that a projection to the space of the leading 30 relaxation modes with PCCA+ is reasonable. The practical impact of the chosen number of metastable states on the conclusions is further discussed below by comparing with available kinase crystal structures. (See also suppl. Fig. 8 and see Suppl. Note 3 for more details about selecting the number of PCCA states.)
To characterize the macrostates, 1000 representative conformations (MD snapshots) were drawn from every macrostate. Prior to examining the molecular details of the macrostates of Abl kinase revealed by the present analysis, it is useful to gain some understanding of the kinetics and thermodynamics within the coarse-grained conformational subspace. The stationary distribution and the life times of the metastable states extracted from the MSM transition matrix are shown in Fig. 2. The results in Fig. 2 show that life times range between several hundreds of nanoseconds (state 11) to 100 microseconds (state 24). The life time of 1.5 ms of macrostate 29 exceeds all other life times by an order of magnitude. Free energy differences between macrostates do not exceed 6.7 kcal/mol. Macrostate 29 is a misfolded state and likely exit events have not been observed in the MD simulation, creating the false impression of an outstandingly large life time and low free energy. Despite the considerable care in constructing the MSM from nearly 800 μs aggregate MD data, it must be stressed that the results from PCCA+ are probably of limited accuracy. The main reason is that a number of MSM artifacts can lead to overestimated life times due to errors in the identification of irreversible transition events.38 Due to the simultaneous presence of recrossing events, identifying irreversible transitions in an automated way is nearly impossible with the currently used MSM estimation procedure. Disentangling both types of error (recrossing and lack of real transitions) is generally more complicated in a high-dimensional setting and currently would require human inspection of all 10000 microstates. The implication is that, despite the extensive amount of aggregate MD data used to construct the MSM, there remains significant statistical uncertainty about the resulting timescales and population of the macrostates resulting from the PCCA+ analysis. For this reason, the most valuable information that can be extracted from the present analysis pertains to the conformations of the different macrostates. In the following, these ensembles of conformations are analyzed by projecting them onto simple observables like distances between residues and by comparing them to available crystal structures from the protein data bank, including both Abl and non-Abl kinases.
Figure 2:

Properties of the macrostates. a) Life times ti of the metastable states computed from the transition matrix of the crisply coarse-grained transition matrix T′ using where τ is the lag time. b) Free energies ΔGi of the metastable states computed from the crisply coarse-grained stationary distribution π′ of the MSM using where T = 300 K and R is the ideal gas constant. Error bars mark the 90% credible intervals and were computed with the reversible Bayesian transition matrix sampler41. Disks mark the maximum likelihood estimates.
3.1. Non-crystallographic folds of the N-lobe
Visual inspection of the structural ensembles reveals a number of non-crystallographic folds of the N-lobe in macrostates 5, 6, 10, 14, 17, and 29. Those are displayed in Fig. 3. Macrostates 6, 10, 14, and 17 are missing one or both of the beta strands I or II, leading to a more flexible P-loop. Similar partly unfolded states of the N-lobe were also observed in previous simulations of Hck tyrosine kinase based on a simple coarse-grained model.42 Partial unfolding of the N-lobe of kinases may potentially play a biological role. Abl is known to be a strong client of the Hsp90 chaperone.9 Hsp90 binds to hydrophobic patches that are exposed during unfolding of the N-lobe.43,44 Partial unfolding is important for the regulation of Abl functions too, as the partially unfolded N-lobe could possibly serve as an initiation region for degradation by the proteasome.45 Lastly, H/D-exchange experiments are suggestive of the higher flexibility of the N-lobe of Abl kinase.46 These observations notwithstanding, one cannot exclude the possibility that the partially unfolded states observed in the present simulations are computational artifacts caused by the limitations of the force fields or the lack of equilibration of the initial conformations created via homology modeling and piece-wise mixing of conformational variants.22 In the following analysis of the conformational states of the structural elements, macrostates 5, 6, 10, 14, 17, and 29 were excluded from the analysis.
Figure 3:

Metastable states displaying non-crystallographic folds of the N-lobe. Shown are the medoids of the metastable states (the most central conformation in a set of 1000 randomly drawn conformations). The flexible structural elements are shown in color: P-loop in blue, A-loop in green, αC in orange. The DFG motif (red-magenta-white) and the side chains of Glu-286 and Lys-271 (cyan) are shown as sticks. See suppl. Figs. 2 and 3 for ensemble visualizations of the metastable states.
3.2. Conformational states of the DFG motif
In our previous MSM study,22 we characterized the conformation of the DFG (D381-F382-G383) motif using a two-dimensional (2-D) free energy landscape in terms of the distance d3 between Cγ-D381 (the D of DFG) and Cα-N368 and the distance d4 between Cγ-F382 (the F of DFG) and Cα-I293 (see Fig. 4f and Fig. 6b of ref. 22). Projection of the conformational ensembles on the (d3, d4) plane are shown in Fig. 4a–c. First and foremost the plots show that the DFG-in and DFG-out states are metastable as one would expect from DFG conformations in X-ray structures and from previous MD studies.22,47 On the basis of this fairly naive attribution, we can group the metastable states of the DFG motif into 3 larger categories: DFG-in, DFG-out, and non-classical DFG48,49 conformations. Non-classical DFG conformations are seen in macrostates 11, 25, and 26. In macrostate 25, both D and F of the DFG motif point into the ATP binding pocket. In macrostate 26, both D and F are in intermediate positions with their side chains pointing towards the N-lobe. (See Fig. 4d–f.) Because the states of the DFG motif are crisply defined, we continue to use them in the following analysis.
Figure 4:

Analysis of the metastable states with respect to the conformation of the DFG (D381-F382-G383) motif. a-c) Two-dimensional histograms using two distances in the DFG motif (see panel f, Suppl. Note 2 or ref. 22), contours mark the outline of the level set which includes 90% of the total probability. The numbers refer to the 24 macrostates retained for analysis. d) to f) are examples for states that are neither DFG-in nor DFG-out. Panel e) shows the medoid of macrostate 25 where both the D and F of the DFG motif point into the ATP binding pocket. Panel f) shows the medoid of macrostate 26 where D and F point towards the N-lobe. In f) the distances d3 and d4 are shown as thin cylinders.
Figure 6:

Analysis of the mestastable states with respect to the αC helix and A-loop using the same order parameters as in ref. 22. The motion of the A-loop is described with the distance d7 between O-Gly383 and N-Arg386. The formation of the salt bridge is described with the difference of distances d5 − d6 that measures the relative proximity of Cδ-E286 to Nζ-K271 or Cζ-R386 (see also Fig. 9 and suppl. table 1). The ★ symbol marks order parameters of the crystal structure 2SRC of inactive Src kinase. ◆/◇ marks the order parameters of crystal structure 3LCK of activated Lck kinase.
This conformational analysis of the DFG motif based on the pair of distances d3, d4 may be compared with the sophisticated classification scheme of Modi and Dunbrack,49 which distinguishes three broad clusters for the DFG motif: DFG-in, DFG-out, and DFG-inter. For the vast majority of conformations, our naive attribution of DFG states agrees with this nomenclature, with some disagreement for non-classical DFG states, perhaps due to the occurrence of intermediate conformations in MD trajectories that are not observed in X-ray structures. The DFG-inter class only appears as a metastable state in state 26. Otherwise, DFG-inter is not metastable per se but occurs as a mixture of DFG-inter and DFG-out, like in macrostates 2, 9, and 24 (see suppl. Table 2). This agrees with our more naive analysis of the DFG motif. Except for macrostates 25 and 26, non-classical DFG conformations are not observed as clearly delineated regions in Fig. 4, but blend with the other regions. In agreement with ref. 49, we observe that a subcluster of DFG-in matches the catalytically active state, since metastable states 5, 10, and 16 are classified as active by most published activity classification schemes (see suppl. Tables 8, 2). Metastable states 19, 20, 23, 27, and 28 populate another subcluster of DFG-in that corresponds to the Src-like inactive state according to the authors. As the more detailed analysis in section 3.4 confirms, these states can be classified as inactive based on Lys271-Glu286 salt bridge formation and A-loop conformation.
3.3. Conformational states of the P-loop
The phosphate positioning P-loop (or G-rich loop) forms a hydrophobic cage that contains either the adenosine moiety of ATP or the ATP-analog moiety of inhibitors when they bind in the catalytic pocket. From the analysis of crystal structures it is known that in Abl kinase (and a few other kinases such as c-Met, and Aurora A), the P-loop can adopt two distinct stable conformations: (i) the extended conformation and (ii) the kinked conformation50, whereas other kinases crystallize with an extended or unresolved P-loop. The stable kinked P-loop conformation in Abl has been hypothesized to explain the greater affinity of the inhibitor imatinib for Abl kinase compared to c-Src kinase.11,24
In our previous MSM study,22 we characterized the conformation of the P-loop using a 2-D free energy landscape in terms of the distance d1 between Cα-L248 and Cα-Y253, and the distance d2 between Cα-G249 and Cα-Q252 (see Fig. 5g and Fig. 6a of ref. 22). On the basis of the 2-D free energy landscape, we previously identified four well-separated free energy minima.22 Minima (i) and (ii) correspond to the canonical extended and kinked conformations. In addition, we previously found two additional minima (iii) and (iv). Minimum (iii) is located at d1 ≈ 5 Å, d2 ≈ 8 Å in the (d1, d2) plane, while minimum (iv) is located at d1 ≈ 10 Å, d2 ≈ 9 Å (see Fig. 5a or ref. 22).
Figure 5:

Analysis of the metastable states with respect to the conformation of the P-loop. a-f) Two-dimensional histograms using two distances in the P-loop (see panels g, h, i, Suppl. Note 2 or ref. 22 for the defintions of the distances), contours mark the outline of the level set which includes 90% of the total probability. The numbers refer to the 24 macrostates retained for analysis. The otherwise excluded macrostate 29 is shown with a dashed contour to mark the location of free-energy minimum (iii). Metastable states are grouped by DFG state (in, out, and non-classical). Conformations in the top right corner correspond to the extended P-loop. Conformations in the bottom left correspond to the kinked P-loop. Black markers indicate the position of c-Abl crystal structures on this two-dimensional landscape. Symbols mark the location of crystal structures with PDB IDs: ★ = 2F4J, • = 2G1T, ■ = 2GQG, ♠ = 1OPK, ▼ = 1IEP (the Abl-gleevec/DFG-out complex from ref. 24). Panels (g) to (i) show representative conformations from the extended, kinked and coiled state respectively. The distances d1 and d2 are shown as thin cylinders.
We now project the metastable states onto the same (d1, d2) plane (Fig. 5). We recover the four previously identified minima, but in addition can now assign metastable states to the minima. The results are summarized in Table 1. Some metastable states like 11, 12, 16, 26, and 27 span multiple minima and populate (iv) together with either the extended (i) or the kinked (ii) conformation. Macrostates 2 and 28 populate minimum (iv) exclusively. Structurally, minimum (iv) is characterized by beta-strands I and II that are relatively short compared to the extended P-loop conformation. The remaining residues adopt a coil conformation. (See Fig. 5i and macrostates 2 and 28 in suppl. Figs. 2 and 3.) Minimum (iii) appears to match metastable state 29, that shows a non-crystallographic fold of the N-lobe with the P-loop folded into one α-helical turn (see macrostate 29 in suppl. Fig. 3). Notably the extended state, the kinked state, and minimum (iv) are metastable both in the DFG-in and the DFG-out states of Abl.
Table 1:
Metastable states grouped by free-energy minimum of the P-loop (see Fig. 5a for locations of the minima).
| P-loop conformation | metastable states |
|---|---|
| (i) Extended | 4,7,8,9,13, 15,18–23,25 |
| (ii) Kinked | 0,1,3,24 |
| (iii) Alternative fold / helix | 29 |
| (iv) Coil | 2,28 |
3.4. Lys271-Glu286 salt bridge and A-loop motion
In the inactive kinase, Glu286 along the αC helix points away from the binding pocket and interacts with Arg386 in the A-loop (see Fig. 9a). In the active state, the αC helix is rotated inward, allowing the formation of a salt bridge between Glu286 and Lys271 in the β-III sheet lining the ATP binding pocket (see Fig. 9c, Glu310-Lys295 in Src). This salt bridge between two highly conserved residues is believed to be critical for a catalytically competent kinase active site.51,52 Additional conformational changes upon activation include a rearrangement of the A-loop from a closed to an extended (open) conformation.53
Figure 9:

Medoids of metastable states 23, 19, and 0 which are on the Src-like activation pathway. Distances d5, d6, and d7 are shown as thin yellow, orange, and cyan cylinders respectively. States 23 and 19 are inactive due to their broken K271-E286 salt bridge. State 0 is closest to the catalytically active state. Distance d5 that was used in previous publications22,56 to quantify activation is uninformative in the current data set because of the large flexibility of R386. A small value of d7 can indicate the formation of a helix in the A-loop (a) but is no sufficient condition for a closed A-loop.
The sequence of events associated with kinase activation was extensively studied with MD simulations.53–57 Those studies indicated that the activation pathway comprises at least one metastable intermediate corresponding to a partial opening of the A-loop. After passing through this intermediate, the activation is completed by full A-loop opening followed by formation of the salt bridge. In several of these studies, the formation of the Lys-Glu salt bridge was previously monitored through the difference of two distances:22,55,56 Cδ-E286 to Nζ-K271, referred to as d5, and Cδ-E286 to Cζ-R386, referred to as d6 (see Fig. 9a or Fig. 6c and d of ref. 22). This choice was based on the assumption that Glu286 would approximately stay on the segment of a line that is limited by Lys271 and Arg386. The present simulation data set, however, is extensive, and the activation loop explores a wide range of conformations such that Arg386 can no longer act as a reference. For reference, Fig. 6 shows the metastable states using d5 − d6. The gray thick arrow in Fig. 6 indicates the overall direction of a broad Src-like activation pathway,53–57 which starts with the opening of the closed A-loop, followed by the inward rotation of the αC helix leading to the formation of the highly conserved Lys-Glu salt bridge critical for kinase catalytic activity.
Furthermore, the conformational state of the A-loop was characterized via the distance between O-Gly383 and N-Arg386 (d7).22 A small value of d7 (around 3.3 Å) can be indicative of the formation of a short helix at the N-terminal end of the A-loop that is characteristic for some closed-A-loop states (see Fig. 9a). Nonetheless, formation of a helical segment near the N-terminal in the A-loop is not identical with A-loop closing. To gain a clearer understanding of the relation between the two processes, we plot in Fig. 7 the ensemble means of d7 and of , the center of mass position of the A-loop (in a coordinate frame aligned with the protein). The plot shows that there is substantial correlation between the two variables. Nonetheless, the DFG-out macrostates 1, 2, 3, 12, 21 and the DFG-in macrostates 23, 28 fall far from the line of best fit. This suggests that the correlation of the two processes is restricted to some macrostates.
Figure 7:
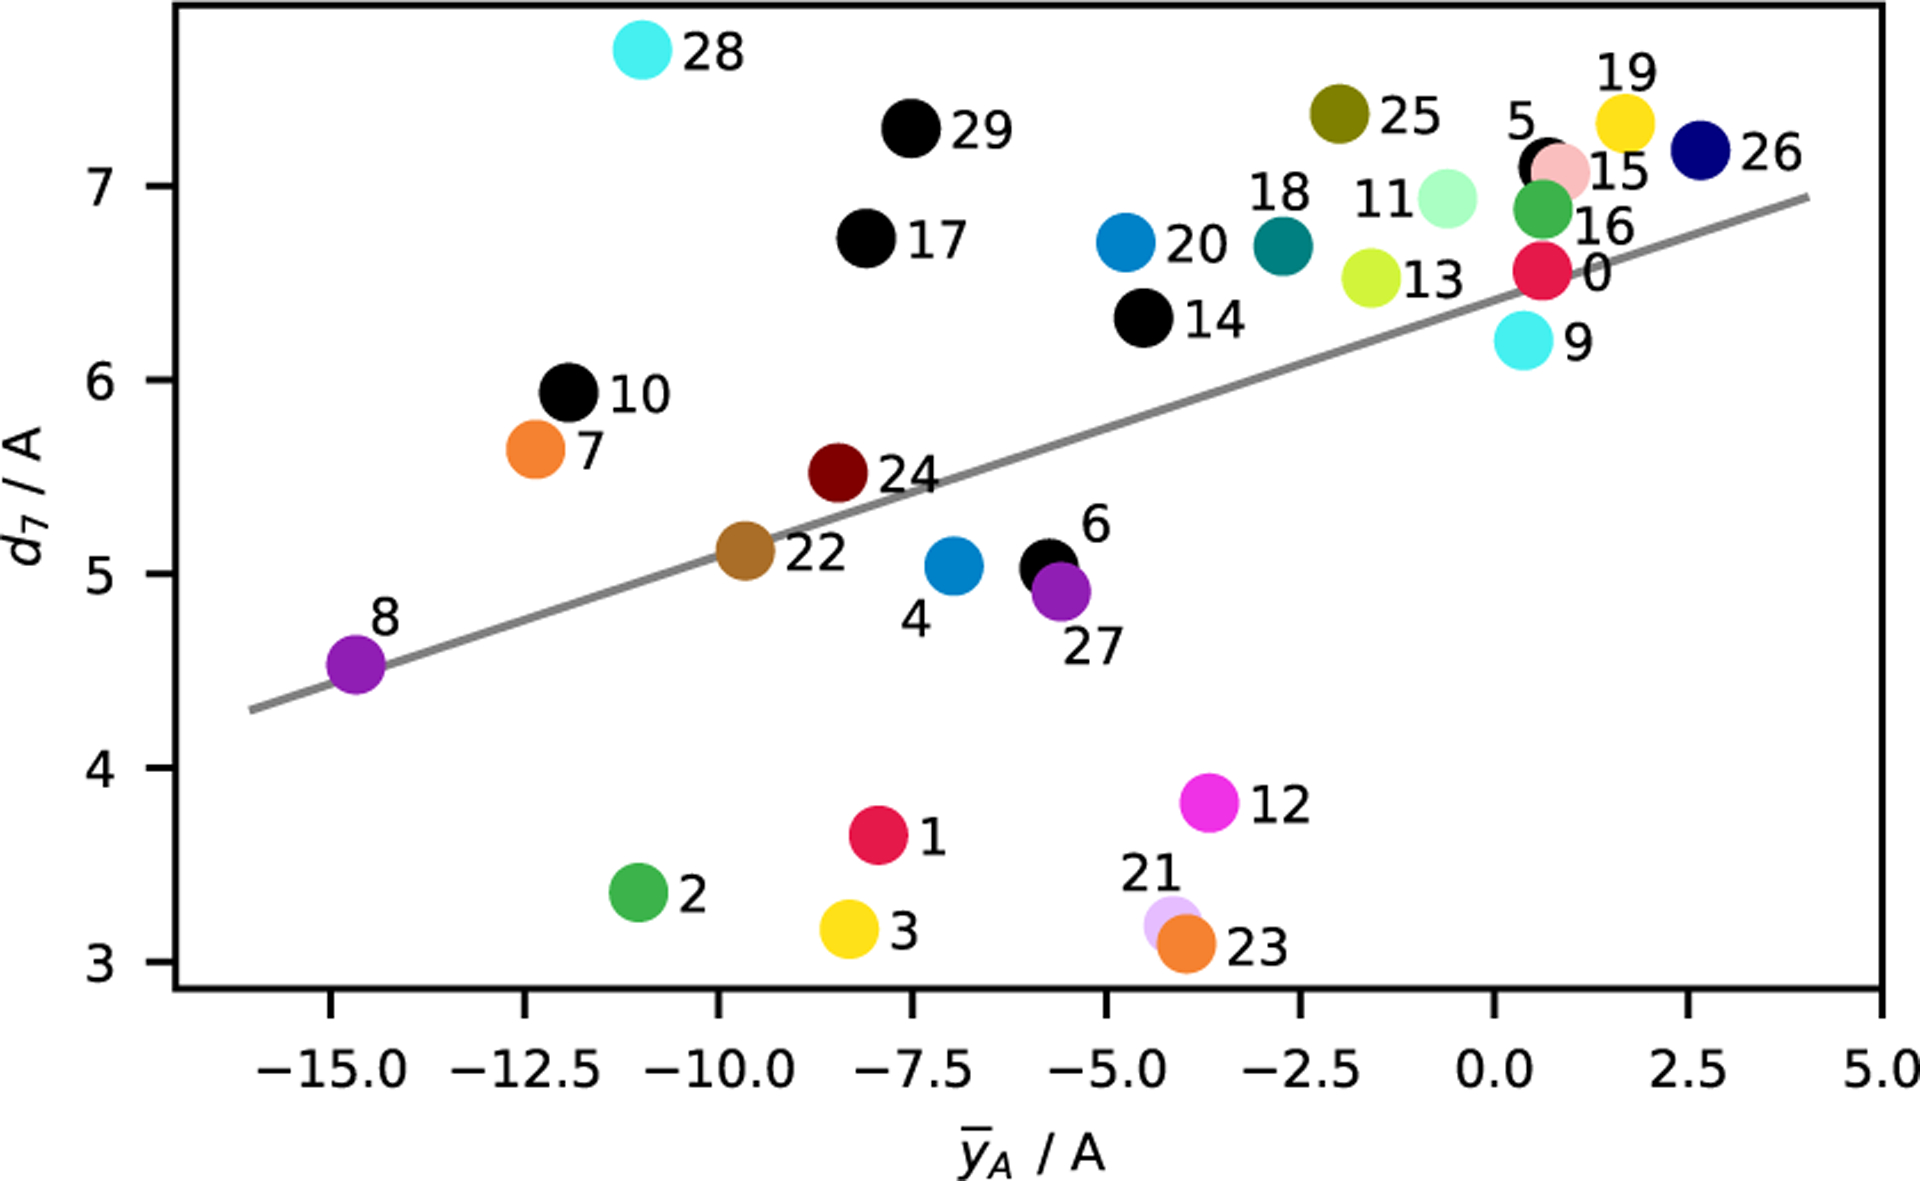
Comparison of ensemble means of the order parameter that measures the average position of the A-loop and d7 the distance between O-Gly383 and N-Arg386. The line of best fit is shown in gray (computed using equal weighting of all ensemble means).
In Fig. 8 we have plotted d6 the Lys271-Glu286 distance versus (instead of plotting d5 − d6 versus d7 as in Fig. 6). Metastable states are further grouped by DFG state and by P-loop state. In contrast to earlier analyses of the simulation data22 that used different order parameters, we observe a large distance between Lys271 and Glu286 in the macrostates 5, 20, and 28. This is due to alternative folds of the N-lobe which affects the orientation of the Lys271 side chain. In macrostates 5, 20, and 28 we observe that the side chain points out of the binding pocket (see suppl. Figs. 2 and 3), in stark contrast to conformations found in X-ray structures. In all other macrostates, the side chain points into the binding pocket as typically observed in kinase crystal structures. This observation was previously obscured by the choice of d5 − d6 as the order parameter. We therefore prefer to represent activation with the more direct d6 order parameter, as in Fig. 8. With the exception of macrostate 27, which has some population off the pathway, we find that all metastable states in the DFG-in and non-classical DFG conformations fall on different positions along the activation pathway. Macrostate 16 spans the active state and an intermediate, which suggests that there is no large free-energy barrier towards the end of the activation pathway (just like in c-Src53–57). Even though the decomposition into metastable states does not provide mechanistic information, this is a preliminary hint that Abl activation in the DFG-in state might follow a similar pathway as c-Src.
Figure 8:

Analysis of the metastable states with respect to the conformation of the αC helix and the A-loop. Table of two-dimensional histograms that use as one order parameter the distance d6 between Lys271 and Glu286 which characterizes the relative position of Glu (in the αC helix, see Fig. 9) and as the other order parameter , the average y coordinate of all atoms in the A-loop after alignment. Contours mark the outline of the set which includes 90% of the total probability. Metastable states are split into categories DFG-in, DFG-out, and non-classical DFG states along vertical direction of the table and into the categories extended P-loop, kinked P-loop and loop/disordered P-loop along the horizontal direction of the table. The bold gray arrows in the background mark the approximate course of the Src-like activation pathway56.
In contrast to DFG-in, the DFG-out macrostates do not cluster along a single pathway on the (d6, ) plane. Rather the full order parameter plane is covered with macrostates 4, 7, 8, 9, 12, 13, 15, 18, 21, and 22. This difference is clearly indicative of a strong coupling between the DFG motif and A-loop. To understand what distinguishes the DFG-out macrostates conformation-ally, we show ensembles of conformations drawn from the states in Fig. 10. We observe that all these macrostates (with the exception of 21 and 22) have well-determined conformations of the A-loop. This indicates that detailed A-loop conformation (rather than than a crude classification into extended and closed A-loop conformations) determines the nature of these macrostates. In a machine-learning-based classification of kinase structures in the PDB, McSkimming et al.58 arrived at a similar conclusion, that the conformation of the A-loop classifies structures more accurately as active or inactive than other methods.
Figure 10:

Ensembles of conformations drawn from the DFG-out, extended P-loop macrostates. The flexible structural elements are shown in color: the P-loop is shown in blue, the αC in orange, the A-loop in green. The DFG motif is shown in stick representation and colored in red (D), violet (F), white (G). Except in macrostates 21 and 22, the A-loop is in a well-defined conformation.
3.5. Comparison of metastable states to crystal structures
An important question concerns the similarity of the metastable states relative to available crystal structures of Abl as well as non-Abl kinases. As most crystal structures of kinases include inhibitors, such a comparison can reveal the predisposition of the metastable states for ligand binding, a property that pertains to the general “drug-gability” of the protein conformation. In other words, similarity to a known kinase X-ray structure in complex with a specific ligand should be indicative of the ability of the Abl macrostate to bind the same ligand.
We first compute the root-mean-square deviation (RMSD) between every combination of macrostate and each (Abl and non-Abl) kinase structure in the KLIFS data base7. The RMSD was calculated by averaging over the 1000 representative conformations that were drawn from each macrostate. (See Suppl. Note 4 for details.) PDB identifiers with RMSDs less than 3.5Å are shown in Table 2 (blue PDB IDs indicate crystal structures of Abl kinase).
Table 2:
Summary of the conformational states of the flexible structural elements (columns 2 and 3) in the metastable macrostates and comparison to all crystal structures (indicated by PDB ID) in the KLIFS database7. Blue ids indicate crystal structures of Abl kinase. Only crystal structures with at least 3 resolved residues in the P-loop, 5 resolved residues in the αC, and all 3 residues of the DFG resolved are considered in the comparison. The + symbol indicates that there are more than 5 structures in the respective RMSD range. See main text and Suppl. Note 4 for more details. *) In the RMSD computation, DFG, P-loop, αC, and the N-terminal stem of the A-loop are given equal weight — they are not weighted by the number of atoms as in standard RMSD.
| Crystal structures at x RMSD* around the state | |||||
|---|---|---|---|---|---|
| s | DFG | P-loop | 0 Å to 2.5 Å | 2.5 Å to 3.0 Å | 3.0 Å to 3.5 Å |
| 0 | in | kinked | 3U6H, 4U42, 4ZP5, 5DI1, 5J95, + | 4U41, 4OBO, 4ZSA, 3HUB, 4AOJ, + | |
| 1 | out | kinked | 3CS9, 3PYY | 6GTT, 3PG3, 3OXZ, 3IK3, 4AF3, + | |
| 2 | out | coil | 4AF3 | 6GTT, 3IK3, 3CS9, 3OXZ, 2E2B, + | |
| 3 | out | kinked | 3PYY | 2E2B, 3CS9, 3OXZ, 3IK3, 4AF3 | 3PG3, 3GVU, 2E2B, 3DZQ, 5HU9, + |
| 4 | out | ext. | 4FG8, 5ZWJ, 2VTT, 1SNX, 3FZP, + | 2R3N, 3CEK, 4FK3, 3RCD, 4RWL, + | |
| 5 | - | - | |||
| 6 | - | - | |||
| 7 | out | ext. | 3FZS, 3LFF, 6DKG, 3BE2, 2OG8 | 4BKJ, 6FNG, 6DKB, 2BAK, 4A9Y, + | |
| 8 | out | ext. | 6FNG, 2OG8 | 3FZS, 6FNJ, 4F6U, 4F7J, 3BE2, + | 4F6S, 6DKB, 4ZJJ, 4CKR, 2BAK, + |
| 9 | out | ext. | 2CLQ, 5U8L | 5HG5, 5HG7, 5UGA, 5UG9, 5HG9, + | |
| 10 | - | - | 5NKA | 5NK0, 3QGY, 3R7Q, 2REI, 5NKI, + | 2A5U, 6FNH, 3L13, 3Q6U, 3QAQ, + |
| 11 | neither | ext./coil | 3H3C, 3FZP, 5TO8, 1P14 | ||
| 12 | out | ext./coil | 6FDZ, 4FG8 | ||
| 13 | out | ext. | 2HZ0, 2P2I | 3LFF, 2QU5, 5AR7, 5JFS, 4091, + | 6DKB, 3BE2, 6DKG, 4EQU, 4FC0, + |
| 14 | - | - | |||
| 15 | out | ext. | 5TO8, 3H3C, 3ET7, 3FZR, 5D9K, + | ||
| 16 | in | disordered | 2BDJ,4D1S | 2DQ7, 4PUZ, 4WN0, 4XG9, 5VD0, + | |
| 17 | - | - | |||
| 18 | out | ext. | 4ZJV, 4120, 5UGA, 5U8L, 5HG5, + | ||
| 19 | in | ext. | 3V5J, 3GGF, 4PP9, 1SM2, 3V5L, + | 5JKG, 5XFF, 1SNX, 3QGY, 4KIO, + | |
| 20 | in | ext. | 5ZWJ, 5D41, 2VTT, 1SNX, 4IM0, + | 1SNU, 3QGW, 1SM2, 3LZB, 3EZV, + | |
| 21 | out | ext. | 1BYG | ||
| 22 | out | ext. | 3LFF, 6DKG | ||
| 23 | in | ext. | 1BUH, 1OIT, 4KD1, 5YU9, 4EK8, + | 5H0E, 4HZS, 4YHF, 3W32, 2SRC, + | 5D7A, 3QU0, 4AUA, 4MNE, 3EQC, + |
| 24 | out | kinked | 3CS9 | 3PYY, 3CS9, 30XZ, 2E2B, 3IK3, + | 6GTT, 5JFS, 6DKW, 5JFV, 5JFW, + |
| 25 | neither | ext. | 3H3C, 5TO8 | 3FZR, 3ET7, 1P14, 2VTN, 3FZP, + | 2VTQ, 4O0R, 4FZA, 5TOB, 2XNP, + |
| 26 | neither | kinked/coil | |||
| 27 | in | ext./coil | 1SNX, 1SNU, 1SM2, 5D41, 3LZB, + | 4FG8, 4BGH, 4IM2, 3C4C, 4K2R, + | |
| 28 | in | coil | 3U6H | 4ZP5, 4U41, 4U42, 4OBO, 4AAA, + | |
| 29 | - | - | |||
We observe that for the majority of metastable states, there are crystal structures within 3.0 Å. The minority of macrostates that are far from any crystal structure include the mis-folded macrostates 5, 6, 14, 17, and 29 and the non-classical DFG, disordered P-loop macrostate 26. For metastable states with a subpopulation with a coiled P-loop (2, 11, 12, 26, 27, 28) there are generally no close crystal structures (with RMSD < 2.5 Å). For macrostate 25, which is in a non-classical DFG conformation, there are several relatively close crystals structures (RMSD < 2.5 Å) of Pyk2 kinase, which do not exhibit the non-classical DFG conformation (see also suppl. Table 4).
In Table 2, RMSD values were calculated by averaging over over all flexible structural elements and all conformations from the metastable state. The subset of crystal structures with RMSD smaller than 2.5 Å are shown in Fig. 11. The total RMSD is decomposed into contributions from each of the structural elements. For some combination of macrostate and crystal structure, like (13, 2HZ0) all four structural elements are aligned. For most macrostates however, only three structural elements are in close alignment. While the analysis reveals many different kinases (e.g., Lck, Cdk2, PYK2, EphA2, and VEGFR2), a few cases directly concern Abl kinase in complex with different inhibitors. For example, macrostate 3 (Fig. 11a) is similar to 3PYY, a crystal structure of Abl with the inhibitor imatinib bound in the catalytic site and with the small-molecule c-Abl activator, DPH, simultaneously bound in the N-terminal myristoyl binding site of the kinase domain.59 Macrostate 13 (Fig. 11i) is similar to 2HZ0, a crystal structure of Abl with the inhibitor NVP-AEG082 that binds to DFG-out but without the inactive conformation of the P-loop.60 Macrostate 24 (Fig. 11t) is similar to 3CS9, a crystal structure of Abl with the inhibitor nilotinib (AMN-107), which is more potent against imatinib-resistant mutants.61
Figure 11:

Comparison of metastable states to close crystal structures. Panels a, c, e, g, i, k, m, o, q, s, u, w in the first and third column show a superposition of the medoid structure from selected metastable states to close crystal structures. Macrostate medoids are rendered in thick style, crystal structures are rendered in thin style. Panels b, d, f, h, j, l, n, p, r, t, v, x in the second and fourth column show the RMSD between crystal structures and all frames from the closest metastable state. RMSD values are displayed as free energy profiles computed by taking the logarithm of a Gaussian kernel density estimate62 of 1000 conformations sampled from each metastable state (refer to Suppl. Note 4 for details).
To help putting such small RMSDs between macrostates and X-ray structures in perspective, we compute the size of the macrostates and their mutual separations. We use the same method for aligning conformations and computing the RMSD as described in Suppl. Note 4. We define the size of a macrostate as the average RMSD between random conformations sampled from the same macrostate. For computing the difference between two distinct states, we proceed accordingly and compute the same average over pairs of conformations sampled from the respective macrostates. The results show (see Suppl. Fig. 6) that the macrostates typically have sizes (2.7 Å on average) that are smaller than the separation between different macrostates (7.1 Å on average). This observation is consistent with the usual picture of molecular free energy landscapes in which a small number of well-defined minima are embedded in a high-dimensional space.
The observed compactness of the macrostates is indicative that the similarity to specific X-ray structures reported in Table 2 must be meaningful. Therefore, the occurrence of small RMSDs between X-ray structures and compact and narrowly defined macrostates is unlikely to be the product of chance. One must bear in mind however, that the MSM transition matrix, which underlies the stationary distribution and the construction of the PCCA+ macrostates, can be adversely affected by the lack of sampling. For example, the stationary weight of a microstate or even an entire macrostate can be overestimated (see Notebook 08 - “Common problems & bad data situations” in ref. 38). Such an error can lead to a consequent error in the computation of metastable states. Metastable states might appear more compact than they truly are, because an absorbing microstate is assigned an artificial high stationary weight.38 To exclude the possibility that our results are largely affected by this problem, we further examined the compactness of each macrostate by determining the minimal number of microstates necessary to make up for 90% of its stationary weight (i.e., the number of dominant microstates). The results are given in suppl. Table 7. Since the microstates were generated with the k-means clustering algorithm, which places the majority of the microstates in high-density regions,16 the number of total microstates in a macrostate should roughly agree with the number of dominant microstates in a macrostate. With the exception of macrostates 11, 25, 26, and 29, Suppl. Table 7 shows that this condition is indeed fulfilled for all macrostates, which indicates that the present results are valid. Coincidentally, macrostates 11, 25, and 26 happen to be non-classical DFG states that are probably among the states with the lowest quality of sampling, suggesting that quantitative statements about these states are more uncertain.
As mentioned above, one additional source of uncertainty is the exact number of metastable states that were used for PCCA+ clustering. Here, the analysis was carried out with 30 metastable states, a choice that is supported by the leading relaxation times apparent from the eigenspectrum suggesting that this is a reasonable cutoff. To understand the consequences of this choice, the clustering was repeated with 20 and with 40 metastable states. We observe three effects when changing the number of metastable states: (i) increasing the number of metastable states can lead to splitting of states into smaller states, which makes them more conformationally well-defined. This can for instance be seen from the crystal structures 2PYY and 1SNX which are in the 2.5Å to 3.0Å range when clustering with 20 states (see suppl. Tab. 9) and move to the 0Å to 2.5Å range of two different PCCA states when clustering with 40 states (see suppl. Tab. 10 and Suppl. Note 3). (ii) States that are long-lived but at a high free energy might only be distinguished when clustering with a sufficient number of metastable states. Crystal structures 6FNG, 2OH8, and 5NKA that are close to PCCA states 8 and 10 only appear when clustering with 30 PCCA states or more (see suppl. Tab. 12) suggesting that their corresponding PCCA states are high in free energy. (iii) When clustering with a high number of states, PCCA starts to resolve states more finely than is reflected in the placement of available crystal structures throughout conformational space. X-ray structure 3PYY becomes the closest structure to several states when clustering with 40 states (see suppl. Tab. 10). This observation suggests that further increasing the number of metastable states in this work does not enhance the practical value of the present analysis given the available kinase crystal structures.
In ending this discussion, it may be helpful to draw a clear distinction between the 30 states resulting from the PCCA analysis, and the 16 macrostates that were used in our previous MSM study of Abl kinase.22 These 16 macrostates were generated in an ad hoc manner, by manually coarse-graining the state space on the basis of available kinase crystal structures. In doing so, reliance on any MSM analysis was deliberately avoided for the specific purpose of allowing an objective comparison of the results obtained from simulations of Abl initiated from Abl crystal structures to those obtained from simulations of Abl homology models initiated only from non-Abl structures. For this reason, a direct correspondence between the two representations is not expected. In contrast to the metastable states determined with the PCCA+ algorithm, the 16 ad hoc states were neither optimized such that their centers lie at the bottom of the free-energy minima, nor were their boundaries optimized to follow the free-energy barriers. The states do not reveal misfolded or non-classical DFG states. In suppl. Tab. 13, we show a comparison of the 16 states to the 30 metastable states. It is observed that the ad hoc states map to PCCA states 1, 2, 15, 16, 21, 22, 26, 27, and 29 with duplications.
3.6. Relevance of metastable states to known bound ligand poses
Since most kinase crystal structures are in complex with an inhibitor, a close match between conformations of the metastable state to the crystal structure should generally be indicative that there is some favorable conformational selection for this specific ligand. To illustrate this point in greater detail, two crystal structures from the PDB are of particular interest. The first one is the PDB structure 1IEP,63 corresponding to the Abl-imatinib complex, which differs from metastable state 3 by 3.43 Å according to the same criteria used in Table 2 and Fig. 11. The RMSD is dominated by the conformation of the N-terminal stem of the A-loop; the RMSD between 1IEP and metastable state 3 drops to 2.23 Å when this structural element is excluded. This structure represents the canonical DFG-out “type II” inhibitor binding pose of imatinib with Abl. The second one is the PDB structure 1XBB,25 corresponding to the Syk (spleen tyrosine kinase) in complex with imatinib. This structure represents a very different binding pose from the canonical 1IEP; the DFG motif is in the in conformation and imatinib only occupies the ATP pocket. This structure differs from metastable state 16 by 3.13 Å according to the same criteria used in Table 2 and Fig. 11. Again, the structural deviation is dominated by the A-loop. The RMSD drops to 2.20 Å when the A-loop is excluded. In both cases, the A-loop does not contact imatinib, suggesting that its conformation is of limited relevance to the binding specificity. The high similarity of 1XBB and 1IEP to some of the macrostates is even more remarkable because the kinase conformations in these two X-ray structures are completely different. The RMSD between 1XBB and 1IEP is 8.6 Å, and 4.7 Å when excluding the A-loop.
For the sake of further comparison of the binding pocket, we define two additional RMSD observables as follows. For the set of residues in the crystal structures that have non-hydrogen atoms within a 3.5 Å range around imatinib, we compute the average RMSD between the crystal structure and the 1000 conformations from the metastable state. RMSD values are computed separately for backbone and side chain atoms. The comparison to imatinib-bound Abl (PDB ID 1IEP) is shown in Fig. 12. We observe a few macrostates (1, 3, 7) with backbone RMSD < 2 Å, but with a larger side chain RMSD. This can be interpreted as a conformational selection type binding at the level of the backbone with an induced-fit component at the level of the side chains.
Figure 12:

Free energy landscapes of the RMSD between the Abl crystal structure with PDB identifier 1IEP and conformations sampled from selected metastable states. First column: RMSD of residues that contact the imatinib ligand in the crystal structure 1IEP, computed separately for side chain and backbone atoms. Second column: RMSD of the individual flexible structural elements. Third column: superimposed crystal structure 1IEP and the medoid of selected metastable states. Crystal structures are rendered in thin style. Medoids of metastable states are rendered in thick style. Fourth column: superimposed medoid of selected metastable states and imatinib coordinates from PDB 1IEP.
The comparison to imatinib-bound Syk (spleen tyrosine kinase, PDB ID 1XBB)25 is shown in Fig. 13. We observe simultaneously small backbone RMSDs and side chain RMSDs. The analysis reveals an almost perfect match of the binding pocket surrounding the ligand, with less than 1 Å deviation. In other words, no discernible induced-fit appears to be required to accommodate the ligand in this binding pose. While it is unclear whether the same binding pose could occur with Abl kinase, the remarkable structural similarity to the 1XBB crystal structure of Syk kinase strongly suggests that it is at least possible.
Figure 13:

Superimposed medoids and crystal structures as well as free energy landscapes of the RMSD between the Syk crystal structure with PDB identifier 1XBB and conformations sampled from selected metastable states. Same as Fig. 12 for PDB 1XBB.
4. Conclusion
We have applied the PCCA+ kinetic clustering to the previously published MSM of apo-Abl kinase in the unphosphorylated state.22 This allowed us to classify in an objective way the metastable conformations of the four flexible structural elements: the DFG motif, the P-loop, the αC helix, and the A-loop without having to rely on predefined order parameters in the definition of the macrostates. This independent analysis of conformational states confirms that conformations of the DFG motif generally correspond to the “in” and “out” conformations, irrespective of the conformational state of the other flexible structural elements. DFG “in” and “out” states are long-lived metastable states. In addition, we find a small number of metastable states that are neither DFG-in nor DFG-out. These non-classical macrostates include conformations where both the Asp and Phe point into the ATP pocket and a macrostate where Asp and Phe point towards the N-lobe. We also find that the conformations of the P-loop can be generally grouped into the “kinked” and “extended” conformations (with two exceptions). The range of motion by the A-loop, αC and the Lys271-Glu286 salt bridge is far more complex. For metastable states with the DFG-in conformation, the A-loop and αC helix adopt a reduced set of conformations collected near the proposed Src-like activation pathway.56 However, we find a more diverse set of A-loop and αC conformations for the DFG-out states. We further identified a number of macrostates with non-crystallographic folds of the N-lobe which indicates partial unfolding and further flexibility beyond that of the four structural elements.
Comparing the metastable macrostates to structures in the PDB (Table 2) revealed that the conformational ensemble of apo-Abl overlaps considerably with crystal structures of both Abl and non-Abl kinases. It is worth emphasizing that such high similarity, with a large number of non-Abl kinases (e.g., Syk, Lck, Cdk2, PYK2, EphA2, VEGFR2) in complex with a wide variety of inhibitors (e.g., DPH, NVP-AEG082, AMN-107), relied on an MSM analysis generated exclusively from MD simulations of apo-Abl (no bound ligand). The notion that the conformational dynamics of a kinase in the absence of any ligand can provide critical information about possible target conformations for ligand binding of any member of the kinase family is truly remarkable.
These observations support the general notion that the set of conformations accessible to tyrosine kinases may be shared within the entire family. The empirical facts support the idea of a relationship between the structural diversity of a protein family sampled by evolution (related sequences leading to a single native structure) versus the structural dynamics sampled by a single protein member of that family.64 For example, a previous MSM study of c-Src revealed an intermediate conformation poised to bind the inhibitor ANS in an allosteric site adjacent to the αC-helix between Lys295 and Glu310,56 similar to a crystal structure of cyclin-dependent kinase 2 (CDK2) in complex with ANS.65
Markov modeling was used here as a tool for kinetic clustering and as a systematic way to analyze many short trajectories of Apo-Abl. One cannot claim that the present MSM reproduces the correct kinetics or thermodynamics of the molecular system. Important transitions, such as between the DFG-in and DFG-out states take place on the millisecond timescale66 and possibly beyond for many kinases and we do not claim that we have sampled them ergodically in our 800 μs of MD simulation. This means that our analysis likely overestimates the barrier heights between the different metastable states. Unfortunately, this overestimation is usually obscured by the ubiquitous projection error (barrier recrossing) in Markov modeling. Projection error makes barriers heights appear systematically lower than their true values.16 Moreover, unidentified or poorly identified absorbing states in an MSM can lead to systematic overestimation of barrier heights and free energy differences.38 Because of all these competing errors with different directions, an accurate computation of barrier heights between all metastable states is currently impossible and will be addressed in future work with enhanced sampling techniques. These limitations notwithstanding, the MSM methodology, PCCA+ kinetic clustering will however remain applicable. In particular kinetic clustering is robust to MSM estimation errors, since the barrier heights need not be accurately known - only the presence or absence of dominant barriers must be known in order to cluster conformations. MSM estimation can be combined with enhanced sampling simulations that either use forces which bias the energy landscape or that use adaptive restarts which drive the MD simulations to explore the relevant conformations.67,68 Kinetic clustering can then be realized by launching relatively short MD simulations from starting points harvested from the enhanced sampling simulations or by using methods that combine Markov modeling with free energy computation such as TRAM69 or Hyperdynamics70
The observation that the conformational dynamics of a kinase in the absence of any ligand can inform us about possible target conformations for inhibitor binding suggests that a practical computational strategy might start first with an extensive characterization of the apo state via MSM and kinetic clustering, followed by further computations with specific ligands of interest. At this second stage, a number of computational approaches relying on various enhanced sampling techniques may be used to study the association-dissociation of the ligand.71–77 Our hope is that such a practical computational strategy, that combines homology modeling, molecular dynamics, enhanced sampling techniques and MSM is general and accurate enough to help determine the energy landscape of target proteins and help to identify relevant druggable conformations that can be targeted by rational drug design.
Supplementary Material
Acknowledgements
F.P. acknowledges funding from the Yen Post-Doctoral Fellowship in Interdisciplinary Research. F.P. and B.R. acknowledge funding from the National Cancer Institute of the National Institutes of Health (NIH) through Grant CAO93577. This work was generously supported by a grant from the Lilly Research Award Program (LRAP). We are grateful to Trayder Thomas for his corrections to the manuscript. Useful discussions with Michael Vieth, Cen Gaom and Yiannis Galdadas are gratefully acknowledged.
Footnotes
Supporting Information
Suppl. Note 1 contains details about the MD simulation setup. Suppl. Note 2, Suppl. Table 1, and Suppl. Fig. 1 describe and show the distances d1 to d7 that have been used to characterize the conformations of the flexible elements. In Suppl. Note 3, we report parameter choices and modeling choices for MSM construction and PCCA+ clustering. Suppl. Note 4 and Suppl. Table 3 contain details about structural alignment and RMSD computations. Suppl. Fig. 2 and Suppl. Fig. 3 show the medoid conformation and ensemble views for all 30 metastable states. Suppl. Fig. 4 and Suppl. Fig. 5 are extended versions of Fig. 11 that additionally show the conformation of the ligand in the respective crystal structure and the RMSD of contacting residues decomposed into backbone and side chain contributions. Suppl. Fig. 6 shows a matrix of average RMSD values that describe the compactness and separation of the metastable states. Suppl. Fig. 7 contains the same visualization as Fig. 8 but computed from PCCA+ decompositions with 20 and with 40 states. Suppl. Fig. 8 show the relaxation timescales of the MSM and the relative spectral gap sizes. In Suppl. Table 2 we report the classification of DFG conformations in the 30 metastable states according to the scheme of Modi and Dunbrack49. Suppl. Table 4 is the same as but shows the kinase types in place of the PDB identifiers. Suppl. Table 5 is the same as but shows the ligand identifiers in place of the PDB identifiers. Suppl. Table 6 contains the free energies and life time from Fig. 2 in numerical form. Suppl. Table 7 reports the sizes of macrostates (number of microstates) and a measure of macrostate compactness. Suppl. Table 8 contains classification results for the activation state of the 30 metastable states computed with different published methods. Suppl. Table 9 is similar to Table 2 but show results from a PCCA+ decomposition with 20 states. Suppl. Table 10 is the same as Suppl. Table 9 but with 40 PCCA states. In Suppl. Table 11, we report the status of the DFG motif (according to the Modi-Dunbrack scheme49) for the metastable states that result from PCCA+ clustering with 40 states. Suppl. Table 12 is the same as Suppl. Table 11 but with 20 PCCA states. Suppl. Table 13 shows a comparison of the 30 metastable states to the 16 manually defined states that were introduced in ref. 22 and further details about these 16 states.
The Supporting Information is available free of charge on the ACS Publications website.
References
- (1).Pendergast AM The Abl family kinases: Mechanisms of regulation and signaling; Adv. Cancer Res; Academic Press, Cambridge, MA, 2002; Vol. 85; pp 51–100. [DOI] [PubMed] [Google Scholar]
- (2).Melo J The diversity of BCR-ABL fusion proteins and their relationship to leukemia phenotype. Blood 1996, 88, 2375–2384. [PubMed] [Google Scholar]
- (3).Druker BJ; Tamura S; Buchdunger E; Ohno S; Segal GM; Fanning S; Zimmermann J; Lydon NB Effects of a selective inhibitor of the Abl tyrosine kinase on the growth of Bcr-Abl positive cells. Nat. Med 1996, 2, 561–566. [DOI] [PubMed] [Google Scholar]
- (4).Mauro MJ; Druker BJ STI571: targeting BCR-Abl as therapy for CML. Oncolo-gist 2001, 6, 233–238. [DOI] [PubMed] [Google Scholar]
- (5).Manning G; Whyte DB; Martinez R; Hunter T; Sudarsanam S The protein kinase complement of the human genome. Science 2002, 298, 1912–1934. [DOI] [PubMed] [Google Scholar]
- (6).Huse M; Kuriyan J The Conformational Plasticity of Protein Kinases. Cell 2002, 109, 275–282. [DOI] [PubMed] [Google Scholar]
- (7).van Linden OPJ; Kooistra AJ; Leurs R; de Esch IJP; de Graaf C KLIFS: A Knowledge-Based Structural Database To Navigate Kinase-Ligand Interaction Space. J. Med. Chem 2014, 57, 249–277. [DOI] [PubMed] [Google Scholar]
- (8).Roskoski R A historical overview of protein kinases and their targeted small molecule inhibitors. Pharmacol. Res 2015, 100, 1–23. [DOI] [PubMed] [Google Scholar]
- (9).Taipale M; Krykbaeva I; Koeva M; Kayatekin C; Westover KD; Karras GI; Lindquist S Quantitative Analysis of Hsp90-Client Interactions Reveals Principles of Substrate Recognition. Cell 2012, 150, 987–1001. [DOI] [PMC free article] [PubMed] [Google Scholar]
- (10).Skora L; Mestan J; Fabbro D; Jahnke W; Grzesiek S NMR reveals the allosteric opening and closing of Abelson tyrosine kinase by ATP-site and myristoyl pocket inhibitors. Proc. Natl. Acad. Sci. USA 2013, 110, E4437–E4445. [DOI] [PMC free article] [PubMed] [Google Scholar]
- (11).Agafonov RV; Wilson C; Otten R; Buosi V; Kern D Energetic dissection of Gleevec’s selectivity toward human tyrosine kinases. Nat. Struct. Mol. Biol 2014, 21, 848. [DOI] [PMC free article] [PubMed] [Google Scholar]
- (12).Weikl TR; Paul F Conformational selection in protein binding and function. Protein Sci 2014, 23, 1508–1518. [DOI] [PMC free article] [PubMed] [Google Scholar]
- (13).Schütte C; Fischer A; Huisinga W; Deuflhard P A Direct Approach to Conformational Dynamics Based on Hybrid Monte Carlo. J. Comput. Phys 1999, 151, 146–168. [Google Scholar]
- (14).Singhal N; Snow CD; Pande VS Using path sampling to build better Markovian state models: Predicting the folding rate and mechanism of a tryptophan zipper beta hairpin. J. Chem. Phys 2004, 121, 415–425. [DOI] [PubMed] [Google Scholar]
- (15).Noé F; Horenko I; Schüztte C; Smith JC Hierarchical analysis of conformational dynamics in biomolecules: Transition networks of metastable states. J. Chem. Phys 2007, 126, 155102. [DOI] [PubMed] [Google Scholar]
- (16).Prinz J-H; Wu H; Sarich M; Keller B; Senne M; Held M; Chodera JD; Schütte C; Noé F Markov models of molecular kinetics: Generation and validation. J. Chem. Phys 2011, 134, 174105. [DOI] [PubMed] [Google Scholar]
- (17).McCammon JA; Karplus M Dynamics of activated processes in globular proteins. Proc. Natl. Acad. Sci. U.S.A 1979, 76, 3585–3589. [DOI] [PMC free article] [PubMed] [Google Scholar]
- (18).Northrup SH; Pear MR; Lee CY; McCammon JA; Karplus M Dynamical theory of activated processes in globular proteins. Proc. Natl. Acad. Sci. USA 1982, 79, 4035–4039. [DOI] [PMC free article] [PubMed] [Google Scholar]
- (19).Berne BJ; Borkovec M; Straub JE Classical and modern methods in reaction rate theory. J. Phys. Chem 1988, 92, 3711–3725. [Google Scholar]
- (20).Bowman GR; Ensign DL; Pande VS Enhanced Modeling via Network Theory: Adaptive Sampling of Markov State Models. J. Chem. Theory Comput 2010, 6, 787–794. [DOI] [PMC free article] [PubMed] [Google Scholar]
- (21).Plattner N; Doerr S; De Fabritiis G; Noé F Complete protein-protein association kinetics in atomic detail revealed by molecular dynamics simulations and Markov modelling. Nat. Chem 2017, 9, 1005. [DOI] [PubMed] [Google Scholar]
- (22).Meng Y; Gao C; Clawson DK; Atwell S; Russell M; Vieth M; Roux B Predicting the Conformational Variability of Abl Tyrosine Kinase using Molecular Dynamics Simulations and Markov State Models. J. Chem. Theory Comput 2018, 14, 2721–2732. [DOI] [PMC free article] [PubMed] [Google Scholar]
- (23).Deuflhard P; Weber M Robust Perron cluster analysis in conformation dynamics. Linear Algebra Appl 2005, 398, 161–184. [Google Scholar]
- (24).Seeliger MA; Ranjitkar P; Kasap C; Shan Y; Shaw DE; Shah NP; Kuriyan J; Maly DJ Equally Potent Inhibition of c-Src and Abl by Compounds that Recognize Inactive Kinase Conformations. Cancer Res 2009, 69, 2384–2392. [DOI] [PMC free article] [PubMed] [Google Scholar]
- (25).Atwell S; Adams JM; Badger J; Buchanan MD; Feil IK; Froning KJ; Gao X; Hendle J; Keegan K; Leon BC; Muller-Dieckmann HJ; Nienaber VL; Noland BW; Post K; Rajashankar KR; Ramos A; Russell M; Burley SK; Buchanan SG A novel mode of Gleevec binding is revealed by the structure of spleen tyrosine kinase. J. Biol. Chem 2004, 279, 55827–55832. [DOI] [PubMed] [Google Scholar]
- (26).Pearson K LIII. On lines and planes of closest fit to systems of points in space. Lond. Edinb. Dubl. Philos. Mag 1901, 2, 559–572. [Google Scholar]
- (27).Mu Y; Nguyen PH; Stock G Energy landscape of a small peptide revealed by dihedral angle principal component analysis. Proteins: Struct., Funct., Bioinf 2004, 58, 45–52. [DOI] [PubMed] [Google Scholar]
- (28).Molgedey L; Schuster HG Separation of a mixture of independent signals using time delayed correlations. Phys. Rev. Lett 1994, 72, 3634–3637. [DOI] [PubMed] [Google Scholar]
- (29).Pérez-Hernández G; Paul F; Giorgino T; De Fabritiis G; Noé F Identification of slow molecular order parameters for Markov model construction. J. Chem. Phys 2013, 139, 015102. [DOI] [PubMed] [Google Scholar]
- (30).Schwantes CR; Pande VS Improvements in Markov State Model Construction Reveal Many Non-Native Interactions in the Folding of NTL9. J. Chem. Theory Comput 2013, 9, 2000–2009. [DOI] [PMC free article] [PubMed] [Google Scholar]
- (31).van Kampen NG Chapter V. The Master Equation. Stochastic Processes in Physics and Chemistry; Elsevier Science B. V.: Amsterdam, The Netherlands, 1992; pp 114–117. [Google Scholar]
- (32).Bowman GR; Beauchamp KA; Boxer G; Pande VS Progress and challenges in the automated construction of Markov state models for full protein systems. J. Chem. Phys 2009, 131, 124101. [DOI] [PMC free article] [PubMed] [Google Scholar]
- (33).Rodriguez A; Laio A Clustering by fast search and find of density peaks. Science 2014, 344, 1492–1496. [DOI] [PubMed] [Google Scholar]
- (34).Lemke O; Keller BG Density-based cluster algorithms for the identification of core sets. J. Chem. Phys 2016, 145, 164104. [DOI] [PubMed] [Google Scholar]
- (35).Paul F; Wu H; Vossel M; de Groot BL; Noé F Identification of kinetic order parameters for non-equilibrium dynamics. J. Chem. Phys 2019, 150, 164120. [DOI] [PMC free article] [PubMed] [Google Scholar]
- (36).Weber M; Fackeldey K G-PCCA: Spectral clustering for non-reversible Markov chains; Technical Report 15–35; Konrad-Zuse-Zentrum für Informationstechnik Berlin: Takustraße 7, D-14195 Berlin-Dahlem, Germany, 2015. [Google Scholar]
- (37).Röblitz S; Weber M Fuzzy spectral clustering by PCCA+: application to Markov state models and data classification. Adv. Data. Anal. Classif 2013, 7, 147–179. [Google Scholar]
- (38).Wehmeyer C; Scherer MK; Hempel T; Husic BE; Olson S; Noé F Introduction to Markov state modeling with the PyEMMA software — v1.0. Living J. Comput. Mol. Sci 2018, 1, 1–12. [Google Scholar]
- (39).Noé F; Doose S; Daidone I; Löllmann M; Sauer M; Chodera JD; Smith JC Dynamical fingerprints for probing individual relaxation processes in biomolecular dynamics with simulations and kinetic experiments. Proc. Natl. Acad. Sci. USA 2011, 108, 4822–4827. [DOI] [PMC free article] [PubMed] [Google Scholar]
- (40).Scherer MK; Trendelkamp-Schroer B; Paul F; Pérez-Hernández G; Hoffmann M; Plattner N; Wehmeyer C; Prinz J-H; Noé F PyEMMA 2: A Software Package for Estimation, Validation, and Analysis of Markov Models. J. Chem. Theory Comput 2015, 11, 5525–5542. [DOI] [PubMed] [Google Scholar]
- (41).Trendelkamp-Schroer B; Wu H; Paul F; Noé F Estimation and uncertainty of reversible Markov models. J. Chem. Phys 2015, 143, 174101. [DOI] [PubMed] [Google Scholar]
- (42).Yang S; Roux B Src kinase conformational activation: thermodynamics, pathways, and mechanisms. PLoS Comput. Biol 2008, 4, e1000047. [DOI] [PMC free article] [PubMed] [Google Scholar]
- (43).Citri A; Harari D; Shohat G; Ramakrishnan P; Gan J; Lavi S; Eisenstein M; Kimchi A; Wallach D; Pietrokovski S; Yarden Y Hsp90 Recognizes a Common Surface on Client Kinases. J. Biol. Chem 2006, 281, 14361–14369. [DOI] [PubMed] [Google Scholar]
- (44).Karagöz GE; Rüdiger SG Hsp90 interaction with clients. Trends Biochem. Sci 2015, 40, 117–125. [DOI] [PubMed] [Google Scholar]
- (45).Schrader EK; Harstad KG; Matouschek A Targeting proteins for degradation. Nat. Chem. Biol 2009, 5, 815–822. [DOI] [PMC free article] [PubMed] [Google Scholar]
- (46).Iacob RE; Pene-Dumitrescu T; Zhang J; Gray NS; Smithgall TE; Engen JR Conformational disturbance in Abl kinase upon mutation and deregulation. Proc. Natl. Acad. Sci. USA 2009, 106, 1386–1391. [DOI] [PMC free article] [PubMed] [Google Scholar]
- (47).Meng Y; Lin Y; Roux B Computational Study of the “DFG-Flip” Conformational Transition in c-Abl and c-Src Tyrosine Kinases. J. Phys. Chem. B 2015, 119, 1443–1456. [DOI] [PMC free article] [PubMed] [Google Scholar]
- (48).Vijayan RSK; He P; Modi V; Duong-Ly KC; Ma H; Peterson JR; Dunbrack RL; Levy RM Conformational Analysis of the DFG-Out Kinase Motif and Biochemical Profiling of Structurally Validated Type II Inhibitors. J. Med. Chem 2015, 58, 466–479. [DOI] [PMC free article] [PubMed] [Google Scholar]
- (49).Modi V; Dunbrack RL Defining a new nomenclature for the structures of active and inactive kinases. Proc. Natl. Acad. Sci. USA 2019, 116, 6818–6827. [DOI] [PMC free article] [PubMed] [Google Scholar]
- (50).Guimarães CRW; Rai BK; Munchhof MJ; Liu S; Wang J; Bhattacharya SK; Buckbinder L Understanding the Impact of the P-loop Conformation on Kinase Selectivity. J. Chem. Inf. Model 2011, 51, 1199–1204. [DOI] [PubMed] [Google Scholar]
- (51).Yamaguchi H; Hendrickson W Structural basis for activation of human lymphocyte kinase Lck upon tyrosine phosphorylation. Nature 1996, 384, 484–489. [DOI] [PubMed] [Google Scholar]
- (52).Sicheri F; Moarefi I; Kuriyan J Crystal structure of the Src family tyrosine kinase Hck. Nature 1997, 385, 602–609. [DOI] [PubMed] [Google Scholar]
- (53).Meng Y; Pond MP; Roux B Tyrosine Kinase Activation and Conformational Flexibility: Lessons from Src-Family Tyrosine Kinases. Accounts Chem. Res 2017, 50, 1193–1201. [DOI] [PMC free article] [PubMed] [Google Scholar]
- (54).Yang S; Banavali NK; Roux B Mapping the conformational transition in Src activation by cumulating the information from multiple molecular dynamics trajectories. Proc. Natl. Acad. Sci. USA 2009, 106, 3776–3781. [DOI] [PMC free article] [PubMed] [Google Scholar]
- (55).Meng Y; Roux B Locking the Active Conformation of c-Src Kinase through the Phosphorylation of the Activation Loop. J. Mol. Biol 2014, 426, 423–435. [DOI] [PMC free article] [PubMed] [Google Scholar]
- (56).Shukla D; Meng Y; Roux B; Pande VS Activation pathway of Src kinase reveals intermediate states as targets for drug design. Nat. Commun 2014, 5, 3397. [DOI] [PMC free article] [PubMed] [Google Scholar]
- (57).Fajer M; Meng Y; Roux B The Activation of c-Src Tyrosine Kinase: Conformational Transition Pathway and Free Energy Landscape. J. Phys. Chem. B 2017, [DOI] [PMC free article] [PubMed] [Google Scholar]
- (58).McSkimming DI; Rasheed K; Kannan N Classifying kinase conformations using a machine learning approach. BMC Bioinformatics 2017, 18, 86. [DOI] [PMC free article] [PubMed] [Google Scholar]
- (59).Yang J; Campobasso N; Biju MP; Fisher K; Pan XQ; Cottom J; Galbraith S; Ho T; Zhang H; Hong X; Ward P; Hofmann G; Siegfried B; Zappacosta F; Washio Y; Cao P; Qu J; Bertrand S; Wang DY; Head MS; Li H; Moores S; Lai Z; Johanson K; Burton G; Erickson-Miller C; Simpson G; Tummino P; Copeland RA; Oliff A Discovery and characterization of a cell-permeable, small-molecule c-Abl kinase activator that binds to the myristoyl binding site. Chem. Biol 2011, 18, 177–186. [DOI] [PubMed] [Google Scholar]
- (60).Cowan-Jacob SW; Fendrich G; Floersheimer A; Furet P; Liebetanz J; Rummel G; Rheinberger P; Centeleghe M; Fabbro D; Manley PW Structural biology contributions to the discovery of drugs to treat chronic myelogenous leukaemia. Acta Crystallogr. D Biol. Crystallogr 2007, 63, 80–93. [DOI] [PMC free article] [PubMed] [Google Scholar]
- (61).Weisberg E; Manley PW; Breitenstein W; Bruggen J; Cowan-Jacob SW; Ray A; Huntly B; Fabbro D; Fendrich G; Hall-Meyers E; Kung AL; Mestan J; Daley GQ; Callahan L; Catley L; Cavazza C; Azam M; Mohammed A; Neuberg D; Wright RD; Gilliland DG; Griffin JD Characterization of AMN107, a selective inhibitor of native and mutant Bcr-Abl. Cancer Cell 2005, 7, 129–141. [DOI] [PubMed] [Google Scholar]
- (62).Scott DW Multivariate density estimation: theory, practice, and visualization In Handbook of Computational Statistics: Concepts and Methods; Gentle James E., Härdle Wolfgang K., Mori Yuichi; Springer Berlin; Heidelberg, Germany, 2015, pp 549–569.. [Google Scholar]
- (63).Nagar B; Bornmann WG; Pellicena P; Schindler T; Veach DR; Miller WT; Clarkson B; Kuriyan J Crystal Structures of the Kinase Domain of c-Abl in Complex with the Small Molecule Inhibitors PD173955 and Imatinib (STI-571). Cancer Res 2002, 62, 4236–4243. [PubMed] [Google Scholar]
- (64).Sali A Modeling mutations and homologous proteins. Curr. Opin. Biotechnol 1995, 6, 437–451. [DOI] [PubMed] [Google Scholar]
- (65).Betzi S; Alam R; Martin M; Lubbers DJ; Han H; Jakkaraj SR; Georg GI; Schonbrunn E Discovery of a potential allosteric ligand binding site in CDK2. ACS Chem. Biol 2011, 6, 492–501. [DOI] [PMC free article] [PubMed] [Google Scholar]
- (66).Hanson SM; Georghiou G; Thakur MK; Miller WT; Rest JS; Chodera JD; Seeliger MA What Makes a Kinase Promiscuous for Inhibitors? Cell Chem. Biol 2019, 26, 390–399. [DOI] [PMC free article] [PubMed] [Google Scholar]
- (67).Torrie G; Valleau J Nonphysical sampling distributions in Monte Carlo free-energy estimation: Umbrella sampling. J. Comput. Phys 1977, 23, 187–199. [Google Scholar]
- (68).Laio A; Parrinello M Escaping free-energy minima. Proc. Natl. Acad. Sci. USA 2002, 99, 12562–12566. [DOI] [PMC free article] [PubMed] [Google Scholar]
- (69).Wu H; Paul F; Wehmeyer C; Noé F Multiensemble Markov models of molecular thermodynamics and kinetics. Proc. Natl. Acad. Sci. USA 2016, 113, E3221–E3230. [DOI] [PMC free article] [PubMed] [Google Scholar]
- (70).Voter AF Hyperdynamics: Accelerated Molecular Dynamics of Infrequent Events. Phys. Rev. Lett 1997, 78, 3908–3911. [Google Scholar]
- (71).Plattner N; Noé F Protein conformational plasticity and complex ligand-binding kinetics explored by atomistic simulations and Markov models. Nat. Commun 2015, 6, 7653. [DOI] [PMC free article] [PubMed] [Google Scholar]
- (72).Tiwary P; Limongelli V; Salvalaglio M; Parrinello M Kinetics of protein-ligand unbinding: Predicting pathways, rates, and rate-limiting steps. Proc. Natl. Acad. Sci. USA 2015, 112, E386–E391. [DOI] [PMC free article] [PubMed] [Google Scholar]
- (73).Paul F; Wehmeyer C; Abualrous ET; Wu H; Crabtree MD; Schöneberg J; Clarke J; Freund C; Weikl TR; Noé F Protein-peptide association kinetics beyond the seconds timescale from atomistic simulations. Nat. Commun 2017, 8, 1095. [DOI] [PMC free article] [PubMed] [Google Scholar]
- (74).Votapka LW; Jagger BR; Heyneman AL; Amaro RE SEEKR: Simulation Enabled Estimation of Kinetic Rates, A Computational Tool to Estimate Molecular Kinetics and Its Application to Trypsin-Benzamidine Binding. J. Phys. Chem. B 2017, 121, 3597–3606. [DOI] [PMC free article] [PubMed] [Google Scholar]
- (75).Dickson A; Lotz SD Multiple Ligand Unbinding Pathways and Ligand-Induced Destabilization Revealed by WExplore. Bio-phys. J 2017, 112, 620–629. [DOI] [PMC free article] [PubMed] [Google Scholar]
- (76).Gill SC; Lim NM; Grinaway PB; Rustenburg AS; Fass J; Ross GA; Chodera JD; Mobley DL Binding Modes of Ligands Using Enhanced Sampling (BLUES): Rapid Decorrelation of Ligand Binding Modes via Nonequilibrium Candidate Monte Carlo. J. Phys. Chem. B 2018, 122, 5579–5598. [DOI] [PMC free article] [PubMed] [Google Scholar]
- (77).Bernetti M; Masetti M; Recanatini M; Amaro RE; Cavalli A An Integrated Markov State Model and Path Metadynamics Approach To Characterize Drug Binding Processes. J. Chem. Theory Comput 2019, 15, 5689–5702. [DOI] [PubMed] [Google Scholar]
Associated Data
This section collects any data citations, data availability statements, or supplementary materials included in this article.