Abstract
Surface-enhanced Raman spectroscopy (SERS) is a sensitive, chemically specific, and short-time response probing method with significant potential in biomedical sensing. This paper reports the integration of SERS with microneedle arrays as a minimally invasive platform for chemical sensing, with a particular view toward sensing in interstitial fluid (ISF). Microneedle arrays were fabricated from a commercial polymeric adhesive and coated with plasmonically active gold nanorods that were functionalized with the pH-sensitive molecule 4-mercaptobenzoic acid. This sensor can quantitate pH over a range of 5 to 9 and can detect pH levels in an agar gel skin phantom and in human skin in situ. The sensor array is stable and mechanically robust in that it exhibits no loss in SERS activity after multiple punches through an agar gel skin phantom and human skin or after a month-long incubation in phosphate-buffered saline. This work is the first to integrate SERS-active nanoparticles with polymeric microneedle arrays and to demonstrate in situ sensing with this platform.
Keywords: Plasmonic microneedle arrays, SERS, pH in situ sensing, agar gel skin phantom, human skin
Graphical Abstract
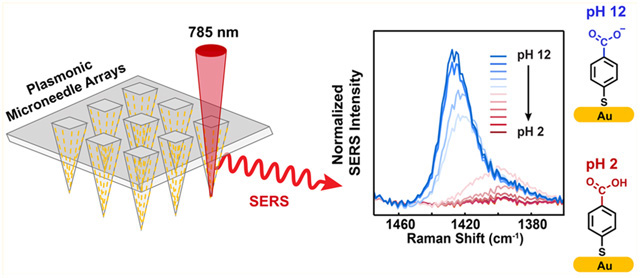
Surface-enhanced Raman spectroscopy (SERS) is a well-established analytical technique that can quantitate analytes with high sensitivity, even down to the single molecule level in special cases.1,2 In addition to its sensitivity, SERS is rapid and provides structural information on analytes, which is a significant benefit in reducing false positive measurements. Advances in fabricating highly enhanced SERS substrates have enabled Raman scattering enhancement factors of up to 108 relative to normal Raman,3,4 leading to its application in both fundamental studies and in a variety of applied studies, including catalysis,5 electrochemistry,6 art conservation,7 and in vivo biosensing.8 SERS for biomedical applications is an area of interest, particularly for continuous glucose monitoring due to its short-time response, but one impediment to such an application has been the difficulty of integrating plasmonically enhancing substrates with living tissue, in part because implanted sensors undergo biofouling and lose activity,9,10 and because the implantation is invasive. Important prior work to detect analytes of interest with SERS in a minimally biofouling or invasive way has utilized a polymeric film,11 microcapsules,12 and metalized13,14 and paper-based plasmonic microneedles.15 In the present work, we describe an approach to minimize invasive SERS devices for biomedical applications by integrating plasmonically enhanced nanoparticles (gold nanorods) for SERS with a polymeric microneedle array. We demonstrate the effectiveness of the plasmonic microneedle array by modifying the gold nanorods with the pH-sensitive molecule 4-mercaptobenzoic acid (4-MBA) and measuring the pH of solutions, the pH in an agar gel skin phantom, and the pH in human skin.
Microneedle arrays supported on a flexible substrate have been developed for minimally invasive biomedical applications,16,17 including transdermal drug and vaccine delivery16,18–20 and extraction of biofluids such as interstitial fluid (ISF) or blood through the skin.21–24 Microneedle sensors have also been used to measure biologically relevant analytes in the ISF, including glucose,25,26 pH,26 lactate,26,27 glutamate,28 nerve agents,29 and alcohol30 using enzyme-based electrochemical methods. ISF biomarker monitoring using microneedle arrays and SERS would circumvent potential problems to the standard electrochemical techniques (e.g., enzyme degradation31 or instability32). In addition to biological analytes in the ISF, the pH of ISF is also important. ISF pH is critical in sustaining homeostasis and normal bodily functions.33 Compared to the blood pH that is strictly controlled in the normal range (pH 7.35–7.45), the ISF pH can deviate from the normal range (pH 6.60–7.60) due to fewer pH-buffering molecules than in blood.33,34 Deviation from the normal pH range in ISF has been suggested as a biomarker for skin cancers, diabetes mellitus, and other diseases.33,35–38 Thus, in this work we describe an in situ pH sensor, both as a demonstration of the SERS activity of the microneedle array platform and because pH is important in diagnostic applications.
A schematic representation of the plasmonic microneedle array and pH sensing with 4-MBA is shown in Figure 1. The microneedle arrays are prepared from Norland Optical Adhesive (NOA) 65 (Figure 2). This polymer consists of mercaptoester functional group, which we hypothesize that it allows us to functionalize AuNRs on the polymer surface and is also transparent at 785 nm, therefore enabling the collection of the SERS signal through the microneedle array and permitting in situ sensing. In addition, biocompatibility of various NOAs has been demonstrated; NOA patterns have been used as a cell culture scaffold for endothelial cells,39 fibroblasts,40 HeLa cells and neurons,41 and human embryonic stem cells42 without any adverse effects. The polymer was cured inside a PDMS mold with 10 min of 365 nm exposure to produce a microneedle array having a size of approximately 1 cm2 and with pyramidal microneedles each 300 μm × 200 μm (height × width) with a tip-to-tip spacing of 500 μm (Figure 3). The Supporting Information describes the fabrication in detail.
Figure 1.
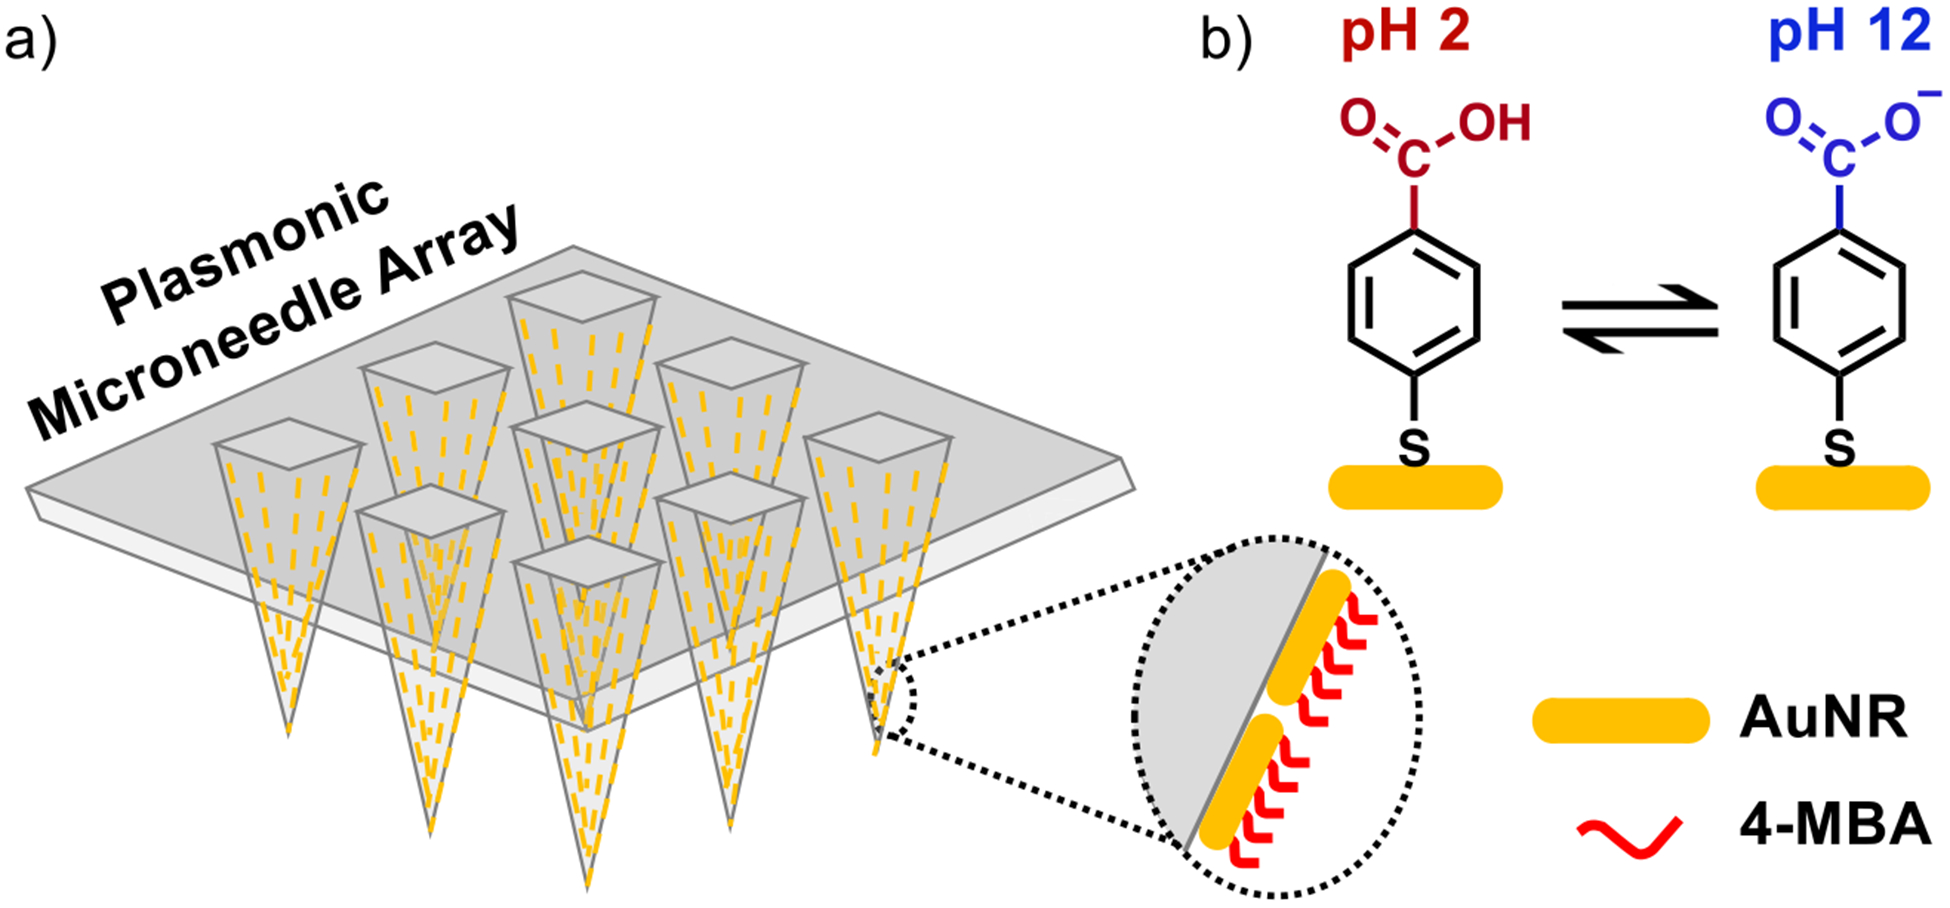
Schematic representation of plasmonic microneedle array. (a) Array of polymer microneedles that are coated with gold nanorods (AuNRs) that are further functionalized with 4-MBA. This molecule is deprotonated at high pH and the intensity of the carboxylate vibrational mode in SERS can be correlated with the pH of the sensing environment. (b) The pH-sensitive molecule 4-MBA can be protonated at an acidic pH (pH 2) and deprotonated at a basic pH (pH 12).
Figure 2.
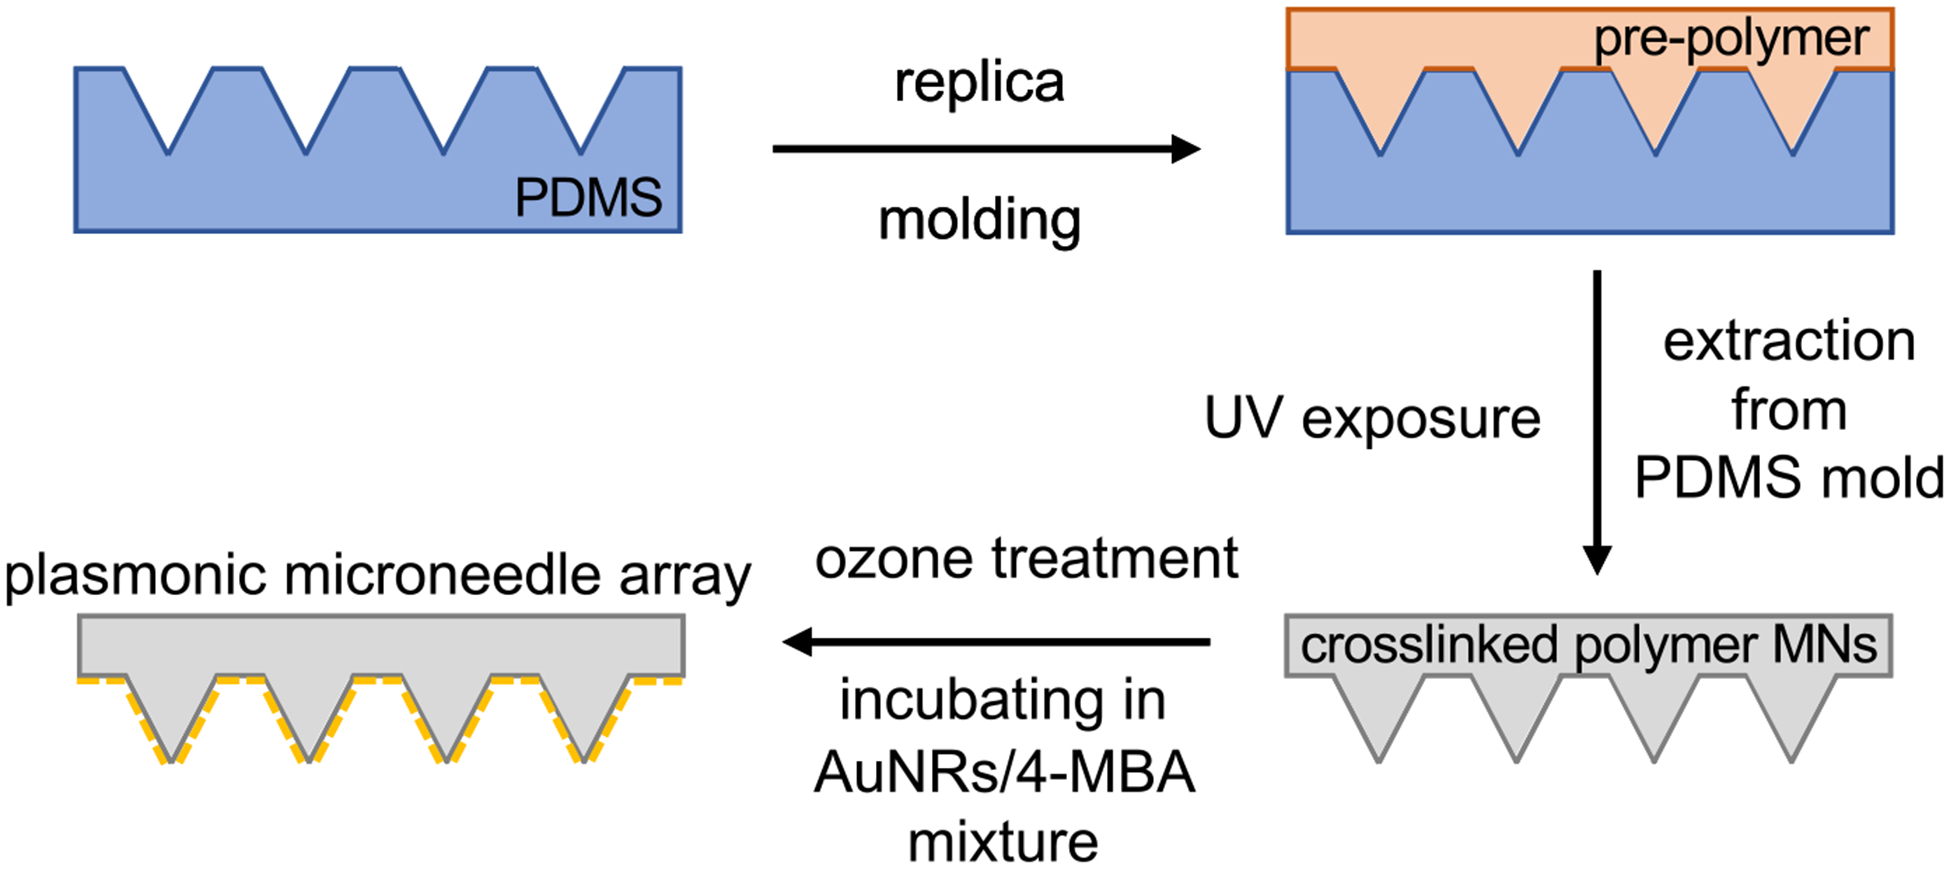
Schematic for the fabrication of the plasmonic microneedle array. A commercial PDMS mold (blue) is filled with the NOA prepolymer (orange) and cured with UV exposure (365 nm) to give the polymer microneedle array (gray). Following ozone treatment, the AuNRs (yellow) were deposited onto the surface of the array in the presence of the Raman reporter molecule 4-MBA resulting in situ AuNRs aggregation and formation of a self-assembled monolayer of 4-MBA on the AuNRs.
Figure 3.
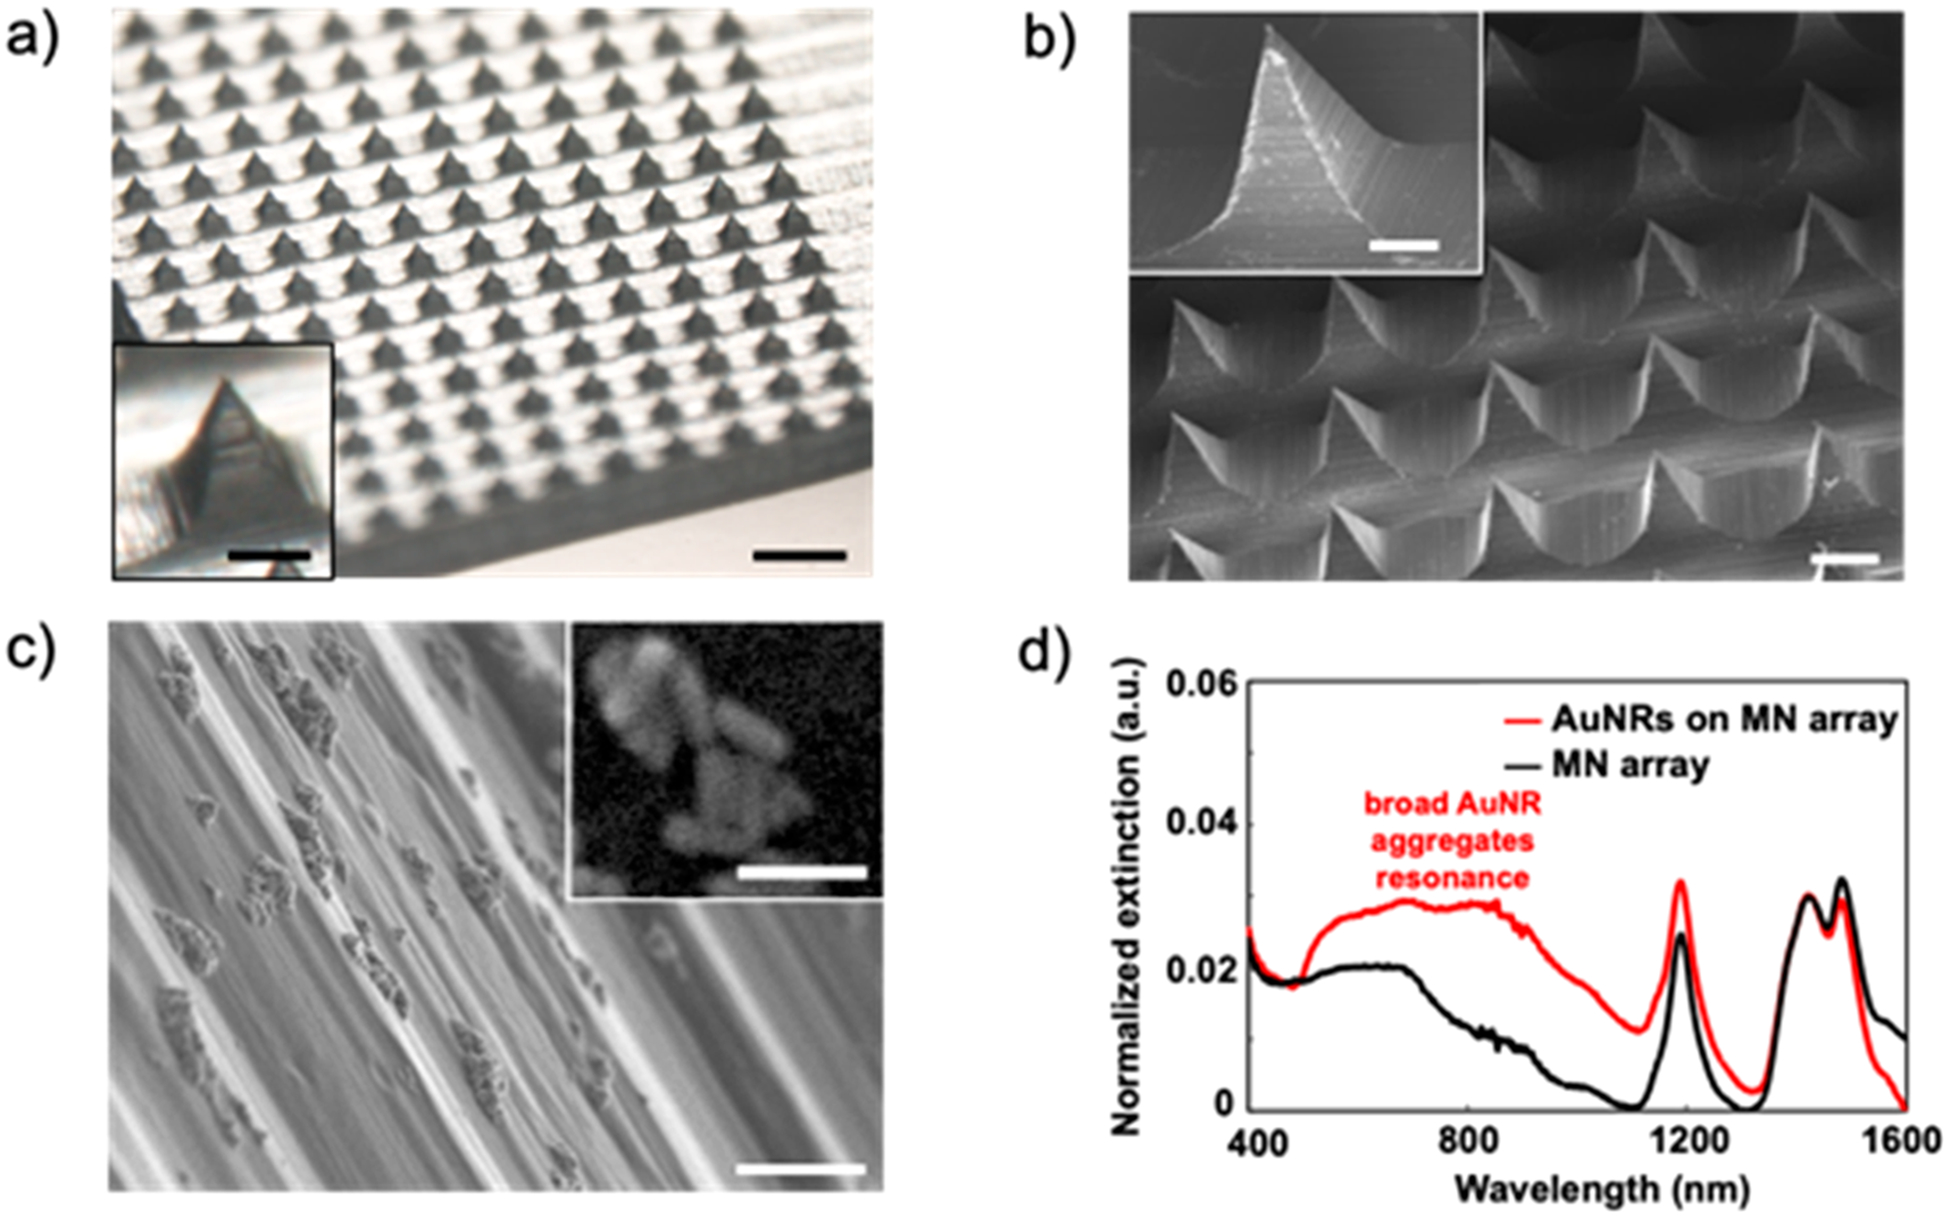
Imaging and optical characterization of plasmonic microneedle array. (a) Optical image of the microneedle array (scale bars are 500 and 100 μm (inset)), (b) scanning electron micrograph of the microneedle array (scale bars are 200 and 100 μm (inset)), (c) scanning electron micrograph of AuNR aggregates on the side of a microneedle tip (1 μm scale bar) with contrast-adjusted scanning electron micrograph of an individual aggregate (inset, 100 nm scale bar), (d) light extinction spectra of microneedle (MN) array with (red trace) and without (black trace) AuNRs.
Gold nanorods (AuNRs) were synthesized using the silver-assisted seed-mediated method and stabilized with cetyltrimethylammonium bromide (CTAB).43–45 We selected AuNRs with transverse and longitudinal dimensions of 15 and 55 nm, respectively, because particles of this size have a plasmon resonance at 785 nm (based on the UV–vis extinction spectrum shown in Figure S1) and the Raman scattering enhancement is highest when the excitation wavelength overlaps with the extinction maximum of the plasmonic material.
We first treated the microneedle array with ozone, which both sterilizes the surface and promotes attachment of the AuNRs to the surface of the microneedles.46,47 The microneedle array was then incubated for 24 h in a solution composed of 40 μL of aqueous AuNRs (2 × 10¹³ particles/mL) and 1 mL of 10 mM 4-MBA (in 1:1 ethanol/water) that was premixed immediately prior to incubation. As the 4-MBA binds to the AuNRs through Au–thiolate bond formations, the AuNRs aggregate and deposit onto the surface of the microneedle array (Figure 2). 4-MBA functions as a Raman reporter molecule for pH because its carboxylate vibrational mode shifts between 1400 and 1425 cm−1 depending on the protonation state, which can be detected by SERS and the integrated intensity of that mode provides a measure (when calibrated) for the pH of the sensing environment.48 We used this plasmonic microneedle array to measure the pH of solutions and an agar gel skin phantom, as well as to demonstrate suitable thermal and mechanical stability of the platform. The attachment of the AuNRs onto the surface of the microneedles was confirmed by optical microscopy, scanning electron microscopy (SEM), and UV–vis extinction spectroscopy (Figure 3). The extinction spectrum of the microneedle array with AuNRs shows a broad peak centered around 780 nm that represents the AuNR aggregates on the microneedle surface (Figure 3d).
We first calibrated the sensors for pH measurements by collecting SER spectra (Figure 4a,b) from three replicate 4-MBA plasmonic microneedle array sensors in Britton-Robinson buffer solutions (pH 2–12) and averaging the spectra to produce a measure of precision (Figure 4c). Britton-Robinson buffer was chosen to generate a calibration curve in the range between pH 2 to 12 with 1 pH unit increments. The weak background of NOA 65 was subtracted from all 4-MBA SER spectra (see Materials and Methods in the Supporting Information for details). The carboxylate stretching mode whose Raman peak is centered between 1400 and 1425 cm−1 increases in intensity and blue shifts (from 1400 to 1425 cm−1) (Figure 4b) with increasing pH of the buffer. To control for overall intensity variations, we took the ratio between the integrated peak intensity of the carboxylate peak (Acbx) as it shifts between 1400 and 1425 cm−1 and a mode at 1076 cm−1 (A1076) that is not responsive to pH (Acbx/A1076). We then normalized this ratio by the maximum ratio (normalized Acbx/A1076). A plot of this normalized ratio versus pH gave the expected S-shaped calibration curve and revealed that the working pH region (or the linear region) is in the pH range of 5 to 9 (Figure 4c). We therefore determined a second calibration curve in this range but with smaller (0.2) pH increments to characterize the resolution of the sensor (Figure 4d). The resolution of the pH sensor is represented as twice the standard deviation at pH 7 (the middle of the curve), which in this case is 0.23 pH units.48
Figure 4.
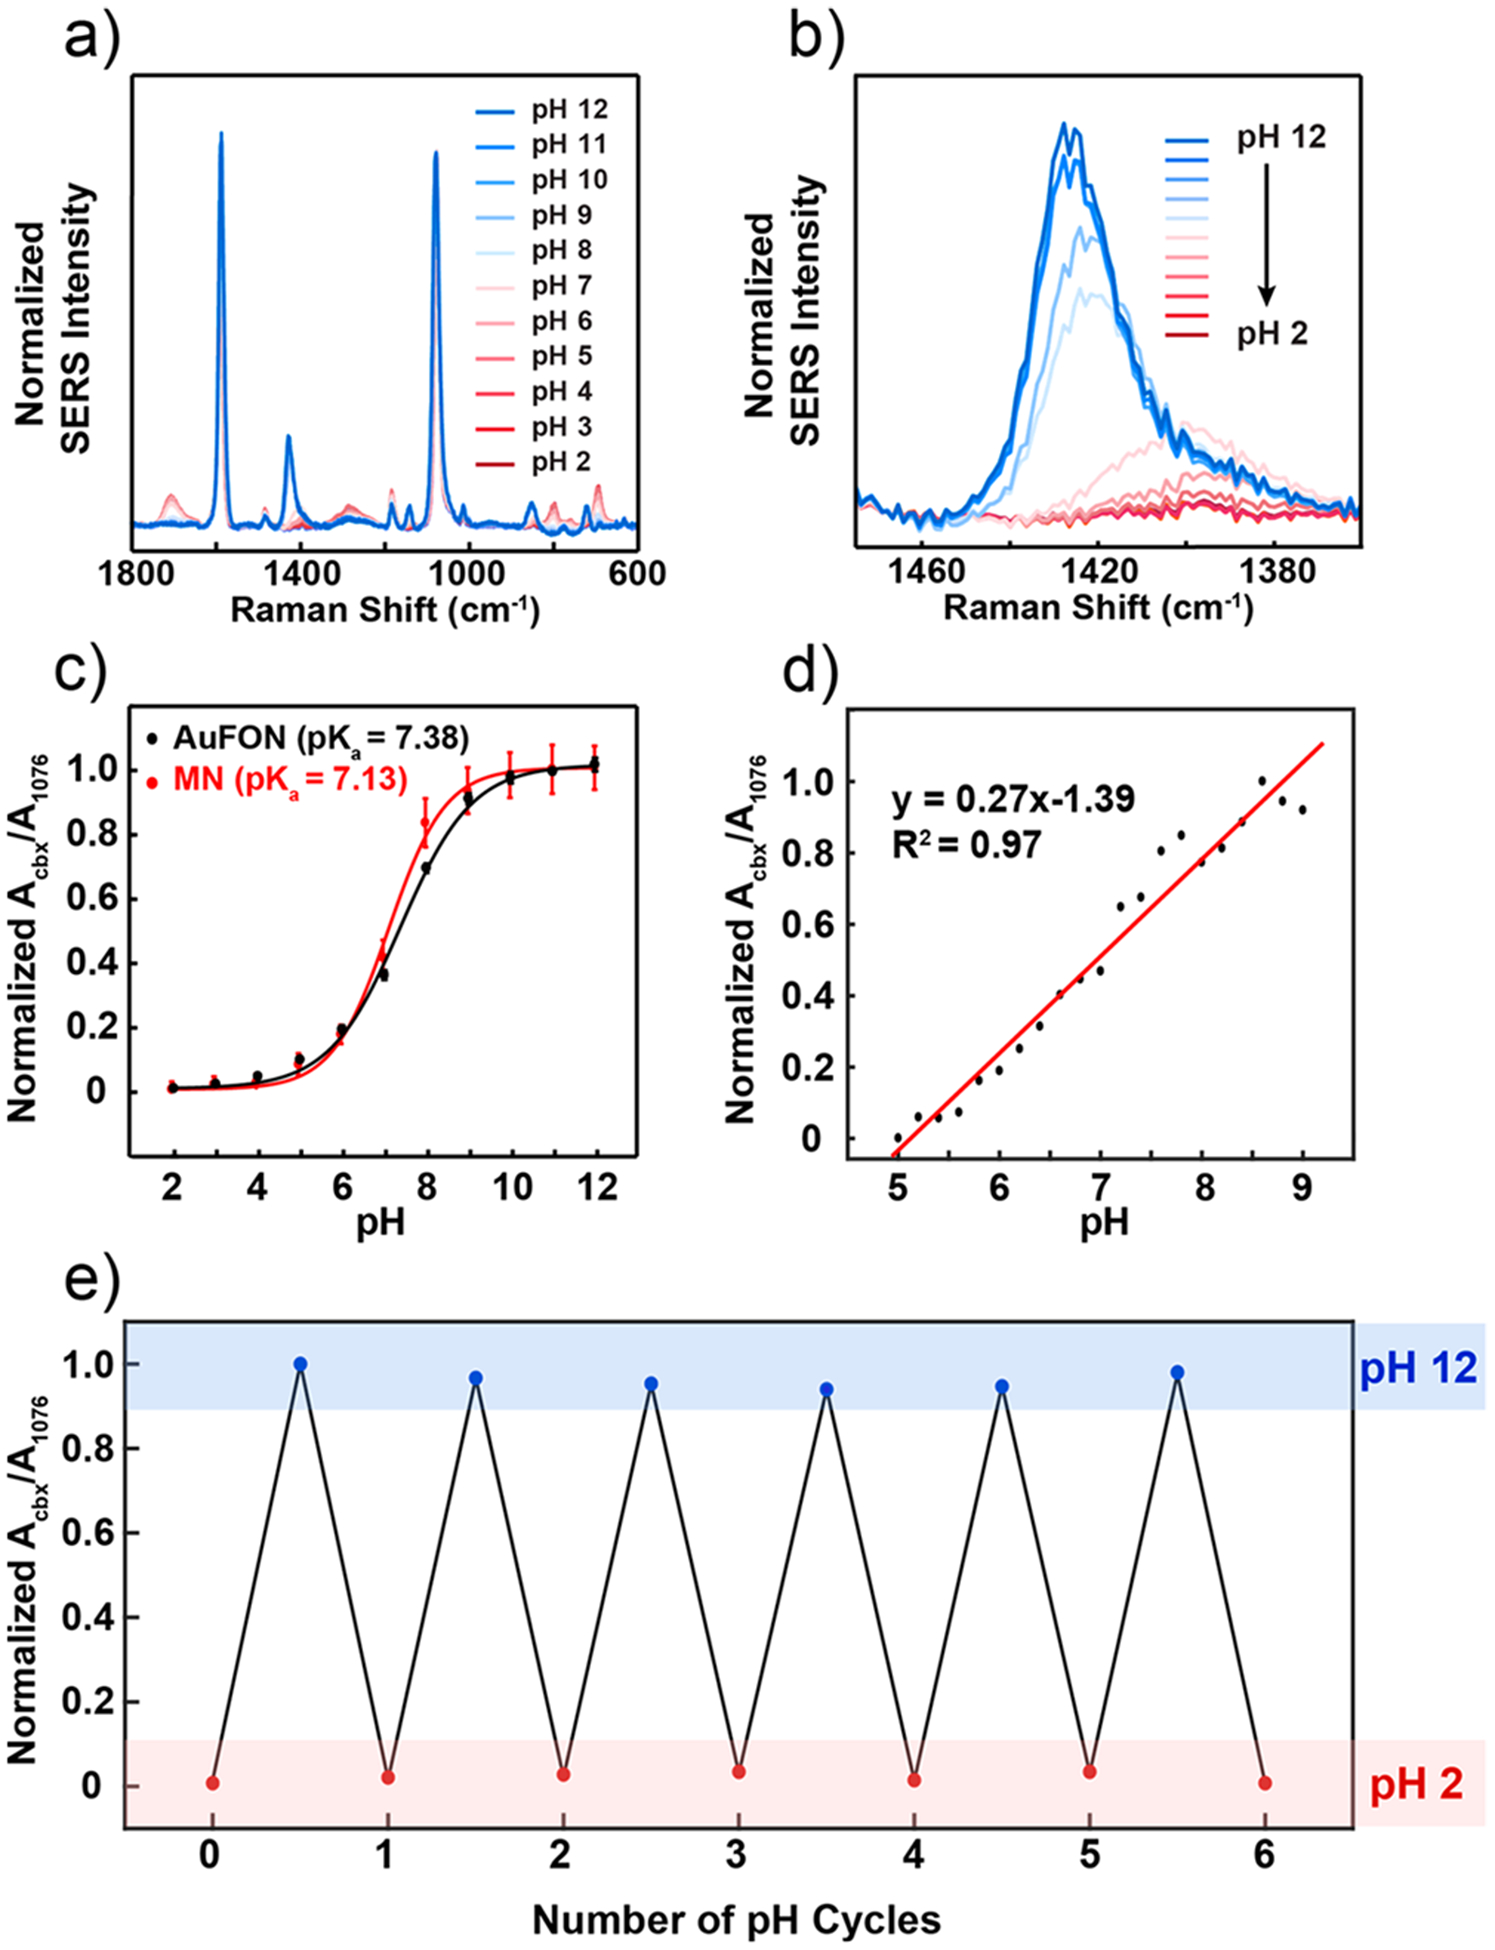
SERS activity of the plasmonic microneedle array. (a) SER spectra of 4-MBA on the plasmonic microneedle array in Britton-Robinson buffers (pH 2–12) with 1 pH unit increments. (b) Magnified spectra centered around the pH-sensitive 1400 cm−1 peak. For each pH level, seven spectra were collected from separate microneedle tips and averaged. (c) Calibration curve for the plasmonic microneedle array (MN, red trace) and for a standard SERS substrate (AuFON, black trace) over the entire pH 2–12 range. Error bars represent standard deviation. For MNs, seven spectra per pH increment were collected and averaged from three different samples (n = 3). For the AuFON, five spectra were collected from different spots across one sample per pH increment (n = 5). The parameters for the SER collection were λex = 785 nm, tacq = 1 min, Pex = 1 mW for MNs, and λex = 785 nm, tacq = 1 min, Pex = 270 μW for AuFON. (d) Calibration curve for the linear response range (pH 5–9) for the plasmonic microneedle array collected with 0.2 pH unit increment. (e) Cycling the pH (pH 2–12) of the plasmonic microneedle array environment demonstrating the reversibility of the sensor (six cycles).
We also compared data from our new microneedle sensing platform with a well-known SERS substrate, Au film-over-nanospheres (AuFON), with the LSPR appropriate for 785 nm excitation wavelength in water (Figure S2).49 We found a small difference in apparent pKa value of 4-MBA on the two substrates and we attribute this small change to differences in the density of 4-MBA on the two surfaces. The pKa value of 4-MBA in solution (4.8) is known to differ from that on a monolayer (7.7) because of electrostatic destabilization of the carboxylates.50 For the plasmonic microneedle array, we find the pKa value of 4-MBA is 7.13 (Figure S3). The pKa of 4-MBA on the AuFON is 7.38, which suggests that the density of 4-MBA is slightly lower on AuNR aggregates than on the AuFON. What this indicates is that the two platforms are comparable and function over similar pH ranges.
We next demonstrated that the sensor has the properties required for in situ sensing by measuring the pH inside a skin phantom agar gel. A SER spectrum of the plasmonic microneedle array was collected in air (Figure 5a, black trace) as a baseline before punching the microneedle arrays into an agar gel skin phantom. The plasmonic microneedle array was punctured into the agar gel skin phantom by pressing the gel onto the microneedle arrays by hand and SER spectra were collected through the microneedle array while it was in the skin phantom. The carboxylate peak at 1400 cm−1 (Figure 5a, black trace) increases in intensity and shifts to 1421 cm−1 when the microneedles are in the agar gel (Figure 5a, blue trace). The sensor was then taken out of the skin phantom and the SERS was measured again after rinsing it with water (Figure 5a, red trace). The resulting SER spectra before and after penetrating the agar gel were the same, showing the reversibility of the sensor. The mechanical robustness of the sensor was demonstrated by puncturing an agar gel skin phantom 10 times and observing that the SERS activity of the sensor was unchanged by the repeated puncturing (Figure 5b). To more robustly demonstrate the reversibility of the pH sensing, we collected SER spectra of the microneedle sensor after cycling the pH of the buffer solution between pH 2 to 12 and found that no signal loss occurred after six cycles (Figure 4e).
Figure 5.
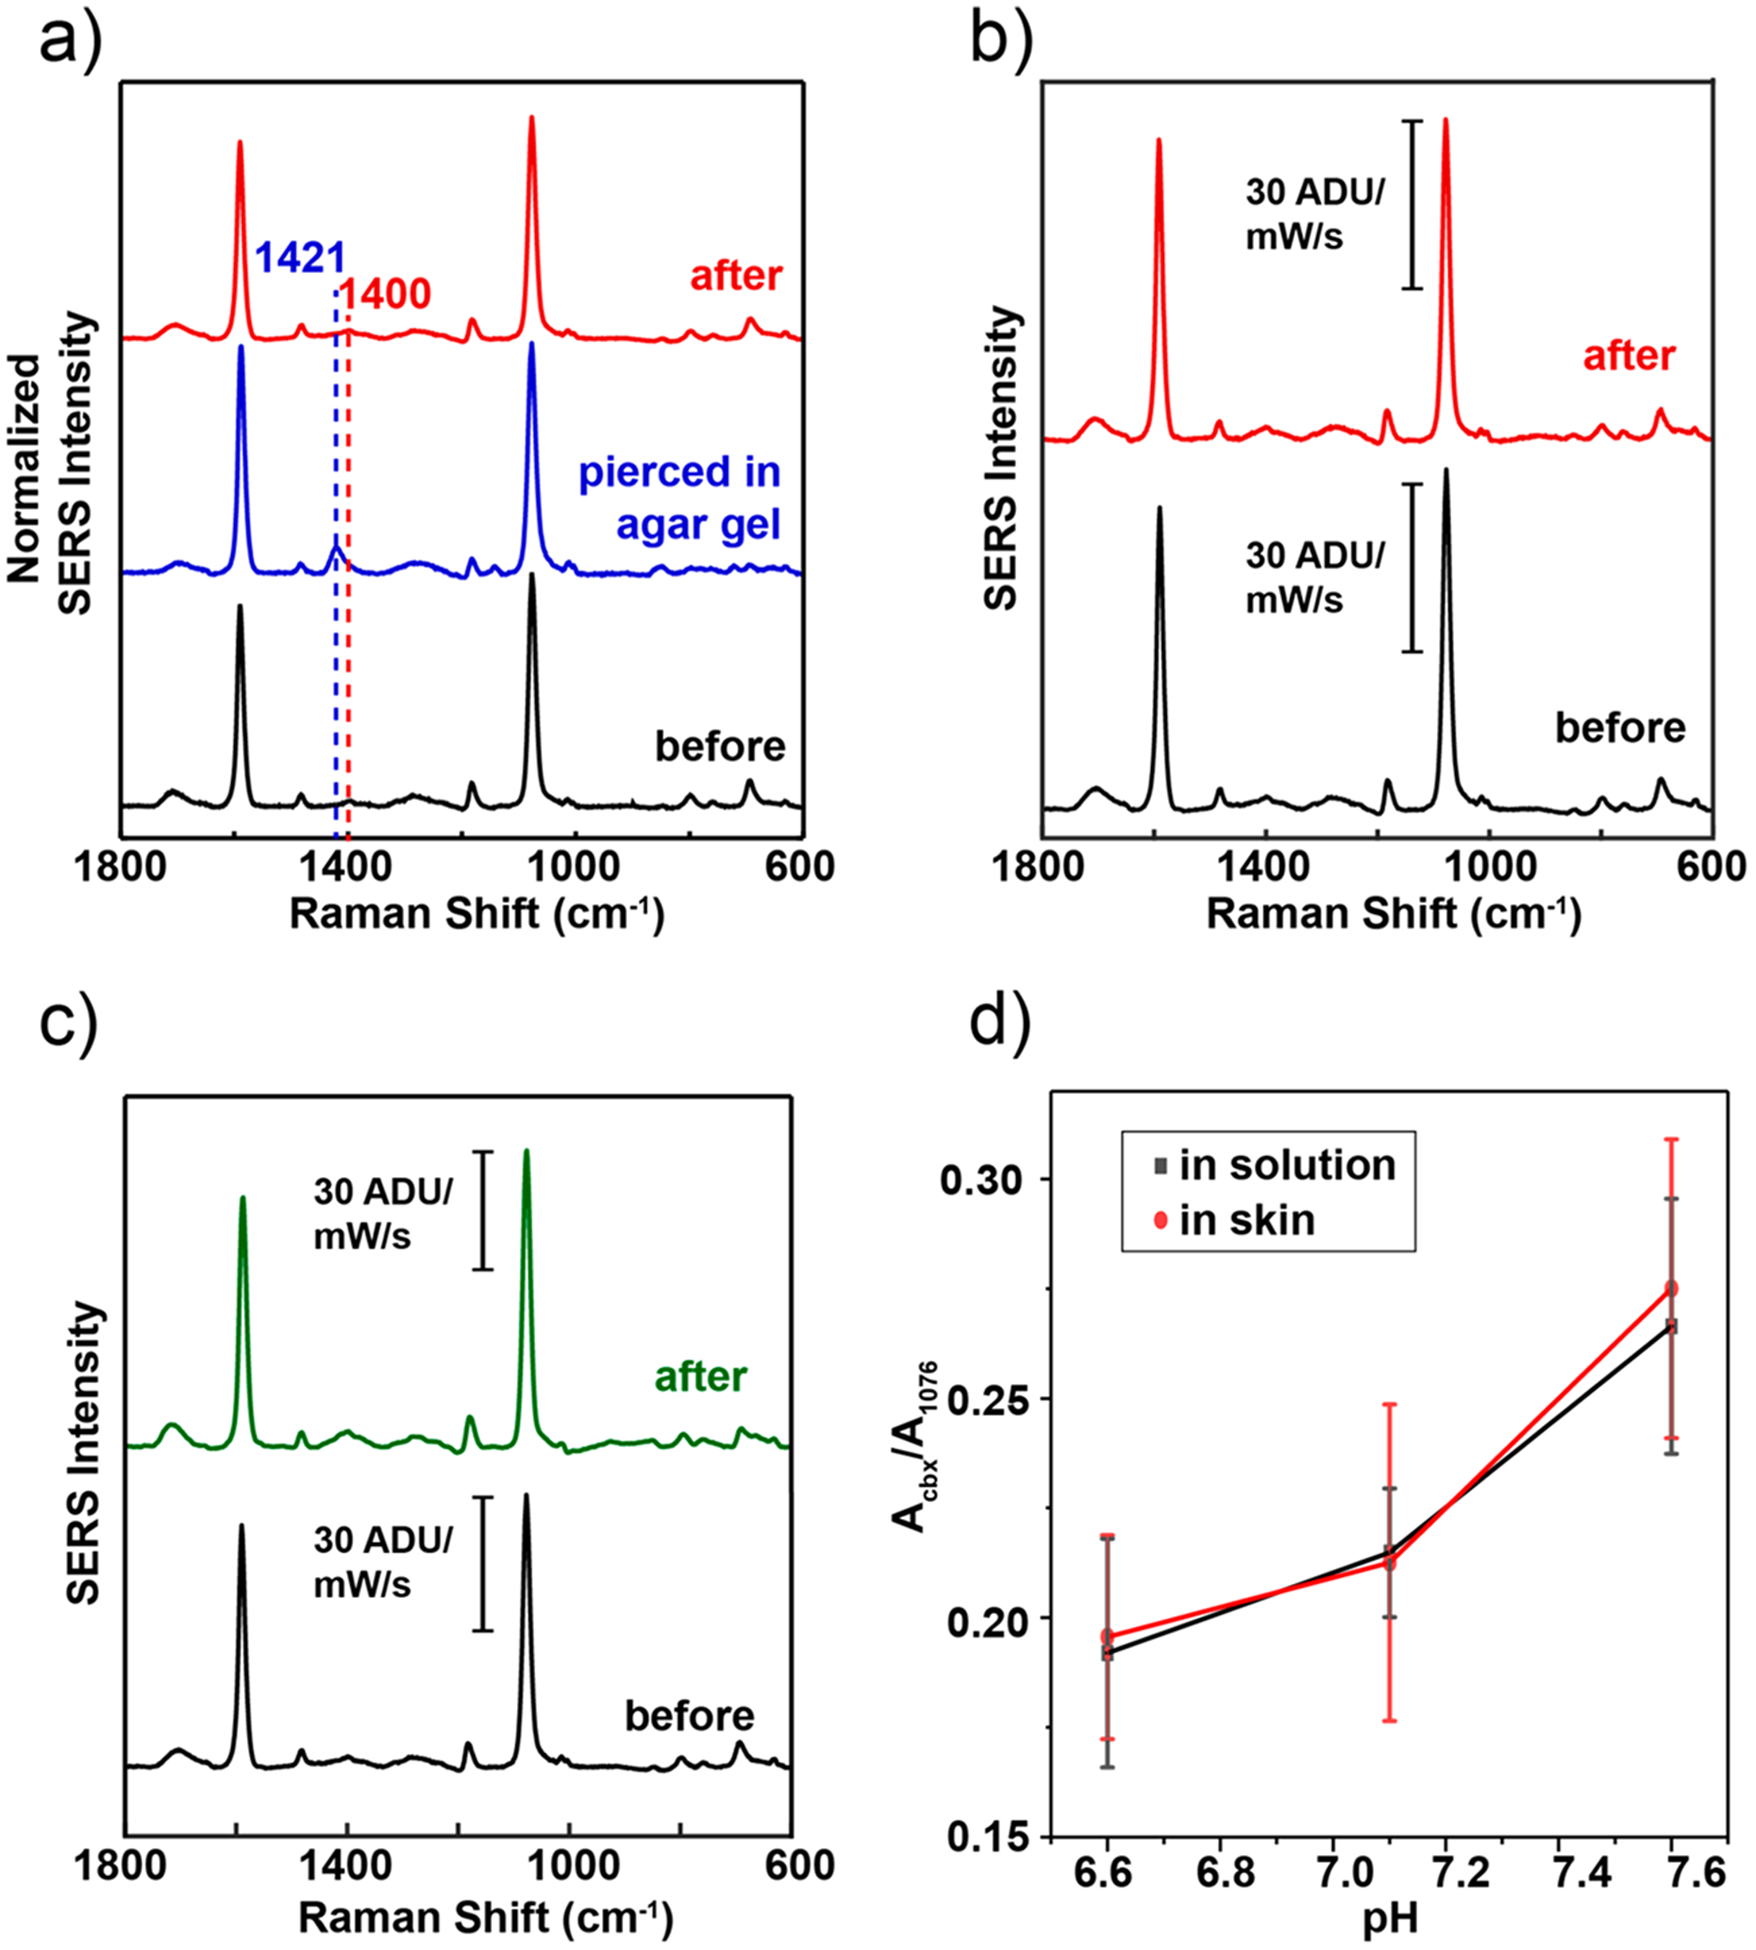
Mechanical and thermal stability of plasmonic microneedle arrays. (a) SER spectra of 4-MBA on a plasmonic microneedle array before puncturing an agar gel skin phantom (black trace), while punctured (blue trace), and after puncturing (red trace). (b) SER spectra of 4-MBA on a plasmonic microneedle array before (black trace) and after (red trace) 10 punches into an agar gel skin phantom. (c) SER spectra of 4-MBA on a plasmonic microneedle array immediately after fabrication (black trace) and on a separate plasmonic microneedle array that was incubated for one month in 1× PBS (green trace). (d) Comparison plot of Acbx/A1076 of MN array with AuNRs functionalized with 4-MBA inserted in human skin versus in DPBS solutions with pH 6.6, 7.1, and 7.6. Each point is an average of seven different microneedle tips, the error bars are the standard deviation at each pH, and the measurements were done by focusing the laser through the polymer and on the tips. The parameters for the SERS data acquisitions were λex = 785 nm, 20× ELWD objective, tacq = 1 min, Pex = 1 mW.
The stability of the sensor was then tested by incubating a microneedle array in phosphate-buffered saline for one month. As shown in Figure 5c, the SERS activity was unchanged by the incubation as compared to a freshly prepared microneedle array. Additionally, the extinction spectrum of the microneedle sensor was taken every week during the month-long incubation to observe the presence of AuNR aggregates. As shown in Figure S6, the AuNR aggregates, represented by a broad peak around 780 nm, are still present on the microneedle array surface as of the final week.
To translate this study to ex vivo sensing, we applied the plasmonic microneedle array sensor to human skin (details in the Supporting Information). We determined the penetration depth of the microneedle array in skin using optical coherence tomography (OCT) and the sensor’s ability to measure pH in situ by SERS. Compared with the flat region of the array as a control, the region with microneedles shows that microneedles can be placed in skin (Figure S7). Next, to change and measure the skin pH in the range between pH 6.6 and 7.6 (ISF pH) we incubated human skin in Dulbecco’s phosphate-buffered saline (DPBS) with pH 6.6, 7.1, and 7.6 for 12 h while replacing the buffer solution every 2 h. As shown in Figure S8, the incubation was performed in a Petri dish while the tissue floated on a metal mesh boat so that the dermal side is in contact with the buffer solution and the top part (the stratum corneum) remains dry. After incubation, we dried the bottom of the skin with clean lab tissue paper and inserted a microneedle array in the skin. We then acquired SERS while the laser was focused through the polymer and onto the tips, as with the agar gel skin phantom. As controls, SER spectra of a microneedle array sensor was taken in the DPBS buffer solution in which the human skin was incubated. As shown in Figure 5d, compared to the controls, the Acbx/A1076 corresponds well with the measurement from the skin. We then characterized the microneedle array sensor after puncturing human skin using UV–vis, SERS, and SEM. The SERS signal (Figure S9a) was stable and light extinction spectra (Figure S9b) showed AuNR aggregates present after puncturing human skin (with pH 6.6, 7.1, and 7.6). SEM images of microneedle arrays after insertion in human skin showed that the microneedles were still intact with AuNR aggregates present on the surface (Figure S10). Lastly, to test the mechanical stability of the sensor, the microneedle sensor was applied to human skin tissue repeatedly (10 punches). The SER spectra before and after 10 punches showed no loss of 4-MBA signal (Figure S11).
From the ex vivo study, we demonstrated the sensing ability and the mechanical robustness of the plasmonic microneedle arrays after insertion in skin. The next step is to investigate the toxicity and the lifetime of the sensor after a long period in skin. In order to do so, in vivo studies should be performed. Our studies have not characterized the long-term stability and performance of the sensor arrays in animal models, and we are not able to comment on the stability of the sensor to biofouling and any toxicity.
In conclusion, we report the design and fabrication of a plasmonic microneedle array SERS sensor and demonstrate its SERS activity to measure different pH levels in solutions, in an agar gel skin phantom, and in human skin. Measurement of pH with this sensor was both reversible and reproducible. The use of surface chemistries that provide reports of other molecular analytes, together with the mechanical and optical properties of the microneedle array, offer a strategy for sensing a variety of relevant analytes in interstitial fluids.
Supplementary Material
ACKNOWLEDGMENTS
The authors thank Ian Rubinoff and Pengxiao Hao with their support with OCT, Tirzah Abbott with her help with SEM, Eric J. Berns, Vitor Brasiliense, and Gyeongwon Kang for helpful discussions, and Shuangni Yang for her help with the experiments on human skin. We thank the Skin Tissue Engineering Core Facility in Feinberg school of Medicine at Northwestern University for providing us with human skin tissues. This work was supported by the Assistant Secretary of Defense for Health Affairs, through the Peer Reviewed Medical Research Program under Award No. W81XWH-16-1-0375. E.V.E. acknowledges support from the National Science Foundation Graduate Research Fellowship Program (DGE-1324585).
Footnotes
The authors declare no competing financial interest.
Supporting Information
The Supporting Information is available free of charge on the ACS Publications website at DOI: 10.1021/acs.nanolett.9b02070.
Experimental section with chemicals and materials, instrumentation, detailed information regarding the plasmonic microneedle arrays and Au film-over-nano-spheres fabrication and characterization, gold nanorod synthesis and characterization, experimental procedures, data acquisition and analysis, and additional experimental results (Figures S1–S11) (PDF)
REFERENCES
- (1).Nie S; Emory SR Probing Single Molecules and Single Nanoparticles by Surface-Enhanced Raman Scattering. Science 1997, 275, 1102–1106. [DOI] [PubMed] [Google Scholar]
- (2).Camden JP; Dieringer JA; Wang Y; Masiello DJ; Marks LD; Schatz GC; Van Duyne RP Probing the Structure of Single-Molecule Surface-Enhanced Raman Scattering Hot Spots. J. Am. Chem. Soc 2008, 130 (38), 12616–12617. [DOI] [PubMed] [Google Scholar]
- (3).Willets KA; Van Duyne RP Localized Surface Plasmon Resonance Spectroscopy and Sensing. Annu. Rev. Phys. Chem 2007, 58, 267–297. [DOI] [PubMed] [Google Scholar]
- (4).Anker JN; Hall WP; Lyandres O; Shah NC; Zhao J; Van Duyne RP Biosensing with Plasmonic Nanosensors. Nat. Mater 2008, 7, 442–453. [DOI] [PubMed] [Google Scholar]
- (5).Heck KN; Janesko BG; Scuseria GE; Halas NJ; Wong MS Observing Metal-Catalyzed Chemical Reactions in Situ Using Surface-Enhanced Raman Spectroscopy on Pd-Au Nanoshells. J. Am. Chem. Soc 2008, 130, 16592–16600. [DOI] [PMC free article] [PubMed] [Google Scholar]
- (6).Zaleski S; Clark KA; Smith MM; Eilert JY; Doty M; Van Duyne RP Identification and Quantification of Intravenous Therapy Drugs Using Normal Raman Spectroscopy and Electrochemical Surface-Enhanced Raman Spectroscopy. Anal. Chem 2017, 89 (4), 2497–2504. [DOI] [PubMed] [Google Scholar]
- (7).Roh JY; Matecki MK; Svoboda SA; Wustholz KL Identifying Pigment Mixtures in Art Using SERS: A Treatment Flowchart Approach. Anal. Chem 2016, 88 (4), 2028–2032. [DOI] [PubMed] [Google Scholar]
- (8).Ma K; Yuen JM; Shah NC; Walsh JT; Glucksberg MR; Van Duyne RP In Vivo, Transcutaneous Glucose Sensing Using Surface-Enhanced Spatially Offset Raman Spectroscopy: Multiple Rats, Improved Hypoglycemic Accuracy, Low Incident Power, and Continuous Monitoring for Greater than 17 Days. Anal. Chem 2011, 83 (23), 9146–9152. [DOI] [PMC free article] [PubMed] [Google Scholar]
- (9).Yun YH; Eteshola E; Bhattacharya A; Dong Z; Shim JS; Conforti L; Kim D; Schulz MJ; Ahn CH; Watts N Tiny Medicine: Nanomaterial-Based Biosensors. Sensors 2009, 9 (11), 9275–9299. [DOI] [PMC free article] [PubMed] [Google Scholar]
- (10).Walkey CD; Chan WCW Understanding and Controlling the Interaction of Nanomaterials with Proteins in a Physiological Environment. Chem. Soc. Rev 2012, 41 (7), 2780–2799. [DOI] [PubMed] [Google Scholar]
- (11).Lee WWY; McCoy CP; Donnelly RF; Bell SEJ Swellable Polymer Films Containing Au Nanoparticles for Point-of-Care Therapeutic Drug Monitoring Using Surface-Enhanced Raman Spectroscopy. Anal. Chim. Acta 2016, 912, 111–116. [DOI] [PubMed] [Google Scholar]
- (12).You Y-H; Biswas A; Nagaraja AT; Hwang J-H; Coté GL; McShane MJ Multidomain-Based Responsive Materials with Dual-Mode Optical Readouts. ACS Appl. Mater. Interfaces 2019, 11, 14286–14295. [DOI] [PubMed] [Google Scholar]
- (13).Yuen C; Liu Q Towards in Vivo Intradermal Surface Enhanced Raman Scattering (SERS) Measurements: Silver Coated Microneedle Based SERS Probe. J. Biophotonics 2014, 7 (9), 683–689. [DOI] [PubMed] [Google Scholar]
- (14).Yuen C; Liu Q Hollow Agarose Microneedle with Silver Coating for Intradermal Surface-Enhanced Raman Measurements: A Skin-Mimicking Phantom Study. J. Biomed. Opt 2015, 20 (6), 061102. [DOI] [PubMed] [Google Scholar]
- (15).Kolluru C; Gupta R; Jiang Q; Williams M; Gholami Derami H; Cao S; Noel RK; Singamaneni S; Prausnitz MR Plasmonic Paper Microneedle Patch for On-Patch Detection of Molecules in Dermal Interstitial Fluid. ACS Sensors 2019, 4 (6), 1569–1576. [DOI] [PMC free article] [PubMed] [Google Scholar]
- (16).Wang M; Hu L; Xu C Recent Advances in the Design of Polymeric Microneedles for Transdermal Drug Delivery and Biosensing. Lab Chip 2017, 17 (8), 1373–1387. [DOI] [PubMed] [Google Scholar]
- (17).Babity S; Roohnikan M; Brambilla D Advances in the Design of Transdermal Microneedles for Diagnostic and Monitoring Applications. Small 2018, 14 (49), 1803186. [DOI] [PubMed] [Google Scholar]
- (18).Yang S; Wu F; Liu J; Fan G; Welsh W; Zhu H; Jin T Phase-Transition Microneedle Patches for Efficient and Accurate Transdermal Delivery of Insulin. Adv. Funct. Mater 2015, 25 (29), 4633–4641. [Google Scholar]
- (19).Donnelly RF; McCrudden MTC; Alkilani AZ; Larrañeta E; McAlister E; Courtenay AJ; Kearney MC; Raj Singh TR; McCarthy HO; Kett VL; Caffarel-Salvador E; Al-Zahrani S; Woolfson AD Hydrogel-Forming Microneedles Prepared from “Super Swelling” Polymers Combined with Lyophilised Wafers for Transdermal Drug Delivery. PLoS One 2014, 9 (10), No. e111547. [DOI] [PMC free article] [PubMed] [Google Scholar]
- (20).Arya J; Prausnitz MR Microneedle Patches for Vaccination in Developing Countries. J. Controlled Release 2016, 240, 135–141. [DOI] [PMC free article] [PubMed] [Google Scholar]
- (21).Chang H; Zheng M; Yu X; Than A; Seeni RZ; Kang R A Swellable Microneedle Patch to Rapidly Extract Skin Interstitial Fluid for Timely Metabolic Analysis. Adv. Mater 2017, 29, 1702243. [DOI] [PubMed] [Google Scholar]
- (22).Li CG; Dangol M; Lee CY; Jang M; Jung H A Self-Powered One-Touch Blood Extraction System: A Novel Polymer-Capped Hollow Microneedle Integrated with a Pre-Vacuum Actuator. Lab Chip 2015, 15 (2), 382–390. [DOI] [PubMed] [Google Scholar]
- (23).Caffarel-Salvador E; Brady AJ; Eltayib E; Meng T; Alonso-Vicente A; Gonzalez-Vazquez P; Torrisi BM; Vicente-Perez EM; Mooney K; Jones DS; Bell SEJ; McCoy CP; McCarthy HO; McElnay JC; Donnelly RF Hydrogel-Forming Microneedle Arrays Allow Detection of Drugs and Glucose in Vivo: Potential for Use in Diagnosis and Therapeutic Drug Monitoring. PLoS One 2015, 10 (12), e0145644. [DOI] [PMC free article] [PubMed] [Google Scholar]
- (24).Donnelly RF; Mooney K; Caffarel-Salvador E; Torrisi BM; Eltayib E; McElnay JC Microneedle-Mediated Minimally Invasive Patient Monitoring. Ther. Drug Monit 2014, 36 (1), 1. [DOI] [PubMed] [Google Scholar]
- (25).Ribet F; Stemme G; Roxhed N Real-Time Intradermal Continuous Glucose Monitoring Using a Minimally Invasive Microneedle-Based System. Biomed. Microdevices 2018, 20 (4), 101. [DOI] [PMC free article] [PubMed] [Google Scholar]
- (26).Miller PR; Skoog SA; Edwards TL; Wheeler DR; Xiao X; Brozik SM; Polsky R; Narayan RJ Hollow Microneedle-Based Sensor for Multiplexed Transdermal Electrochemical Sensing. J. Visualized Exp 2012, 3 (64), 1–6. [DOI] [PMC free article] [PubMed] [Google Scholar]
- (27).Bollella P; Sharma S; Cass AEG; Antiochia R Microneedle-Based Biosensor for Minimally-Invasive Lactate Detection. Biosens. Bioelectron 2019, 123, 152–159. [DOI] [PubMed] [Google Scholar]
- (28).Windmiller JR; Valdés-Ramírez G; Zhou N; Zhou M; Miller PR; Jin C; Brozik SM; Polsky R; Katz E; Narayan R; Wang J Bicomponent Microneedle Array Biosensor for Minimally-Invasive Glutamate Monitoring. Electroanalysis 2011, 23 (10), 2302–2309. [Google Scholar]
- (29).Mishra RK; Vinu Mohan AM; Soto F; Chrostowski R; Wang J A Microneedle Biosensor for Minimally-Invasive Transdermal Detection of Nerve Agents. Analyst 2017, 142 (6), 918–924. [DOI] [PubMed] [Google Scholar]
- (30).Mohan AMV; Windmiller JR; Mishra RK; Wang J Continuous Minimally-Invasive Alcohol Monitoring Using Microneedle Sensor Arrays. Biosens. Bioelectron 2017, 91, 574–579. [DOI] [PMC free article] [PubMed] [Google Scholar]
- (31).Valdes TI; Moussy F In Vitro and In Vivo Degradation of Glucose Oxidase Enzyme Used for an Implantable Glucose Biosensor. Diabetes Technol. Ther 2000, 2 (3), 367–376. [DOI] [PubMed] [Google Scholar]
- (32).Harris JM; Reyes C; Lopez GP Common Causes of Glucose Oxidase Instability in In Vivo Biosensing. J. Diabetes Sci. Technol 2013, 7 (4), 1030–1038. [DOI] [PMC free article] [PubMed] [Google Scholar]
- (33).Marunaka Y The Proposal of Molecular Mechanisms of Weak Organic Acids Intake-Induced Improvement of Insulin Resistance in Diabetes Mellitus via Elevation of Interstitial Fluid pH. Int. J. Mol. Sci 2018, 19 (10), 3244. [DOI] [PMC free article] [PubMed] [Google Scholar]
- (34).Marunaka Y Roles of Interstitial Fluid pH in Diabetes Mellitus: Glycolysis and Mitochondrial Function. World J. Diabetes 2015, 6 (1), 125–135. [DOI] [PMC free article] [PubMed] [Google Scholar]
- (35).Baronzio G; Schwartz L; Kiselevsky M; Guais A; Sanders E; Milanesi G; Baronzio M; Freitas I Tumor Interstitial Fluid as Modulator of Cancer Inflammation, Thrombosis, Immunity and Angiogenesis. Anticancer Res 2012, 32 (2), 405–414. [PubMed] [Google Scholar]
- (36).Gromov P; Gromova I; Olsen CJ; Timmermans-Wielenga V; Talman ML; Serizawa RR; Moreira JMA Tumor Interstitial Fluid - A Treasure Trove of Cancer Biomarkers. Biochim. Biophys. Acta, Proteins Proteomics 2013, 1834 (11), 2259–2270. [DOI] [PubMed] [Google Scholar]
- (37).Wagner M; Wiig H Tumor Interstitial Fluid Formation, Characterization, and Clinical Implications. Front. Oncol 2015, 5, 1–12. [DOI] [PMC free article] [PubMed] [Google Scholar]
- (38).Jain RK; Shah SA; Finney PL Continuous Noninvasive Monitoring of Ph and Temperature in Rat Walker 256 Carcinoma during Normoglycemia and Hyperglycemia. J. Natl. Cancer Inst 1984, 73 (2), 429–436. [DOI] [PubMed] [Google Scholar]
- (39).Liliensiek SJ; Wood JA; Yong J; Auerbach R; Nealey PF; Murphy CJ Modulation of Human Vascular Endothelial Cell Behaviors by Nanotopographic Cues. Biomaterials 2010, 31 (20), 5418–5426. [DOI] [PMC free article] [PubMed] [Google Scholar]
- (40).Meng J; Kong H; Han Z; Wang C; Zhu G; Xie S; Xu H Enhancement of Nanofibrous Scaffold of Multiwalled Carbon Nanotubes/Polyurethane Composite to the Fibroblasts Growth and Biosynthesis. J. Biomed. Mater. Res, Part A 2009, 88A (1), 105–116. [DOI] [PubMed] [Google Scholar]
- (41).Sollier E; Murray C; Maoddi P; Di Carlo D Rapid Prototyping Polymers for Microfluidic Devices and High Pressure Injections. Lab Chip 2011, 11 (22), 3752–3765. [DOI] [PubMed] [Google Scholar]
- (42).Mohr JC; de Pablo JJ; Palecek SP 3-D Microwell Culture of Human Embryonic Stem Cells. Biomaterials 2006, 27 (36), 6032–6042. [DOI] [PubMed] [Google Scholar]
- (43).Sau TK; Murphy CJ Seeded High Yield Synthesis of Short Au Nanorods in Aqueous Solution. Langmuir 2004, 20 (15), 6414–6420. [DOI] [PubMed] [Google Scholar]
- (44).Nikoobakht B; El-Sayed MA Preparation and Growth Mechanism of Gold Nanorods (NRs) Using Seed-Mediated Growth Method. Chem. Mater 2003, 15 (10), 1957–1962. [Google Scholar]
- (45).Fernández-López C; Mateo-Mateo C; Álvarez-Puebla RA; Pèrez-Juste J; Pastoriza-Santos I; Liz-Marzán LM Highly Controlled Silica Coating of PEG-Capped Metal Nanoparticles and Preparation of SERS-Encoded Particles. Langmuir 2009, 25 (24), 13894–13899. [DOI] [PubMed] [Google Scholar]
- (46).Rediguieri CF; de Jesus Andreoli Pinto T; Bou-Chacra NA; Galante R; de Araújo GLB; do Nascimento Pedrosa T; Maria-Engler SS; De Bank PA Ozone Gas as a Benign Sterilization Treatment for PLGA Nanofibers Scaffolds. Tissue Eng., Part C 2016, 22 (4), 338–347. [DOI] [PMC free article] [PubMed] [Google Scholar]
- (47).Mathieson I; Bradley RH Improved Adhesion to Polymers by UV/Ozone Surface Oxidation. Int. J. Adhes. Adhes 1996, 16 (1), 29–31. [Google Scholar]
- (48).Wei H; Willner MR; Marr LC; Vikesland PJ Highly Stable SERS pH Nanoprobes Produced by Co-Solvent Controlled AuNP Aggregation. Analyst 2016, 141 (17), 5159–5169. [DOI] [PMC free article] [PubMed] [Google Scholar]
- (49).Greeneltch NG; Blaber MG; Henry A-I; Schatz GC; Van Duyne RP Immobilized Nanorod Assemblies: Fabrication and Understanding of Large Area Surface-Enhanced Raman Spectroscopy Substrates. Anal. Chem 2013, 85 (4), 2297–2303. [DOI] [PubMed] [Google Scholar]
- (50).Phan HT; Haes AJ Impacts of pH and Intermolecular Interactions on Surface-Enhanced Raman Scattering Chemical Enhancements. J. Phys. Chem. C 2018, 122 (26), 14846–14856. [Google Scholar]
Associated Data
This section collects any data citations, data availability statements, or supplementary materials included in this article.


