

ABSTRACT
Background
Findings from existing prospective observational studies on the protective associations of flavonoid intake and the risk of Alzheimer disease and related dementias (ADRD) are inconsistent largely due to limitations of these studies.
Objectives
To examine the prospective relation between total and 6 classes of dietary flavonoid intake and risk of ADRD and Alzheimer disease (AD) while addressing limitations of earlier observational studies.
Methods
We used data from the Framingham Heart Study Offspring Cohort exams 5 through 9. Participants were ADRD-free with a valid FFQ at baseline. Flavonoid intakes were updated at each exam to represent the cumulative average intake across the 5 exams, and were expressed as percentile categories of intake (≤15th, >15th to 30th, >30th to 60th, >60th) to handle their nonlinear relation with ADRD and AD. Cox proportional hazards regression was used to estimate the HRs for the association between the flavonoid intakes and incidence of ADRD and AD.
Results
Over an average follow-up of 19.7 y in 2801 participants (mean baseline age = 59.1 y; 52% females), there were 193 ADRD events of which 158 were AD. After multivariate and dietary adjustments, individuals with the highest (>60th percentile) intakes of flavonols, anthocyanins, and flavonoid polymers had a lower risk of ADRD relative to individuals with the lowest intakes (≤15th percentile), with HRs (95% CI; P-trend) of 0.54 (0.32, 0.90; P = 0.003) for flavonols, 0.24 (0.15, 0.39; P < 0.001) for anthocyanins, and 0.58 (0.35, 0.94; P = 0.03) for flavonoid polymers. The same pattern of associations was seen with AD for flavonols and anthocyanins but not for flavonoid polymers.
Conclusions
Our findings imply that higher long-term dietary intakes of flavonoids are associated with lower risks of ADRD and AD in US adults.
Keywords: Alzheimer disease and related dementias, long-term dietary flavonoid intake, polyphenols, Framingham Heart Study Offspring Cohort, prospective cohort study
As the older population continues to grow in the US so does the burden imposed on the health care system due to the rise in the prevalence of Alzheimer's disease and related dementias (ADRD), representing one of the greatest challenges facing the public health. To date, there are no effective treatments for ADRD and thus identifying dietary strategies that would help prevent or mitigate ADRD is of great priority. Evidence on the role of flavonoids, natural pigments found in a wide range of plant-based foods, in ADRD risk is inconsistent due to the many limitations associated with the current studies. Accordingly, this study aimed to more accurately explore the relationship between total and the six classes of flavonoids and risk of ADRD while taking into account the limitations of previous studies. We found that individuals with higher intakes of the three flavonoid classes: flavonols, anthocyanins, and flavonoid polymers had a lower risk of ADRD compared to those with lower intakes. Our results add to the limited evidence that flavonoids could have the potential to reduce the risk of ADRD.
See corresponding editorial on page 241.
Introduction
Along with improvements in healthcare and medical technology, the aging of the baby boom generation will result in an unprecedented rise in the number of older Americans (1, 2). Currently, there are >50 million Americans aged ≥65 y, and that is projected to more than double by 2060 (3). A consequence of this increase in older adults is the escalation of age-related diseases (4, 5). Alzheimer disease (AD) and related dementias (ADRD), a group of symptoms in which there is progressive deterioration in cognitive function severe enough to interfere with a person's daily living activities, are regarded as among the most significant public health challenges largely affecting adults aged >65 y (6). AD is the most common form of dementia, making up ∼60–80% of dementia cases. Currently, 5.8 million Americans are living with AD, and by 2050 that is projected to escalate to 14 million (7).
Given the absence of effective drug treatments to prevent, significantly attenuate, or ameliorate ADRD, extensive efforts are being made to identify modifiable risk factors that can lower the risk of developing ADRD, of which diet could hold significant promise (8, 9). Increasing evidence suggests that the Mediterranean diet, a dietary pattern that emphasizes flavonoid-rich fruits and vegetables, has the potential to reduce the risk of cognitive decline and ADRD (10–14). Flavonoids are naturally occurring bioactive pigments found widely in plant-based foods (15). Based on their chemical structure, flavonoids are classified into 7 major classes, including flavan-3-ols, flavonols, anthocyanins, flavones, flavanones, flavonoid polymers, and isoflavones (16). Common sources of flavonoids include anthocyanin-rich berries and red wine, flavanone-rich citrus fruits and juices, flavan-3-ol-rich teas and dark chocolate, flavone-rich parsley and celery, flavonol-rich onions and apples, and isoflavone-rich soy products (15, 17–19).
Human intervention studies assessing the acute effects of flavonoid-rich foods, such as cocoa (20, 21), blueberries (22, 23), and orange juice (24, 25), have revealed promising findings in the areas of memory, attention, and executive function. However, given the short duration of these trials, it is not possible to extrapolate their findings to ADRD risk. Furthermore, observational evidence relating flavonoid intake to ADRD risk is limited primarily by inadequate assessment of flavonoid intake as a result of either relying on a single dietary assessment over the course of relatively long follow-up periods, inaccurate capture and characterization of total flavonoid intake due to using imprecise dietary assessment tools, or use of incomplete flavonoid databases (26–29). In an effort to better understand the role of dietary flavonoid intake in the risk of ADRD, we undertook the present study to examine the relation between the risk of ADRD and long-term intake of total dietary flavonoids and 6 classes of flavonoids commonly consumed in Western diets, while addressing the limitations of prior observational studies on this relation.
Methods
Study population
The present study used data from the Framingham Heart Study (FHS), a long-term ongoing cohort study designed to explore cardiovascular disease risk factors in residents of the city of Framingham, Massachusetts (30). The study was initiated in 1948 with a total of 5209 participants aged 28–62 y in the original cohort. The Framingham Offspring Study Cohort was established in 1970 and consisted of 5124 men and women who were the children of the original cohort and their partners (31). Approximately every 4 y, this cohort undergoes a physical examination, and completes a series of questionnaires and laboratory and cardiovascular tests. The cohort also undergoes continuous surveillance for various incident outcomes such as cardiovascular disease, stroke, diabetes, hypertension, and dementia. For the purposes of conducting this study, we used data derived from the Offspring Cohort exams 5 (1991–1995), 6 (1995–1998), 7 (1998–2001), 8 (2005–2008), and 9 (2011–2014). We allowed participants’ baselines to be any of these 5 Offspring Cohort exams (as described below).
Figure 1 displays the flow of our study population and their baseline frequencies. To be eligible for the current study, participants had to be free of ADRD and have a valid FFQ (as described below) at their baseline study exam. They also had to be aged ≥50 y at the end of Offspring Cohort exam 5 to allow sufficient time during follow-up to reach an age at which they would be at a reasonable risk for ADRD (i.e., all participants would be aged >70 y by the end of follow-up). A total of 3127 participants were aged ≥50 y at the end of exam 5. Of these, 146 participants did not have a valid FFQ at their respective baseline exam, and an additional 8 had ADRD (of which 7 had AD) at their baseline exam resulting in a total of 2973 and 2974 eligible participants for the ADRD and AD analyses, respectively. An additional 172 and 174 participants were excluded from the ADRD and AD analyses, respectively, due to 1) having a censoring date that was at or prior to the participant's baseline exam (as described below) (n = 4, ADRD; n = 8, AD); 2) the last available flavonoid intake data being prior to the participant's baseline exam (n = 17, ADRD; n = 15, AD); 3) missing covariate data across all 5 Offspring exam cycles (n = 151, ADRD; n = 149, AD); or 4) missing a cognitive impairment date that did not allow determination of a censoring date (as described below) (n = 2, AD). Our final sample consisted of 2801 and 2800 participants for the ADRD and AD analyses, respectively. The baseline frequency of the 2801 and 2800 participants available for the ADRD and AD analyses was as follows: baseline at Offspring exam 5: 2525 (ADRD), 2524 (AD); baseline at Offspring exam 6: 180 (ADRD and AD); baseline at Offspring exam 7: 67 (ADRD and AD); baseline at Offspring exam 8: 29 (ADRD and AD).
FIGURE 1.
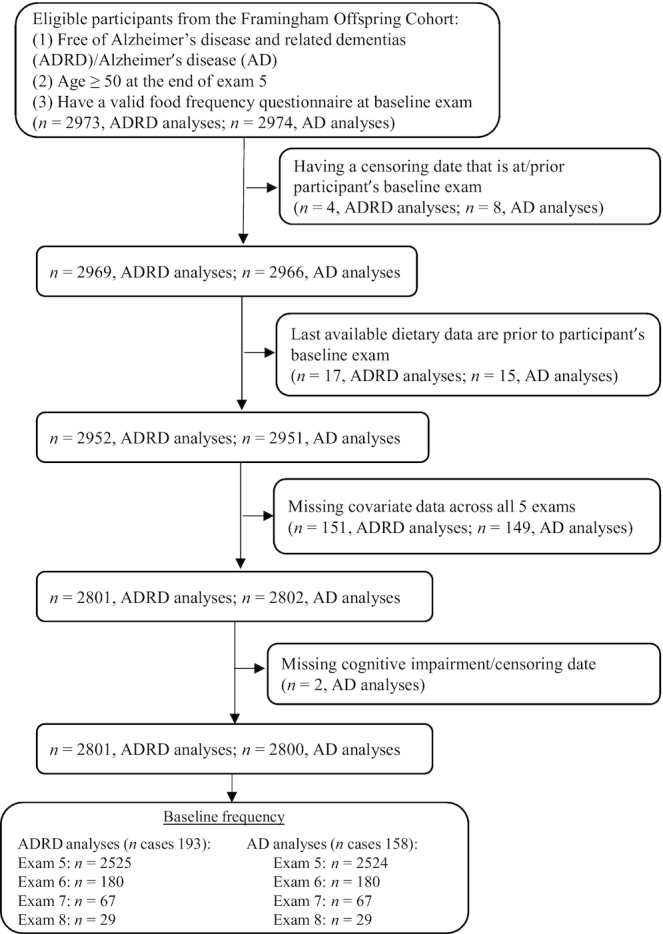
Flowchart for selection of study participants.
The original data collection protocols were approved by the Institutional Review Board at Boston University Medical Center, and written informed consent was obtained from all participants. The present study protocol was reviewed and approved by the Tufts University Health Sciences Institutional Review Board.
Flavonoid exposures
Dietary assessment
Participants’ dietary intakes were assessed at the fifth through the ninth Offspring Cohort exam cycles using a validated semiquantitative FFQ developed by Willett et al. (32). Before each exam cycle, the FFQs were mailed to free-living participants who were given instructions to complete the questionnaire recording the frequency of foods consumed over the past 12 mo, and to bring it to their exam appointment. The FFQ is comprised of a list of 126 foods with a standard serving size and a selection of 9 frequency categories ranging from “never or <one serving/month” to “≥six servings/day.” The FFQ also allowed participants to include ≤4 extra food items that were essential elements of their diets but were not included among the 126 food items on the FFQ. Participants were also asked to provide information on the use of dietary supplements, type of breakfast cereal most commonly consumed, types of fats and oils typically used, and frequency of consumption of fried foods. Intakes of food components, including both nutrients and nonnutrients, were computed by multiplying the frequency of consumption of each food item by the nutrient content of the specified portions. An FFQ was judged as invalid if reported energy intakes were <600 kcal/d or >4000 kcal/d for women, and >4200 kcal/d for men, respectively, or if >12 food items were left blank.
A direct evaluation of the validity of flavonoid intake from the FFQ used in the current study has not been performed. However, the validity of food intake measurements based on a comparison between the FFQ and two 7-d diet records collected during the year time interval covered by the FFQ has been previously documented (33). It showed relatively high correlations between intakes from the FFQ and 7-d diet records for the key dietary sources of flavonoids in the Framingham Offspring cohort. The food items consisted of red wine (r = 0.83), orange juice (r = 0.78), tea (r = 0.77), oranges (r = 0.76), apples/pears (r = 0.70), and strawberries (r = 0.38). Although flavonoid-containing supplements were uncommon up through the Offspring Cohort exam 9, we included supplemental flavonoid intake from dietary supplements that could be identified.
Characterizing flavonoid intakes
The exposure of interest of the present study was the habitual intake of 6 flavonoid classes commonly consumed in the US diet including flavonols, flavones, flavanones, flavan-3-ols, anthocyanins, flavonoid polymers, and their total intake. We used the USDA flavonoid content of foods and the proanthocyanidin databases to derive flavonoid intake information (34). The sum of the consumption frequency of each food multiplied by the content of the specific flavonoid for the specified portion size was used to calculate the intakes of individual flavonoid compounds. The flavonoid classification by Cassidy et al. (35) was used to define the 6 flavonoid classes. Total flavonoid intake was calculated as the sum of intakes of the 6 flavonoid classes. Because the habitual intakes of isoflavones are very low in the US diet (36, 37), we did not include this flavonoid class in our analyses.
Identification and classification of ADRD and AD events
Our primary outcomes of interest included incidence of ADRD and AD, both of which were determined a priori. We assessed incident ADRD and AD through December 2016. Participants were determined to be at risk of developing dementia if they experienced a decline in routinely administered Mini-Mental State Examination scores or any of the neuropsychological (NP) tests given at the Framingham NP Ancillary Exams. They were also determined to be at risk if they were referred by FHS staff and physicians at Clinical Offspring or NP Ancillary Exams or if suspected cognitive decline was reported by self, family, or evidenced in primary care physician/nursing home records. These individuals were flagged and brought to a diagnostic consensus review conducted by a panel that included ≥1 neurologist and ≥1 neuropsychologist to determine if ADRD was evident based on the criteria for a diagnosis of dementia outlined in the criteria in the fourth edition of the Diagnostic and Statistical Manual of Mental Disorders (DSM-IV) (38). Participants were required to have symptoms for ≥6 mo. Numerous sources of information were used, when available, to establish the diagnosis, including examinations by FHS investigators, hospital and nursing home records, data from structured family interviews, and brain imaging data. Additional information about type of dementia and disease progression (when applicable) was also recorded. Participants with AD met the National Institute of Neurological and Communicative Diseases and Stroke and the Alzheimer's Disease and Related Disorders Association (NINCDS-ADRDA) criteria for definite (autopsy cases only), probable, or possible AD (39).
Supplemental Figure 1 illustrates the classification criteria for ADRD and AD. Participants who were not flagged for NP evaluation were considered to be free of dementia and cognitive impairment. Those who were flagged for NP evaluation were classified as follows:
Those with no evidence of dementia based on the review were classified as either (a) impaired if there was evidence of any cognitive impairment, or (b) not impaired if the review found no evidence of impairment.
Those with evidence of dementia who did not meet the DSM-IV criteria were identified as having unclassified dementia if they had available data on either the last date documented to be cognitively intact or date of cognitive impairment onset, or were excluded if no dates were available.
Those who were identified to have dementia based on the DSM-IV criteria were classified as having either (a) ADRD if they had available dementia diagnosis dates, or (b) unclassified dementia if they were missing dementia diagnosis dates but had available data on either the last date documented to be cognitively intact or date of cognitive impairment onset.
Those identified as having ADRD were classified as (a) AD if they met the NINCDS-ADRDA AD criteria, or (b) dementia without AD if they did not meet the NINCDS-ADRDA AD criteria.
Based on this approach, there was a total of 193 ADRD and 158 AD events at follow-up. We assumed that those flagged for NP evaluation but deemed not impaired were similar to those who were not impaired and not flagged for NP evaluation and we combined these groups for our analyses. We defined the “unclassified dementia” group as a catch-all category for ADRD that we could not otherwise classify or treat as ADRD because of limited data.
Ascertainment of death
In addition to being monitored for various incident outcomes, participants were also continuously observed for incidence of death. For each death incident, a committee of 3 experienced investigators used information from the FHS and hospitalization records, and when accessible, autopsy findings, in order to determine the underlying cause of death (40). We used the death dates to establish the censoring for those who died without dementia.
Covariates
A number of potential confounders were considered in our analyses based on established or suspected risk factors for dementia (41–44). This included age, sex, education (up to and including high-school graduate, some or college graduate, beyond college graduate), total energy intake (TEI; kilocalories per day), apoE ε4 allele (having ≥1 apoE ε4 allele), smoking status (never, current, former), physical activity index (PAI) expressed in metabolic equivalents (Mets) (45), BMI (kg/m2), prevalent stroke, hypercholesterolemia, hypertension, diabetes, dietary intakes of ω-3 fatty acids EPA and DHA (grams per day), lutein and zeaxanthin (micrograms per day), and alcohol (grams per day), overall diet quality, as assessed by the 2010 Dietary Guidelines for Americans Adherence Index (DGAI) (46), and vitamin and mineral supplement use.
Stroke was defined by the presence of any of the following events: atherothrombotic infarction of brain, cerebral embolism, intracerebral hemorrhage, and subarachnoid hemorrhage (47). We assessed hypercholesterolemia based on use of cholesterol-lowering medication or having total cholesterol concentrations ≥200 mg/dL. Likewise, we defined hypertension by use of blood pressure–lowering medication or having systolic and/or diastolic blood pressure ≥130 mmHg and ≥80 mmHg, respectively. Diabetes was established by any of the following criteria: 1) taking oral hypoglycemic medication; 2) insulin use; 3) fasting blood glucose concentrations ≥126 mg/dL; or 4) nonfasting blood glucose concentrations ≥200 mg/dL.
Statistical analyses
Main analyses
We used SAS software (version 9.4; SAS Institute) to perform all our analyses. All analyses were prespecified, with the exception of the categorization of flavonoid intake data using non–quantile-based cutoff values (see below). Participants were followed from baseline until the occurrence of any of the following events: ADRD, AD, death, or third consecutive follow-up exam with missing dietary intake data. They were censored at the dates at which these events occurred. We did not use interval censoring because the vast majority of ADRD diagnosis dates (93.3%) did not correspond to a study exam date. Additionally, participants who were identified as impaired or having unclassified dementia were censored at either the last date documented to be cognitively intact or date of cognitive impairment onset, whichever was available. If both dates were available, we used the latter date. Those who did not develop any of the above-mentioned events were followed up until the end of the study (December 12, 2016), at which time they were censored.
After inspecting the nature of the relation between the flavonoid exposures and ADRD or AD incidence, we determined that the associations were mostly nonlinear, and risk increased more dramatically in individuals with flavonoid intakes in the lowest 30% compared with higher intake levels. Consequently, we were unable to adequately display categorical analyses using common cutoff values such as quartiles or quintiles. To appropriately model the nonlinearity using percentile categories, it was necessary to create multiple categories to characterize the lower flavonoid intakes. We chose to use the following cutoff values to characterize the changes in the HRs across the following intake categories: ≤15th percentile, >15th to ≤30th percentile, >30th to ≤60th percentile, and >60th percentile, while maintaining a minimum sample size among the smaller categories of ≥400 participants.
We updated flavonoid intake at each exam by using the cumulative average of intakes from all exams prior to censoring, except as noted below. In the event that a participant was missing intake data at ≥1 of the follow-up exams, the cumulative average of flavonoid intake was based on existing intake data. Likewise, we used the same cumulative average approach to update our covariates at each exam. These covariates included TEI, smoking, PAI, BMI, prevalent stroke, diabetes, hypertension, hypercholesterolemia, DGAI, multivitamin and mineral use, and dietary intakes of ω-3 fatty acids (EPA and DHA), lutein and zeaxanthin, and alcohol. We used the baseline value for the following covariates: age, sex, education, and apoE ε4 allele.
For participants diagnosed with ADRD, we used a 1825-d (5-y) cutoff to determine when to stop updating their dietary and covariate data. If the difference between a participant's ADRD diagnosis date and the exam prior to ADRD diagnosis was ≥1825 d, we stopped the update at the exam prior to which ADRD was diagnosed. However, if the difference was <1825 d, then we stopped updating his/her dietary and covariate data at 2 exams prior to the exam at which ADRD was diagnosed. For participants who died without developing ADRD, we stopped updating their dietary and covariate data at the exam prior to their death. For those missing intake data at 3 consecutive follow-up exams, we stopped updating their dietary and covariate data at the second missing follow-up exam. For participants identified as impaired or having unclassified dementia, we stopped updating their dietary and covariate data at the exam prior to which information on cognitive impairment was available (either last known date to be cognitively intact or date of cognitive impairment onset, as described above). Finally, for participants who survived until the end of the study, we stopped updating their dietary and covariate data at the last exam (exam 9).
We used Cox proportional hazards regression models to estimate the HRs for the prospective association between total and 6 classes of flavonoids, expressed as percentile-based categories of intake, and incidence of ADRD and AD. We considered the following 3 cumulative models in our analyses:
Model 1 (basic model): adjusted for age, sex, education, apoE ε4 allele, and TEI.
Model 2 (lifestyle and clinical): adjusted for model 1 covariates + PAI, smoking status, BMI, prevalent stroke, diabetes, hypertension, and hypercholesterolemia.
Model 3 (dietary model): adjusted for model 1 and model 2 covariates + overall dietary quality (DGAI), multivitamin and mineral supplement use, and dietary intakes of alcohol, ω-3 fatty acids (EPA and DHA), and lutein and zeaxanthin.
Sensitivity analyses
In addition to our main analyses, we performed several sensitivity analyses to verify several criteria used in this study. These included testing the influence of sex, baseline age, and apoE ε4 allele on the relation between flavonoid intake and risk of ADRD. This was done by performing sex, baseline age, and apoE ε4 interactions with total and the 6 flavonoid classes. Given the potential for differences in risk factors for ADRD diagnosed at younger and older ages, such as a stronger genetic disposition for younger cases whereas older cases might be more environmentally driven, we also performed stratified analyses by age at ADRD diagnosis (48). This was done by stratifying our sample into 2 groups: those diagnosed with ADRD at ≥80 y and <80 y (the mean age at ADRD diagnosis in our participants was 79.7 y). Further, we tested the impact of excluding subjects who were identified as impaired or having unclassified dementia. Finally, we explored the influence of increasing the length of time between ADRD diagnoses and stopping the update of flavonoid intake and covariate data assessment from ≥1825 d (≥5 y) to ≥3650 d (≥10 y).
Results
Table 1 presents the median, 15th, 30th, and 60th percentile values, which were used to define the intake categories for each flavonoid class based on the cumulative average of participants’ intakes.
TABLE 1.
Cumulative average of flavonoid intake of study participants1
| Flavonoid intake category cutoff values | ||||
|---|---|---|---|---|
| Flavonoid class2 | Median | 15th percentile | 30th percentile | 60th percentile |
| Flavonols | 12.3 | 6.4 | 9.0 | 14.2 |
| Flavones | 1.89 | 0.74 | 1.23 | 2.18 |
| Flavanones | 38.3 | 9.7 | 21.4 | 47.6 |
| Flavan-3-ols | 28.0 | 10.7 | 17.2 | 35.5 |
| Anthocyanins | 13.4 | 4.0 | 8.0 | 16.4 |
| Flavonoid polymers | 145.3 | 60.4 | 94.0 | 179.3 |
| Total flavonoids3 | 251.7 | 122.6 | 174.6 | 296.8 |
Members of the Framingham Heart Study Offspring cohort at the fifth through the ninth examinations cycles; n = 2801.
Presented in milligrams per day.
Total flavonoids does not include isoflavones because they were not assessed in this study.
Table 2 displays the baseline characteristics of the study participants based on total sample and 4 categories of total flavonoid intake. The overall mean baseline age (95% CI) of the study participants was 59.1 y (58.9, 59.4 y), of which 52.0% were females. On average, participants were highly educated (60.4% with at least a college degree), had light physical activity, and were overweight (BMI = 27.8). They also had low prevalence of smoking, diabetes, and stroke, and high prevalence of hypertension and hypercholesterolemia, as well as moderate DGAI scores. Relative to those in the lowest category of total flavonoid intake, participants in the highest category were older, more women, educated, physically active, consumed more calories, had a better overall diet quality; and higher consumption of ω-3 fatty acids (EPA and DHA), lutein and zeaxanthin, and multivitamin and mineral supplements. They also smoked less and had lower BMI and prevalence of hypercholesterolemia. Factors such as having ≥1 apoE ε4 allele, prevalence of diabetes, hypertension, and stroke, and amount of alcohol intake were not associated with the level of total flavonoid intake.
TABLE 2.
Age- and sex-adjusted baseline characteristics of participants for total sample and percentile categories of total flavonoid intake1
| Total flavonoid intake percentile category | ||||||
|---|---|---|---|---|---|---|
| Characteristic | Total sample (n = 2801)2 | ≤15th (n = 421) | >15th to 30th (n = 419) | >30th to 60th (n = 841) | >60th (n = 1120) | P-trend3 |
| Total flavonoid intake,4 mg/d | 212.7 (2.3, 2323) | 62.1 (2.3, 93.2) | 117.4 (93.3, 140.9) | 192.2 (141.0, 260.7) | 421.1 (260.8, 2323) | |
| Age,5 y | 59.1 (58.9, 59.4) | 58.0 (57.3, 58.7) | 59.3 (58.6, 60.0) | 58.9 (58.4, 59.4) | 59.7 (59.2, 60.1) | 0.001 |
| Female,6 % | 52.0 (50.2, 53.9) | 46.2 (41.5, 51.0) | 51.1 (46.3, 55.9) | 50.2 (46.8, 53.5) | 55.9 (53.0, 58.9) | <0.001 |
| Education: at least college degree,2, 6 % | 60.4 (58.6, 62.3) | 46.8 (42.1, 51.5) | 57.3 (52.7, 62.0) | 62.1 (58.8, 65.4) | 65.5 (62.6, 68.3) | <0.001 |
| apoE ε4 allele,2, 6 % | 22.4 (20.8, 24.0) | 20.6 (16.4, 24.8) | 21.2 (17.0, 25.3) | 22.7 (19.8, 25.6) | 23.4 (20.9, 25.9) | 0.23 |
| Total energy intake,5 kcal/d | 1835 (1813, 1858) | 1420 (1366, 1474) | 1649 (1595, 1703) | 1851 (1813, 1889) | 2051 (2018, 2084) | <0.001 |
| PAI,2, 5 Mets | 34.5 (34.2, 34.7) | 33.8 (33.2, 34.4) | 34.2 (33.6, 34.8) | 34.6 (34.2, 35.0) | 34.7 (34.3, 35.0) | 0.03 |
| Current smoker,2, 6 % | 17.3 (15.9, 18.7) | 34.0 (30.4, 37.5) | 19.2 (15.6, 22.7) | 14.2 (11.7, 16.7) | 12.7 (10.5, 14.9) | <0.001 |
| BMI,2, 5 kg/m2 | 27.8 (27.6, 28.0) | 28.3 (27.8, 28.7) | 28.1 (27.7, 28.6) | 28.1 (27.7, 28.4) | 27.2 (26.9, 27.5) | <0.001 |
| Diabetes,2, 6 % | 9.2 (8.2, 10.3) | 8.6 (5.9, 11.4) | 10.7 (8.0, 13.5) | 8.5 (6.5, 10.4) | 9.5 (7.8, 11.2) | 0.84 |
| Hypertension,6 % | 61.7 (59.9, 63.4) | 61.4 (56.9, 66.0) | 64.4 (59.8, 68.9) | 61.3 (58.1, 64.5) | 61.0 (58.2, 63.8) | 0.51 |
| Stroke,6 % | 1.1 (0.7, 1.5) | 1.5 (0.5, 2.5) | 1.2 (0.2, 2.2) | 1.2 (0.5, 1.9) | 0.9 (0.2, 1.5) | 0.25 |
| Hypercholesterolemia,2, 6 % | 63.0 (61.3, 64.8) | 63.2 (58.6, 67.7) | 64.9 (60.4, 69.5) | 65.9 (62.7, 69.1) | 60.1 (57.3, 63.0) | 0.03 |
| DGAI2, 5 | 60.4 (60.0, 60.8) | 51.3 (50.3, 52.3) | 58.1 (57.1, 59.1) | 61.4 (60.6, 62.1) | 64.1 (63.5, 64.7) | <0.001 |
| ω-3 fatty acid intake: EPA and DHA,5 g/d | 0.26 (0.25, 0.27) | 0.19 (0.17, 0.22) | 0.23 (0.21, 0.25) | 0.25 (0.24, 0.27) | 0.30 (0.29, 0.32) | <0.001 |
| Lutein and zeaxanthin intake,5 µg/d | 3258 (3159, 3358) | 1956 (1708, 2204) | 2639 (2391, 2888) | 3249 (3073, 3424) | 3991 (3839, 4144) | <0.001 |
| Alcohol intake,5 g/d | 10.9 (10.3, 11.5) | 9.5 (7.9, 11.1) | 9.3 (7.7, 10.9) | 12.2 (11.1, 13.3) | 11.1 (10.2, 12.1) | 0.15 |
| Multivitamin and mineral supplement use,6 % | 29.1 (27.4, 30.8) | 23.4 (19.1, 27.8) | 26.4 (22.1, 30.7) | 29.1 (26.1, 32.2) | 32.2 (29.5, 34.8) | 0.001 |
Age and sex-adjusted mean or prevalence (95% CIs) of characteristics for members of the Framingham Heart Study Offspring Cohort at the fifth through the eighth exam cycles based on analysis of covariance. DGAI, Dietary Guidelines for Americans Adherence Index; Mets, metabolic equivalents ; PAI, physical activity index.
Number missing: education, 127; apoE ε4, 161; PAI, 142; smoking, 2; BMI, 7; diabetes, 12; hypercholesterolemia, 10; DGAI, 266.
P values represent the test of linear trend across percentile categories of total flavonoid intake and were based on linear regression models with the median intake of each percentile category assigned to individuals with intake in that category, and this quartile median variable was used as a continuous measure in the regression models.
Values are medians; minimum and maximum in parentheses.
All values are age- and sex-adjusted (least-squares) means; 95% CIs in parentheses.
All values are age- and sex-adjusted (least-squares) percentages; 95% CIs in parentheses.
Supplemental Table 1 displays the top contributing foods for total flavonoids and each flavonoid class in our study population at exam 5. The same foods, tea and apples/pears, were the most common sources of flavonols, flavan-3-ols, and flavonoid polymers, whereas oranges and orange juice were the most common food sources of flavones and flavanones.
Results of the Cox proportional hazards regression models indicated that after multivariable and dietary adjustments, individuals with the highest (>60th percentile) intakes of flavonols, anthocyanins, and flavonoid polymers had a lower risk of ADRD relative to individuals with the lowest intakes (≤15th percentile), with HRs (95% CI; P-trend) of 0.54 (0.32, 0.90; P = 0.003) for flavonols, 0.24 (0.15, 0.39; P < 0.001) for anthocyanins, and 0.58 (0.35, 0.94; P = 0.03) for flavonoid polymers (Table 3, model 3). Results were essentially the same for AD albeit somewhat attenuated for flavonoid polymers, which could be a consequence of a smaller number of AD events (187 ADRD compared with 153 AD events) (Table 4).
TABLE 3.
HRs (95% CIs) of Alzheimer disease and related dementias (ADRD) events over 26 y of follow-up based on a 5-y cutoff between ADRD diagnosis and updated flavonoid intake data1
| Flavonoid intake percentile category | |||||
|---|---|---|---|---|---|
| Flavonoid class | ≤15th | >15th to 30th | >30th to 60th | >60th | P-trend2 |
| Flavonols | (n3 = 420/36) | (n = 420/36) | (n = 841/63) | (n = 1120/58) | |
| Model 14 | 1.00 (ref.) | 1.00 (0.62, 1.59) | 0.89 (0.58, 1.36) | 0.58 (0.37, 0.91) | 0.004 |
| Model 25 | 1.00 (ref.) | 0.96 (0.60, 1.56) | 0.84 (0.54, 1.29) | 0.51 (0.32, 0.82) | 0.001 |
| Model 36 | 1.00 (ref.) | 1.00 (0.61, 1.64) | 0.85 (0.53, 1.35) | 0.54 (0.32, 0.90) | 0.003 |
| Flavones | (n = 420/31) | (n = 420/21) | (n = 841/47) | (n = 1120/94) | |
| Model 14 | 1.00 (ref.) | 0.75 (0.43, 1.31) | 0.60 (0.38, 0.95) | 0.86 (0.55, 1.32) | 0.92 |
| Model 25 | 1.00 (ref.) | 0.76 (0.44, 1.33) | 0.57 (0.35, 0.91) | 0.83 (0.53, 1.30) | 0.99 |
| Model 36 | 1.00 (ref.) | 0.83 (0.47, 1.46) | 0.61 (0.38, 0.99) | 0.92 (0.57, 1.48) | 0.72 |
| Flavanones | (n = 418/26) | (n = 422/20) | (n = 840/38) | (n = 1121/109) | |
| Model 14 | 1.00 (ref.) | 0.62 (0.34, 1.11) | 0.49 (0.30, 0.81) | 0.88 (0.56, 1.37) | 0.22 |
| Model 25 | 1.00 (ref.) | 0.61 (0.34, 1.10) | 0.48 (0.29, 0.80) | 0.84 (0.53, 1.33) | 0.32 |
| Model 36 | 1.00 (ref.) | 0.66 (0.36, 1.20) | 0.52 (0.31, 0.88) | 0.92 (0.57, 1.49) | 0.21 |
| Flavan-3-ols | (n = 419/33) | (n = 422/36) | (n = 840/49) | (n = 1120/75) | |
| Model 14 | 1.00 (ref.) | 1.13 (0.7, 1.83) | 0.74 (0.47, 1.16) | 0.77 (0.50, 1.20) | 0.19 |
| Model 25 | 1.00 (ref.) | 1.08 (0.66, 1.75) | 0.66 (0.41, 1.06) | 0.68 (0.44, 1.07) | 0.09 |
| Model 36 | 1.00 (ref.) | 1.03 (0.63, 1.70) | 0.65 (0.40, 1.05) | 0.69 (0.43, 1.09) | 0.13 |
| Anthocyanins | (n = 420/49) | (n = 421/32) | (n = 840/65) | (n = 1120/47) | |
| Model 14 | 1.00 (ref.) | 0.52 (0.33, 0.82) | 0.53 (0.36, 0.77) | 0.29 (0.19, 0.45) | <0.001 |
| Model 25 | 1.00 (ref.) | 0.50 (0.32, 0.79) | 0.53 (0.36, 0.78) | 0.26 (0.16, 0.40) | <0.001 |
| Model 36 | 1.00 (ref.) | 0.48 (0.30, 0.77) | 0.49 (0.32, 0.74) | 0.24 (0.15, 0.39) | <0.001 |
| Flavonoid polymers | (n = 420/33) | (n = 420/34) | (n = 840/57) | (n = 1121/69) | |
| Model 14 | 1.00 (ref.) | 0.90 (0.55, 1.47) | 0.70 (0.45, 1.10) | 0.60 (0.38, 0.95) | 0.03 |
| Model 25 | 1.00 (ref.) | 0.88 (0.54, 1.44) | 0.63 (0.40, 1.00) | 0.53 (0.33, 0.85) | 0.008 |
| Model 36 | 1.00 (ref.) | 0.88 (0.53, 1.46) | 0.65 (0.40, 1.05) | 0.58 (0.35, 0.94) | 0.03 |
| Total flavonoids | (n = 419/27) | (n = 421/30) | (n = 841/61) | (n = 1120/75) | |
| Model 14 | 1.00 (ref.) | 0.96 (0.56, 1.63) | 0.94 (0.58, 1.50) | 0.78 (0.48, 1.27) | 0.22 |
| Model 25 | 1.00 (ref.) | 0.91 (0.53, 1.56) | 0.86 (0.53, 1.39) | 0.68 (0.41, 1.12) | 0.08 |
| Model 36 | 1.00 (ref.) | 0.89 (0.51, 1.55) | 0.90 (0.54, 1.48) | 0.73 (0.43, 1.24) | 0.18 |
Mean follow-up time of 19.7 y.
P values for the test of linear trend across percentile categories were based on linear regression models with the median intake of each percentile category assigned to individuals with intake in that category, and this percentile median variable was used as a continuous measure in regression models.
n represents the number of participants/ADRD events per percentile category for model 1.
Model 1 adjusted for age, sex, education, apoE ε4 allele, and total energy intake; total n = 2801; n ADRD events = 193.
Model 2 adjusted for model 1 covariates + physical activity index, smoking status, BMI, prevalent stroke, diabetes, hypertension, and hypercholesterolemia; total n = 2797; n ADRD events = 189.
Model 3 adjusted for model 1 and model 2 covariates + overall dietary quality, vitamin and mineral supplement use, and dietary intakes of alcohol, ω-3 fatty acids (EPA and DHA), lutein, and zeaxanthin; total n = 2795; n ADRD events = 187.
TABLE 4.
HRs (95% CIs) of Alzheimer disease (AD) events over 26 y of follow-up based on a 5-y cutoff between AD diagnosis and updated flavonoid intake data1
| Flavonoid intake percentile category | |||||
|---|---|---|---|---|---|
| Flavonoid class | ≤15th | >15th to 30th | >30th to 60th | >60th | P-trend2 |
| Flavonols | (n3 = 419/32) | (n = 421/29) | (n = 840/53) | (n = 1120/44) | |
| Model 14 | 1.00 (ref.) | 0.94 (0.56, 1.57) | 0.90 (0.57, 1.43) | 0.54 (0.33, 0.90) | 0.005 |
| Model 25 | 1.00 (ref.) | 0.87 (0.51, 1.47) | 0.84 (0.53, 1.35) | 0.47 (0.28, 0.79) | 0.001 |
| Model 36 | 1.00 (ref.) | 0.90 (0.52, 1.55) | 0.86 (0.52, 1.43) | 0.50 (0.28, 0.88) | 0.004 |
| Flavones | (n = 419/27) | (n = 421/15) | (n = 838/43) | (n = 1122/73) | |
| Model 14 | 1.00 (ref.) | 0.63 (0.34, 1.19) | 0.65 (0.40, 1.05) | 0.83 (0.52, 1.34) | 0.96 |
| Model 25 | 1.00 (ref.) | 0.64 (0.34, 1.20) | 0.60 (0.37, 1.00) | 0.79 (0.49, 1.29) | 0.93 |
| Model 36 | 1.00 (ref.) | 0.67 (0.36, 1.28) | 0.63 (0.38, 1.06) | 0.86 (0.51, 1.45) | 0.84 |
| Flavanones | (n = 418/22) | (n = 422/15) | (n = 840/35) | (n = 1120/86) | |
| Model 14 | 1.00 (ref.) | 0.54 (0.28, 1.04) | 0.53 (0.31, 0.91) | 0.85 (0.52, 1.39) | 0.28 |
| Model 25 | 1.00 (ref.) | 0.53 (0.27, 1.03) | 0.51 (0.29, 0.88) | 0.81 (0.49, 1.34) | 0.39 |
| Model 36 | 1.00 (ref.) | 0.55 (0.28, 1.08) | 0.53 (0.30, 0.94) | 0.85 (0.51, 1.44) | 0.33 |
| Flavan-3-ols | (n = 419/29) | (n = 421/30) | (n = 840/39) | (n = 1120/60) | |
| Model 14 | 1.00 (ref.) | 1.10 (0.65, 1.85) | 0.71 (0.43, 1.16) | 0.76 (0.47, 1.22) | 0.23 |
| Model 25 | 1.00 (ref.) | 1.06 (0.63, 1.80) | 0.62 (0.37, 1.04) | 0.68 (0.41, 1.11) | 0.13 |
| Model 36 | 1.00 (ref.) | 1.01 (0.58, 1.74) | 0.61 (0.36, 1.03) | 0.69 (0.41, 1.14) | 0.21 |
| Anthocyanins | (n = 420/38) | (n = 420/28) | (n = 839/58) | (n = 1121/34) | |
| Model 14 | 1.00 (ref.) | 0.59 (0.36, 0.97) | 0.62 (0.40, 0.95) | 0.28 (0.17, 0.46) | <0.001 |
| Model 25 | 1.00 (ref.) | 0.55 (0.33, 0.90) | 0.60 (0.39, 0.93) | 0.23 (0.13, 0.38) | <0.001 |
| Model 36 | 1.00 (ref.) | 0.51 (0.31, 0.86) | 0.54 (0.34, 0.86) | 0.20 (0.11, 0.36) | <0.001 |
| Flavonoid polymers | (n = 419/26) | (n = 421/30) | (n = 840/45) | (n = 1120/57) | |
| Model 14 | 1.00 (ref.) | 1.02 (0.59, 1.74) | 0.74 (0.45, 1.24) | 0.68 (0.41, 1.14) | 0.10 |
| Model 25 | 1.00 (ref.) | 1.00 (0.58, 1.71) | 0.65 (0.39, 1.10) | 0.61 (0.36, 1.02) | 0.05 |
| Model 36 | 1.00 (ref.) | 0.98 (0.56, 1.72) | 0.66 (0.38, 1.14) | 0.64 (0.37, 1.10) | 0.11 |
| Total flavonoids | (n = 420/24) | (n = 420/22) | (n = 840/51) | (n = 1120/61) | |
| Model 14 | 1.00 (ref.) | 0.80 (0.45, 1.45) | 0.94 (0.57, 1.57) | 0.78 (0.46, 1.32) | 0.40 |
| Model 25 | 1.00 (ref.) | 0.77 (0.42, 1.39) | 0.85 (0.50, 1.43) | 0.68 (0.39, 1.16) | 0.19 |
| Model 36 | 1.00 (ref.) | 0.72 (0.39, 1.34) | 0.87 (0.51, 1.50) | 0.71 (0.40, 1.25) | 0.31 |
Mean follow-up time of 19.7 y.
P values for the test of linear trend across percentile categories were based on linear regression models with the median intake of each percentile category assigned to individuals with intake in that category, and this percentile median variable was used as a continuous measure in regression models.
n represents the number of participants/AD events per percentile category for model 1.
Model 1 adjusted for age, sex, education, apoE ε4, and total energy intake; total n = 2800; n AD events = 158.
Model 2 adjusted for model 1 covariates + physical activity index, smoking status, BMI, prevalent stroke, diabetes, hypertension, and hypercholesterolemia; total n = 2796; n AD events = 155.
Model 3 adjusted for model 1 and model 2 covariates + overall dietary quality, vitamin and mineral supplement use, and dietary intakes of alcohol, ω-3 fatty acids (EPA and DHA), lutein, and zeaxanthin; total n = 2794; n AD events = 153.
To determine if declining cognitive function in the years prior to ADRD diagnosis might affect the quality of dietary reporting, we performed a sensitivity analysis extending the length of time between flavonoid intake assessment (i.e., stopping the update of cumulative flavonoid intake) and ADRD diagnosis from 5 y (1825 d) to 10 y (3650 d). The change in lag time between ADRD diagnosis and the update of flavonoid intake resulted in the loss of 55 ADRD cases because their lag times were prior to their baseline exams. However, stopping the update of flavonoid intake at a minimum of 10 y prior to diagnosis did not substantially alter the associations between the 3 aforementioned flavonoid classes and risk of ADRD, although the associations with flavonoid polymers were modestly attenuated (Supplemental Table 2, model 3). We also observed significant protective associations with higher total flavonoid intakes, which is a finding that we did not observe with our primary analyses. Individuals with the highest intakes (>60th percentile) of total flavonoids were ∼40% less likely to develop ADRD (HR: 0.58; 95% CI: 0.32, 1.08; P-trend = 0.05) than individuals who had the lowest intakes (≤15th percentile) (Supplemental Table 2, model 3). Further, we performed sensitivity analyses to examine the influence of age at ADRD diagnosis on the associations with flavonoid intake. We observed stronger inverse associations between intakes of total flavonoids and the flavonoid classes flavonols, anthocyanins, and flavonoid polymers, and risk of ADRD among those diagnosed with ADRD at ≥80 y relative to those diagnosed at <80 y (data not shown). In those aged <80 y the association with anthocyanins persisted whereas the associations with total flavonoids and the other flavonoid classes were attenuated. We also examined the modification of the observed associations by baseline age, sex, and presence of the apoE ε4 allele and did not see any significant interactions (data not shown). Additionally, removing participants who were identified as impaired or having unclassified dementia from the analyses did not change the results (data not shown).
Discussion
Our findings provide new evidence that diets higher in flavonols, anthocyanins, and flavonoid polymers are associated with a lower risk of developing ADRD. These associations were sustained after accounting for a variety of potential confounders including key nutrients related to ADRD risk and overall diet quality. Similar findings were seen with AD risk for flavonols and anthocyanins but the association with flavonoid polymers was no longer statistically significant. We cannot, however, rule out associations between flavonoid polymers and AD risk because we observed a 36% lower AD risk for participants with the highest polymer intakes relative to those with the lowest intakes. Similarly, we cannot rule out associations between total flavonoids and flavan-3-ols and ADRD or AD risk because we observed a ∼30% decreased risk of ADRD and/or AD for participants with the highest intakes of these flavonoid classes. Although these associations were not statistically significant in our primary analyses, associations of this magnitude could be critical in terms of their public health impact. We observed modest differences between the results of the analyses based on the 5-y and 10-y lag times for updating flavonoid intake. This could be a consequence of either a small impact of cognitive decline on the dietary assessment for the 5-y lag or the exclusion of ∼30% of the ADRD cases with the 10-y lag.
The 5 earlier prospective observational studies that have examined the relation between flavonoid intake and ADRD risk revealed mixed results (26–29, 49). All earlier studies had ≥1 of the following limitations: 1) misclassification of flavonoid intakes due to use of flavonoid databases that were incomplete and/or limited to a few flavonoid classes; 2) use of an inadequate dietary assessment method, such as a single-day dietary recall, to characterize usual flavonoid intake; 3) assessment of diet only at baseline to characterize flavonoid intake over long follow-up periods resulting in regression dilution bias (50, 51); 4) low statistical power due to small numbers of incident ADRD cases; 5) bias due to failure to consider the possible impact of predementia cognitive decline on dietary habits or diet assessment; or 6) confounding due to failure to account for overall diet quality because higher flavonoid intakes are associated with healthier diets (52). Two of the studies observed a lower risk of ADRD and AD with higher flavonoid intake in the overall sample (26) or in smokers only (27). However, among other limitations, incomplete flavonoid assessment was clearly demonstrated by the overall low “total” flavonoid intakes (means of 14.4 and 28.5 mg/d), neither study adequately accounted for overall diet quality, and only 1 of these studies (27) accounted for the possible impact of impaired cognitive function on the assessment of flavonoid intakes. The 3 studies that failed to observe any associations between flavonoid intakes and ADRD risk (28, 29, 49) only assessed baseline flavonoid intake despite mean follow-up periods of ∼10–30 y. Two of these studies used a single 24-h dietary recall to characterize flavonoid intake (28, 49). Whereas 1 of these studies used complete flavonoid data (mean flavonoid intake of 500 mg/d) (49), the other 2 characterized flavonoid intake based on either a limited flavonoid database (median flavonoid intake of 27.6 mg/d) (29) or only on tea intake (mean flavonoid intake of 4.1 mg/d) (28). The beneficial associations observed in prior studies could be a result of bias associated with failure to account for confounding by diet quality or potential impact of cognitive impairment on dietary assessment, whereas the negative studies are likely a result of misclassification of flavonoid intakes based on the dietary assessment method or regression dilution bias.
Although earlier evidence from in vitro studies suggested that the beneficial neuroprotective effect of flavonoids is due to their antioxidant potential (53), either by means of their ability to scavenge reactive species or through influence on intracellular redox status (54), more recent evidence has emerged that flavonoids are more likely to exert favorable cognitive effects by protecting neurons from neurotoxins and combating neuroinflammation (55–57). Two major direct and indirect mechanisms seem to account for these favorable effects. Flavonoids and some of their metabolites interact with essential protein and lipid kinase signaling cascades in the brain resulting in the inhibition of neurotoxin-induced apoptosis as well as the promotion of neuronal viability. Also, flavonoids and some of their metabolites cause favorable changes in cerebrovascular blood flow, which in turn induce angiogenesis and neurogenesis (56, 58–60). It is believed that, via these mechanisms, intake of flavonoid-rich foods over the lifespan could hold promise in preventing or minimizing age-associated cognitive decline.
We attempted to address the shortcomings of the earlier observational studies of the relation between flavonoid intake and ADRD risk. To address misclassification of flavonoid intakes, the greatest shortcoming of most of the earlier studies, we were able to use more complete flavonoid databases to better capture flavonoid intake providing a mean dietary intake of total flavonoids that was much higher than that in most previous observational studies. To address the issue of potential regression dilution bias, we assessed flavonoid intake multiple times (≤5) over a relatively long follow-up period (mean 19.7 y). Evidence suggests that individuals who are diagnosed with ADRD display cognitive deficits years before a clinical diagnosis is made (61). As a result, the diet assessment closer to ADRD diagnosis could be affected by changes to usual diet or the ability to accurately report diet, leading to somewhat weaker associations. Therefore, we used a 5-y cutoff to determine when to stop updating the dietary intakes of subjects who were diagnosed with ADRD. Results of our sensitivity analyses also implied that it is very unlikely that we have misclassified the habitual flavonoid intakes of subjects with ADRD. Because higher flavonoid intakes are associated with healthier dietary patterns (62), we also believe it is critical to account for the relation between flavonoid intakes and healthier diets when examining the association between their intake and ADRD incidence. We adjusted not only for overall diet quality but also for other nutrients that are also associated with a healthy diet and ADRD risk.
Although we were able to address many limitations seen in earlier studies of flavonoid intake and ADRD, our findings were not without limitations. We were unable to assess the independent contributions of the individual flavonoid classes to ADRD incidence because of the relatively strong correlations between intakes of many of the individual flavonoids due to the common food sources. The main sources of flavones and flavanones are citrus fruits, whereas apples and tea are the most common sources of flavonols, flavan-3-ols, and flavonoid polymers. Furthermore, the nonlinear nature of the association between the flavonoid intakes and ADRD and AD did not allow for simple continuous or categorical modeling. To properly capture the nonlinearity, we used narrower intake categories at lower flavonoid intakes, resulting in fewer participants in those categories. This could have limited our statistical power to detect more modest associations. Also, as a consequence of the nonlinearity, our flavonoid category cutoff values were not predesignated but data-driven. Our analyses were also limited in that we could not account for certain ADRD risk factors because they were not available to us, such as cognitive status at young ages (63) and depression status (64). Therefore, residual confounding cannot be ruled out. Focusing on the flavonoid components alone independent of their presence in the overall diet is another limitation of our work because we might have failed to detect the synergistic or antagonistic interactions between flavonoids and other nutrients in the diet (65). A final limitation is the generalizability of our results, because essentially all participants of the FHS Offspring cohort were white and of European descent.
In conclusion, our findings are an important addition to the limited evidence that higher long-term flavonoid intake could reduce the risk of ADRD and AD. These findings also add to the evidence that diet could be an important contributor to ADRD and AD risk. Future studies in larger and more racially and ethnically diverse subjects are warranted to confirm our findings.
Supplementary Material
Acknowledgments
We thank Ting Fang Alvin Ang from the Brain Health Research Lab/Neuropsychology Group at the FHS for his assistance with data interpretation.
The authors’ responsibilities were as follows—ES: developed the research question, designed the study, carried out the data analyses, and drafted the manuscript; GTR: assisted in data programming and guided the statistical analyses; RA, JBB, PFJ: contributed to the design of the study and provided their expertise in the dementia and flavonoid aspect of this research; PFJ: provided guidance on data interpretation and analysis and had primary responsibility for final content; and all authors contributed to the interpretation of the study findings and editing, and read and approved the final manuscript. The authors report no conflicts of interest.
Notes
This research was supported in part by the USDA Agricultural Research Service (ARS), Agreement No. #58-1950-4-003; the National Heart Lung and Blood Institute by contract No. HHSN2682015000011; the National Institute on Aging by AG008122, AG016495, and AG062109; the National Institute of Neurological Disorders and Stroke, NS017950; and the Embassy of the State of Kuwait (to ES).
The views expressed in this article are of those of the authors and do not necessarily represent the views of the funding organizations.
Data described in the manuscript, code book, and analytic code will not be made available because the authors are prohibited from distributing or transferring the data and codebooks on which their research was based to any other individual or entity under the terms of an approved NHLBI Framingham Heart Study Research Proposal and Data and Materials Distribution Agreement through which the authors obtained these data.
Supplemental Figure 1 and Supplemental Tables 1 and 2 are available from the “Supplementary data” link in the online posting of the article and from the same link in the online table of contents at https://academic.oup.com/ajcn/.
Abbreviations used: AD, Alzheimer disease; ADRD, Alzheimer disease and related dementias; DGAI, Dietary Guidelines for Americans Adherence Index; DSM-IV, Diagnostic and Statistical Manual of Mental Disorders, fourth edition; FHS, Framingham Heart Study; Mets, metabolic equivalents; NINCDS-ADRDA, National Institute of Neurological and Communicative Diseases and Stroke and the Alzheimer's Disease and Related Disorders Association; NP, neuropsychological; PAI, physical activity index; TEI, total energy intake.
Contributor Information
Esra Shishtar, Nutritional Epidemiology Program, Jean Mayer USDA Human Nutrition Research Center on Aging, Tufts University, Boston, MA, USA; The Friedman School of Nutrition Science and Policy, Tufts University, Boston, MA, USA.
Gail T Rogers, Nutritional Epidemiology Program, Jean Mayer USDA Human Nutrition Research Center on Aging, Tufts University, Boston, MA, USA.
Jeffrey B Blumberg, The Friedman School of Nutrition Science and Policy, Tufts University, Boston, MA, USA.
Rhoda Au, The Framingham Heart Study, Boston University School of Medicine, Boston, MA, USA; Department of Anatomy and Neurobiology, Boston University School of Medicine, Boston, MA, USA; Department of Neurology, Boston University School of Medicine, Boston, MA, USA; Department of Epidemiology, Boston University School of Public Health, Boston, MA, USA; Boston University Alzheimer's Disease Center, Boston, MA, USA.
Paul F Jacques, Nutritional Epidemiology Program, Jean Mayer USDA Human Nutrition Research Center on Aging, Tufts University, Boston, MA, USA; The Friedman School of Nutrition Science and Policy, Tufts University, Boston, MA, USA.
References
- 1. Anderson LA, Goodman RA, Holtzman D, Posner SF, Northridge ME. Aging in the United States: opportunities and challenges for public health. Am J Public Health. 2012;102:393–5. [DOI] [PMC free article] [PubMed] [Google Scholar]
- 2. US Census Bureau. The Baby Boom cohort in the United States: 2012 to 2060 [Internet]. [cited August 6, 2019]. Available from: https://www.census.gov/library/publications/2014/demo/p25-1141.html. [Google Scholar]
- 3. US Census Bureau. Older people projected to outnumber children [Internet]. [cited May 17, 2019]. Available from: https://www.census.gov/newsroom/press-releases/2018/cb18-41-population-projections.html. [Google Scholar]
- 4. Langa KM. Cognitive aging, dementia, and the future of an aging population [Internet]. National Academies Press (US); 2018.; [cited May 17, 2019]. Available from: https://www.ncbi.nlm.nih.gov/books/NBK513075/. [Google Scholar]
- 5. World Health Organization. Ageing and health [Internet]. [cited May 18, 2019]. Available from: https://www.who.int/news-room/fact-sheets/detail/ageing-and-health.
- 6. WHO and Alzheimer's Disease International. Dementia: a public health priority [Internet] WHO; 2012. [cited May 18, 2019]. Available from: http://www.who.int/mental_health/publications/dementia_report_2012/en/. [Google Scholar]
- 7. Alzheimer's Association. 2017 Alzheimer's disease facts and figures. Alzheimers Dement (N Y) 2017;13:325–73. [Google Scholar]
- 8. Rakesh G, Szabo ST, Alexopoulos GS, Zannas AS. Strategies for dementia prevention: latest evidence and implications. Ther Adv Chronic Dis. 2017;8:121–36. [DOI] [PMC free article] [PubMed] [Google Scholar]
- 9. Hu N, Yu J-T, Tan L, Wang Y-L, Sun L, Tan L. Nutrition and the risk of Alzheimer's disease. BioMed Res Int. 2013;2013:524820. [DOI] [PMC free article] [PubMed] [Google Scholar]
- 10. Safouris A, Tsivgoulis G, Sergentanis TN, Psaltopoulou T. Mediterranean diet and risk of dementia. Curr Alzheimer Res. 2015;12:736–44. [DOI] [PubMed] [Google Scholar]
- 11. Anastasiou CA, Yannakoulia M, Kosmidis MH, Dardiotis E, Hadjigeorgiou GM, Sakka P, Arampatzi X, Bougea A, Labropoulos I, Scarmeas N. Mediterranean diet and cognitive health: initial results from the Hellenic Longitudinal Investigation of Ageing and Diet. PLoS One. 2017;12:e0182048. [DOI] [PMC free article] [PubMed] [Google Scholar]
- 12. Berti V, Walters M, Sterling J, Quinn CG, Logue M, Andrews R, Matthews DC, Osorio RS, Pupi A, Vallabhajosula S et al. Mediterranean diet and 3-year Alzheimer brain biomarker changes in middle-aged adults. Neurology. 2018;90:e1789–98. [DOI] [PMC free article] [PubMed] [Google Scholar]
- 13. Petersson SD, Philippou E. Mediterranean diet, cognitive function, and dementia: a systematic review of the evidence. Adv Nutr. 2016;7:889–904. [DOI] [PMC free article] [PubMed] [Google Scholar]
- 14. Valls-Pedret C, Lamuela-Raventós RM, Medina-Remón A, Quintana M, Corella D, Pintó X, Martínez-González MÁ, Estruch R, Ros E. Polyphenol-rich foods in the Mediterranean diet are associated with better cognitive function in elderly subjects at high cardiovascular risk. J Alzheimers Dis. 2012;29:773–82. [DOI] [PubMed] [Google Scholar]
- 15. Kozłowska A, Szostak-Wegierek D. Flavonoids—food sources and health benefits. Rocz Panstw Zakl Hig. 2014;65:79–85. [PubMed] [Google Scholar]
- 16. Panche AN, Diwan AD, Chandra SR. Flavonoids: an overview. J Nutr Sci. 2016;5:e47. [DOI] [PMC free article] [PubMed] [Google Scholar]
- 17. Chun OK, Chung SJ, Song WO. Estimated dietary flavonoid intake and major food sources of U.S. adults. J Nutr. 2007;137:1244–52. [DOI] [PubMed] [Google Scholar]
- 18. Bai W, Wang C, Ren C. Intakes of total and individual flavonoids by US adults. Int J Food Sci Nutr. 2014;65:9–20. [DOI] [PubMed] [Google Scholar]
- 19. Escobar‐Cscoba R, Castro‐Espas C, BCpast V, Buckland G, Zamora‐Ros R. Flavonoids - from biosynthesis to human health. In: An overview of global flavonoid intake and its food sources (2017). doi:10.5772/67655.
- 20. Scholey AB, French SJ, Morris PJ, Kennedy DO, Milne AL, Haskell CF. Consumption of cocoa flavanols results in acute improvements in mood and cognitive performance during sustained mental effort. J Psychopharmacol. 2010;24:1505–14. [DOI] [PubMed] [Google Scholar]
- 21. Field DT, Williams CM, Butler LT. Consumption of cocoa flavanols results in an acute improvement in visual and cognitive functions. Physiol Behav. 2011;103:255–60. [DOI] [PubMed] [Google Scholar]
- 22. Whyte AR, Williams CM. Effects of a single dose of a flavonoid-rich blueberry drink on memory in 8 to 10 y old children. Nutrition. 2015;31:531–4. [DOI] [PubMed] [Google Scholar]
- 23. Barfoot KL, May G, Lamport DJ, Ricketts J, Riddell PM, Williams CM. The effects of acute wild blueberry supplementation on the cognition of 7–10-year-old schoolchildren. Eur J Nutr. 2019;58(7):2911–20. [DOI] [PMC free article] [PubMed] [Google Scholar]
- 24. Alharbi MH, Lamport DJ, Dodd GF, Saunders C, Harkness L, Butler LT, Spencer JP. Flavonoid-rich orange juice is associated with acute improvements in cognitive function in healthy middle-aged males. Eur J Nutr. 2016;55:2021–9. [DOI] [PMC free article] [PubMed] [Google Scholar]
- 25. Lamport DJ, Pal D, Macready AL, Barbosa-Boucas S, Fletcher JM, Williams CM, Spencer JP, Butler LT. The effects of flavanone-rich citrus juice on cognitive function and cerebral blood flow: an acute, randomised, placebo-controlled cross-over trial in healthy, young adults. Br J Nutr. 2016;116:2160–8. [DOI] [PubMed] [Google Scholar]
- 26. Commenges D, Scotet V, Renaud S, Jacqmin-Gadda H, Barberger-Gateau P, Dartigues JF. Intake of flavonoids and risk of dementia. Eur J Epidemiol. 2000;16:357–63. [DOI] [PubMed] [Google Scholar]
- 27. Engelhart MJ, Geerlings MI, Ruitenberg A, van Swieten JC, Hofman A, Witteman JC, Breteler MM. Dietary intake of antioxidants and risk of Alzheimer disease. JAMA. 2002;287:3223–9. [DOI] [PubMed] [Google Scholar]
- 28. Laurin D, Masaki KH, Foley DJ, White LR, Launer LJ. Midlife dietary intake of antioxidants and risk of late-life incident dementia: the Honolulu-Asia Aging Study. Am J Epidemiol. 2004;159:959–67. [DOI] [PubMed] [Google Scholar]
- 29. Devore EE, Grodstein F, van Rooij FJ, Hofman A, Stampfer MJ, Witteman JC, Breteler MM. Dietary antioxidants and long-term risk of dementia. Arch Neurol. 2010;67:819–25. [DOI] [PMC free article] [PubMed] [Google Scholar]
- 30. Dawber TR, Meadors GF, Moore FE. Epidemiological approaches to heart disease: the Framingham Study. Am J Public Health Nations Health. 1951;41:279–81. [DOI] [PMC free article] [PubMed] [Google Scholar]
- 31. Feinleib M, Kannel WB, Garrison RJ, McNamara PM, Castelli WP. The Framingham Offspring Study. Design and preliminary data. Prev Med. 1975;4:518–25. [DOI] [PubMed] [Google Scholar]
- 32. Rimm EB, Giovannucci EL, Stampfer MJ, Colditz GA, Litin LB, Willett WC. Reproducibility and validity of an expanded self-administered semiquantitative food frequency questionnaire among male health professionals. Am J Epidemiol. 1992;135:1114–26.; discussion 1127–36. [DOI] [PubMed] [Google Scholar]
- 33. Feskanich D, Rimm EB, Giovannucci EL, Colditz GA, Stampfer MJ, Litin LB, Willett WC. Reproducibility and validity of food intake measurements from a semiquantitative food frequency questionnaire. J Am Diet Assoc. 1993;93:790–6. [DOI] [PubMed] [Google Scholar]
- 34. USDA Agricultural Research Service. Special interest databases on flavonoids [Internet]. [cited May 18, 2019]. Available from: https://data.nal.usda.gov/dataset/usda-special-interest-databases-flavonoids.
- 35. Cassidy A, O'Reilly EJ, Kay C, Sampson L, Franz M, Forman JP, Curhan G, Rimm EB. Habitual intake of flavonoid subclasses and incident hypertension in adults. Am J Clin Nutr. 2011;93:338–47. [DOI] [PMC free article] [PubMed] [Google Scholar]
- 36. Chun OK, Chung SJ, Song WO. Urinary isoflavones and their metabolites validate the dietary isoflavone intakes in US adults. J Am Diet Assoc. 2009;109:245–54. [DOI] [PubMed] [Google Scholar]
- 37. de Kleijn MJ, van der Schouw YT, Wilson PW, Adlercreutz H, Mazur W, Grobbee DE, Jacques PF. Intake of dietary phytoestrogens is low in postmenopausal women in the United States: the Framingham study(1-4). J Nutr. 2001;131:1826–32. [DOI] [PubMed] [Google Scholar]
- 38. Bell CC. DSM-IV: Diagnostic and Statistical Manual of Mental Disorders. JAMA. 1994;272:828–9. [Google Scholar]
- 39. McKhann G, Drachman D, Folstein M, Katzman R, Price D, Stadlan EM. Clinical diagnosis of Alzheimer's disease: report of the NINCDS-ADRDA Work Group under the auspices of Department of Health and Human Services Task Force on Alzheimer's Disease. Neurology. 1984;34:939–44. [DOI] [PubMed] [Google Scholar]
- 40. Lee DS, Gona P, Albano I, Larson MG, Benjamin EJ, Levy D, Kannel WB, Vasan RS. A systematic assessment of causes of death after heart failure onset in the community: impact of age at death, time period, and left ventricular systolic dysfunction. Circ Heart Fail. 2011;4:36–43. [DOI] [PMC free article] [PubMed] [Google Scholar]
- 41. Baumgart M, Snyder HM, Carrillo MC, Fazio S, Kim H, Johns H. Summary of the evidence on modifiable risk factors for cognitive decline and dementia: a population-based perspective. Alzheimers Dement. 2015;11:718–26. [DOI] [PubMed] [Google Scholar]
- 42. van der Flier WM, Scheltens P. Epidemiology and risk factors of dementia. J Neurol Neurosurg Psychiatry. 2005;76:v2–7. [DOI] [PMC free article] [PubMed] [Google Scholar]
- 43. Solfrizzi V, Panza F, Frisardi V, Seripa D, Logroscino G, Imbimbo BP, Pilotto A. Diet and Alzheimer's disease risk factors or prevention: the current evidence. Expert Rev Neurother. 2011;11:677–708. [DOI] [PubMed] [Google Scholar]
- 44. Yaffe K. Modifiable risk factors and prevention of dementia: what is the latest evidence?. JAMA Intern Med. 2018;178:281–2. [DOI] [PubMed] [Google Scholar]
- 45. Kannel WB, Sorlie P. Some health benefits of physical activity. The Framingham Study. Arch Intern Med. 1979;139:857–61. [PubMed] [Google Scholar]
- 46. Sauder KA, Proctor DN, Chow M, Troy LM, Wang N, Vita JA, Vasan RS, Mitchell GF, Jacques PF, Hamburg NM et al. Endothelial function, arterial stiffness and adherence to the 2010 Dietary Guidelines for Americans: a cross-sectional analysis. Br J Nutr. 2015;113:1773–81. [DOI] [PMC free article] [PubMed] [Google Scholar]
- 47. Dufouil C, Beiser A, McLure LA, Wolf PA, Tzourio C, Howard VJ, Westwood AJ, Himali JJ, Sullivan L, Aparicio HJ et al. Revised Framingham stroke risk profile to reflect temporal trends. Circulation. 2017;135:1145–59. [DOI] [PMC free article] [PubMed] [Google Scholar]
- 48. Rossor MN, Fox NC, Mummery CJ, Schott JM, Warren JD. The diagnosis of young-onset dementia. Lancet Neurol. 2010;9:793–806. [DOI] [PMC free article] [PubMed] [Google Scholar]
- 49. Lefèvre-Arbogast S, Gaudout D, Bensalem J, Letenneur L, Dartigues J-F, Hejblum BP, Féart C, Delcourt C, Samieri C. Pattern of polyphenol intake and the long-term risk of dementia in older persons. Neurology. 2018;90:e1979–88. [DOI] [PubMed] [Google Scholar]
- 50. Lewington S, Thomsen T, Davidsen M, Sherliker P, Clarke R. Regression dilution bias in blood total and high-density lipoprotein cholesterol and blood pressure in the Glostrup and Framingham prospective studies. J Cardiovasc Risk. 2003;10:143–8. [DOI] [PubMed] [Google Scholar]
- 51. Clarke R, Lewington S, Donald A, Johnston C, Refsum H, Stratton I, Jacques P, Breteler MM, Holman R. Underestimation of the importance of homocysteine as a risk factor for cardiovascular disease in epidemiological studies. J Cardiovasc Risk. 2001;8:363–9. [DOI] [PubMed] [Google Scholar]
- 52. Sebastian RS, Wilkinson Enns C, Goldman JD, Martin CL, Steinfeldt LC, Murayi T, Moshfegh AJ. A new database facilitates characterization of flavonoid intake, sources, and positive associations with diet quality among US adults. J Nutr. 2015;145:1239–48. [DOI] [PMC free article] [PubMed] [Google Scholar]
- 53. Rice-Evans CA, Miller NJ, Paganga G. Structure-antioxidant activity relationships of flavonoids and phenolic acids. Free Radic Biol Med. 1996;20:933–56. [DOI] [PubMed] [Google Scholar]
- 54. Pollard S, Kuhnle G, Vauzour D, Vafeiadou K, Tzounis X, Whiteman M, Rice-Evans C, Spencer J. The reaction of flavonoid metabolites with peroxynitrite. Biochem Biophys Res Commun. 2007;350:960–8. [DOI] [PubMed] [Google Scholar]
- 55. Spencer JPE. Flavonoids: modulators of brain function?. Br J Nutr. 2008;99(E Suppl 1):ES60–77. [DOI] [PubMed] [Google Scholar]
- 56. Vauzour D, Vafeiadou K, Rodriguez-Mateos A, Rendeiro C, Spencer JPE. The neuroprotective potential of flavonoids: a multiplicity of effects. Genes Nutr. 2008;3:115–26. [DOI] [PMC free article] [PubMed] [Google Scholar]
- 57. Vauzour D. Dietary polyphenols as modulators of brain functions: biological actions and molecular mechanisms underpinning their beneficial effects. Oxid Med Cell Longev [Internet]. 2012. doi:10.1155/2012/914273/. [DOI] [PMC free article] [PubMed] [Google Scholar]
- 58. Spencer JP, Vauzour D, Rendeiro C. Flavonoids and cognition: the molecular mechanisms underlying their behavioural effects. Arch Biochem Biophys. 2009;492:1–9. [DOI] [PubMed] [Google Scholar]
- 59. Williams RJ, Spencer JP.. Flavonoids, cognition, and dementia: actions, mechanisms, and potential therapeutic utility for Alzheimer disease. Free Radic Biol Med. 2012;52:35–45. [DOI] [PubMed] [Google Scholar]
- 60. Rendeiro C, Rhodes JS, Spencer JP. The mechanisms of action of flavonoids in the brain: direct versus indirect effects. Neurochem Int. 2015;89:126–39. [DOI] [PubMed] [Google Scholar]
- 61. Bäckman L. Memory and cognition in preclinical dementia: what we know and what we do not know. Can J Psychiatry. 2008;53:354–60. [DOI] [PubMed] [Google Scholar]
- 62. Sebastian R, Wilkinson Enns C, Goldman J, Moshfegh A. Flavonoid intakes are predictive of dietary quality and most components of the healthy eating index 2010. FASEB J. 2015;29:250.7.25342131 [Google Scholar]
- 63. Seifan A, Schelke M, Obeng-Aduasare Y, Isaacson R. Early life epidemiology of Alzheimer's disease – a critical review. Neuroepidemiology. 2015;45:237–54. [DOI] [PMC free article] [PubMed] [Google Scholar]
- 64. Muliyala KP, Varghese M. The complex relationship between depression and dementia. Ann Indian Acad Neurol. 2010;13:S69–73. [DOI] [PMC free article] [PubMed] [Google Scholar]
- 65. Tapsell LC, Neale EP, Satija A, Hu FB. Foods, nutrients, and dietary patterns: interconnections and implications for Dietary Guidelines12. Adv Nutr. 2016;7:445–54. [DOI] [PMC free article] [PubMed] [Google Scholar]
Associated Data
This section collects any data citations, data availability statements, or supplementary materials included in this article.