

ABSTRACT
Background
The Western dietary pattern (WD) is positively associated with risk of coronary artery disease (CAD) and cancer, whereas the Prudent dietary pattern (PD) may be protective. Foods may influence metabolite concentrations as well as oxidative stress and lipid dysregulation, biological mechanisms associated with CAD and cancer.
Objective
The aim was to assess the association of 2 derived dietary pattern scores with serum metabolites and identify metabolic pathways associated with the metabolites.
Methods
We evaluated the cross-sectional association between each dietary pattern (WD, PD) and metabolites in 2199 Women's Health Initiative (WHI) participants. With FFQ and factor analysis, we determined 2 dietary patterns consistent with WD and PD. Metabolites were measured with LC–tandem MS. Metabolite discovery among 904 WHI Observational Study (WHI-OS) participants was replicated among 1295 WHI Hormone Therapy Trial (WHI-HT) participants. We analyzed each of 495 metabolites with each dietary score (WD, PD) in linear regression models.
Results
The PD included higher vegetables and fruit intake compared with the WD with higher saturated fat and meat intake. Independent of energy intake, BMI, physical activity, and other confounding variables, 45 overlapping metabolites were identified (WHI-OS) and replicated (WHI-HT) with an opposite direction of associations for the WD compared with the PD [false discovery rate (FDR) P < 0.05]. In metabolite set enrichment analyses, phosphatidylethanolamine (PE) plasmalogens were positively enriched for association with WD [normalized enrichment score (NES) = 2.01, P = 0.001, FDR P = 0.005], and cholesteryl esters (NES = −1.77, P = 0.005, FDR P = 0.02), and phosphatidylcholines (NES = −1.72, P = 0.01, P = 0.03) were negatively enriched for WD. PE plasmalogens were positively correlated with saturated fat and red meat. Phosphatidylcholines and cholesteryl esters were positively correlated with fatty fish.
Conclusions
Distinct metabolite signatures associated with Western and Prudent dietary patterns highlight the positive association of mitochondrial oxidative stress and lipid dysregulation with a WD and the inverse association with a PD.
Keywords: Western diet, Prudent diet, lipidomics, metabolomics, plasmalogens, women
Introduction
The Western dietary pattern (WD) is positively associated with the risk of coronary artery disease (CAD) and cancer, whereas the Prudent dietary pattern (PD) may be protective. Epidemiologic studies support the association between a WD, high in saturated fat and added sugars and low in fruits and vegetables, and increased CAD and cancer, diseases with underlying oxidative stress, insulin resistance, and lipid dysregulation (1–3). Alternatively, a healthy diet rich in fruits and vegetables has been associated with lower risk of all-cause death and CAD events in several large general-population cohorts (4, 5). Similarly, a comparative risk assessment of the global burden of disease identified dietary patterns low in fruits and vegetables as 1 of the 5 leading risk factors for global disease burden and total mortality worldwide (6). The examination of dietary patterns, instead of individual foods, captures interactions between specific foods as well as the combined influence of several dietary components on disease risk (7).
Dietary patterns have a complex impact on metabolism, resulting in signatures of metabolites in circulation (8). Plasma metabolite concentrations have been shown to correlate with self-reported intake of certain nutrients (9). The WHO Global Strategy on Diet, Physical Activity, and Health focuses on improving diet quality by emphasizing dietary patterns that decrease added sugar and increase intake of whole-grain cereals, fruits, and vegetables (10). Identifying metabolites associated with deleterious and healthy dietary patterns may provide insights into the biological mechanisms that link dietary patterns with CAD and cancer and guide population-based policies for improving dietary patterns to reduce disease burden. We sought to characterize metabolites associated with WD or PD. Few studies (11–14) have examined metabolites measured using MS or NMR methods and their associations with a WD (11) or PD. We hypothesized that dietary intake patterns are reflected in unique metabolite profiles linked to underlying metabolic pathways associated with oxidative stress, insulin resistance, and lipid dysregulation.
Methods
Our analyses utilized data from the Women's Health Initiative (WHI) nested case-control study of CAD with 2306 participants from the WHI–Observational Study (WHI-OS) and WHI–Hormone Therapy Trial (WHI-HT), as previously described (15) (Supplemental Figure 1, Supplemental Table 1). Participants from WHI-OS and WHI-HT were frequency matched on 5-y age, race/ethnicity, hysterectomy status, and 2-y enrollment window. This study was approved by Partners Human Research Committee, which is the institutional review board of Brigham and Women's Hospital. All participants provided written informed consent.
Discovery population
The metabolite pattern discovery cohort was drawn from the WHI-OS, consisting of 93,676 postmenopausal women ineligible or unwilling to participate in the related hormone trials, enrolled between 1994 and 1998 in the United States. A total of 944 women in the WHI-OS had fasting metabolite profiles measured (Supplemental Figure 1).
Replication population
The WHI-HT randomly assigned 16,608 postmenopausal women with an intact uterus to estrogen plus progesterone or placebo and 10,739 women with prior hysterectomy to estrogen or placebo. A total of 1362 individuals had available metabolite profiles and included frequency-matched controls selected from the 2 placebo arms. All samples were collected prior to hormone therapy randomization.
In our analyses, we excluded women with implausible total energy intake values (≤600 kcal/d or ≥5000 kcal/d; n = 86), very low or very high BMI values (in kg/m2; <15 or >50; n = 11), and individuals with missing dietary data (n = 6). After exclusions, the analytic dataset included 2199 women (Supplemental Figure 1): 904 in the WHI-OS (discovery dataset) (Supplemental Table 2) and 1295 in the WHI-HT (replication dataset) (Supplemental Table 3). This study uses blood drawn at baseline and all participants were free of CAD at baseline. All participants in this analysis were asked to fast and underwent a morning blood collection.
Metabolomics
Plasma samples were collected in EDTA-coated tubes. Specimens were stored in a −70°C freezer within 2 h of collection or stored at −20°C for ≤2 d and mailed on dry ice and stored at −70°C until processing. Metabolomic measurements were performed at the Broad Institute (Boston, MA) with 4 LC–tandem MS methods described in detail elsewhere (15), yielding 509 metabolites (Supplemental Table 4). For each method, pooled plasma reference samples were included every 20 samples. Results were standardized using the ratio of the value of the sample to the value of the nearest pooled reference multiplied by the median of all reference values for the metabolite.
Lipids data (polar and nonpolar lipids) were measured as described in Rhee et al. (16). Positive ionization mode data [acyl carnitines (ACs), amino acids, peptides, derivatives, and others] were measured as described in Wang et al. (17), and negative ionization mode data (sugars, sugar phosphates, purine, pyrimidines, and others) were assayed as described in Bajad et al. (18). With the use of MultiQuant 1.2 software (AB SCIEX), metabolites were identified and quantified (19). All signals were inspected to ensure quality and integration, and a signal-to-noise ratio <10 was considered unquantifiable (16–18). For each method, metabolite identities were confirmed using authentic reference standards or reference samples. CVs were calculated using pooled plasma samples from the first 800 WHI-OS participants (15). After excluding metabolites that failed unadjusted linear model (metabolite as outcome and dietary score as exposure) convergence (14 metabolites failed unadjusted linear models for convergence due to missing data: missing data ranged between 24% and 99%; missing data was not imputed), 495 known metabolites were retained for analyses. In the pilot testing of the metabolomics platform, 92% of metabolites had acceptable assay reproducibility (CV <20%) and almost 90% of metabolites were stable over 1 to 2 y [Spearman correlation or intraclass correlation coefficient (ICC) ≥0.4]. x:y notation was used where x denotes the number of carbons in the side chain and y the number of double bonds.
Statistical analysis
Derived dietary pattern scores
The WHI dietary assessment and food grouping have been previously reported (20, 21). Briefly, dietary intakes were collected from a validated and standardized semiquantitative, self-administered, 122-item FFQ that estimates average daily nutrient intake over the previous 3-mo period (20, 21). The WHI FFQ has produced results comparable to those from four 24-h dietary recall interviews and 4 d of food diaries recorded within the WHI study population (20, 21). Vitamin and mineral supplement use was assessed with a simplified inventory procedure (20, 21).
Baseline WHI FFQ data were used to create MyPyramid Equivalents Database (MPED) food groups based on MyPyramid Equivalents Database version 2.0 (MPEDS 2.0) (22). We generated dietary patterns by factor analysis (principal components) on the basis of 26 MPED food groups (Supplemental Table 5) by means of the orthogonal rotation procedure (23). This yielded uncorrelated or independent factors (Supplemental Table 6). The factor scores were standardized, resulting in a mean of 0 and SD of 1. We determined the number of factors to retain by eigenvalue (>1) (Supplemental Table 7), Scree plot test, and factor interpretability. This factor analysis process resulted in the selection of 2 patterns that we identify as Western (rich in meat, saturated fats, and refined carbohydrates) and “Prudent” (rich in fruits and vegetables), consistent with dietary patterns described by other studies (24–26). The factor score for each pattern was calculated as a linear combination of the intakes of food groups weighted by food-group–specific factor loadings, and each participant received a factor score for each identified pattern. Factor analysis was conducted with SAS PROC FACTOR (SAS Institute, Inc.). Food groups with a standardized factor loading ≥0.1 or ≤−0.1 were reported as comprising either a WD or a PD.
Metabolite discovery and replication methods
All metabolites were scaled and log-normalized, and missing values below the limit of detection were assigned to half the lowest observed value. We assessed differences in baseline characteristics across quartiles of WD and PD with the use of Kruskal-Wallis tests for continuous variables and chi-square for categorical variables. We calculated the partial Spearman correlation coefficient between each validated metabolite and each food item with an eigenvalue >0.1 in the standardized Eigen factors. The analysis plan for the Discovery and Validation data sets is outlined in Figure 1. The unadjusted model included the metabolite as the outcome and the dietary pattern (WD or PD) as the exposure. The adjusted model included the set of covariates that determined the frequency matching of CAD cases to controls [age, race/ethnicity (white, black, or other), hysterectomy status, and enrollment window], LC–tandem MS batch, case status (CAD case or control), plus traditional factors associated with dietary patterns: BMI (kg/m2) as a continuous variable, smoking status (current compared with never/past), caloric intake (kilocalories per day), exercise (metabolic equivalent-hours/week) as a continuous variable, education (less than college or at least some college), and income (< 34,999/y compared with ≥
 34,999/y; this income categorization was chosen because it reflected an approximation of the median income category), and medication use (aspirin, statins, antidiabetics, and antihypertensives).
FIGURE 1.
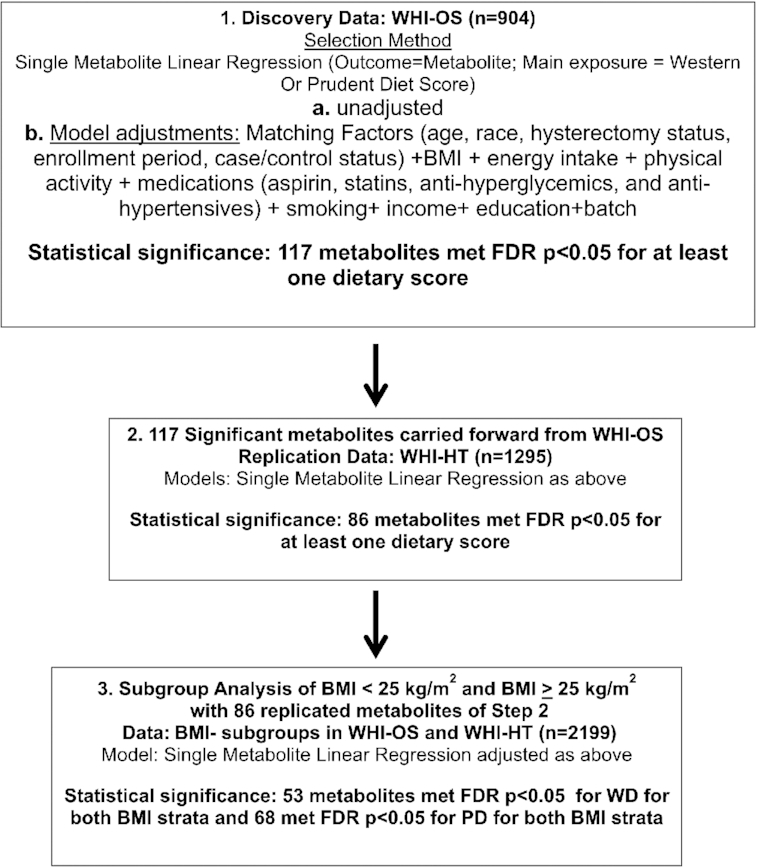
Analysis flowchart. FDR, false discovery rate; PD, Prudent dietary pattern; WD, Western dietary pattern; WHI-HT, Women's Health Initiative Hormone Therapy Trial; WHI-OS, Women's Health Initiative Observational Study.
Discovery
Metabolite associations were evaluated separately with respect to each dietary score (PD or WD). In the WHI-OS discovery data set (n = 904), single metabolite linear regression models examined the association of each metabolite (outcome) with respect to each standardized dietary score (WD, PD), which was considered the primary exposure of interest, while adjusting for potential confounders. As both metabolite concentrations and dietary scores were standardized to unit variance, the model-based regression coefficients associated with each exposure (WD, PD) reflect the average change in metabolite abundance in SD units corresponding to a 1-SD increase in dietary score.
Adjustments for multiple comparisons were based on a 2-stage step-up procedure to control the overall false discovery rate (FDR) at 5% (27). In particular, this approach allows for dependencies between the metabolites and is implemented using the “TSBH” option of the mt.rawp2adjp function in the multtest R package (R Foundation for Statistical Computing).
Statistically significant metabolite associations satisfied an FDR P value <0.05 in the adjusted model. Significant metabolites from the Discovery analyses were carried forward to the WHI-HT replication data set (Figure 1).
Replication
Replication of metabolite associations with WD or PD was conducted in the independent replication WHI-HT data set (n = 1295). Metabolite associations were evaluated separately with respect to each dietary score as described in the Discovery stage. Metabolite associations were considered to have replicated if the FDR-adjusted P value corresponding to the linear regression coefficient associated with dietary score (WD or PD) was <0.05 in the adjusted model.
We examined the correlation structure of the subset of metabolites that were associated with both WD and PD and replicated at a threshold of FDR P < 0.01. For visualizing the directions of metabolite associations with each dietary score, metabolites were grouped according to metabolite class and direction of association with WD (WD+ denotes metabolites that increase with increasing WD; WD– denotes metabolites that decrease with increasing WD). Metabolite classes included fatty acids (FAs), sphingomyelins, triacylglycerols (TAGs), phosphatidylethanolamine (PE) plasmalogens, diacylglycerols, ACs, phosphatidylcholine (PC) plasmalogens, amino acids, ceramides, PCs, lysophosphatidylethanolamines, PEs, purines and pyrimidines, cholesteryl esters (CEs), lysophosphatidylcholines (LPCs), and phosphatidylserines (Figure 2).
FIGURE 2.

Average regression coefficients corresponding to the associations of WD and PD score within metabolite sets. Linear models were adjusted for age, BMI, batch, ethnicity, enrollment time, energy intake, exercise, case-control status, smoking (current vs. past/never), income (< 34,999 vs. ≥
 34,999), education, and medication use at baseline (aspirin, statin, hypertension medications, diabetes medications) and estimated in the WHI-HT replication dataset. Metabolites were grouped according to metabolite class and direction of association with WD. Metabolite classes included FAs, SMs, TAGs, PEp, DAGs, ACs, PCp, AAs, CERs, PCs, LPEs, PEs, PUP, CEs, LPCs, and PS. AA, amino acid; AC, acyl carnitine; CE, cholesteryl ester; CER, ceramide; DAG, diacylglycerols; FA, fatty acids; LPC, lysophosphatidylcholines; LPE, lysophosphatidylethanolamines; PC, phosphatidylcholines; PCp, phosphatidylcholine plasmalogens; PD, Prudent dietary pattern; PE, phosphatidylethanolamines; PEp, phosphatidylethanolamine plasmalogens; PS, phosphatidylserines; PUP, purines and pyrimidines; SM, sphingomyelins; TAG, triacylglycerols; WD, Western dietary pattern; WD+, denotes metabolites that increase with WD; WD–, metabolites that decrease with WD.
Metabolite set enrichment analysis
The 117 metabolites that were discovered as associated with WD or PD (FDR P < 0.05) in fully adjusted models were included in metabolite set enrichment analyses (MSEA). Metabolites were grouped into metabolite sets by mapping to 26 unique metabolite classes. Of these, 11 metabolite classes comprised ≥4 metabolites each and were included in the MSEA analyses. For each dietary score (WD and PD), metabolites were ranked based on the test statistics from the fully adjusted models in the WHI-HT replication dataset—test statistics were calculated as the ratio of the regression coefficient corresponding to the dietary score to its SE. For each metabolite, a permutation P value corresponding to the MSEA enrichment score was calculated based on 10,000 permutations and adjusted for multiple testing using the Benjamini and Hochberg FDR control procedure. MSEA analyses were conducted using the fgsea R package (R Foundation for Statistical Computing).
Food and metabolite associations
We analyzed food groups associated with the replicated metabolites by Spearman rank correlation. We then analyzed the selected Western and Prudent food groups associated with the metabolites. We created a heatmap to display the Spearman rank correlation relations between foods and replicated metabolites. Heatmap profiling was based on z-score scaled data of metabolites. Partial Spearman rank correlation (P < 0.01) adjusted for age, BMI, batch, ethnicity, enrollment time, energy intake, case control status, smoking (current compared with past/never), income (< 34,999 compared with ≥
 34,999), education, medication use at baseline (aspirin, statin, hypertension medications, and diabetes medications), and exercise. R-Studio version 3.5 was used for all analyses.
Sensitivity analyses
BMI subgroup analysis was performed to identify nonhomogeneity of relations between diet score and metabolite for different levels of BMI. We performed BMI stratified analyses (BMI <25 and BMI ≥25) for the 86 validated metabolites for WD and PD in the entire cohort (n = 2199) using the fully adjusted model; we adjusted for continuous BMI within BMI strata. We performed a sensitivity analysis adjusting for multivitamin use. We performed a sensitivity analysis for exposure WD or PD and outcome as each single metabolite in the discovery and replication groups of subgroups of participants with and without the development of CAD (all participants were free of CAD at baseline).
Results
Descriptive characteristics and dietary patterns
The WD was characterized by higher intakes of saturated fat, refined grains, added-sugar products, and animal products (cheese and meat), whereas the PD was characterized by higher intakes of vegetables and fruits (Supplemental Table 6).
Table 1 shows the baseline characteristics of the 904 women in the WHI-OS discovery group (451 CAD cases and 453 controls) and the 1295 women in the WHI-HT validation group (637 cases and 658 controls) by each dietary pattern's lowest and highest quartiles. The mean age was similar in both groups (67–68 y). Women reporting the highest adherence to a WD (WD quartile 4) had higher BMI, higher C-reactive protein (CRP), and lower physical activity levels compared with those reporting lower adherence to a WD (WD quartile 1). Women with the highest adherence to a PD (PD quartile 4) had lower BMI, lower CRP, and higher physical activity levels compared with reporting lower adherence to a PD (PD quartile 1). The proportion for blacks decreased across WD quartiles (13.9 to 12.8).
TABLE 1.
Baseline characteristics of the 2199 WHI participants in observation and trial cohorts1
| Western | Prudent | |||||
|---|---|---|---|---|---|---|
| Q1 | Q4 | P | Q1 | Q4 | P | |
| n | 495 | 561 | 513 | 566 | ||
| Age, y | 69 ± 7 | 65 ± 7 | <0.001 | 66 ± 7 | 68 ± 7 | <0.001 |
| WHI-HT | 241 ± 48.7 | 374 ± 66.7 | <0.001 | 326 ± 63.5 | 292 ± 51.6 | <0.001 |
| CAD cases, n (%) | 250 (50.5) | 295 (52.6) | 0.54 | 286 (55.8) | 262 (46.3) | 0.002 |
| Current cigarette smoking, n (%) | 40 (8.2) | 75 (13.5) | 0.008 | 110 (21.9) | 40 (7.1) | <0.001 |
| Exercise, MET-h/wk | 12.5 ± 12.5 | 9.3 ± 11.9 | <0.001 | 6.8 ± 9.1 | 15.0 ± 14.0 | <0.001 |
| BMI, kg/m2 | 27.3 ± 5.3 | 30.3 ± 6.0 | <0.001 | 29.6 ± 6.1 | 28.0 ± 5.7 | <0.001 |
| Diabetes, n (%) | 61 (12.3) | 86 (15.4) | 0.18 | 65 (12.7) | 75 (13.3) | 0.85 |
| Hypertension, n (%) | 219 (44.4) | 277 (49.7) | 0.097 | 226 (44.3) | 239 (42.6) | 0.62 |
| Hysterectomy, n (%) | 238 (48.1) | 269 (48.0) | Matched | 269 (52.4) | 253 (44.7) | 0.01 |
| Aspirin use, n (%) | 133 (26.9) | 147 (26.2) | 0.86 | 120 (23.4) | 159 (28.1) | 0.09 |
| Statin use, n (%) | 77 (15.6) | 43 (7.7) | <0.001 | 50 (9.7) | 71 (12.5) | 0.18 |
| Hypertension med use, n (%) | 142 (28.7) | 174 (31.0) | 0.45 | 138 (26.9) | 150 (26.5) | 0.94 |
| Race/ethnicity, n (%) | 0.02 | <0.001 | ||||
| White (not of Hispanic origin) | 375 (75.8) | 457 (81.5) | 371 (72.3) | 480 (84.8) | ||
| Black | 69 (13.9) | 72 (12.8) | 93 (18.1) | 49 (8.7) | ||
| Not 1 of above | 51 (10.3) | 32 (5.7) | 49 (9.6) | 37 (6.5) | ||
| Education ≥ college, n (%) | 294 (60.0) | 297 (53.2) | 0.03 | 211 (41.5) | 403 (71.8) | <0.001 |
Income ≥ 34,999, n (%) 34,999, n (%) |
194 (41.1) | 207 (38.0) | 0.34 | 149 (30.1) | 252 (45.9) | <0.001 |
| Total cholesterol, mg/L | 234 ± 44 | 235 ± 47 | 0.69 | 235 ± 44 | 233 ± 43 | 0.48 |
| HDL cholesterol, mg/L | 52.5 ± 15.5 | 48.4 ± 12.7 | <0.001 | 49.2 ± 14.8 | 51.5 ± 14.2 | 0.007 |
| Triglycerides, mg/L | 154.3 ± 92.9 | 166.3 ± 94.9 | 0.09 | 160.3 ± 92.8 | 151.5 ± 84.5 | 0.18 |
| LDL cholesterol, mg/L | 149.9 ± 39.4 | 153.0 ± 39.0 | 0.3 | 153.8 ± 39.1 | 150.6 ± 40.0 | 0.28 |
| C-reactive protein, mg/L | 4.1 ± 5.3 | 5.6 ± 7.2 | <0.001 | 5.8 ± 8.1 | 4.6 ± 6.3 | 0.01 |
Values are means ± SDs unless otherwise noted. Percentage may not always add to 100%. Kruskal-Wallis tests for continuous variables and chi-square test for categorical variables were used. “%” represents the individuals who have the value reported. CAD, coronary artery disease; MET-h, metabolic equivalent task hours; Q, quartile; WHI, Women's Health Initiative; WHI-HT, Women's Health Initiative Hormone Therapy Trial.
In the Discovery data set, we analyzed cross-sectional associations of 495 metabolites with the WD and PD scores in unadjusted and fully adjusted models, incorporating age, race, hysterectomy status, case/control status, batch, BMI, smoking, energy intake, education, income, and medication use (statins, blood pressure–lowering medications, and diabetes medications) (Figure 1). Metabolites discovered in unadjusted and adjusted models for WD showed a predominance of plasmalogens with FDR P < 0.05 (Supplemental Tables 8 and 9). Metabolites discovered in unadjusted and adjusted models for PD showed a predominance of PCs, CEs, and TAGs with FDR P < 0.05 (Supplemental Tables 10 and 11). In confounder-adjusted models in the WHI-OS, there were 57 metabolites selected for association with WD (FDR P < 0.05) (Supplemental Table 9) and 101 metabolites selected for association with PD (FDR P < 0.05) (Supplemental Table 11), yielding a total of 117 unique metabolites. Unadjusted and adjusted models in the WHI-HT replication cohort for WD showed a predominance of plasmalogens with FDR P < 0.05 (Supplemental Tables 12 and 13) and, for PD, a predominance of phosphatidylcholines, CEs, and TAGs with FDR P < 0.05 (Supplemental Tables 14 and 15). Of these, 58 metabolites were validated in fully adjusted models for WD (FDR P < 0.05) (Supplemental Table 13) and 74 for PD (FDR P < 0.05) (Supplemental Table 15) in the WHI-HT replication cohort. Overall, we validated 86 unique metabolites associated with dietary patterns that were both discovered in the WHI-OS and replicated in the independent WHI-HT data set (FDR P < 0.05).
To visualize the directions of association of metabolites with each dietary score, the subset of 86 replicated metabolites were grouped by metabolite class and direction of association with WD (WD+ or WD–) in adjusted models in the WHI-HT. In Figure 2, a bar plot shows the average regression coefficient associated with each dietary score (reflecting change in metabolite abundance per 1-SD increase in WD or PD) within each metabolite group. The metabolites segregated into 2 nonoverlapping groups of metabolites with either positive WD and negative PD regression coefficients or positive PD and negative WD regression coefficients (Figure 2). The metabolite with the largest magnitude of the regression coefficient associated with WD in adjusted models in the WHI-HT was a plasmalogen, C36:4 PE plasmalogen, with βWD = 0.35 and FDR P = 0.000191 (Supplemental Table 13), with a corresponding association with PD of βPD = −0.09 and FDR P = 0.010847 (Supplemental Table 15). The other dominant WD metabolites included 8 PC plasmalogens and 4 PE plasmalogens (Supplemental Table 13). The metabolite with the largest magnitude of the regression coefficient associated with PD in adjusted models in the WHI-HT was an LPC, C22:6 LPC, with βPD = 0.18 and FDR P = 7.02 × 10⁻⁷ (Supplemental Table 15), with a corresponding βWD = −0.38 and FDR P = 2.21 × 10⁻⁵ (Supplemental Table 13). The other dominant PD metabolites included 14 TAGs, all of which had ≥6 double bonds (Supplemental Table 15). In addition, 7 PCs had positive βPD (Supplemental Table 15) and no PCs were positively associated with WD (Figure 2).
The top 20 WD and PD metabolites are shown in Tables 2 and 3 based on FDR P value. Forty-five of the 86 replicated metabolites were associated with both PD and WD and had opposite directions of associations with WD compared with PD (Table 4). The WD was positively associated with short-chain ACs, plasmalogens, and a ceramide (Tables 2 and 4, Supplemental Table 13) and PD was inversely associated with these metabolites (Table 4, Supplemental Table 15). The PD was positively associated with long-chain FAs, PCs, and CEs (Tables 3 and 4, Supplemental Table 15), whereas the WD was inversely associated with these metabolites (Tables 2 and 4, Supplemental Table 13). Of the 45 overlapping WD and PD metabolites, the two FAs, docosatrienoic acid and eicosanedioate, and a glycerophosphoethanolamine-C36:4 PE plasmalogen were among the top metabolites positively associated with WD and the glycerophosphocholines C22:6 LPC and C38:6 PC, and steroid ester C20:5 CE with PD (Table 4). The correlation heatmap for 45 overlapping metabolites for WD and PD demonstrates the metabolically distinct metabolite clusters, such as plasmalogens compared with TAGs, CEs, and PCs (Figure 3). Furthermore, the correlation heatmap shows 2 clusters of highly correlated plasmalogens (1 cluster of PE plasmalogens and 1 cluster of PC plasmalogens), and 2 other plasmalogens (C38:4 PC plasmalogen-B and C32:1 PC plasmalogen-A) that are poorly correlated. In MSEA, ACs were negatively enriched for association with PD [normalized enrichment score (NES) = −2.97, P = 0.0005, FDR P = 0.006] and TAGs were positively enriched for association with PD (NES = 1.94, P = 0.001, FDR P = 0.006). ACs were positively enriched for association with WD (NES = 2.56, P = 0.003, FDR P = 0.003). PE plasmalogens were also positively enriched for association with WD (NES = 2.01, P = 0.001, FDR P = 0.005). CEs were negatively enriched for association with WD (NES = −1.77, P = 0.005, FDR P = 0.02) as were PCs (NES = −1.72, P = 0.01, FDR P = 0.03) (Supplemental Figure 2). All plasmalogens were PE plasmalogens that were associated with WD in the MSEA (Supplemental Table 16). These same PE plasmalogens were associated with red meat and saturated fat (Supplemental Table 17).
TABLE 2.
Top 20 validated WD metabolites in fully adjusted models in the WHI-HT1
| βWD (SE) | Regression coefficient, βWD continuous 1 SD (SE) | P | ||||||
|---|---|---|---|---|---|---|---|---|
| Metabolite | HMDB ID | Quartile 1 | Quartile 2 | Quartile 3 | Quartile 4 | Continuous | FDR continuous | |
| C14:0 CE | HMDB06725 | Reference | −0.08 (0.08) | −0.25 (0.09) | −0.56 (0.14) | −0.52 (0.07) | 1.11 × 10⁻¹⁰ | 6.48 × 10⁻⁹ |
| C16:1 CE | HMDB00658 | Reference | −0.02 (0.08) | −0.23 (0.09) | −0.49 (0.14) | −0.53 (0.07) | 7.47 × 10⁻¹¹ | 6.48 × 10⁻⁹ |
| C20:5 CE | HMDB06731 | Reference | −0.10 (0.08) | −0.22 (0.09) | −0.33 (0.14) | −0.45 (0.07) | 3.09 × 10⁻⁸ | 1.20 × 10⁻⁶ |
| Docosatrienoic acid | HMDB02823 | Reference | 0.16 (0.08) | 0.29 (0.10) | 0.44 (0.14) | 0.44 (0.08) | 1.00 × 10⁻⁷ | 2.35 × 10⁻⁶ |
| C36:5 PC | HMDB07890 | Reference | −0.15 (0.08) | −0.26 (0.09) | −0.31 (0.14) | −0.43 (0.07) | 9.08 × 10⁻⁸ | 2.35 × 10⁻⁶ |
| Eicosapentaenoate | HMDB01999 | Reference | −0.24 (0.08) | −0.29 (0.09) | −0.53 (0.14) | −0.43 (0.07) | 1.86 × 10⁻⁷ | 3.64 × 10⁻⁶ |
| Tetradecanedioate | HMDB00872 | Reference | −0.06 (0.08) | −0.09 (0.09) | −0.20 (0.14) | −0.41 (0.07) | 2.52 × 10⁻⁷ | 4.22 × 10⁻⁶ |
| C34:0 PS | HMDB12356 | Reference | −0.13 (0.08) | −0.22 (0.09) | −0.21 (0.14) | −0.42 (0.07) | 4.19 × 10⁻⁷ | 6.13 × 10⁻⁶ |
| C32:1 PC | HMDB07873 | Reference | −0.04 (0.08) | −0.18 (0.09) | −0.32 (0.13) | −0.39 (0.07) | 1.04 × 10⁻⁶ | 1.22 × 10⁻⁵ |
| Proline betaine | HMDB04827 | Reference | −0.13 (0.08) | −0.16 (0.09) | −0.45 (0.14) | −0.40 (0.07) | 1.02 × 10⁻⁶ | 1.22 × 10⁻⁵ |
| C22:6 LPC | HMDB10404 | Reference | −0.20 (0.08) | −0.29 (0.09) | −0.45 (0.13) | −0.38 (0.07) | 2.08 × 10⁻⁶ | 2.21 × 10⁻⁵ |
| C40:10 PC | HMDB08511 | Reference | −0.13 (0.08) | −0.21 (0.09) | −0.29 (0.14) | −0.38 (0.07) | 2.51 × 10⁻⁶ | 2.45 × 10⁻⁵ |
| DHA | DHA | Reference | −0.20 (0.08) | −0.28 (0.09) | −0.49 (0.14) | −0.38 (0.07) | 4.33 × 10⁻⁶ | 3.62 × 10⁻⁵ |
| C38:6 PC | HMDB07991 | Reference | −0.10 (0.08) | −0.14 (0.09) | −0.22 (0.14) | −0.37 (0.07) | 4.14 × 10⁻⁶ | 3.62 × 10⁻⁵ |
| C32:1 PC plasmalogen-A | HMDB13404 | Reference | −0.05 (0.08) | −0.15 (0.09) | −0.22 (0.14) | −0.36 (0.07) | 1.09 × 10⁻⁵ | 8.50 × 10⁻⁵ |
| N-methylproline | NA | Reference | −0.06 (0.08) | −0.10 (0.09) | −0.37 (0.14) | −0.36 (0.08) | 1.41 × 10⁻⁵ | 0.0001 |
| C4-OH carnitine | HMDB13127 | Reference | 0.03 (0.08) | 0.23 (0.09) | 0.40 (0.13) | 0.34 (0.07) | 1.60 × 10⁻⁵ | 0.0001 |
| Eicosanedioate | NA | Reference | 0.07 (0.08) | 0.23 (0.10) | 0.31 (0.14) | 0.35 (0.08) | 2.13 × 10⁻⁵ | 0.0001 |
| C36:4 PE plasmalogen | HMDB11442 | Reference | −0.01 (0.09) | 0.12 (0.10) | 0.38 (0.14) | 0.35 (0.08) | 3.10 × 10⁻⁵ | 0.0002 |
| C18:2 SM | NA | Reference | 0.11 (0.08) | 0.21 (0.10) | 0.35 (0.14) | 0.34 (0.08) | 5.05 × 10⁻⁵ | 0.0003 |
Single metabolite linear regression models for each metabolite (outcome) with respect to the Western standardized dietary score (WD), the primary exposure, while adjusting for age, BMI, batch, ethnicity, enrollment time, energy intake, exercise, case-control status, smoking (current vs. past/never), income (< 34,999 vs. ≥
 34,999), education, and medication use at baseline (aspirin, statin, hypertension medications, diabetes medications). CE, cholesteryl ester; FDR, false discovery rate; HMDB, Human Metabolome Database; LPC, lysophosphatidylcholine; NA, not available; PC, phosphatidylcholine; PE, phosphatidylethanolamine; PS, phosphatidylserine; SM, sphingomyelin; WD, Western dietary pattern; WHI-HT, Women's Health Initiative Hormone Therapy Trial.
TABLE 3.
Top 20 validated PD pattern metabolites in fully adjusted models in the WHI-HT1
| βWD (SE) | Regression coefficient, βPD continuous 1 SD (SE) | P | ||||||
|---|---|---|---|---|---|---|---|---|
| Metabolite | HMDB ID | Quartile 1 | Quartile 2 | Quartile 3 | Quartile 4 | Continuous | FDR continuous | |
| C22:6 LPC | HMDB10404 | Reference | 0.19 (0.08) | 0.35 (0.08) | 0.50 (0.08) | 0.18 (0.03) | 7.88 × 10⁻⁹ | 7.02 × 10⁻⁷ |
| C38:6 PC | HMDB07991 | Reference | 0.17 (0.08) | 0.33 (0.08) | 0.46 (0.08) | 0.18 (0.03) | 1.20 × 10⁻⁸ | 7.02 × 10⁻⁷ |
| C20:5 CE | HMDB06731 | Reference | 0.13 (0.08) | 0.26 (0.08) | 0.40 (0.08) | 0.17 (0.03) | 2.53 × 10⁻⁸ | 9.85 × 10⁻⁷ |
| C58:8 TAG | HMDB05413 | Reference | 0.14 (0.08) | 0.16 (0.08) | 0.38 (0.08) | 0.17 (0.03) | 8.48 × 10⁻⁸ | 1.98 × 10⁻⁶ |
| Uridine | Uridine | Reference | 0.13 (0.08) | 0.25 (0.08) | 0.42 (0.09) | 0.17 (0.03) | 8.42 × 10⁻⁸ | 1.98 × 10⁻⁶ |
| C60:12 TAG | HMDB05478 | Reference | 0.12 (0.08) | 0.14 (0.08) | 0.39 (0.08) | 0.16 (0.03) | 1.13 × 10⁻⁷ | 2.20 × 10⁻⁶ |
| C22:6 CE | HMDB06733 | Reference | 0.16 (0.07) | 0.26 (0.08) | 0.40 (0.08) | 0.15 (0.03) | 1.53 × 10⁻⁷ | 2.24 × 10⁻⁶ |
| C58:9 TAG | HMDB05463 | Reference | 0.15 (0.08) | 0.18 (0.08) | 0.39 (0.08) | 0.16 (0.03) | 1.39 × 10⁻⁷ | 2.24 × 10⁻⁶ |
| C40:10 PC | HMDB08511 | Reference | 0.19 (0.08) | 0.30 (0.08) | 0.43 (0.08) | 0.16 (0.03) | 2.05 × 10⁻⁷ | 2.66 × 10⁻⁶ |
| Eicosapentaenoate | HMDB01999 | Reference | 0.15 (0.08) | 0.25 (0.08) | 0.39 (0.08) | 0.16 (0.03) | 2.98 × 10⁻⁷ | 3.19 × 10⁻⁶ |
| C58:11 TAG | HMDB10531 | Reference | 0.15 (0.08) | 0.14 (0.08) | 0.38 (0.08) | 0.16 (0.03) | 3.00 × 10⁻⁷ | 3.19 × 10⁻⁶ |
| Uracil | Uracil | Reference | 0.08 (0.08) | 0.20 (0.08) | 0.35 (0.09) | 0.16 (0.03) | 3.34 × 10⁻⁷ | 3.26 × 10⁻⁶ |
| C58:10 TAG | HMDB05476 | Reference | 0.16 (0.08) | 0.16 (0.08) | 0.37 (0.08) | 0.15 (0.03) | 7.31 × 10⁻⁷ | 6.58 × 10⁻⁶ |
| C22:6 LPE-B | HMDB11526 | Reference | 0.12 (0.08) | 0.30 (0.08) | 0.42 (0.08) | 0.15 (0.03) | 7.95 × 10⁻⁷ | 6.65 × 10⁻⁶ |
| Indole-3-propionate | Indole-3-propionate | Reference | 0.07 (0.08) | 0.18 (0.08) | 0.42 (0.08) | 0.15 (0.03) | 1.05 × 10⁻⁶ | 8.22 × 10⁻⁶ |
| C40:6 PC-B | HMDB08057 | Reference | 0.09 (0.08) | 0.29 (0.08) | 0.38 (0.08) | 0.15 (0.03) | 1.25 × 10⁻⁶ | 9.16 × 10⁻⁶ |
| C56:10 TAG | HMDB10513 | Reference | 0.17 (0.08) | 0.20 (0.08) | 0.37 (0.08) | 0.15 (0.03) | 2.79 × 10⁻⁶ | 1.92 × 10⁻⁵ |
| DHA | DHA | Reference | 0.15 (0.08) | 0.28 (0.08) | 0.38 (0.08) | 0.14 (0.03) | 4.77 × 10⁻⁶ | 2.94 × 10⁻⁵ |
| C56:9 TAG | HMDB05448 | Reference | 0.14 (0.08) | 0.16 (0.08) | 0.35 (0.09) | 0.14 (0.03) | 4.76 × 10⁻⁶ | 2.94 × 10⁻⁵ |
| C56:8 TAG | HMDB05392 | Reference | 0.13 (0.08) | 0.18 (0.08) | 0.35 (0.09) | 0.14 (0.03) | 7.55 × 10⁻⁶ | 4.42 × 10⁻⁵ |
Single metabolite linear regression models for each metabolite (outcome) with respect to primary exposure of interest, while adjusting for age, BMI, batch, ethnicity, enrollment time, energy intake, exercise, case-control status, smoking (current vs. past/never), income (< 34,999 vs. ≥
 34,999), education, and medication use at baseline (aspirin, statin, hypertension medications, diabetes medications). CE, cholesteryl ester; FDR, false discovery rate; HMDB, Human Metabolome Database; LPC, lysophosphatidylcholine; LPE, lysophosphatidylethanolamine; PC, phosphatidylcholine; PD, Prudent dietary pattern; TAG, triacylglycerol; WHI-HT, Women's Health Initiative Hormone Therapy Trial.
TABLE 4.
Overlapping validated metabolites for WD and PD in fully adjusted models in the WHI-HT1
| WD | PD | ||||||
|---|---|---|---|---|---|---|---|
| Metabolite | HMDB ID | Western regression coefficient, βWD continuous 1 SD (SE) | P, continuous | FDR P, continuous | Prudent regression coefficient, βPD continuous 1 SD (SE) | P, continuous | FDR P, continuous |
| C14:0 CE | HMDB06725 | −0.52 (0.07) | 1.11 × 10⁻¹⁰ | 6.48 × 10⁻⁹ | 0.07 (0.03) | 0.02 | 0.03 |
| C16:1 CE | HMDB00658 | −0.53 (0.07) | 7.47 × 10⁻¹¹ | 6.48 × 10⁻⁹ | 0.07 (0.03) | 0.02 | 0.03 |
| C20:5 CE | HMDB06731 | −0.45 (0.07) | 3.09 × 10⁻⁸ | 1.20 × 10⁻⁶ | 0.17 (0.03) | 2.53 × 10⁻⁸ | 9.85 × 10⁻⁷ |
| C36:5 PC | HMDB07890 | −0.43 (0.07) | 9.08 × 10⁻⁸ | 2.35 × 10⁻⁶ | 0.14 (0.03) | 8.83 × 10⁻⁶ | 4.92 × 10⁻⁵ |
| Docosatrienoic acid | HMDB02823 | 0.44 (0.08) | 1.00 × 10⁻⁷ | 2.35 × 10⁻⁶ | −0.12 (0.03) | 0.0001 | 0.0005 |
| Eicosapentaenoate | HMDB01999 | −0.43 (0.07) | 1.86 × 10⁻⁷ | 3.64 × 10⁻⁶ | 0.16 (0.03) | 2.98 × 10⁻⁷ | 3.19 × 10⁻⁶ |
| Tetradecanedioate | HMDB00872 | −0.41 (0.07) | 2.52 × 10⁻⁷ | 4.22 × 10⁻⁶ | 0.13 (0.03) | 3.81 × 10⁻⁵ | 0.0002 |
| C34:0 PS | HMDB12356 | −0.42 (0.07) | 4.19 × 10⁻⁷ | 6.13 × 10⁻⁶ | 0.14 (0.03) | 1.27 × 10⁻⁵ | 6.57 × 10⁻⁵ |
| Proline betaine | HMDB04827 | −0.40 (0.07) | 1.02 × 10⁻⁶ | 1.22 × 10⁻⁵ | 0.08 (0.03) | 0.008 | 0.02 |
| C22:6 LPC | HMDB10404 | −0.38 (0.07) | 2.08 × 10⁻⁶ | 2.21 × 10⁻⁵ | 0.18 (0.03) | 7.88 × 10⁻⁹ | 7.02 × 10⁻⁷ |
| C40:10 PC | HMDB08511 | −0.38 (0.07) | 2.51 × 10⁻⁶ | 2.45 × 10⁻⁵ | 0.16 (0.03) | 2.05 × 10⁻⁷ | 2.66 × 10⁻⁶ |
| C38:6 PC | HMDB07991 | −0.37 (0.07) | 4.14 × 10⁻⁶ | 3.62 × 10⁻⁵ | 0.18 (0.03) | 1.20 × 10⁻⁸ | 7.02 × 10⁻⁷ |
| DHA | DHA | −0.38 (0.07) | 4.33 × 10⁻⁶ | 3.62 × 10⁻⁵ | 0.14 (0.03) | 4.77 × 10⁻⁶ | 2.94 × 10⁻⁵ |
| C32:1 PC plasmalogen-A | HMDB13404 | −0.36 (0.07) | 1.09 × 10⁻⁵ | 8.50 × 10⁻⁵ | 0.08 (0.03) | 0.01 | 0.03 |
| C4-OH carnitine | HMDB13127 | 0.34 (0.07) | 1.60 × 10⁻⁵ | 0.0001 | −0.11 (0.03) | 0.0003 | 0.001 |
| Eicosanedioate | NA | 0.35 (0.08) | 2.13 × 10⁻⁵ | 0.0001 | −0.11 (0.03) | 0.0006 | 0.002 |
| C36:4 PE plasmalogen | HMDB11442 | 0.35 (0.08) | 3.10 × 10⁻⁵ | 0.0002 | −0.09 (0.03) | 0.004 | 0.01 |
| C20:3 CE | HMDB06736 | −0.33 (0.08) | 5.03 × 10⁻⁵ | 0.0003 | 0.10 (0.03) | 0.002 | 0.006 |
| C18:2 SM | NA | 0.34 (0.08) | 5.05 × 10⁻⁵ | 0.0003 | −0.09 (0.03) | 0.007 | 0.01 |
| C22:6 LPE-B | HMDB11526 | −0.32 (0.07) | 6.95 × 10⁻⁵ | 0.0003 | 0.15 (0.03) | 7.95 × 10⁻⁷ | 6.65 × 10⁻⁶ |
| C40:6 PC-B | HMDB08057 | −0.32 (0.07) | 8.46 × 10⁻⁵ | 0.0004 | 0.15 (0.03) | 1.25 × 10⁻⁶ | 9.16 × 10⁻⁶ |
| C34:2 PC plasmalogen-A | HMDB11210 | 0.32 (0.08) | 0.0001 | 0.0006 | −0.09 (0.03) | 0.005 | 0.01 |
| Pantothenate | Pantothenate | −0.30 (0.08) | 0.0002 | 0.001 | 0.12 (0.03) | 0.0003 | 0.001 |
| C36:3 PE plasmalogen | HMDB11441 | 0.30 (0.08) | 0.0004 | 0.001 | −0.08 (0.03) | 0.01 | 0.03 |
| 4-Pyridoxate | 4-Pyridoxate | −0.29 (0.08) | 0.0005 | 0.002 | 0.13 (0.03) | 4.24 × 10⁻⁵ | 0.0002 |
| C22:6 CE | HMDB06733 | −0.27 (0.07) | 0.0005 | 0.002 | 0.15 (0.03) | 1.53 × 10⁻⁷ | 2.24 × 10⁻⁶ |
| C58:8 TAG | HMDB05413 | −0.28 (0.07) | 0.0006 | 0.002 | 0.17 (0.03) | 8.48 × 10⁻⁸ | 1.98 × 10⁻⁶ |
| C22:6 LPE-A | HMDB11526 | −0.28 (0.08) | 0.0006 | 0.002 | 0.14 (0.03) | 2.10 × 10⁻⁵ | 0.0001 |
| C36:2 PE plasmalogen | HMDB09082 | 0.28 (0.08) | 0.0009 | 0.003 | −0.10 (0.03) | 0.002 | 0.004 |
| Uridine | Uridine | −0.28 (0.08) | 0.001 | 0.003 | 0.17 (0.03) | 8.42 × 10⁻⁸ | 1.98 × 10⁻⁶ |
| C16:0 LPE | HMDB11503 | −0.26 (0.07) | 0.001 | 0.004 | 0.09 (0.03) | 0.003 | 0.008 |
| C60:12 TAG | HMDB05478 | −0.26 (0.07) | 0.001 | 0.004 | 0.16 (0.03) | 1.13 × 10⁻⁷ | 2.20 × 10⁻⁶ |
| C36:3 PC plasmalogen-A | HMDB11244 | 0.27 (0.08) | 0.002 | 0.004 | −0.09 (0.03) | 0.005 | 0.01 |
| C36:2 PC plasmalogen-A | HMDB11243 | 0.26 (0.08) | 0.002 | 0.005 | −0.09 (0.03) | 0.003 | 0.008 |
| C34:5 PC | HMDB07885 | −0.24 (0.07) | 0.003 | 0.007 | 0.09 (0.03) | 0.006 | 0.01 |
| Thiamin | HMDB00235 | −0.23 (0.08) | 0.006 | 0.02 | 0.10 (0.03) | 0.001 | 0.004 |
| C24:1 SM | HMDB12107 | −0.22 (0.07) | 0.006 | 0.02 | 0.13 (0.03) | 2.43 × 10⁻⁵ | 0.0001 |
| C38:4 PC plasmalogen-B | HMDB11252 | 0.22 (0.08) | 0.007 | 0.02 | −0.10 (0.03) | 0.003 | 0.007 |
| 2-Aminooctanoate | HMDB00991 | 0.22 (0.08) | 0.007 | 0.02 | −0.09 (0.03) | 0.005 | 0.01 |
| C22:0 Ceramide (d18:1) | HMDB04952 | 0.22 (0.08) | 0.009 | 0.02 | −0.11 (0.03) | 0.0006 | 0.002 |
| Indole-3-propionate | Indole-3-propionate | −0.21 (0.07) | 0.01 | 0.02 | 0.15 (0.03) | 1.05 × 10⁻⁶ | 8.22 × 10⁻⁶ |
| C6 carnitine | HMDB00705 | 0.20 (0.07) | 0.01 | 0.03 | −0.08 (0.03) | 0.01 | 0.02 |
| C58:11 TAG | HMDB10531 | −0.20 (0.08) | 0.02 | 0.03 | 0.16 (0.03) | 3.00 × 10⁻⁷ | 3.19 × 10⁻⁶ |
| Uracil | Uracil | −0.20 (0.08) | 0.02 | 0.04 | 0.16 (0.03) | 3.34 × 10⁻⁷ | 3.26 × 10⁻⁶ |
| N-acetylornithine | HMDB03357 | −0.18 (0.07) | 0.02 | 0.049 | 0.08 (0.03) | 0.01 | 0.02 |
1Adjusted for age, BMI, batch, ethnicity, enrollment time, energy intake, exercise, case-control status, smoking (current vs. past/never), income (< 34,999 vs. ≥
 34,999), education, and medication use at baseline (aspirin, statin, hypertension medications, diabetes medications). CE, cholesteryl ester; FDR, false discovery rate; HMDB, Human Metabolome Database; LPC, lysophosphatidylcholine; LPE, lysophosphatidylethanolamine; NA, not available; PC, phosphatidylcholine; PD, Prudent dietary pattern; PE, phosphatidylethanolamine; PS, phosphatidylserine; SM, sphingomyelin; TAG, triacylglycerol; WD, Western dietary pattern; WHI-HT, Women's Health Initiative Hormone Therapy Trial.
FIGURE 3.

Correlation matrix for overlapping metabolites with opposite direction B-coefficients for WD versus PD. CE, cholesteryl ester; LPC, lysophosphatidylcholine; LPE, lysophosphatidylethanolamine; PC, phosphatidylcholine; PD, Prudent dietary pattern; PE, phosphatidylethanolamine; SM, sphingomyelin; TAG, triacylglycerol; WD, Western dietary pattern.
The most highly correlated WD food group and PD food group associated with each metabolite are presented in Table 5. Saturated fat was the WD food group with the strongest metabolite:food partial correlation: C38:4 PC plasmalogen-B, a glycerophosphocholine (partial Spearman r = 0.21, P = 3.41 × 10²⁰). Fatty fish was the PD food group with the strongest metabolite:food correlation: C38:6 PC, a PC (partial Spearman r = 0.34, P = 2.68 × 1052). The glycerophospholipid pathway was the dominant metabolite pathway in Table 5. The other food group and metabolite partial correlation results are shown in Supplemental Table 17 and Supplemental Table 18.
TABLE 5.
Highest correlated metabolite for food groups of WD and PD in WHI participants in observation and trial cohorts1
| Metabolite | HMDB ID | Super class | Subclass | Western | Corr | P | Prudent | Corr | P |
|---|---|---|---|---|---|---|---|---|---|
| Top metabolite associated with each WD food group and corresponding top PD food group for the metabolite | |||||||||
| C16:1 CE | HMDB00658 | Steroids | Steroid esters | Unsaturated oil | −0.24 | 1.11 × 10⁻²⁶ | Other fruit | 0.10 | 9.24 × 10⁻⁶ |
| C38:4 PC plasmalogen-B | HMDB11252 | Glycerophospholipids | Glycerophosphocholines | Saturated fat | 0.21 | 3.41 × 10⁻²⁰ | Fatty fish | −0.15 | 1.38 × 10⁻¹⁰ |
| C34:2 PC plasmalogen-A | HMDB11210 | Glycerophospholipids | Glycerophosphocholines | Red meat | 0.18 | 1.61 × 10⁻¹⁵ | Other fruit | −0.07 | 0.002 |
| C36:2 PE plasmalogen | HMDB09082 | Glycerophospholipids | Glycerophosphoethanolamines | Processed meat | 0.12 | 5.13 × 10⁻⁸ | Other fruit | −0.05 | 0.02 |
| Docosatrienoic acid | HMDB02823 | Lipids | Fatty acids | Potato | 0.11 | 3.19 × 10⁻⁶ | Other fruit | −0.13 | 1.11 × 10⁻⁸ |
| C36:2 PE plasmalogen | HMDB09082 | Glycerophospholipids | Glycerophosphoethanolamines | Eggs | 0.10 | 5.55 × 10⁻⁶ | Other fruit | −0.05 | 0.02 |
| Docosatrienoic acid | HMDB02823 | Lipids | Fatty acids | Refined grains | 0.10 | 6.77 × 10⁻⁶ | Other fruit | −0.13 | 1.11 × 10⁻⁸ |
| N-acetylornithine | HMDB03357 | Organic acids | Amino acids | Added sugar | −0.01 | 2.83 × 10⁻⁵ | CITMLB fruit | 0.12 | 5.01 × 10⁻⁷ |
| C14:0 CE | HMDB06725 | Steroids | Steroid esters | Cheese | 0.06 | 0.008 | Other fruit | 0.08 | 0.0002 |
| Top metabolite associated with each PD food group and corresponding top WD food group for the metabolite | |||||||||
| C38:6 PC | HMDB07991 | Glycerophospholipids | Glycerophosphocholines | Saturated fat | −0.14 | 1.65 × 10⁻¹⁰ | Fatty fish | 0.34 | 2.68 × 10−52 |
| Tetradecanedioate | HMDB00872 | Lipids | Fatty acids, long chain | Saturated fat | −0.10 | 7.65 × 10⁻⁶ | CITMLB fruit | 0.20 | 2.27 × 10⁻¹⁸ |
| Tetradecanedioate | HMDB00872 | Lipids | Fatty acids, long chain | Saturated fat | −0.10 | 7.65 × 10⁻⁶ | Other fruit | 0.18 | 6.75 × 10⁻¹⁵ |
| Indole-3-propionate | Indole-3-propionate | Organoheterocyclics | Indolyl carboxylic acids | Saturated fat | −0.10 | 1.16 × 10⁻⁵ | Orange vegetables | 0.14 | 3.39 × 10⁻⁹ |
| Indole-3-propionate | Indole-3-propionate | Organoheterocyclics | Indolyl carboxylic acids | Saturated fat | −0.10 | 1.16 × 10⁻⁵ | Other vegetables | 0.13 | 4.35 × 10⁹ |
| C60:12 TAG | HMDB05478 | Lipids | Triacylglycerols | Added sugar | −0.10 | 3.50 × 10⁻⁵ | Dark green vegetables | 0.13 | 4.39 × 10⁻⁸ |
| Indole-3-propionate | Indole-3-propionate | Organoheterocyclics | Indolyl carboxylic acids | Saturated fat | −0.10 | 1.16 × 10⁻⁵ | Tomato | 0.10 | 8.12 × 10⁻⁶ |
| C14:0 CE | HMDB06725 | Steroids | Steroid esters | Unsaturated oil | −0.18 | 9.43 × 10⁻¹⁶ | Starchy vegetables | −0.06 | 0.007 |
Partial Spearman rank correlation between the metabolite and the food group adjusted for age, BMI, batch, ethnicity, enrollment time, energy intake, case-control status, smoking (current vs. past/never), income (< 34,999 vs. ≥
 34,999), education, medication use at baseline (aspirin, statin, hypertension medications, diabetes medications), and exercise. CE, cholesteryl ester; CITMLB, citrus/melon/berry; Corr, correlation; HMDB, Human Metabolome Database; PC, phosphatidylcholine; PD, Prudent dietary pattern; PE, phosphatidylethanolamine; Super class, second level of hierarchical classification for metabolites-metabolites with the same super class are considered structurally similar; TAG, triacylglycerol; WD, Western dietary pattern; WHI, Women's Health Initiative.
Figures 4 and 5 show the hierarchical clustering heatmap of 45 replicated and overlapping WD and PD metabolites with WD food groups and PD food groups, respectively. Nine Western food groups (white potatoes, refined grains, cheese–natural and processed, added sugar, red meat, saturated fat, oil, processed meat, and eggs) had an absolute value of correlation coefficient >0.1 (Figure 4). Figure 4 shows the clustering of fatty foods—red meat, saturated fat, and non–saturated fat—with the plasmalogens. Eight Prudent food groups (fatty fish; orange vegetables; citrus fruits, melons, and berries; other fruits; dark-green vegetables; starchy vegetables; tomatoes; and other vegetables) had an absolute value of correlation coefficient >0.1 (Figure 5). Figure 5 shows the clustering of omega-3 FAs and PC metabolites with fatty fish; other fruit (e.g., apples) and orange vegetables with indole-3-propionate and tetradecanedioate; citrus, melons, and berries with tetradecandedioate and proline betaine. The metabolite clustering of ceramides, sphingomyelin, and plasmalogens is inversely associated with most of the PD food groups. The hierarchical clustering of the metabolites in the food-metabolite heatmaps mirrors the clustering of the metabolites for the overlapping metabolites for WD and PD (Figure 3).
FIGURE 4.

Hierarchical clustering heatmap of partial correlation coefficients for overlapping WD and PD metabolites and Western food groups. Partial correlation was adjusted for age, BMI, batch, ethnicity, enrollment time, energy intake, exercise, case-control status, smoking (current vs. past/never), income (< 34,999 vs. ≥
 34,999), education, and medication use at baseline (aspirin, statin, hypertension medications, diabetes medications). CE, cholesteryl ester; LPC, lysophosphatidylcholine; LPE, lysophosphatidylethanolamine; PC, phosphatidylcholine; PD, Prudent dietary pattern; PE, phosphatidylethanolamine; PS, phosphatidylserine; SM, sphingomyelin; TAG, triacylglycerol; WD, Western dietary pattern.
FIGURE 5.

Hierarchical clustering heatmap of partial correlation coefficients for overlapping WD and PD metabolites and Prudent food groups. Partial correlation was adjusted for age, BMI, batch, ethnicity, enrollment time, energy intake, exercise, case-control status, smoking (current vs. past/never), income (< 34,999 vs. ≥
 34,999), education, and medication use at baseline (aspirin, statin, hypertension medications, diabetes medications). CE, cholesteryl ester; LPC, lysophosphatidylcholine; LPE, lysophosphatidylethanolamine; PC, phosphatidylcholine; PD, Prudent dietary pattern; PE, phosphatidylethanolamine; PS, phosphatidylserine; SM, sphingomyelin; TAG, triacylglycerol; WD, Western dietary pattern.
In BMI-stratified analyses (Supplemental Tables 19–26) (BMI <25 and ≥25) of the 86 replicated metabolites, we replicated 53 for WD for both BMI strata (Supplemental Table 23) and 72 for PD for both BMI strata (Supplemental Table 26). Plasmalogens and carnitines were the largest classes of metabolites positively associated with WD in both BMI strata (Supplemental Table 22). TAGs with >6 double bonds were the largest class of metabolites positively associated with PD in both BMI strata (Supplemental Table 26). In sensitivity analyses, additional adjustment for multivitamin use in the fully adjusted model did not alter the number of selected metabolites; thiamine and 4-pyridoxate remained as significant metabolites. A sensitivity analysis was completed in the groups with and without the development of CAD in both the Discovery and the Replication groups. Major findings were unchanged.
Discussion
Adherence to a WD is a modifiable risk factor associated with cancer (28) and CAD (29), chronic diseases that share metabolic pathways of lipid dysregulation (30), oxidative stress, and inflammation (31, 32). In the WHI, we identified distinct metabolite signatures associated with the WD and PD, highlighting the differences in food compositions of these dietary patterns and their associations with distinct metabolites. MSEA identified the AC and PE plasmalogen metabolic pathways as positively associated with the WD and the TAG metabolic pathway metabolites as positively associated with PD. To our knowledge, this is the first study to identify an association of PE plasmalogens with WD. Several PE plasmalogens and C38:4 PC plasmalogen-B were correlated with red meat and saturated fat intake. Plasmalogens have been identified as markers of oxidative stress (33), and the association of PE plasmalogens with WD may identify 1 deleterious pathway of WD for cancer and ischemic heart disease. Some plasmalogens may represent an appropriate response against increased oxidative stress generated by overnutrition or proinflammatory foods (34). Antioxidant effects associated with plasmalogens have been observed mainly in in vitro models (35, 36) and in animal experiments (37, 38). Yet, the effects of specific plasmalogens with different chemical structure are not fully understood (39). In 1 study, 91 plasmalogens were measured in plasma and found to be either positively or inversely associated with aging (40). Given the identification of 2 plasmalogen compounds (C38:4 PC plasmalogen-B and C32:1 PC plasmalogen A) that were not correlated with the other 2 clusters of highly correlated plasmalogens, it would be reasonable to expect different functions from these plasmalogens.
CEs were negatively enriched for WD in MSEA. Additionally, the CEs such as cholesteryl palmitoleate (C16:1 CE) and C14:0 CE were inversely correlated with unsaturated oil and inversely associated with WD; these results are in agreement with prior research that showed these CEs to be inversely associated with a high-insulinemic dietary pattern (41), such as a WD (42). Furthermore, the accumulation of CEs in the arterial intima is an important feature of atherosclerosis (43). C16:1 CE is a key plasma CE involved in reverse cholesterol transport. Upregulation of reverse cholesterol transport, a process by which the body removes excess cholesterol from peripheral tissues and takes them to the liver, has been documented with a Western-style, high-saturated-fat diet in animals (44) and individuals (45). We observed the expected strong positive correlation between fatty fish intake with EPA and DHA metabolites, and positive associations of EPA and DHA with PD and corresponding inverse association with WD.
The metabolite patterns that we found may represent digested food, such as lipids, or pathophysiology, such as oxidative stress and lipid dysregulation, or both. The specific metabolite profile of each dietary score was related to the dietary components used to create the score, by design. The WD was typified by a high contribution of saturated fats from animal products and the PD was typified by a high contribution of vegetables (especially dark-green and orange vegetables) and fruits, foods characterized as having anti-inflammatory and antioxidant properties. In BMI-stratified analyses, the metabolite patterns remained of PE plasmalogens associated with WD and CE and PCs associated with PD.
Based on multiple functional concepts and food components with anti-inflammatory activity, profiling of individual lipid species offers further scope for understanding the complexity and dynamics of lipids and oxidative stress in relation to the influence of the WD or PD. Previous studies have shown that changes in diet produce short-term changes in the metabolome (46–49). A healthy dietary intervention demonstrated reduction in plasmalogens among healthy participants (50). Low-grade inflammation and oxidative stress are key features of vascular and metabolic diseases. Eicosanoids are inflammatory mediators that are synthesized in macrophages from arachidonic acid and other lipids (51). It has been speculated that increased synthesis of PE plasmalogens serve as a reservoir for arachidonic acid and may contribute to increased synthesis of proinflammatory eicosanoids (52). We found the PE plasmalogens were positively associated with a WD, independent of BMI.
The benefits of higher fruit and vegetable intake for reducing the risk of cancer and CAD (4) may be associated with oxidative stress pathways. Our results suggest that metabolites such as indole-3-propionate (a gut microbiota metabolite) and proline betaine are associated with fruit and vegetable intake. Elevated concentrations of proline betaine in human urine are found after the consumption of citrus fruits and juices (53). One study reported that each portion increase in the consumption of fruits and vegetables was associated with a 4% lower risk of dying from ischemic heart disease, even after adjusting for other dietary factors (4). Yet, randomized controlled trials have shown that increased consumption of fruits and vegetables has a minimal impact on routine clinical plasma cholesterol fractions (54), even though a higher intake of fruits and vegetables has been associated with lower concentrations of plasma LDL cholesterol in observational studies (55). Other mechanisms represented by diet-related metabolites may represent causal pathways for ischemic heart disease beyond traditional lipids. Indole-3-propionate (56) and betaine (57) have been shown to alter oxidative stress, and betaine may protect cells from mitochondrial dysfunction (58).
The metabolome is closely linked to both weight and BMI, and dietary-associated metabolites may overlap with BMI-associated metabolites (59). We tried to minimize this impact through our BMI-stratified analyses. The FA characteristics in the human body reflect not only the dietary fat composition but also the endogenous production and metabolism of FAs (60) related to obesity and lifestyle variables (61). A profound feature of inflammatory diseases is the excessive recruitment and influx of monocytes to sites of tissue damage and their subsequent differentiation into macrophages (62). Higher consumption of the WD is associated with markers of macrophage activation (63).
This study's strengths include the large population size, detailed dietary data, and large number of measured metabolites. Our data replicated and validated metabolites from previous targeted biomarker studies (11). The primary dietary assessment instrument is the validated WHI FFQ (20). The questionnaire includes questions on fat-related food-preparation methods and reduced-fat foods to increase its sensitivity to dietary fat intake. Methodological limitations include measurement error for self-reported dietary measurements, because this relies on the women accurately reporting what they ate and estimating the fat content in the food. Estimated prevalence of misreporting is 30–88% with these tools (64), with underreporting biased towards unhealthy foods and overreporting biased towards fruits and vegetables (65). Our study is limited in its focus on a single baseline serum sample with self-reported diet.
This study comprised primarily white postmenopausal women and the results may not be generalizable to other populations. We cannot provide information about actual concentrations, because metabolites were measured as peak intensities rather than as absolute concentrations. Variability in serum metabolites may be greatly influenced by the gut microbiota and we do not have data on the gut microbiome in this study.
In conclusion, the WD and PD were significantly associated with several metabolites. Metabolomic profiling, an emerging technology in application to nutritional epidemiology, may offer insights into the biological mechanisms linking dietary patterns with oxidative stress and lipid dysregulation as underlying mechanisms for CAD and cancer.
Supplementary Material
Acknowledgments
The authors’ responsibilities were as follows—PDC, KMR, RB, TF, and LFT: designed the research; PDC, RB, FG, CC, and NP: conducted the research; CC, PDC, RB, NP, SL, FKT, JEM, and ELG: analyzed data or performed statistical analysis; PDC and KMR: had primary responsibility for final content; CE and LS: reviewed the manuscript; and all authors: wrote the manuscript and read and approved the final manuscript. The authors report no conflicts of interest. DKT and SL are Editors of the American Journal of Clinical Nutrition and played no role in the Journal's evaluation of the manuscript.
Notes
Metabolomic analysis in the Women's Health Initiative (WHI) was funded by the National Heart, Lung, and Blood Institute, NIH, US Department of Health and Human Services through contract HHSN268201300008C. The WHI program is funded by the National Heart, Lung, and Blood Institute, NIH, US Department of Health and Human Services through contracts HHSN268201600018C, HHSN268201600001C, HHSN268201600002C, HHSN268201600003C, and HHSN268201600004C. PDC received support from grant 127524-MRSG-15-012-01-CNE from the American Cancer Society. FKT was supported by National Cancer Institute grants K99CA207736 and R00CA207736. DKT was supported by National Institute of Diabetes and Digestive and Kidney Diseases grant K01DK103720. The funders had no role in the design of the study; in the collection, analyses, or interpretation of the data; in the writing of the manuscript; or in the decision to publish the results.
Supplemental Tables 1–26 and Supplemental Figures 1 and 2 are available from the “Supplementary data” link in the online posting of the article and from the same link in the online table of contents at https://academic.oup.com/ajcn/.
A list of Women's Health Initiative investigators is available online at https://www.whi.org/researchers/Documents%20%20Write%20a%20Paper/WHI%20Investigator%20Short%20List.pdf.
Data described in the manuscript, code book, and analytic code will be made available upon request pending application and approval to Women's Health Initiative (www.whi.org).
Abbreviations used: AC, acyl carnitine (short-chain); CAD, coronary artery disease; CE, cholesteryl ester; CRP, C-reactive protein; FA, fatty acid; FDR, false discovery rate; LPC, lysophosphatidylcholine; MPED, MyPyramid Equivalents Database; MSEA, metabolite set enrichment analysis; NES, normalized enrichment score; PC, phosphatidylcholine; PE, phosphatidylethanolamine; PD, Prudent dietary pattern; TAG, triacylglycerol; WD, Western dietary pattern; WHI, Women's Health Initiative; WHI-HT, Women's Health Initiative Hormone Therapy Trial; WHI-OS, Women's Health Initiative Observational Study.
Contributor Information
Paulette D Chandler, Division of Preventive Medicine, Department of Medicine, Brigham and Women's Hospital, Boston, MA, USA; Harvard Medical School, Boston, MA, USA.
Raji Balasubramanian, Department of Biostatistics and Epidemiology, School of Public Health and Health Sciences, University of Massachusetts, Amherst, MA, USA.
Nina Paynter, Division of Preventive Medicine, Department of Medicine, Brigham and Women's Hospital, Boston, MA, USA; Harvard Medical School, Boston, MA, USA.
Franco Giulianini, Division of Preventive Medicine, Department of Medicine, Brigham and Women's Hospital, Boston, MA, USA.
Teresa Fung, Department of Nutrition, Harvard TH Chan School of Public Health, Boston, MA, USA; Department of Nutrition, Simmons University, Boston, MA, USA.
Lesley F Tinker, Fred Hutchinson Cancer Research Center, Seattle, WA, USA.
Linda Snetselaar, University of Iowa College of Public Health, Iowa City, IA, USA.
Simin Liu, Brown University School of Public Health and Alpert School of Medicine, Providence, RI, USA.
Charles Eaton, Brown University School of Public Health and Alpert School of Medicine, Providence, RI, USA.
Deirdre K Tobias, Division of Preventive Medicine, Department of Medicine, Brigham and Women's Hospital, Boston, MA, USA; Harvard Medical School, Boston, MA, USA; Department of Nutrition, Harvard TH Chan School of Public Health, Boston, MA, USA.
Fred K Tabung, Division of Preventive Medicine, Department of Medicine, Brigham and Women's Hospital, Boston, MA, USA; Department of Nutrition, Harvard TH Chan School of Public Health, Boston, MA, USA; Division of Medical Oncology, Department of Internal Medicine, The Ohio State University College of Medicine, Columbus, OH, USA; The Ohio State University Comprehensive Cancer Center—Arthur G James Cancer Hospital and Richard J Solove Institute, Columbus, OH, USA; Department of Epidemiology, Harvard TH Chan School of Public Health, Boston, MA, USA.
JoAnn E Manson, Division of Preventive Medicine, Department of Medicine, Brigham and Women's Hospital, Boston, MA, USA; Harvard Medical School, Boston, MA, USA; Department of Nutrition, Harvard TH Chan School of Public Health, Boston, MA, USA; Department of Epidemiology, Harvard TH Chan School of Public Health, Boston, MA, USA.
Edward L Giovannucci, Harvard Medical School, Boston, MA, USA; Department of Nutrition, Harvard TH Chan School of Public Health, Boston, MA, USA; Department of Epidemiology, Harvard TH Chan School of Public Health, Boston, MA, USA; Channing Division of Network Medicine, Department of Medicine, Brigham and Women's Hospital, Boston, MA, USA.
Clary Clish, Harvard Medical School, Boston, MA, USA; Broad Institute of MIT and Harvard, Cambridge, MA, USA.
Kathryn M Rexrode, Division of Preventive Medicine, Department of Medicine, Brigham and Women's Hospital, Boston, MA, USA; Harvard Medical School, Boston, MA, USA; Division of Women's Health, Department of Medicine, Brigham and Women's Hospital, Boston, MA, USA.
References
- 1. Popkin BM. Global nutrition dynamics: the world is shifting rapidly toward a diet linked with noncommunicable diseases. Am J Clin Nutr. 2006;84(2):289–98. [DOI] [PubMed] [Google Scholar]
- 2. Heidemann C, Schulze MB, Franco OH, van Dam RM, Mantzoros CS, Hu FB. Dietary patterns and risk of mortality from cardiovascular disease, cancer, and all causes in a prospective cohort of women. Circulation. 2008;118(3):230–7. [DOI] [PMC free article] [PubMed] [Google Scholar]
- 3. Wu K, Hu FB, Fuchs C, Rimm EB, Willett WC, Giovannucci E. Dietary patterns and risk of colon cancer and adenoma in a cohort of men (United States). Cancer Causes Control. 2004;15(9):853–62. [DOI] [PubMed] [Google Scholar]
- 4. Crowe FL, Roddam AW, Key TJ, Appleby PN, Overvad K, Jakobsen MU, Tjonneland A, Hansen L, Boeing H, Weikert C et al. Fruit and vegetable intake and mortality from ischaemic heart disease: results from the European Prospective Investigation into Cancer and Nutrition (EPIC)-Heart study. Eur Heart J. 2011;32(10):1235–43. [DOI] [PMC free article] [PubMed] [Google Scholar]
- 5. Liu S, Lee IM, Ajani U, Cole SR, Buring JE, Manson JE, Physicians' Health Study . Intake of vegetables rich in carotenoids and risk of coronary heart disease in men: the Physicians' Health Study. Int J Epidemiol. 2001;30(1):130–5. [DOI] [PubMed] [Google Scholar]
- 6. Lim SS, Vos T, Flaxman AD, Danaei G, Shibuya K, Adair-Rohani H, Amann M, Anderson HR, Andrews KG, Aryee M et al. A comparative risk assessment of burden of disease and injury attributable to 67 risk factors and risk factor clusters in 21 regions, 1990–2010: a systematic analysis for the Global Burden of Disease Study 2010. Lancet. 2012;380(9859):2224–60. [DOI] [PMC free article] [PubMed] [Google Scholar]
- 7. Hu FB. Dietary pattern analysis: a new direction in nutritional epidemiology. Curr Opin Lipidol. 2002;13(1):3–9. [DOI] [PubMed] [Google Scholar]
- 8. Playdon MC, Moore SC, Derkach A, Reedy J, Subar AF, Sampson JN, Albanes D, Gu F, Kontto J, Lassale C et al. Identifying biomarkers of dietary patterns by using metabolomics. Am J Clin Nutr. 2017;105(2):450–65. [DOI] [PMC free article] [PubMed] [Google Scholar]
- 9. Playdon MC, Ziegler RG, Sampson JN, Stolzenberg-Solomon R, Thompson HJ, Irwin ML, Mayne ST, Hoover RN, Moore SC. Nutritional metabolomics and breast cancer risk in a prospective study. Am J Clin Nutr. 2017;106(2):637–49. [DOI] [PMC free article] [PubMed] [Google Scholar]
- 10. Waxman A; World Health Organization. WHO global strategy on diet, physical activity and health. Food Nutr Bull. 2004;25(3):292–302. [DOI] [PubMed] [Google Scholar]
- 11. Bouchard-Mercier A, Rudkowska I, Lemieux S, Couture P, Vohl MC. The metabolic signature associated with the Western dietary pattern: a cross-sectional study. Nutr J. 2013;12:158. [DOI] [PMC free article] [PubMed] [Google Scholar]
- 12. Dhungana S, Carlson JE, Pathmasiri W, McRitchie S, Davis M, Sumner S, Appt SE. Impact of a western diet on the ovarian and serum metabolome. Maturitas. 2016;92:134–42. [DOI] [PubMed] [Google Scholar]
- 13. Wellington N, Shanmuganathan M, de Souza RJ, Zulyniak MA, Azab S, Bloomfield J, Mell A, Ly R, Desai D, Anand SS et al. Metabolic trajectories following contrasting prudent and western diets from food provisions: identifying robust biomarkers of short-term changes in habitual diet. Nutrients. 2019;11(10). doi: 10.3390/nu11102407. [DOI] [PMC free article] [PubMed] [Google Scholar]
- 14. Gibbons H, Carr E, McNulty BA, Nugent AP, Walton J, Flynn A, Gibney MJ, Brennan L. Metabolomic-based identification of clusters that reflect dietary patterns. Mol Nutr Food Res. 2017;61(10). doi: 10.1002/mnfr.201601050. [DOI] [PubMed] [Google Scholar]
- 15. Paynter NP, Balasubramanian R, Giulianini F, Wang DD, Tinker LF, Gopal S, Deik AA, Bullock K, Pierce KA, Scott J et al. Metabolic Predictors of incident coronary heart disease in women. Circulation. 2018;137(8):841–53. [DOI] [PMC free article] [PubMed] [Google Scholar]
- 16. Rhee EP, Cheng S, Larson MG, Walford GA, Lewis GD, McCabe E, Yang E, Farrell L, Fox CS, O'Donnell CJ et al. Lipid profiling identifies a triacylglycerol signature of insulin resistance and improves diabetes prediction in humans. J Clin Invest. 2011;121(4):1402–11. [DOI] [PMC free article] [PubMed] [Google Scholar]
- 17. Wang TJ, Larson MG, Vasan RS, Cheng S, Rhee EP, McCabe E, Lewis GD, Fox CS, Jacques PF, Fernandez C et al. Metabolite profiles and the risk of developing diabetes. Nat Med. 2011;17(4):448–53. [DOI] [PMC free article] [PubMed] [Google Scholar]
- 18. Bajad SU, Lu W, Kimball EH, Yuan J, Peterson C, Rabinowitz JD. Separation and quantitation of water soluble cellular metabolites by hydrophilic interaction chromatography-tandem mass spectrometry. J Chromatogr A. 2006;1125(1):76–88. [DOI] [PubMed] [Google Scholar]
- 19. Townsend MK, Clish CB, Kraft P, Wu C, Souza AL, Deik AA, Tworoger SS, Wolpin BM. Reproducibility of metabolomic profiles among men and women in 2 large cohort studies. Clin Chem. 2013;59(11):1657–67. [DOI] [PMC free article] [PubMed] [Google Scholar]
- 20. Patterson RE, Kristal AR, Tinker LF, Carter RA, Bolton MP, Agurs-Collins T. Measurement characteristics of the Women's Health Initiative food frequency questionnaire. Ann Epidemiol. 1999;9(3):178–87. [DOI] [PubMed] [Google Scholar]
- 21. Women's Health Initiative Study Group. Design of the Women's Health Initiative clinical trial and observational study. Control Clin Trials. 1998;19(1):61–109. [DOI] [PubMed] [Google Scholar]
- 22. Britten P, Marcoe K, Yamini S, Davis C. Development of food intake patterns for the MyPyramid Food Guidance System. J Nutr Educ Behav. 2006;38(6 Suppl):S78–92. [DOI] [PubMed] [Google Scholar]
- 23. Kleinbaum D, Kupper LL, Muller KE. Variable reduction and factor analysis. In: Kleinbaum DG, Kupper LL, Muller KEeditors. Applied regression analysis and other multivariable methods. Boston (MA): PWS-Kent Pub. Co; 1988:595–692. [Google Scholar]
- 24. Khani BR, Ye W, Terry P, Wolk A. Reproducibility and validity of major dietary patterns among Swedish women assessed with a food-frequency questionnaire. J Nutr. 2004;134(6):1541–5. [DOI] [PubMed] [Google Scholar]
- 25. Kerver JM, Yang EJ, Bianchi L, Song WO. Dietary patterns associated with risk factors for cardiovascular disease in healthy US adults. Am J Clin Nutr. 2003;78(6):1103–10. [DOI] [PubMed] [Google Scholar]
- 26. Fung TT, Willett WC, Stampfer MJ, Manson JE, Hu FB. Dietary patterns and the risk of coronary heart disease in women. Arch Intern Med. 2001;161(15):1857–62. [DOI] [PubMed] [Google Scholar]
- 27. Benjamini Y, Krieger AM, Yekutieli D. Adaptive linear step-up procedures that control the false discovery rate. Biometrika. 2006;491–507. [Google Scholar]
- 28. Fung TT, Brown LS. Dietary patterns and the risk of colorectal cancer. Curr Nutr Rep. 2013;2(1):48–55. [DOI] [PMC free article] [PubMed] [Google Scholar]
- 29. Martinez-Gonzalez MA, Zazpe I, Razquin C, Sanchez-Tainta A, Corella D, Salas-Salvado J, Toledo E, Ros E, Munoz MA, Recondo J et al. Empirically-derived food patterns and the risk of total mortality and cardiovascular events in the PREDIMED study. Clin Nutr. 2015;34(5):859–67. [DOI] [PubMed] [Google Scholar]
- 30. Chandler PD, Song Y, Lin J, Zhang S, Sesso HD, Mora S, Giovannucci EL, Rexrode KE, Moorthy MV, Li C et al. Lipid biomarkers and long-term risk of cancer in the Women's Health Study. Am J Clin Nutr. 2016;103(6):1397–407. [DOI] [PMC free article] [PubMed] [Google Scholar]
- 31. Chandler PD, Akinkuolie AO, Tobias DK, Lawler PR, Li C, Moorthy MV, Wang L, Duprez DA, Jacobs DR, Glynn RJ et al. Association of N-linked glycoprotein acetyls and colorectal cancer incidence and mortality. PLoS One. 2016;11(11):e0165615. [DOI] [PMC free article] [PubMed] [Google Scholar]
- 32. Akinkuolie AO, Pradhan AD, Buring JE, Ridker PM, Mora S. Novel protein glycan side-chain biomarker and risk of incident type 2 diabetes mellitus. Arterioscler Thromb Vasc Biol. 2015;35(6):1544–50. [DOI] [PMC free article] [PubMed] [Google Scholar]
- 33. Ikuta A, Sakurai T, Nishimukai M, Takahashi Y, Nagasaka A, Hui SP, Hara H, Chiba H. Composition of plasmalogens in serum lipoproteins from patients with non-alcoholic steatohepatitis and their susceptibility to oxidation. Clin Chim Acta. 2019;493:1–7. [DOI] [PubMed] [Google Scholar]
- 34. Heilbronn LK, Coster AC, Campbell LV, Greenfield JR, Lange K, Christopher MJ, Meikle PJ, Samocha-Bonet D. The effect of short-term overfeeding on serum lipids in healthy humans. Obesity. 2013;21(12):E649–59. [DOI] [PubMed] [Google Scholar]
- 35. Wu Y, Chen Z, Darwish WS, Terada K, Chiba H, Hui SP. Choline and ethanolamine plasmalogens prevent lead-induced cytotoxicity and lipid oxidation in HepG2 Cells. J Agric Food Chem. 2019;67(27):7716–25. [DOI] [PubMed] [Google Scholar]
- 36. Wallner S, Orso E, Grandl M, Konovalova T, Liebisch G, Schmitz G. Phosphatidylcholine and phosphatidylethanolamine plasmalogens in lipid loaded human macrophages. PLoS One. 2018;13(10):e0205706. [DOI] [PMC free article] [PubMed] [Google Scholar]
- 37. Sibomana I, Grobe N, DelRaso NJ, Reo NV. Influence of myo-inositol plus ethanolamine on plasmalogens and cell viability during oxidative stress. Chem Res Toxicol. 2019;32(2):265–84. [DOI] [PubMed] [Google Scholar]
- 38. Marqueno A, Blanco M, Maceda-Veiga A, Porte C. Skeletal muscle lipidomics as a new tool to determine altered lipid homeostasis in fish exposed to urban and industrial wastewaters. Environ Sci Technol. 2019;53(14):8416–25. [DOI] [PubMed] [Google Scholar]
- 39. Dean JM, Lodhi IJ. Structural and functional roles of ether lipids. Protein Cell. 2018;9(2):196–206. [DOI] [PMC free article] [PubMed] [Google Scholar]
- 40. Pradas I, Jove M, Huynh K, Puig J, Ingles M, Borras C, Vina J, Meikle PJ, Pamplona R. Exceptional human longevity is associated with a specific plasma phenotype of ether lipids. Redox Biol. 2019;21:101127. [DOI] [PMC free article] [PubMed] [Google Scholar]
- 41. Tabung FK, Balasubramanian R, Liang L, Clinton SK, Cespedes Feliciano EM, Manson JE, Van Horn L, Wactawski-Wende J, Clish CB, Giovannucci EL et al. Identifying metabolomic profiles of insulinemic dietary patterns. Metabolites. 2019;9(6):120. [DOI] [PMC free article] [PubMed] [Google Scholar]
- 42. Biobaku F, Ghanim H, Batra M, Dandona P. Macronutrient mediated inflammation and oxidative stress: relevance to insulin resistance, obesity and atherogenesis. J Clin Endocrinol Metab. 2019;104(12):6118–28. [DOI] [PubMed] [Google Scholar]
- 43. Blair HC, Sepulveda J, Papachristou DJ. Nature and nurture in atherosclerosis: the roles of acylcarnitine and cell membrane-fatty acid intermediates. Vasc Pharmacol. 2016;78:17–23. [DOI] [PMC free article] [PubMed] [Google Scholar]
- 44. Escola-Gil JC, Llaverias G, Julve J, Jauhiainen M, Mendez-Gonzalez J, Blanco-Vaca F. The cholesterol content of Western diets plays a major role in the paradoxical increase in high-density lipoprotein cholesterol and upregulates the macrophage reverse cholesterol transport pathway. Arterioscler Thromb Vasc Biol. 2011;31(11):2493–9. [DOI] [PubMed] [Google Scholar]
- 45. Blanco-Molina A, Castro G, Martin-Escalante D, Bravo D, Lopez-Miranda J, Castro P, Lopez-Segura F, Fruchart JC, Ordovas JM, Perez-Jimenez F. Effects of different dietary cholesterol concentrations on lipoprotein plasma concentrations and on cholesterol efflux from Fu5AH cells. Am J Clin Nutr. 1998;68(5):1028–33. [DOI] [PubMed] [Google Scholar]
- 46. Shaham O, Wei R, Wang TJ, Ricciardi C, Lewis GD, Vasan RS, Carr SA, Thadhani R, Gerszten RE, Mootha VK. Metabolic profiling of the human response to a glucose challenge reveals distinct axes of insulin sensitivity. Mol Syst Biol. 2008;4:214. [DOI] [PMC free article] [PubMed] [Google Scholar]
- 47. Pellis L, van Erk MJ, van Ommen B, Bakker GC, Hendriks HF, Cnubben NH, Kleemann R, van Someren EP, Bobeldijk I, Rubingh CM et al. Plasma metabolomics and proteomics profiling after a postprandial challenge reveal subtle diet effects on human metabolic status. Metabolomics. 2012;8(2):347–59. [DOI] [PMC free article] [PubMed] [Google Scholar]
- 48. Lankinen M, Schwab U, Gopalacharyulu PV, Seppanen-Laakso T, Yetukuri L, Sysi-Aho M, Kallio P, Suortti T, Laaksonen DE, Gylling H et al. Dietary carbohydrate modification alters serum metabolic profiles in individuals with the metabolic syndrome. Nutr Metab Cardiovasc Dis. 2010;20(4):249–57. [DOI] [PubMed] [Google Scholar]
- 49. Krug S, Kastenmuller G, Stuckler F, Rist MJ, Skurk T, Sailer M, Raffler J, Romisch-Margl W, Adamski J, Prehn C et al. The dynamic range of the human metabolome revealed by challenges. FASEB J. 2012;26(6):2607–19. [DOI] [PubMed] [Google Scholar]
- 50. Tovar J, de Mello VD, Nilsson A, Johansson M, Paananen J, Lehtonen M, Hanhineva K, Bjorck I. Reduction in cardiometabolic risk factors by a multifunctional diet is mediated via several branches of metabolism as evidenced by nontargeted metabolite profiling approach. Mol Nutr Food Res. 2017;61(2). doi: 10.1002/mnfr.201600552. [DOI] [PubMed] [Google Scholar]
- 51. Funk CD. Prostaglandins and leukotrienes: advances in eicosanoid biology. Science. 2001;294(5548):1871–5. [DOI] [PubMed] [Google Scholar]
- 52. Meikle PJ, Wong G, Barlow CK, Weir JM, Greeve MA, MacIntosh GL, Almasy L, Comuzzie AG, Mahaney MC, Kowalczyk A et al. Plasma lipid profiling shows similar associations with prediabetes and type 2 diabetes. PLoS One. 2013;8(9):e74341. [DOI] [PMC free article] [PubMed] [Google Scholar]
- 53. Atkinson W, Downer P, Lever M, Chambers ST, George PM. Effects of orange juice and proline betaine on glycine betaine and homocysteine in healthy male subjects. Eur J Nutr. 2007;46(8):446–52. [DOI] [PubMed] [Google Scholar]
- 54. John JH, Ziebland S, Yudkin P, Roe LS, Neil HA, Oxford F; Vegetable Study Group . Effects of fruit and vegetable consumption on plasma antioxidant concentrations and blood pressure: a randomised controlled trial. Lancet. 2002;359(9322):1969–74. [DOI] [PubMed] [Google Scholar]
- 55. Djousse L, Arnett DK, Coon H, Province MA, Moore LL, Ellison RC. Fruit and vegetable consumption and LDL cholesterol: the National Heart, Lung, and Blood Institute Family Heart Study. Am J Clin Nutr. 2004;79(2):213–7. [DOI] [PubMed] [Google Scholar]
- 56. Yisireyili M, Takeshita K, Saito S, Murohara T, Niwa T. Indole-3-propionic acid suppresses indoxyl sulfate-induced expression of fibrotic and inflammatory genes in proximal tubular cells. Nagoya J Med Sci. 2017;79(4):477–86. [DOI] [PMC free article] [PubMed] [Google Scholar]
- 57. Veskovic M, Mladenovic D, Milenkovic M, Tosic J, Borozan S, Gopcevic K, Labudovic-Borovic M, Dragutinovic V, Vucevic D, Jorgacevic B et al. Betaine modulates oxidative stress, inflammation, apoptosis, autophagy, and Akt/mTOR signaling in methionine-choline deficiency-induced fatty liver disease. Eur J Pharmacol. 2019;848:39–48. [DOI] [PubMed] [Google Scholar]
- 58. Heidari R, Niknahad H, Sadeghi A, Mohammadi H, Ghanbarinejad V, Ommati MM, Hosseini A, Azarpira N, Khodaei F, Farshad O et al. Betaine treatment protects liver through regulating mitochondrial function and counteracting oxidative stress in acute and chronic animal models of hepatic injury. Biomed Pharmacother. 2018;103:75–86. [DOI] [PubMed] [Google Scholar]
- 59. Cirulli ET, Guo L, Leon Swisher C, Shah N, Huang L, Napier LA, Kirkness EF, Spector TD, Caskey CT, Thorens B et al. Profound perturbation of the metabolome in obesity is associated with health risk. Cell Metab. 2019;29(2):488–500 e2. [DOI] [PMC free article] [PubMed] [Google Scholar]
- 60. Bjermo H, Riserus U. Role of hepatic desaturases in obesity-related metabolic disorders. Curr Opin Clin Nutr Metab Care. 2010;13(6):703–8. [DOI] [PubMed] [Google Scholar]
- 61. Warensjo E, Ohrvall M, Vessby B. Fatty acid composition and estimated desaturase activities are associated with obesity and lifestyle variables in men and women. Nutr Metab Cardiovasc Dis. 2006;16(2):128–36. [DOI] [PubMed] [Google Scholar]
- 62. Bi Y, Chen J, Hu F, Liu J, Li M, Zhao L. M2 macrophages as a potential target for antiatherosclerosis treatment. Neural Plast. 2019;2019:6724903. [DOI] [PMC free article] [PubMed] [Google Scholar]
- 63. Tabung FK, Birmann BM, Epstein MM, Martinez-Maza O, Breen EC, Wu K, Giovannucci EL. Influence of dietary patterns on plasma soluble CD14, a surrogate marker of gut barrier dysfunction. Curr Dev Nutr. 2017;1(11):e001396. [DOI] [PMC free article] [PubMed] [Google Scholar]
- 64. Poslusna K, Ruprich J, de Vries JH, Jakubikova M, van't Veer P. Misreporting of energy and micronutrient intake estimated by food records and 24 hour recalls, control and adjustment methods in practice. Br J Nutr. 2009;101(Suppl 2):S73–85. [DOI] [PubMed] [Google Scholar]
- 65. Lafay L, Mennen L, Basdevant A, Charles MA, Borys JM, Eschwege E, Romon M. Does energy intake underreporting involve all kinds of food or only specific food items? Results from the Fleurbaix Laventie Ville Sante (FLVS) study. Int J Obes. 2000;24(11):1500–6. [DOI] [PubMed] [Google Scholar]
Associated Data
This section collects any data citations, data availability statements, or supplementary materials included in this article.