Abstract
Purpose
China has a heavy cancer burden. We aimed to quantitatively estimate the secular trend of cancer mortality and incidence in China.
Methods
We extracted numbers, age-specific and age-standardized rates of 29 cancer groups (from 1990 to 2017) from the Global Burden of Disease (GBD) study in 2017. We estimated rates of major cancer types for annual percent change by Joinpoint regression, and for age, period, and cohort effect by an age–period–cohort model.
Results
In 2017, breast cancer had the highest incidence rate in females. Lung cancer had the highest mortality and incidence rates in males. Although the age-standardized incidence rate of prostate cancer ranked second highest in males, it increased by 112% from 1990 to 2017. Individuals aged over 50 years were at high risk of developing cancer, and the number of deaths at this age accounted for over 89% of all cancers in all age groups. When compared with the global average level, the age-standardized mortality and incidence rates of both liver and esophageal cancers were 2.1 times higher in China, and stomach, lung and nasopharyngeal cancers in China also had high levels (more than 1.5 times higher). During 1990–2017, most of the 29 cancers exhibited an increasing incidence trend, and Joinpoint regression demonstrated increasing mortality of some major cancers. The period effect indicated that the risk of mortality and incidence due to the main cancers generally increased during 1992–2017.
Conclusion
Trend analysis provided information on the effects of prevention strategies and targeted interventions on the occurrence of different cancers. Etiological studies need to be conducted on some major cancers in the Chinese population.
Keywords: Chinese burden of cancer, mortality and incidence, trend, Joinpoint analysis, age–period–cohort analysis
Introduction
Cancer is generally considered the major cause of death worldwide. The global burden of cancer is rapidly increasing, and established risk factors for cancer include smoking, poor diet, overweight, and physical inactivity.1,2 The burden of cancers is expected to be further increased by increases in these risk factors, particularly in less developed countries.3,4 TheGBD study reported that the global burden of childhood cancers mainly existed in developing countries in 2017,5 and there are age and gender differences in the global trends of incidence and death for specific cancers.1 These differences in cancer types are mainly associated with the differences in risk factors to which people are exposed.6 In China, over the past few decades, the survival rate of cancer patients has improved significantly with advances in disease prevention, diagnosis, and treatment. However, owing to its high population density and rapidly aging populace, China is undergoing an increasing incidence of cancers. The pattern of cancer pattern in China is changing, with a rapidly increasing burden of colorectal, prostate, female breast, infection-related, and digestive cancers.7 Regarding differences in cancer types, the incidence and mortality of cancer in the Chinese population has not been specifically demonstrated. In this article, using data from the GBD 2017 study, we provide a comprehensive overview and trend analysis of morality and incidence for 29 cancer groups for both males and females in China. The severe burden of breast, prostate, liver, lung, esophageal, colorectal, and stomach cancers was analyzed by Joinpoint regression and age–period–cohort analysis for the mortality and incidence rates from 1990 to 2017.
Materials and Methods
Data Sources
The GBD 2017 study provided a comprehensive estimation of global, regional, and national incidence, prevalence, mortality, and causes of death in 195 countries and territories, and the results were published in the Lancet.8,9 The GBD study summarizes the burden of disease for global populations among different causes, locations, ages, and genders.10 The case and death numbers, and the corresponding age-standardized rates of 29 cancers based on gender and age, were collected from the GBD 2017 study.8,9 The age-standardized rates were calculated according to the direct method for all ages by the GBD 2017 global age-standardized population. The cancer types were classified into 29 groups by the International Classification of Diseases, 10th Revision (ICD-10), and cancer incidence sources were obtained from a single cancer registry or the Cancer Incidence in Five Continents (CI5), and other results such as literature data. The mortality data sources include vital registration systems, cancer registration systems, and verbal autopsy data. In China, tumor registration covers nearly the entire population. The original data for cancer mortality in the Chinese population came mainly from the Cause of Death Reporting System of the Chinese Center for Disease Control and Prevention (CDC), Disease Surveillance Points (DSPs), and the Maternal and Child Surveillance System, which are generally considered to be nationally representative.8 Ethics approval and consent to participate were not applicable in this study.
Statistical Analysis
The age-standardized death rate (ASDR) and age-standardized incidence rate (ASIR) (per 100,000 population) were adopted to quantitatively estimate the trends due to 29 cancer groups in the Chinese population. The change in cancer mortality and incidence rates from 1990 to 2017 was calculated using the Joinpoint regression model. The annual percentage change (APC) in cancer mortality and incidence rates and its statistically significant differences for each trend phase were calculated using the National Cancer Institute (NCI) Joinpoint regression program software (version 4.1.0; Statistical Research and Applications Branch, NCI).
The age–period–cohort model (APCm) is developed to reflect the relative risks of cancer mortality and incidence by estimating the age, period, and cohort effects. In this model, rates of cancer mortality and incidence were recoded into successive 5-year age groups (15–19, 20–24, …, 85–89, 90–94), consecutive 5-year periods (1992, 1997, 2002, 2007, 2012, 2017), and corresponding consecutive 5-year birth cohort groups (1902–1906, 1907–1911, …, 1997–2001, 2002–2006). The exponential value of the estimated coefficients of age, period, and cohort effects (exp(coef.) = ecoef.) denoted the relative risk (RR) of the age, period, or birth cohort effect. This analysis was conducted using Stata 14.0 software (StataCorp, College Station, TX, USA).
Results
Overall Status of Chinese Cancer Burden in 2017
Table 1 shows the number and age-standardized rates of incidence and death in the 29 cancer groups in 1990 and 2017. In 2017, the number of deaths caused by tumors reached 2 million [2,606,906 (2,507,332–2,702,388)], which was nearly twice that in 1990, although a decreasing trend in the ASDR of cancer and an upward trend in the ASIR were observed. According to GBD 2017, the cancers with the highest mortality rates included lung cancer, liver cancer, stomach cancer, esophageal cancer, and colon and rectum (colorectal) cancer. The ASDRs for these cancers were severe, with values of 36.29 (34.66–37.75), 21.30 (20.21–22.44), 18.83 (18.07–19.68), 11.25 (10.73–11.77), and 10.10 (9.57–10.55), respectively. The top 10 cancers caused nearly 85.27% of cancer deaths in China in 2017, which, ranked in descending order, were lung cancer, liver cancer, stomach cancer, esophageal cancer, colorectal cancer, breast cancer, pancreatic cancer, leukemia, other malignant neoplasms, and brain and nervous system cancer. Lung cancer was the deadliest cancer, with 26.56% of the total number of cancer deaths. Lung, stomach, liver, and colorectal cancer also had higher ASIRs, with values of 42.05 (40.25–43.96), 28.97 (27.56–30.44), 26.04 (24.57–27.54), and 22.42 (21.20–23.49), respectively. The ASIRs of breast cancer, other malignant neoplasms, non-melanoma skin cancer, esophageal cancer, and leukemia were also higher than 10.
Table 1.
Death and Incidence of All Cancers and 29 Specified Cancer Groups in China in 1990 and 2017
| Tumor Type | 1990 | 2017 | ||||||
|---|---|---|---|---|---|---|---|---|
| Death | Age-Standardized | Incidence | Age-Standardized | Death | Age-Standardized | Incidence | Age-Standardized | |
| Number | Number | Number | Number | |||||
| 103 (95% UI) | Per 100,000 (95% UI) | 103 (95% UI) | Per 100,000 (95% UI) | 103 (95% UI) | Per 100,000 (95% UI) | 103 (95% UI) | Per 100,000 (95% UI) | |
| Total neoplasms | 1417 (1376–1491) | 163.47 (158.95–172.09) | 1766 (1704–1869) | 191.00 (184.59–201.82) | 2606 (2507–2702) | 138.13 (132.85–143.07) | 4588 (4391–4770) | 244.31 (233.25–253.98) |
| Esophageal cancer | 168 (160–178) | 20.53 (19.60–21.71) | 164 (157–173) | 19.38 (18.52–20.50) | 212 (202–222) | 11.25 (10.73–11.77) | 234 (223–246) | 12.23 (11.64–12.82) |
| Stomach cancer | 284 (274–301) | 34.13 (32.99–36.23) | 295 (284–312) | 34.06 (32.81–36.12) | 355 (340–371) | 18.83 (18.07–19.68) | 561 (533–590) | 28.97 (27.56–30.44) |
| Liver cancer | 245 (228–258) | 26.72 (24.93–28.19) | 258 (240–272) | 27.16 (28.69–25.31) | 418 (396–441) | 21.30 (20.21–22.44) | 515 (486–546) | 26.04 (24.57–27.54) |
| Laryngeal cancer | 11 (10–11) | 1.34 (1.29–1.42) | 13 (13–14) | 1.52 (1.46–1.60) | 19 (18–20) | 1.00 (0.96–1.05) | 39 (37–41) | 1.98 (1.89–2.09) |
| Lung cancer | 240 (229–256) | 28.30 (27.06–30.19) | 241 (230–257) | 27.41 (26.18–29.23) | 692 (660–720) | 36.29 (34.66–37.75) | 813 (777–849) | 42.05 (40.25–43.96) |
| Breast cancer | 39 (36–49) | 4.38 (3.97–5.48) | 93 (83–113) | 9.36 (8.44–11.49) | 87 (73–94) | 4.49 (3.76–4.83) | 363 (304–394) | 18.22 (15.18–19.74) |
| Cervical cancer | 24 (22–36) | 2.73 (2.47–3.98) | 51 (46–79) | 4.98 (4.50–7.51) | 45 (29–49) | 2.29 (1.51–2.48) | 106 (66–115) | 5.44 (3.44–5.92) |
| Uterine cancer | 11 (10–12) | 1.34 (1.24–1.45) | 28 (25–30) | 2.87 (2.63–3.07) | 12 (11–13) | 0.62 (0.58–0.67) | 66 (61–72) | 3.26 (3.02–3.53) |
| Prostate cancer | 19 (16–23) | 2.97 (2.41–3.60) | 27 (21–32) | 3.66 (2.97–4.39) | 51 (43–65) | 3.03 (2.53–3.78) | 144 (124–185) | 7.76 (6.60–9.88) |
| Colorectal cancer | 75 (71–83) | 9.33 (8.78–10.29) | 107 (100–117) | 12.18 (11.45–13.41) | 187 (177–195) | 10.10 (9.57–10.55) | 431 (408–452) | 22.42 (21.20–23.49) |
| Lip and oral cavity cancer | 6 (6–7) | 0.84 (0.80–0.88) | 12 (11–13) | 1.36 (1.29–1.43) | 20 (19–21) | 1.09 (1.03–1.14) | 47 (44–49) | 2.44 (2.30–2.57) |
| Nasopharyngeal cancer | 25 (23–28) | 2.74 (2.54–2.98) | 46 (41–52) | 4.42 (3.99–4.90) | 27 (26–29) | 1.40 (1.32–1.50) | 46 (42–51) | 2.38 (2.18–2.64) |
| Other pharyngeal cancer | 56 (61–49) | 1.32 (1.43–1.16) | 3 (2–3) | 0.38 (0.28–0.43) | 117 (124–102) | 1.45 (1.53–1.26) | 10 (8–11) | 0.51 (0.44–0.58) |
| Gallbladder and biliary tract cancer | 11 (10–17) | 1.48 (1.31–2.22) | 11 (10–16) | 1.40 (1.25–2.08) | 27 (21–30) | 1.51 (1.14–1.66) | 32 (23–35) | 1.73 (1.25–1.91) |
| Pancreatic cancer | 25 (34–26) | 3.04 (2.91–3.19) | 25 (24–26) | 2.91 (2.79–3.06) | 85 (81–88) | 4.48 (4.28–4.67) | 83 (79–87) | 4.37 (4.16–4.56) |
| Malignant skin melanoma | 2 (1–3) | 0.31 (0.23–0.41) | 4 (2–5) | 0.42 (0.30–0.56) | 5 (3–5) | 0.28 (0.19–0.32) | 16 (10–18) | 0.88 (0.58–1.04) |
| Non-melanoma skin cancer | 5 (5–5) | 0.70 (0.66–0.74) | 66 (42–99) | 7.09 (4.45–10.53) | 16 (15–16) | 0.90 (0.85–0.94) | 25 (183–341) | 13.37 (9.70–17.90) |
| Ovarian cancer | 7 (6–8) | 0.81 (0.75–0.94) | 15 (13–17) | 1.42 (1.30–1.62) | 25 (23–25) | 1.26 (1.19–1.34) | 40 (38–43) | 2.07 (1.94–2.20) |
| Testicular cancer | 0.84 (0.73–1.06) | 0.08 (0.07–0.10) | 2 (1–2) | 0.17 (0.15–0.22) | 0.65 (0.59–0.70) | 0.04 (0.03–0.04) | 5 (5–6) | 0.35 (0.31–0.38) |
| Kidney cancer | 5 (5–7) | 0.64 (0.58–0.83) | 23 (21–28) | 2.27 (2.04–2.77) | 17 (15–18) | 0.94 (0.84–1.01) | 48 (43–52) | 2.69 (2.44–2.91) |
| Bladder cancer | 15 (13–17) | 2.29 (1.86–2.46) | 27 (22–29) | 3.38 (2.74–3.64) | 30 (28–35) | 1.75 (1.65–2.01) | 72 (68–83) | 3.89 (3.67–4.43) |
| Brain and nervous system cancer | 37 (27–49) | 3.72 (2.82–4.86) | 48 (34–64) | 4.51 (3.26–5.97) | 60 (50–69) | 3.43 (2.87–3.94) | 120 (98–145) | 7.87 (6.41–9.54) |
| Thyroid cancer | 3 (2–3) | 0.38 (0.35–0.45) | 11 (9–12) | 1.07 (0.95–1.18) | 6 (6–7) | 0.37 (0.35–0.41) | 41 (38–47) | 2.94 (2.71–3.33) |
| Mesothelioma | 1 (0.91–1.16) | 0.13 (0.10–0.17) | 1 (0.99–1.73) | 0.14 (0.11–0.18) | 2 (2–2) | 0.14 (0.13–0.1) | 2 (2–3) | 0.15 (0.14–0.16) |
| Hodgkin lymphoma | 5 (3–7) | 0.58 (0.33–0.71) | 9 (5–12) | 0.89 (0.48–1.11) | 2 (1–3) | 0.15 (0.11–0.17) | 18 (12–20) | 1.19 (0.86–1.36) |
| Non-Hodgkin lymphoma | 17 (17–18) | 1.90 (1.80–1.99) | 22 (20–23) | 2.19 (2.07–2.31) | 40 (38–42) | 2.18 (2.08–2.29) | 82 (78–86) | 4.47 (4.68–4.23) |
| Multiple myeloma | 5 (4–5) | 0.60 (0.55–0.67) | 6 (5–6) | 0.65 (0.58–0.72) | 12 (10–13) | 0.64 (0.56–0.69) | 19 (16–20) | 0.99 (0.83–1.07) |
| Leukemia | 67 (51–75) | 6.16 (4.87–6.89) | 98 (72–112) | 8.58 (6.49–9.78) | 60 (50–64) | 3.76 (3.18–4.07) | 141 (118–154) | 10.63 (8.87–11.84) |
| Other malignant neoplasms | 40 (35–43) | 4.41 (3.92–4.67) | 51 (43–54) | 5.18 (4.51–5.48) | 63 (55–68) | 3.56 (3.09–3.77) | 227 (197–242) | 13.68 (11.98–14.56) |
Abbreviation: UI, uncertainty interval.
From 1990 to 2017, the ASIRs of prostate cancer, malignant skin melanoma, non-Hodgkin lymphoma, thyroid cancer, and testicular cancer increased by over 100%. As well as these substantial increases, the ASIR of breast cancer also increased remarkably (94.73%). However, of the 29 cancers, only non-melanoma skin cancer demonstrated a high incidence rate, of 13.37 (9.70–17.90), but it showed a low mortality rate of 0.90 (0.85–0.94). This finding from the GBD study may indicate a low mortality/morbidity ratio of non-melanoma skin cancer in China.
Chinese Cancer Burden Affected by Gender and Age
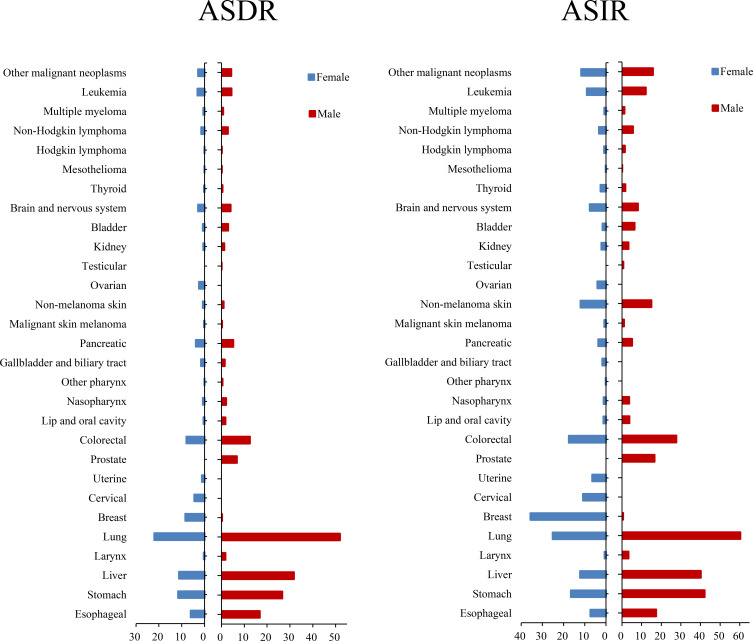
Regarding gender differences, the mortality and incidence of cancer in males were 1.89 and 1.50 times higher, respectively, than those in females(Figure 1 and Table S1). In 2017, the total number of cancer deaths in males was 1,669,303 (1,588,052–1,751,095) and in females it was 937,603 (876,978–989,714). In males, 477,246 (448,765–503,850) deaths due to lung cancer occurred, which accounted for 28.6% (females: 22.9%) of total cancer deaths (Table S2); and lung cancer had the highest ASDR [51.92 (48.90–54.75)], followed by liver cancer [31.80 (29.80–34.12)], stomach cancer [26.68 (25.27–28.26)], esophageal cancer [16.84 (15.83–17.83)], and colorectal cancer [12.48 (11.59–13.21)] in males. The ASIR of prostate cancer in males [16.57 (14.04–21.05)] was lower than for lung cancer [60.36 (56.71–63.79)], stomach cancer [42.13 (39.55–44.93)], liver cancer [40.19 (37.30–43.37)], colorectal cancer [27.67 (25.57–29.33)], and esophageal cancer [17.40 (16.30–18.50)]. Breast cancer [35.62 (29.56–38.63)] demonstrated the highest ASIR among all female neoplasms. In 2017, the number of cases with breast cancer in China was 357,569 (298,190–388,083), with 19.1% of the total incidence numbers of all cancers in females. Cervical cancer also had a high incidence rate. The ASIRs of several cancers in males were three times those in females, including laryngeal cancer, other pharyngeal cancer, liver cancer, bladder cancer, nasopharyngeal cancer, and lip and oral cavity cancer. Overall, the mortality and incidence rates of cancers in China were higher in males than in females.
Figure 1.
Age-standardized mortality and incidence of 29 cancer groups in China in 2017, by gender.
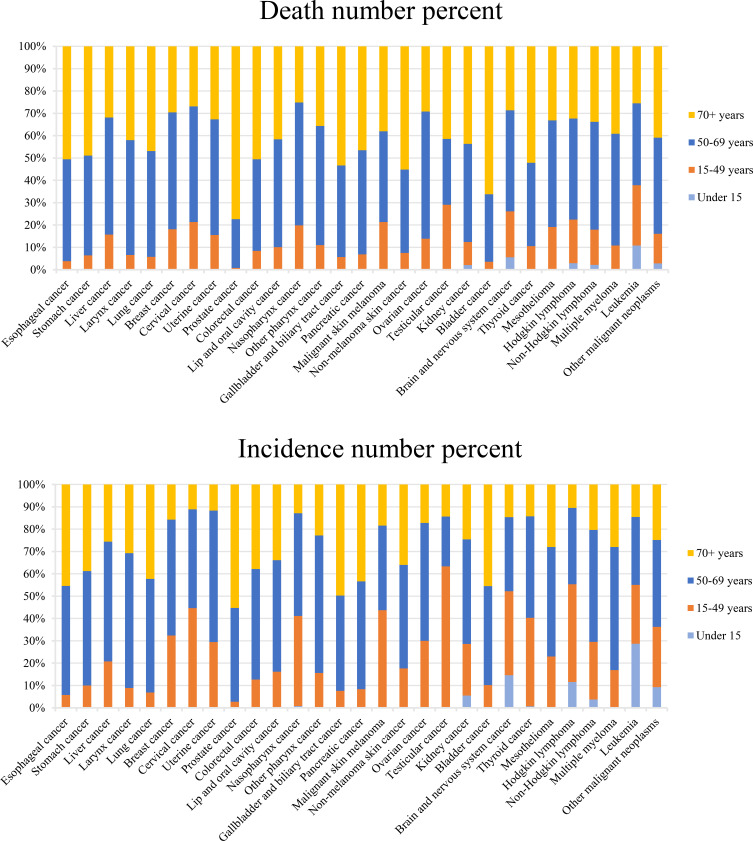
The differences between age groups in 2017 are demonstrated in Figure 2 (Table S3). The Chinese population aged 50 years and over was at high risk of developing cancer, and the number of cases and deaths in these people accounted for 80% and 89%, respectively, of those of all age groups. The individuals aged ≥50 years who died with esophageal, stomach, laryngeal, lung, colorectal, gallbladder and biliary tract, pancreatic, non-melanoma skin, and bladder cancers accounted for more than 90% of total deaths, and especially prostate cancer, with 99% of total deaths. Testicular cancer, cervical cancer, malignant skin melanoma, and Hodgkin lymphoma had the highest incidences in the 15–49 year age group, and the case number for testicular cancer in this age group accounted for 63% of the total cases. The mortality and incidence rates in children due to liver, nasopharyngeal, and thyroid cancers remained low among those aged under 15 years (less than 1% of the total numbers), as did those for kidney cancer, brain and nervous system cancers, Hodgkin lymphoma, non-Hodgkin lymphoma, leukemia, and other malignant neoplasms (less than 10%). The cancers occurrngd in children aged under 5 years mainly included kidney cancer, brain and nervous system cancers, Hodgkin lymphoma, non-Hodgkin lymphoma, leukemia, and other malignant neoplasms.
Figure 2.
Age-specific contributions of cancer types to total cancer incidence and death in China in 2017.
Chinese Cancer Burden Compared with the Global Level in 2017
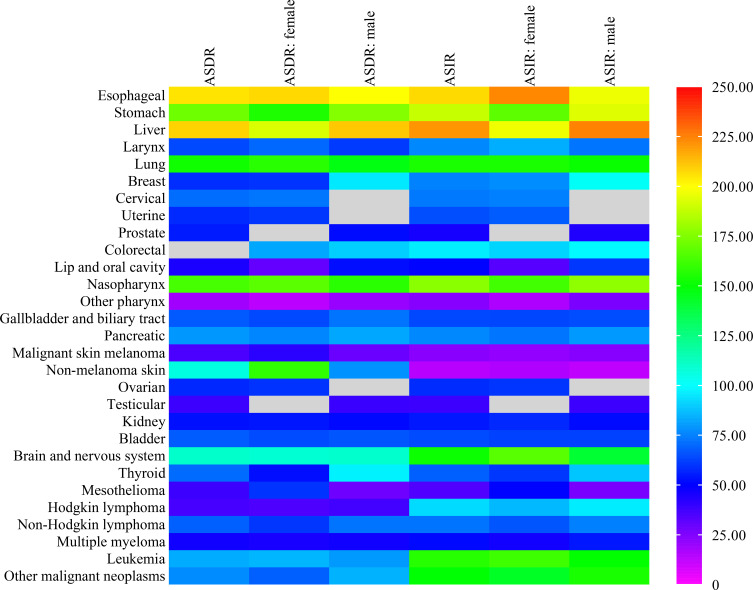
The ASDRs and ASIRs of 29 cancer groups in China were compared with global levels (Figure 3 and Table S4). The ASDRs and ASIRs for liver and esophageal cancer were both 2.1 times higher than those of the global average. In 2017, the global ASIR due to liver cancer was 11.80 (11.35–12.34), while that in China was 26.04 (24.57–27.54). The ASDRs of stomach, lung, and nasopharyngeal cancers in China were more than 1.5 times higher than the global average. Apart from stomach, lung, and nasopharyngeal cancers, the ASIRs of brain and nervous system cancer and leukemia in China were also more than 1.5 times higher than the global level. The ASDRs of lip and oral cavity cancer, other pharyngeal cancer, malignant skin melanoma, testicular cancer, mesothelioma, Hodgkin lymphoma, and multiple myeloma were all below 50% those of the global level, as were the ASIRs of prostate cancer, other pharyngeal cancer, malignant skin melanoma, non-melanoma skin cancer, testicular cancer, and mesothelioma. In terms of gender, the age-standardized death with liver cancer in males was higher than that in females when compared with the global levels (210% in males, 192% in females), as was the age-standardized incidence (224% in males, 196% in females). The gender difference was the opposite for esophageal cancer (ASDR: 199% in males, 207% in females; ASIR: 196% in males, 223% in females).
Figure 3.
Age-standardized deaths and incidence of cancers in China compared with those globally in 2017.
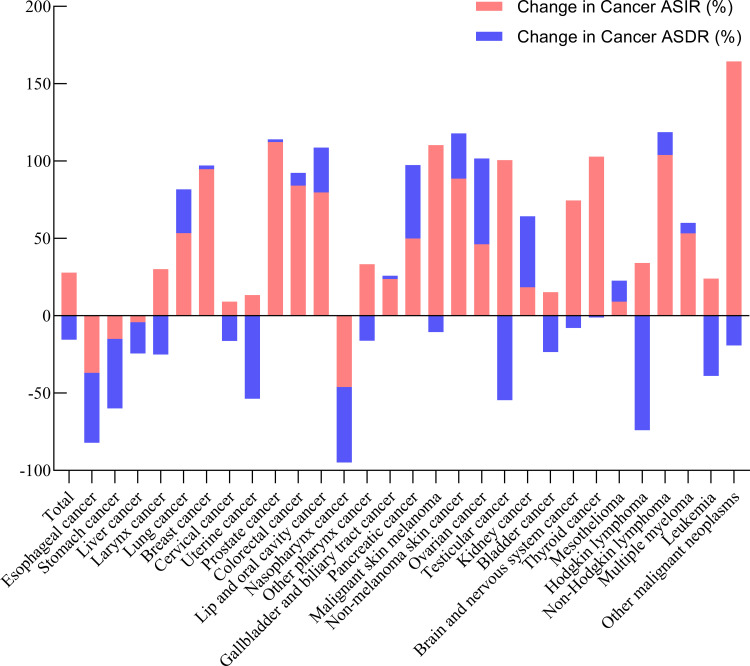
The increase in ASDRs and ASIRs in 29 cancer groups from 1990 to 2017 was analyzed and results are plotted in Figure 4 (Table S5). The ASDRs of esophageal, stomach, liver, laryngeal, cervical, uterine, nasopharyngeal, and other pharyngeal cancers, malignant skin melanoma, testicular cancer, Hodgkin lymphoma, and leukemia showed some declines. The increase in ASDRs of lung, breast, prostate, colorectal, lip and oral cavity, gallbladder and biliary tract, and non-melanoma skin cancers, mesothelioma, non-Hodgkin lymphoma, and multiple myeloma was less than 30%, while it rose by more than 45% for pancreatic, ovarian, and kidney cancers. The results revealed that the ASIR for most cancers exhibited an upward tendency in China, and it increased by greater than 100% for prostate, testicular, and thyroid cancers, non-Hodgkin lymphoma, malignant skin melanoma, and other malignant neoplasms. It is also noted that the increase in the ASIR of breast, colorectal, and non-melanoma skin cancers was close to 100%. Moreover, the increase in the incidence of some cancers was greater than the increase in the mortality of these cancers, which may indicate that the survival rate of these cancers is increasing, except for ovarian cancer, kidney cancer, and mesothelioma.
Figure 4.
Relative changes in ASDR and ASIR of 29 cancer groups in China between 1990 and 2017.
Statistical Analysis of Cancers
Breast Cancer
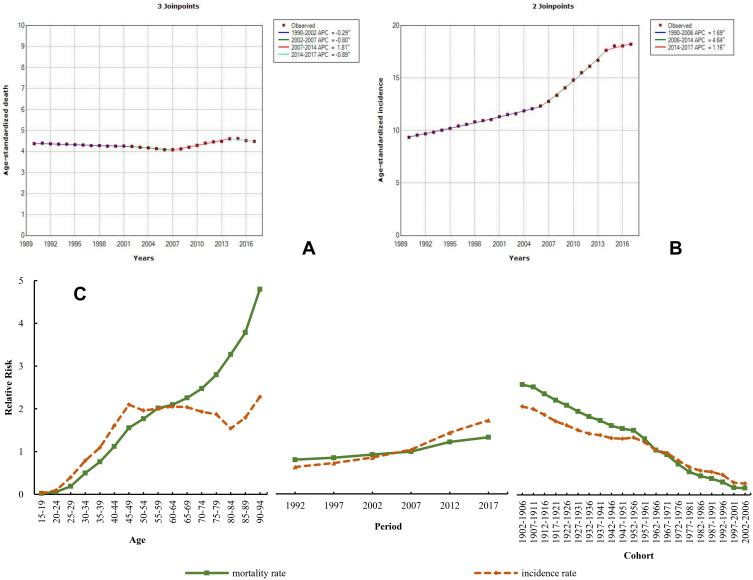
In 2017, breast cancer in females in China remained severe, with the highest ASIR, up to 35.62 (29.56–38.63), which is about 0.78 times the global level. During 1990–2017, the ASIR of breast cancer demonstrated an upward tendency, with an increase of 94.73%, and the ASDR rose by 2.46%. The Joinpoint analysis of mortality trend of breast cancer from 1990 to 2017 showed a different change, with an annual percentage change (APC) of −0.29 and −0.80 during 1990–2002 and 2002–2007, respectively, followed by an increasing tendency from 2007 to 2014 and then a decrease from 2014 to 2017 (APC=−0.80) (Figure 5A). In contrast, the rate of change in the ASIR was higher from 1990 to 2006 (APC=1.69), followed by a significant increase from 2006 to 2014 (APC=4.64), and then continuously increased during 2014–2017 (APC=1.16) (Figure 5B). When compared to 1990, the ASIR was 35.62 (29.56–38.63) in 2017, with an obvious increase of 88.77%. The ASDR in 2017 [8.47 (7.08–9.13)] was nearly the same as that in 1990 [8.57 (7.76–10.65)]. APCm analysis showed an increasing age trend in mortality, and the RR of mortality and incidence due to breast cancer increased by 237.33 and 93.31 times from the 15–19 to the 90–94-year-old age group, respectively (Figure 5C and Table S6). The period effect showed that the mortality and incidence continuously increased, by 1.65 and 2.74 times, from 1992 to 2017. The cohort effect decreased from the 1902–1905 cohort to the most recent birth cohorts.
Figure 5.
Trends in breast cancer ASDR (A), ASIR (B), and age–period–cohort effect (C) from 1990 to 2017.
Note: The incidence and mortality relative risk (RR) of a particular age, period, or birth cohort was calculated relative to each average level.
Prostate Cancer
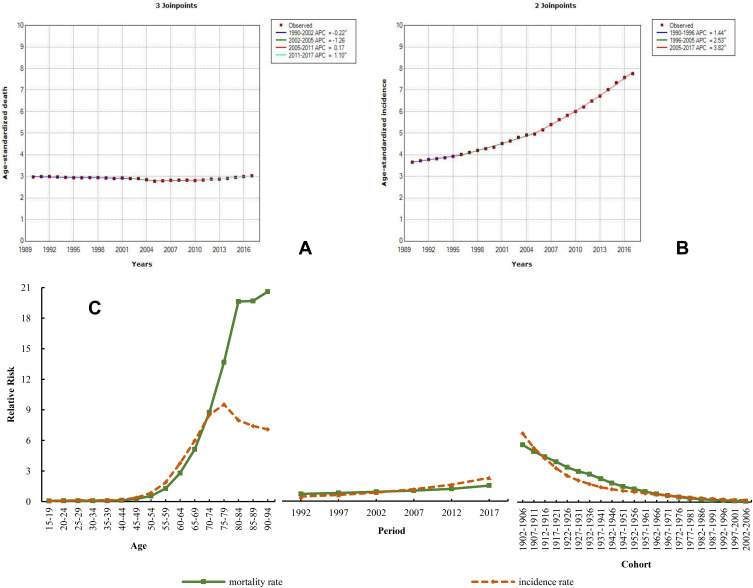
The ASIR of male prostate cancer was higher in 2017 [16.57 (14.04–21.05)] than in 1990, although it was approximately 0.44 times that worldwide, and the ASDR was also lower than the global level. During the observed period, similarly to breast cancer, the ASIR of prostate cancer also showed an increasing trend, with the highest rate of increase among the common cancers, of 112.32%. The ASDR of prostate cancer showed a very slight upward tendency, with a growth rate of 1.76%. The mortality and incidence trend of prostate cancer through this secular period was analyzed by the Joinpoint method (Figure 6A and B). The trend was similar to that of breast cancer. The ASDR presented a decreasing trend during 1990–2002 (APC=−0.22) and 2002–2005 (APC=−1.26), while it showed a small growth during 2005–2011 (APC=0.17) and 2011–2017 (APC=1.10). However, the ASIR continuously increased and a large rate of increase was observed from 1990 to 2017, with APCs of 1.44 (1990–1996), 2.53 (1996–2005), and 3.82 (2005–2017). The results from APCm analysis demonstrated different age, period, and cohort effects on prostate cancer compared to breast cancer. For the age effect, the RR of mortality and incidence increased by 297.21 and 115.12 times, respectively; for the period effect, their RR increased by 2.15 and 5.09 times, respectively (Figure 6C and Table S7).
Figure 6.
Trends in prostate cancer ASDR (A), ASIR (B), and age–period–cohort effect (C) from 1990 to 2017.
Note: The incidence and mortality relative risk (RR) of a particular age, period, or birth cohort was calculated relative to each average level.
Liver Cancer
Liver cancer is a commonly deadly malignancy, which caused 308,301 deaths in 2017. The mortality of liver cancer was shown to be the second highest, just after lung cancer. The mortality and incidence were more than twice as high as those worldwide in 2017. The ASDR and ASIR of liver cancer in 2017 were similar to those in 1990; the values were 26.72 (24.93–28.19) and 27.16 (25.31–28.69) in 1990, and 21.30 (20.21–22.44) and 26.04 (24.57–27.54) in 2017, respectively. During 1990–2017, the ASIR and ASDR showed a decreasing tendency and declined by 4.14% and 20.27%, respectively. The Joinpoint analysis of the ASDR showed an upward trend (APC=1.04) during 2013–2017 and did not change materially from 1990 to 2001 (APC=0.01), while a decline was observed from 2001 to 2009 (APC=−2.54) and from 2009 to 2013 (APC=−1.17) (Figure 7A and B). The general trend of the ASIR exhibited a Z-shaped change, which could be divided into two increases with one decline in the middle (2000–2010). In the age effect analysis, the RR of mortality and incidence increased by 64.32 and 50.69 times, respectively; the RR of the period effect on the mortality and incidence increased by 1.26 and 1.47 times, respectively (Figure 7C and Table S8).
Figure 7.
Trends in liver cancer ASDR (A), ASIR (B), and age–period–cohort effect (C) from 1990 to 2017.
Note: The incidence and mortality relative risk (RR) of a particular age, period, or birth cohort was calculated relative to each average level.
Lung Cancer
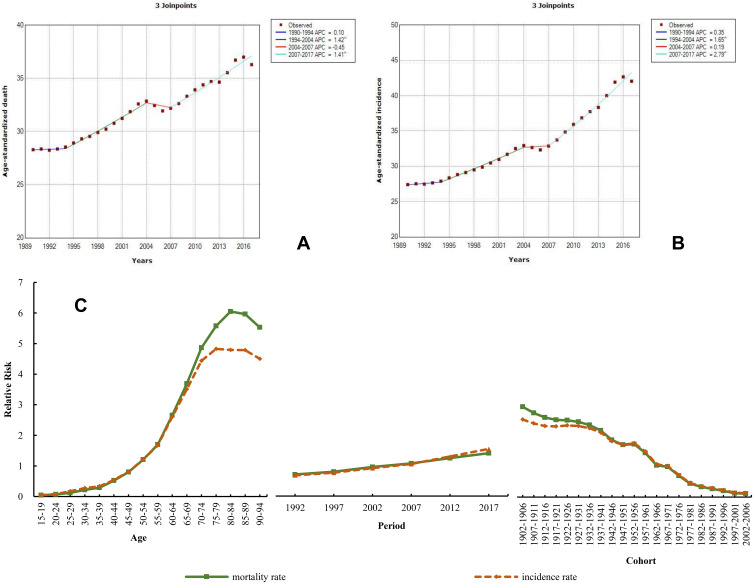
The burden of lung cancer in China remained the highest of all cancers, the mortality and incidence of which were 1.5 times those worldwide in 2017. Similarly to liver cancer, the mortality and incidence in males were also more than twice those in females (Supplementary file 1). The ASDR of male lung cancer was 60.36 (56.71–63.79) in 2017 and that of female lung cancer was 25.18 (23.83–26.75); the ASIR was much higher in males [51.92 (48.90–54.75)] than in females [21.98 (20.76–23.24)]. Compared to 1990, the ASDR and ASIR of lung cancer substantially increased in China, with increases of 28.24% and 53.43%, respectively, but this was not the maximum increase. However, GBD 2017 reported that the increase in lung cancer incidence was the largest in the world.1 Joinpoint analysis of the mortality and incidence during 1990–2017 revealed that the four stages (from 1990 to 1994, 1994 to 2004, 2004 to 2007, and 2007 to 2017) showed an upward trend, except for the slight decrease in ASDR from 2004 to 2007 (APC=−0.45) (Figure 8A and B). For APCm analysis, the RR of mortality and incidence increased by 128.91 and 104.15 times, respectively, from young age to old age; their RR increased by 1.98 and 2.28 times, respectively, from 1992 to 2017 (Figure 8C and Table S9).
Figure 8.
Trends in lung cancer ASDR (A), ASIR (B), and age–period–cohort effect (C) from 1990 to 2017.
Note: The incidence and mortality relative risk (RR) of a particular age, period, or birth cohort was calculated relative to each average level.
Esophageal Cancer
Esophageal cancer is also common in China. In 2017, the ASDR of esophageal cancer was 11.25 (10.73–11.77) and the ASIR was 12.23 (11.64–12.82), and the rates for the Chinese population were up to two times higher than those worldwide. Over the past 28 years, the ASDR and ASIR decreased by 45.21% and 36.89%, respectively. The incidence and mortality of esophageal cancer in males were much higher than those in females. In 2017, the ASDR and ASIR of esophageal cancer in males were 16.84 (15.83–17.83) and 17.40 (16.30–18.50), respectively, and those for females were 6.07 (5.61–6.53) and 7.41 (6.80–8.01), respectively. The Joinpoint analysis exhibited a continuous decline in both mortality and incidence of esophageal cancer during 1990–2017. The largest decrease was observed from 2004 to 2007, with an APC of −7.27 for ASDR and −6.82 for ASIR (Figure 9A and B). In addition, the ASIR slightly decreased, by 0.22, during 2013–2017. APCm analysis showed that the RR of mortality and incidence increased by 172.06 and 14.27 times, respectively, for age effect. However, the RR of mortality and incidence continuously decreased, by 2.25% and 73.08%, respectively, from 1992 to 2017 (Figure 9C and Table S10). Unlike the decreasing trend for other cancers, the cohort effect of esophageal cancer incidence presented an increase from the 1902–1906 to the 1952–1956 birth cohort, and subsequently a decrease.
Figure 9.
Trends in esophageal cancer ASDR (A), ASIR (B), and age–period–cohort effect (C) from 1990 to 2017.
Note: The incidence and mortality relative risk (RR) of a particular age, period, or birth cohort was calculated relative to each average level.
Colorectal Cancer
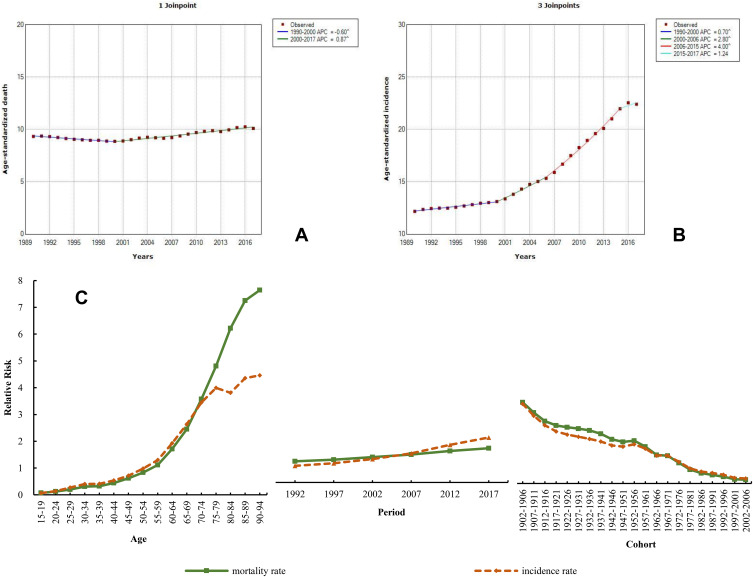
The mortality rate of colorectal cancer was less than those of lung, liver, stomach, and esophageal cancers. In 2017, the ASDR of colorectal cancer was 10.10 (9.57–10.55) and the ASIR was 22.42 (21.20–23.49). The ASDR and ASIR of colorectal cancer in China were slightly lower than thoseglobally in 2017, which increased by 84.10% and 8.20%, respectively, since 1990. The statistical analysis of ASDR found a slight decrease during 1990–2000 (APC=−0.60) and a slowly increasing trend from 2000 to 2017 (APC=0.87). However, the ASIR showed a remarkable upward trend from 1990 to 2017, with the fastest increase from 2006 to 2015 (APC=4.00) (Figure 10A and B). The mortality and incidence of colorectal cancer in males were also higher than those in females. The ASDR and ASIR in males in 2017 were 12.48 (11.59–13.21) and 27.67 (25.57–29.33), respectively, while those of females were 7.98 (7.40–8.51) and 17.56 (16.21–18.72), respectively. Both the age and period effects of the mortality and incidence exhibited increasing trends; their RRs of the age effect increased by 110.70 and 69.69 times, respectively, while their period effects increased by 1.62 and 2.71 times, respectively (Figure 10C and Table S11).
Figure 10.
Trends in colorectal cancer ASDR (A), ASIR (B), and age–period–cohort effect (C) from 1990 to 2017.
Note: The incidence and mortality relative risk (RR) of a particular age, period, or birth cohort was calculated relative to each average level.
Stomach Cancer
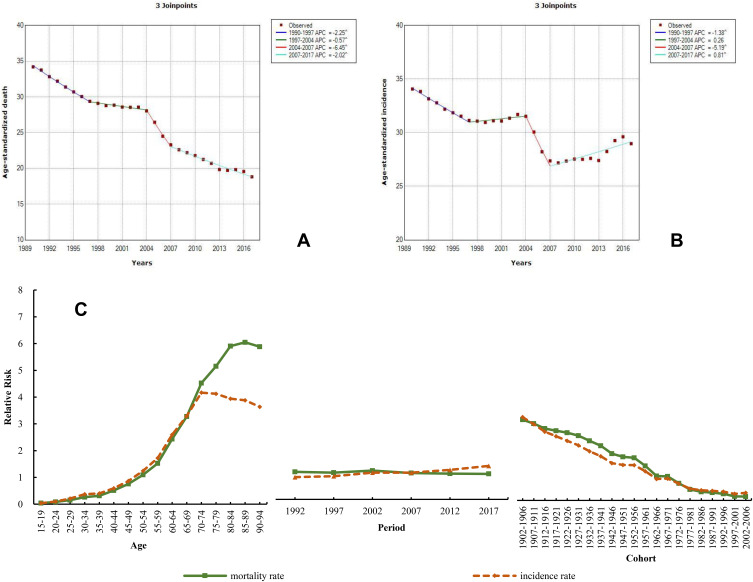
Stomach cancer has a high incidence and mortality in China. The ASDR of stomach cancer was 18.83 (18.07–19.68) and the ASIR was the second highest of all neoplasms, with a rate of 28.97 (27.56–30.44) in 2017. When compared with the global level, the ASDR and ASIR in China reached 1.71 and 1.89 times that level. From 1990 to 2017, the ASDR decreased by 44.93% and the ASIR by 14.94%. The burden of stomach cancer in males was more than twice that in females. In 2017, the male ASDR and ASIR were 26.68 (25.27–28.26) and 42.13 (39.55–44.93), respectively, and those of females were 11.61 (10.92–12.29) and 16.62 (15.55–17.72), respectively. The Joinpoint results are plotted in Figure 11A and B. The ASDR of stomach cancer showed a continuously declining trend during 1990–2017 and the largest decrease between 2004 and 2007 (APC=−6.45). Differing from the ASDR of stomach cancer, the trend of ASIR could be divided into two declines and two increases. The ASIR exhibited a significant decrease during 2004–2007 (APC=−5.19), and slow growth from 1997 to 2004 (APC=0.26) and from 2007 to 2017 (APC=0.81); additionally, the rate of decrease was 1.38 during 1990–1997. The RR of the age effect on mortality and incidence due to stomach cancer increased by 151.00 and 99.90 times, respectively; the period effect of the mortality decreased by 7.7% and that of the incidence increased by 1.50 times (Figure 11C and Table S12).
Figure 11.
Trends in stomach cancer ASDR (A), ASIR (B), and age–period–cohort effect (C) from 1990 to 2017.
Note: The incidence and mortality relative risk (RR) of a particular age, period, or birth cohort was calculated with relative to each average level.
Discussion
The Chinese burden of cancer has been alarming, aggravated by the high population density and aging, and it is stable but at a high level.7,11 Cancer deaths and cases are mainly related to lifestyle factors (including tobacco, alcohol drinking, low fruit/vegetable intake, overweight/obesity, and physical inactivity), and infections.12,13 However, a previous study indicated that the impact of all established risk factors could not be quantified, and many likely modifiable risk factors, such as consumption of red and processed meat, low consumption of fruits/vegetables, dietary fiber, and dietary calcium, are not yet firmly established as causal.14 In China, the mortality and incidence of most of cancers were higher in males than in females. Regarding age, individuals aged over 50 years had a high risk of developing cancer. Deaths in people with esophageal, colorectal, gallbladder and biliary tract, non-melanoma skin, bladder, and thyroid cancers were more likely to occur over the age of 70 years. The deaths due to liver, laryngeal, breast, cervical, uterine, nasopharyngeal, other pharyngeal, and ovarian cancers were more likely to occur in people aged 50–69 years. However, testicular cancer exhibited the highest percent (63%) of the total new cases in the age group 15–49 years. This study observed a downward trend in mortality of most of the 29 cancers, while there was a dramatically increasing tendency in cancer incidence. From 1990 to 2017, the incidence of prostate cancer, malignant skin melanoma, non-Hodgkin lymphoma, thyroid cancer, and testicular cancer increased by over 100%, and other malignant neoplasms had the most significant increase (164.42%). The incidence of esophageal, stomach, uterine, nasopharyngeal, and testicular cancers, and Hodgkin lymphoma decreased by more than 40%. The cancer spectrum has changed over the past few decades in China.15 Many factors can impact the increase or decrease in mortality and incidence of different cancers. Therefore, it is necessary to strengthen the prevention and examination strategies of different cancers.
The cancer burden in China is high, and it is expected to increase further. This study found the increase in incidence of some cancers to be greater than the increase in mortality of these cancers, including lung, breast, prostate, colorectal, lip and oral cavity, gallbladder and biliary tract, pancreatic, and non-melanoma skin cancers, non-Hodgkin lymphoma, and multiple myeloma, which may indicate that the trend in survival of these cancers is increasing, but not for ovarian or kidney cancers, and mesothelioma. This finding was not completely consistent with a previous study, which reported that the age-standardized 5-year relative survival had increased for uterine, thyroid, cervical, and bone cancers in China.16 Globally, the highest 5-year survival of most cancers remains in the USA, Canada, Australia, and New Zealand.17 Thus, the changes in cancer survival need to be further investigated. Joinpoint regression demonstrated increases or decreases in mortality and incidence of major cancers during the study period. A previous study demonstrated that tobacco is involved in the development of around 20 malignancies, and 24.5% of male cancers in China are due to tobacco smoking.7 Tobacco control in China may not impact the increase in mortality and incidence of lung, breast, prostate, and colorectal cancers. The decrease in liver, esophageal, and stomach cancers in our study is closely associated with the effective implementation of cancer screening, early diagnosis, and clinical treatment in China.7,18,19 Although population-based cancer screening has been implemented for high-risk populations for major cancers (including lung, female breast, colorectal, esophageal, gastric, and liver cancers) since 2006, the population coverage of cancer screening on a nationwide level is still insufficient, and the current largest female breast screening program has a coverage reaching only about 50% of its target population, despite its implementation since 2009.20,21 So, the prevention and treatment of these cancers should be continuously strengthened.
Age, period, and cohort effects influence the risks of morbidity and mortality from disease in specific ways, and this analysis could provide information on the causes underlying cancer incidence and deaths. In general, period effects reflect influential factors for disease, including complex sets of historical events and environmental factors, which simultaneously affect all age groups in a population. Our study found that the relative risk of period effect on mortality and incidence due to the main cancers increased significantly, except for esophageal cancer, with a continuously decreasing trend of period effect, and the mortality of stomach cancer also showed a decreasing period effect. As for cohort effects, unlike the decreasing trend of other cancers, the cohort effect of esophageal cancer incidence peaked in the 1952–1956, 1957–1961, and 1962–1966 birth cohorts. The causes underlying this trend may be related to early life exposure to risk factors. Epidemiologic evidence suggests that carcinogen exposure and nutritional deficiency may be the major risk factors for esophageal cancer in high-risk areas of China.22 The cohorts of the 1960s had a poor diet, due to a famine across China, and most people suffered malnutrition and illnesses in the 1960s. The age effects increased with advanced age, and the cohort effects decreased with birth cohort. The period effects of the main cancers are discussed in the following paragraph.
This study showed an increasing period effect of breast cancer incidence, and its ASIRwas the highest in Chinese females. However, the rate of participation in mammography screening is only 21.7% in China, far lower than in Western countries.23 Overweight, late menopause, family history of breast cancer, and passive smoking were significantly associated with breast cancer risk among Chinese women.24,25 This may be related to the increasing period effect of breast cancer. Recent air pollution control similarly did not increase the risk of breast cancer.26 However, 20–50% of breast cancers could be prevented if primary prevention measures for population were applied more widely.27 The mortality rate of liver cancer presented a downward tendency, while the period effect of liver cancer showed a slight increase in mortality and incidence. Well-established liver cancer risk factors include hepatitis B virus (HBV) and hepatitis C virus (HCV), cirrhosis, aflatoxin exposure, heavy alcohol drinking, tobacco smoking, and some rare monogenic syndromes such as hereditary hemochromatosis and α1-antitrypsin deficiency.28 Hepatocellular carcinoma (HCC) accounted for 75–85% of liver cancer types.1 HBV and HCV occurred in more than 50% and 25% of HCC patients, respectively.29 HBV vaccination has been widespread for newborns since 2002 in China.30 Screening reduces liver cancer incidence and mortality in the Chinese population. However, the epidemic of liver cancer risk factors (eg, HBV) remained stable in China during 2004–2014, and HCV rapidly increased during the same period.31 This condition may impact the period effect of liver cancer. Apart from HBV and HCV, the rapidly increasing consumption of alcohol may have also increased the period trends of liver cancer incidence in recent years.32 Improved management of Helicobacter pylori infection and screening for early stomach cancer contributed to the decrease in the incidence of the disease.33,34 Thus, the increasing period effect of liver cancer may be associated with these factors. Dietary habits improved; for example, more frequent vegetable and garlic consumption possibly contributed to the decline in stomach cancer mortality, as well as the mortality in esophageal cancer.35,36 Esophageal cancer includes esophageal squamous cell carcinoma (ESCC) and esophageal adenocarcinoma, and ESCC was considered the predominant type in China, with more than 90% of the total number of esophageal cancer cases.37 The decreasing period effect of esophageal cancer may be related to changes in dietary habits, an appropriate implementation approach for screening of populations at high risk, and early diagnosis of this cancer.21,38 The period effect of stomach cancer mortality and incidence has not increased over the past few decades, which is probably related to effective screening for early stomach cancer and improved management of H. pylori infection.33,34 However, a heavy financial burden has been imposed on the Chinese population by stomach cancer, as well as by esophageal cancer, for which medical expenditure in China has substantially increased in the past 10 years, and the burden of esophageal cancer has been constantly higher than that of stomach cancer.20,21 Furthermore, although screening was conducted for early stomach cancer, there were still the obstacles of awareness, low detection, and a lower coverage or participation rate for stomach cancer screening among target populations in China.34 The mortality of colorectal cancer showed a slight decrease in 1990–2000 but a slow increase in 2000–2017, and the incidence has increased rapidly over the past 28 years. With the development of “Western” lifestyles in China, the risk factors for colorectal cancer include tobacco and alcohol use, overweight/obesity, physical inactivity, low vegetable intake, low fruit intake, and high red and processed meat intake, which could explain the increasing period effect of the disease.39 However, compliance with colonoscopy was unsatisfactory for colorectal cancer screening in a few cities in China, such as Shanghai and Tianjin,40,41 which may impact the increasing incidence and decreasing mortality of colorectal cancer. While prostate cancer mortality shows a downward trend worldwide,2 increasing ASIR and no obvious changes in ASDR were observed in the Chinese population, which are likely to be attributable to aging, family history, and lifestyle and dietary factors, such as obesity, physical inactivity, smoking, and antioxidant intake.42 Prostate-specific antigen (PSA) screening for prostate cancer has become controversial in recent years, as it may have led to the overdiagnosis and overtreatment of prostate cancer clinically,43,44 which may explain the increasing period effect of prostate cancer. Most importantly, the mortality and incidence of lung cancer in the Chinese population increased substantially from 1990 to 2017, which may be attributed to the high prevalence of tobacco smoking.45,46 However, tobacco control in China is still unsatisfactory: in a national survey, the 2015 China Tobacco Control Report observed that the adult male smoking rate was more than 50%.18 Previous studies also demonstrated that outdoor particulate matter exposure had a positive association with lung cancer risk.47,49 Thus, the increasing period effect of lung cancer may by caused by tobacco smoking and increasing levels of air pollution.
Thus, it is necessary to focus on early prevention of cancer and on health education. Among the Chinese population, awareness regarding the risk factors of cancer, such as smoking, drinking, obesity/overweight, preserved and high-fat foods, low physical activity, and air pollution, should be raised. People should also reduce their exposure to risk factors (such as H. pylori infection, HBV, and HCV) and targeted screening should be performed for major cancers in the early stages to control the occurrence and development of cancer.
There are some limitations to this study. First, GBD estimates depend on the quality and quantity of the data sources available worldwide. The data were collected from vital registration systems, cancer registries, health surveys, and other data systems, and inaccuracies and misclassifications in the data may impact the results. Second, underreporting and failure of diagnosis could be sources of bias, and thus some types of cancer may be underestimated.
Conclusions
The incidence of most cancers is increasing in China, and the burden of different cancers in China differs with gender and age. These differences may be attributable to the combination of population composition and environmental factors, as well as changing lifestyles in the Chinese population. People aged over 50 years are at high risk of developing cancer. Some major cancers demonstrate increasing changes of incidence or mortality, and the relative risk of mortality and incidence increased during this observation period. Therefore, etiological studies need to be considered and conducted to understand the causes of the occurrence of different cancers, which could effectively guide control strategies and targeted interventions for cancer in the Chinese population.
Acknowledgments
We appreciate the work by the Global Burden of Disease study 2017 collaborators. I want to extend my sincere gratitude to Rongshou Zheng (National Cancer Center/Cancer Hospital, Chinese Academy of Medical Science) for his instructive advice and useful suggestions on my thesis.
Funding Statement
This work was supported by the National Key Research and Development Program of China [grant numbers 2018YFC1315302, 2017YFC1200502] and the National Natural Science Foundation of China [grant number 81773552].
Abbreviations
APC, annual percentage change; APCm, age period cohort model; ASDR, age-standardized death rate; ASIR, age-standardized incidence rate; CDC, Center for Disease Control; CI5, Cancer Incidence in Five Continents; DSP, Disease Surveillance Point; GBD, Global Burden of Disease; HBV, hepatitis B virus; HCC, hepatocellular carcinoma; HCV, hepatitis C virus; ICD, International Classification of Diseases; NCI, National Cancer Institute.
Data Sharing Statement
The datasets generated and/or analyzed during the current study are available in the GBD repository: http://ghdx.healthdata.org/gbd-results-tool.
Author Contributions
All authors contributed to data analysis, drafting or revising the article, gave final approval of the version to be published, and agree to be accountable for all aspects of the work.
Disclosure
The authors report no conflicts of interest in this work.
References
- 1.Lin L, Yan L, Liu Y, Yuan F, Li H, Ni J. Incidence and death in 29 cancer groups in 2017 and trend analysis from 1990 to 2017 from the global burden of disease study. J Hematol Oncol. 2019;12(1):96. doi: 10.1186/s13045-019-0783-9 [DOI] [PMC free article] [PubMed] [Google Scholar]
- 2.Bray F, Ferlay J, Soerjomataram I, Siegel RL, Torre LA, Jemal A. Global cancer statistics 2018: GLOBOCAN estimates of incidence and mortality worldwide for 36 cancers in 185 countries. CA Cancer J Clin. 2018;68(6):394–424. doi: 10.3322/caac.21492 [DOI] [PubMed] [Google Scholar]
- 3.Torre LA, Bray F, Siegel RL, Ferlay J, Lortet-Tieulent J, Jemal A. Global cancer statistics, 2012. CA Cancer J Clin. 2015;65(2):87–108. doi: 10.3322/caac.21262 [DOI] [PubMed] [Google Scholar]
- 4.Cai Z, Liu Q. Understanding the global cancer statistics 2018: implications for cancer control. Sci China Life Sci. 2019. doi: 10.1007/s11427-019-9816-1 [DOI] [PubMed] [Google Scholar]
- 5.Force LM, Abdollahpour I, Advani SM, GBD 2017 Childhood Cancer Collaborators. The global burden of childhood and adolescent cancer in 2017: an analysis of the global burden of disease study 2017. Lancet Oncol. 2019;20(9):1211–1225. doi: 10.1016/S1470-2045(19)30339-0 [DOI] [PMC free article] [PubMed] [Google Scholar]
- 6.Maule M, Merletti F. Cancer transition and priorities for cancer control. Lancet Oncol. 2012;13(8):745–746. doi: 10.1016/S1470-2045(12)70268-1 [DOI] [PubMed] [Google Scholar]
- 7.Feng RM, Zong YN, Cao SM, Xu RH. Current cancer situation in China: good or bad news from the 2018 global cancer statistics? Cancer Commun. 2019;39(1):22. doi: 10.1186/s40880-019-0368-6 [DOI] [PMC free article] [PubMed] [Google Scholar]
- 8.GBD 2017 Causes of Death Collaborators. Global, regional, and national age-sex-specific mortality for 282 causes of death in 195 countries and territories, 1980–2017: a systematic analysis for the global burden of disease study 2017. Lancet. 2018;392(10159):1736–1788. [DOI] [PMC free article] [PubMed] [Google Scholar]
- 9.Disease GBD, Injury I, Prevalence C. Global, regional, and national incidence, prevalence, and years lived with disability for 354 diseases and injuries for 195 countries and territories, 1990–2017: a systematic analysis for the global burden of disease study 2017. Lancet. 2018;392(10159):1789–1858. [DOI] [PMC free article] [PubMed] [Google Scholar]
- 10.Murray CJ, Lopez AD, Jamison DT. The global burden of disease in 1990: summary results, sensitivity analysis and future directions. Bull World Health Organ. 1994;72(3):495–509. [PMC free article] [PubMed] [Google Scholar]
- 11.Chen W, Zheng R, Baade PD, et al. Cancer statistics in China, 2015. CA Cancer J Clin. 2016;66(2):115–132. doi: 10.3322/caac.21338 [DOI] [PubMed] [Google Scholar]
- 12.Islami F, Chen W, Yu XQ, et al. Cancer deaths and cases attributable to lifestyle factors and infections in China, 2013. Ann Oncol. 2017;28(10):2567–2574. doi: 10.1093/annonc/mdx342 [DOI] [PubMed] [Google Scholar]
- 13.Brown KF, Rumgay H, Dunlop C, et al. The fraction of cancer attributable to modifiable risk factors in England, Wales, Scotland, Northern Ireland, and the United Kingdom in 2015. Br J Cancer. 2018;118(8):1130–1141. doi: 10.1038/s41416-018-0029-6 [DOI] [PMC free article] [PubMed] [Google Scholar]
- 14.Islami F, Goding Sauer A, Miller KD, et al. Proportion and number of cancer cases and deaths attributable to potentially modifiable risk factors in the United States. CA Cancer J Clin. 2018;68(1):31–54. doi: 10.3322/caac.21440 [DOI] [PubMed] [Google Scholar]
- 15.Yang G, Wang Y, Zeng Y, et al. Rapid health transition in China, 1990–2010: findings from the global burden of disease study 2010. Lancet. 2013;381(9882):1987–2015. doi: 10.1016/S0140-6736(13)61097-1 [DOI] [PMC free article] [PubMed] [Google Scholar]
- 16.Zeng H, Chen W, Zheng R, et al. Changing cancer survival in China during 2003–15: a pooled analysis of 17 population-based cancer registries. Lancet Global Health. 2018;6(5):e555–e567. doi: 10.1016/S2214-109X(18)30127-X [DOI] [PubMed] [Google Scholar]
- 17.Allemani C, Matsuda T, Di Carlo V, et al. Global surveillance of trends in cancer survival 2000–14 (CONCORD-3): analysis of individual records for 37 513 025 patients diagnosed with one of 18 cancers from 322 population-based registries in 71 countries. Lancet. 2018;391(10125):1023–1075. doi: 10.1016/S0140-6736(17)33326-3 [DOI] [PMC free article] [PubMed] [Google Scholar]
- 18.Chinese Center for Disease Control and Prevention. Tobacco survey report in adult China, 2015. 2015. Available from: http://www.chinacdc.cn/jlm/yw/201512/t20151228_123960.html. Accessed June22, 2020.
- 19.Guan CT, Song GH, Li BY, et al. Endoscopy screening effect on stage distributions of esophageal cancer: a cluster randomized cohort study in China. Cancer Sci. 2018;109(6):1995–2002. doi: 10.1111/cas.13606 [DOI] [PMC free article] [PubMed] [Google Scholar]
- 20.Yang Z, Zeng H, Xia R, et al. Annual cost of illness of stomach and esophageal cancer patients in urban and rural areas in China: a multi-center study. Chin J Cancer Res. 2018;30(4):439–448. doi: 10.21147/j.issn.1000-9604.2018.04.07 [DOI] [PMC free article] [PubMed] [Google Scholar]
- 21.Guo LW, Huang HY, Shi JF, et al. Medical expenditure for esophageal cancer in China: a 10-year multicenter retrospective survey (2002–2011). Chin J Cancer. 2017;36(1):73. doi: 10.1186/s40880-017-0242-3 [DOI] [PMC free article] [PubMed] [Google Scholar]
- 22.Lin Y, Totsuka Y, Shan B, et al. Esophageal cancer in high-risk areas of China: research progress and challenges. Ann Epidemiol. 2017;27(3):215–221. doi: 10.1016/j.annepidem.2016.11.004 [DOI] [PubMed] [Google Scholar]
- 23.Wang BH, He MF, Wang LM, Engelgau MM, Zhao WH, Wang LH. Breast cancer screening among adult women in China, 2010. Prev Chronic Dis. 2013;10:e183. [DOI] [PMC free article] [PubMed] [Google Scholar]
- 24.Lee H, Li JY, Fan JH, et al. Risk factors for breast cancer among Chinese women: a 10-year nationwide multicenter cross-sectional study. J Epidemiol. 2014;24(1):67–76. doi: 10.2188/jea.JE20120217 [DOI] [PMC free article] [PubMed] [Google Scholar]
- 25.Chen C, Huang YB, Liu XO, et al. Active and passive smoking with breast cancer risk for Chinese females: a systematic review and meta-analysis. Chin J Cancer. 2014;33(6):306–316. doi: 10.5732/cjc.013.10248 [DOI] [PMC free article] [PubMed] [Google Scholar]
- 26.Andersen ZJ, Ravnskjaer L, Andersen KK, et al. Long-term exposure to fine particulate matter and breast cancer incidence in the Danish Nurse Cohort Study. Cancer Epidemiol Biomarkers Prev. 2017;26(3):428–430. doi: 10.1158/1055-9965.EPI-16-0578 [DOI] [PubMed] [Google Scholar]
- 27.Global Burden of Disease Cancer Collaboration, Fitzmaurice C, Allen C, et al. Global, regional, and national cancer incidence, mortality, years of life lost, years lived with disability, and disability-adjusted life-years for 32 cancer groups, 1990 to 2015: a systematic analysis for the global burden of disease study. JAMA oncol. 2017;3(4):524–548. doi: 10.1001/jamaoncol.2016.5688 [DOI] [PMC free article] [PubMed] [Google Scholar]
- 28.El-Serag HB. Epidemiology of viral hepatitis and hepatocellular carcinoma. Gastroenterology. 2012;142(6):1264-+. doi: 10.1053/j.gastro.2011.12.061 [DOI] [PMC free article] [PubMed] [Google Scholar]
- 29.Suh JK, Lee J, Lee JH, Shin S, Tchoe HJ, Kwon JW. Risk factors for developing liver cancer in people with and without liver disease. PLoS One. 2018;13(10):e0206374. doi: 10.1371/journal.pone.0206374 [DOI] [PMC free article] [PubMed] [Google Scholar]
- 30.Liao XY, Liang ZL. Strategy vaccination against hepatitis B in China. Hum Vacc Immunother. 2015;11(6):1534–1539. [DOI] [PMC free article] [PubMed] [Google Scholar]
- 31.Liu Z, Yang Q, Shi O, Ye W, Chen X, Zhang T. The epidemiology of hepatitis B and hepatitis C infections in China from 2004 to 2014: an observational population-based study. J Viral Hepat. 2018;25(12):1543–1554. doi: 10.1111/jvh.12938 [DOI] [PubMed] [Google Scholar]
- 32.Turati F, Galeone C, Rota M, et al. Alcohol and liver cancer: a systematic review and meta-analysis of prospective studies. Ann Oncol. 2014;25(8):1526–1535. doi: 10.1093/annonc/mdu020 [DOI] [PubMed] [Google Scholar]
- 33.Yang L, Zheng R, Wang N, et al. Incidence and mortality of stomach cancer in China, 2014. Chin J Cancer Res. 2018;30(3):291–298. doi: 10.21147/j.issn.1000-9604.2018.03.01 [DOI] [PMC free article] [PubMed] [Google Scholar]
- 34.Zong L, Abe M, Seto Y, Ji J. The challenge of screening for early gastric cancer in China. Lancet. 2016;388(10060):2606. doi: 10.1016/S0140-6736(16)32226-7 [DOI] [PubMed] [Google Scholar]
- 35.Takezaki T, Gao CM, Wu JZ, et al. Dietary protective and risk factors for esophageal and stomach cancers in a low-epidemic area for stomach cancer in Jiangsu Province, China: comparison with those in a high-epidemic area. Jpn J Canc Res. 2001;92(11):1157–1165. doi: 10.1111/j.1349-7006.2001.tb02135.x [DOI] [PMC free article] [PubMed] [Google Scholar]
- 36.Wang JW, Zhang CG, Deng QL, Chen WL, Wang X, Yu JM. The associations of comorbidities and consumption of fruit and vegetable with quality of life among stomach cancer survivors. Health Qual Life Out. 2018;16:62. [DOI] [PMC free article] [PubMed] [Google Scholar]
- 37.Liang H, Fan JH, Qiao YL. Epidemiology, etiology, and prevention of esophageal squamous cell carcinoma in China. Cancer Biol Med. 2017;14(1):33–41. doi: 10.20892/j.issn.2095-3941.2016.0093 [DOI] [PMC free article] [PubMed] [Google Scholar]
- 38.Lin Y, Totsuka Y, He Y, et al. Epidemiology of esophageal cancer in Japan and China. J Epidemiol. 2013;23(4):233–242. doi: 10.2188/jea.JE20120162 [DOI] [PMC free article] [PubMed] [Google Scholar]
- 39.Gu MJ, Huang QC, Bao CZ, et al. Attributable causes of colorectal cancer in China. BMC Cancer. 2018;18(1):38. doi: 10.1186/s12885-017-3968-z [DOI] [PMC free article] [PubMed] [Google Scholar]
- 40.Shaukat A, Mongin SJ, Geisser MS, et al. Long-term mortality after screening for colorectal cancer. N Engl J Med. 2013;369(12):1106–1114. doi: 10.1056/NEJMoa1300720 [DOI] [PubMed] [Google Scholar]
- 41.Zhou Q, Li Y, Liu HZ, Liang YR, Lin GZ. Willingness to pay for colorectal cancer screening in Guangzhou. World J Gastroenterol. 2018;24(41):4708–4715. doi: 10.3748/wjg.v24.i41.4708 [DOI] [PMC free article] [PubMed] [Google Scholar]
- 42.Wilson KM, Giovannucci EL, Mucci LA. Lifestyle and dietary factors in the prevention of lethal prostate cancer. Asian J Androl. 2012;14(3):365–374. doi: 10.1038/aja.2011.142 [DOI] [PMC free article] [PubMed] [Google Scholar]
- 43.Tabayoyong W, Abouassaly R. Prostate cancer screening and the associated controversy. Surg Clin North Am. 2015;95(5):1023–1039. doi: 10.1016/j.suc.2015.05.001 [DOI] [PubMed] [Google Scholar]
- 44.Li M, Na YQ. The detection rate of prostate cancer in different prostate-specific antigen (PSA) levels in Chinese men. Zhonghua Yi Xue Za Zhi. 2008;88(1):16–18. [PubMed] [Google Scholar]
- 45.Yang G, Fan L, Tan J, et al. Smoking in China: findings of the 1996 national prevalence survey. JAMA. 1999;282(13):1247–1253. doi: 10.1001/jama.282.13.1247 [DOI] [PubMed] [Google Scholar]
- 46.Yang Y, Wang JJ, Wang CX, Li QA, Yang GH. Awareness of tobacco-related health hazards among adults in China. Biomed Environ Sci. 2010;23(6):437–444. [DOI] [PubMed] [Google Scholar]
- 47.Jin Y, Andersson H, Zhang S. Air pollution control policies in China: a retrospective and prospects. Int J Environ Res Public Health. 2016;13(12):1219. doi: 10.3390/ijerph13121219 [DOI] [PMC free article] [PubMed] [Google Scholar]
- 48.Hamra GB, Guha N, Cohen A, et al. Outdoor particulate matter exposure and lung cancer: a systematic review and meta-analysis. Environ Health Perspect. 2014;122(9):906–911. doi: 10.1289/ehp/1408092 [DOI] [PMC free article] [PubMed] [Google Scholar]
- 49.Consonni D, Carugno M, De Matteis S, et al. Outdoor particulate matter (PM10) exposure and lung cancer risk in the EAGLE study. PLoS One. 2018;13(9):e0203539. doi: 10.1371/journal.pone.0203539 [DOI] [PMC free article] [PubMed] [Google Scholar]
Associated Data
This section collects any data citations, data availability statements, or supplementary materials included in this article.
Data Citations
- Chinese Center for Disease Control and Prevention. Tobacco survey report in adult China, 2015. 2015. Available from: http://www.chinacdc.cn/jlm/yw/201512/t20151228_123960.html. Accessed June22, 2020.


