Abstract
Background
Breast cancer is the most common malignant cancer in women worldwide and is one of the leading causes of cancer death. Basal-like breast cancer (BLBC) is an aggressive subtype of breast cancer for which targeted therapy has poor efficacy. Therefore, research into the molecular pathogenesis of BLBC is urgent for developing effective targeted therapeutic treatments.
Methods
We collected relevant data from the Cancer Genome Atlas (TCGA), including transcriptome, copy number variation, and survival data. We also gathered 30 pairs clinical samples of cancer tissues and non-cancerous tissues to perform Western Blotting (WB) to reveal the encoded protein expression levels. Besides, we knocked down frequently rearranged in advanced T-cell lymphomas 2 (FRAT2) expression in two representative cell lines (T47D and MDA-MB-231 cells). The cell cycle progression was analyzed, while the apoptosis experiments were also conducted to explore the molecular pathogenesis of FRAT2 in BLBC.
Results
The aberrant activation of the WNT pathway and highly expressed FRAT2 were specifically identified across the BLBC genome comparing to other types of tumor. In addition, FRAT2 expression was found to be positively associated with its copy number variations (P=9.126×10⁻²³). For further investigation, we found the expression level of FRAT2 was related to the poor overall survival of BLBC patients (P=0.049). The results of WB revealed that FRTA2-encoded protein was overexpressed in BLBC tissues. Based on results in T47D and MDA-MB-231 cells in vitro, we found that knocking down FRAT2 can inhibit the proliferation of these two cell lines. In cell cycle progression experiments, cell cycle arrested in the G2/M phase. Meanwhile, increased apoptosis was also found in the shFRAT2 cell group in vitro.
Conclusions
In BLBC basal-like breast cancer, we can assume that FRAT2 is a potential treatment target.
Keywords: Basal-like breast cancer (BLBC), frequently rearranged in advanced T-cell lymphomas 2 (FRAT2), WNT signaling pathway
Introduction
Breast cancer is one of the most lethal gynaecological cancers in the world and is the leading cause of cancer death worldwide (1). Breast cancer has 4 subtypes: basal-like, luminal A, luminal B, and HER2-positive breast cancer (2). Thereinto, basal-like breast cancer (BLBC) accounts for approximately 15% of all breast cancers (3). It is known as the most aggressive type of primary breast cancer with a high recurrence rate and poor prognosis. Most BLBC cases show the lack of expression of estrogen (ER) and progesterone (PR) receptors as well as human epidermal growth factor receptor 2 (HER-2) (3-5). Unlike the luminal types and the HER2-overexpressed type of breast carcinomas, BLBC lacks a specific targeted therapy (6,7). Currently, chemotherapy remains the standard therapeutic approach for treating BLBC. Therefore, we need comprehensive research to identify new therapeutic targets for treating BLBC.
The oncogenesis and development of BLBC are related to a variety of signaling pathways. For example, PI3K/AKT/mTOR (8), epidermal growth factor receptor (EGFR), and Notch (9) pathways play a role in production, proliferation, differentiation, invasion and metastasis. While Hedgehog and WNT/β-catenin signaling pathways (10) are involved in the growth, invasion and metastasis of BLBC cells. Some inhibitors of these pathways (such as EGFR and mTOR) can suppress the growth, invasion and metastasis of BLBC (11).
The WNT signaling pathway is highly conserved in hydra, sea anemone, nematode, fruit fly and human cells (12). The pathway was an essential signaling pathway in a variety of biological processes, including embryonic development, inflammation and oncogenesis. The development of colon cancer, melanoma, prostatic cancer, lung cancer and other types of cancer is associated with the aberrantly activated WNT signaling pathway (13). The abnormal regulation of the WNT signaling pathway is a popular research topic in cancer biology. Previous researches have shown that mutations and overexpression of important regulators of the WNT pathway are often found. Among them, CTNNB1 was mutated to gain of function which can aberrantly activate the WNT signaling pathway (14). The WNT signaling pathway has been attracting attention for its role in the development and progression of tumours since the discovery that aberrantly activated WNT induces malignant transformation of mouse breast tissue and, more recently, the advent of tumour genome sequencing.
Here, we found that the important regulator of the WNT signaling pathway (FRAT2) is one of the differentially expressed genes (DEGs) uniquely expressed in BLBC among 4 subtypes of breast cancer. We identified the role of FRAT2 in BLBC oncogenesis and development based on the cellular experiments. Considering the lack of available target therapy and the poor prognosis for those with BLBC, we focused the research on molecular pathogenesis to discover specific targets for potential treatment.
Methods
Clinical samples
Thirty-pairs of BLBC tissues and the adjacent tissues were acquired from the Third Hospital of Nanchang. The tissues were frozen in liquid nitrogen and then immediately stored at −80 °C. The Ethics Committee of The Third Hospital of Nanchang approved the protocol (approval number: 20194010), and all patients provided consent for the utilization of their tissue samples in this study. The study conformed to the provisions of the Declaration of Helsinki (as revised in Edinburgh 2000).
The Cancer Genome Atlas (TCGA) data collection and analysis
Through July 2018, we systematically collected relevant data, including the expression level on a genome-wide scale, BLBC phenotypes, the overall survival rate and the expression of noncancerous tissue from the Cancer Genome Atlas (TCGA) in cBioPortal (http://www.cbioportal.org/). We also obtained gene copy number variation data. Meanwhile, the transcriptome data were downloaded from the Genotype-Tissue Expression (GTEx, https://www.gtexportal.org/). All the quantification files were corrected and downloaded as “txt” formats.
We detected differential expression genes (DEGs) by Bayesian analysis of 4 subtypes of breast cancer in comparison with adjacent noncancerous tissue. Subsequently, we performed a Cox regression model to determine survival analysis, and a Kaplan-Meier survival curve was plotted.
After overlapping DEGs of the 4 subtypes of breast cancers, namely, BLBC, luminal A, luminal B and HER2-positive breast cancer, we used these unique DEGs in a BLBC pathway analysis. Subsequently, Gene Ontology (GO) annotation and Kyoto Encyclopedia of Genes and Genomes (KEGG) pathway enrichment analysis was accessed to identify the pathways related to these DEGs, which were analyzed using the Web-based Gene Set Analysis Toolkit (Web Gestalt).
Cell culture
Human breast cancer cell lines, namely, MCF7, T47D, SKBR3, BT549 and MDA-MB-231, were purchased from the American Type Culture Collection (ATCC, Manassas, VA, USA), and the T47D and MDA-MB-231 cells are BLBC cell lines. The cells were cultured in Dulbecco’s modified Eagle’s medium (DMEM) (Invitrogen, Carlsbad, CA, USA) containing 10% foetal bovine serum (FBS) with 5% CO2.
Plasmid construction and transfection
FRAT2 was isolated from the human cDNA library. The shRNA sequences targeting FRAT2 were shFRAT2-1, CCGGAGGATGGCTCAGGGACGCGGTCTCGAGACCGCGTCCCTGAGCCATCCTTTTTTGG; shFRAT2-2, CCGGCCACCCTTTCTGGTGTCTATACTCGAGTATAGACACCAGAAAGGGTGGTTTTTG; and shFRAT2-3, CCGGGCATCGGCTCCTCCAGCAGCTCTCGAGAGCTGCTGGAGGAGCCGATGCTTTTTG. The positive control shRNA (shPC) sequence was CCGGGCCAATCGTTCTCTGACAGAACTCGAGTTCTGTCAGAGAACGATTGGCTTTTT.
The MDA-MB-231 and T47D cells were transferred from the cell culture flask to 24-well plates. A scrambled shRNA served as the negative control. We determined FRAT2 expression levels in cells after 48 h. The shRNA was transfected into T47D and MDA-MB-23 cells using the Lipofectamine 3000 reagent (Life Technologies Corp., Carlsbad, CA, USA).
5-Ethynyl-2’-deoxyuridine (EdU) staining assay
Cells were further cultured for 48 h to be labelled by EdU after transfection. We used phosphate buffer saline (PBS) containing 4% paraformaldehyde to fix the cells at room temperature for 30 min. Then, we neutralized the cells with 2 mg/mL deoxythymidylate, which was cleared with 0.1% Triton X-100 applied for 10 min, followed by a PBS wash. Apollo643 was applied for 30 min, and the nuclei were stained with 4',6-diamidino-2-phenylindole (DAPI) for 20 min. Subsequently, images were captured using Acumen X3. The DAPI-stained cells were regarded as total cells, which were activated by laser at a wavelength of 405 nm, while the emitted light was received by a blue channel (bandpass filter of 420–500 nm). We obtained the number of total cells by collecting and analyzing the target signatures at peak intensity, width and depth. The EdU-Apollo643-stained cells were indicative of proliferating cells, which were activated by laser at a wavelength of 633 nm, and emitted light was received by a red tunnel to obtain and collect the number of proliferating cells.
RNA purification and quantification by qRT-PCR
We used 1 µg of total RNA extracted with TRIzol reagent (Invitrogen, Carlsbad, CA, USA) for RT using the PrimeScript RT reagent kit with gDNA Eraser (TaKaRa, Dalian, Liaoning, China) according to the manufacturer’s protocol. Quantitative reverse transcription polymerase chain reaction (qRT-PCR) was performed with SYBR green (Applied Biosystems, Foster City, CA, USA) by means of a ViiA7 real-time PCR system (Applied Biosystems, Foster City, CA, USA). All reactions were conducted in triplicate. We calculated the relative mRNA expression by the comparative Ct method using glyceraldehyde-3-phosphate dehydrogenase (GAPDH) as an internal control. The following primers were used for GAPDH: forward, 5'-TGACTTCAACAGCGACACCCA-3' and reverse, 5'-CACCCTGTTGCTGTAGCCAAA-3'. The following primers were used for FRAT2: forward, 5'-GCGGCTGGTAACTTCTCTGG-3' and reverse, 5'-GGGAAACCTCATCAAGGAAGC-3'.
Western blotting
Total protein was extracted using radioimmunoprecipitation lysis buffer Roche, Nutley, NJ, USA). Protein lysates were quantified with a BioRad kit (Biorad, Hercules, CA, USA). Microgram protein samples were separated via 10% sodium dodecyl sulfate polyacrylamide gel electrophoresis (SDS-PAGE) and then electrophoretically transferred to a polyvinylidene difluoride membrane (Millipore, MA, USA). The membranes were immunoblotted with primary antibodies overnight at 4 °C followed by respective secondary antibodies incubating 4 hours. ECL is used to detect the band. The antibodies used as follows: FRAT2 (1:1,000; Proteintech Group, IL, USA); GAPDH (1:5,000; Epitomics Burlingame, CA, USA); anti-rabbit IgG antibody (1:4,000; Epitomics Burlingame, CA, USA).
Cell apoptosis detection
The T47D cells (1×10⁶) with or without shFRAT2 treatment were collected and allowed to react with 5 µL annexin V-fluorescein isothiocyanate (FITC) and 5 µL PI at room temperature under conditions void of light for 5–15 min according to the instructions from the manufacturer of the cell apoptosis detection kit (Keygen Biotech Co., Ltd., Nanjing, Jiangsu, China). The flow cytometer with FL1 and FL3 detectors was set to record at a wavelength of 480 nm. We repeated this for three times.
Cell cycle detection
The T47D cells (1×10⁶) with or without shFRAT2 treatment were collected, fixed with 500 µL 70% cold ethanol for 2 h then overnight according to the manual for the cell cycle detection kit (Keygen Biotech Co., Ltd., Nanjing, Jiangsu, China) and stored at 4 °C. After the removal of fixative with PBS, the cells were placed in a water bath and 100 µL RNase A was added at 37 °C and incubated for 30 min. Furthermore, we incubated the cells with 400 µL propidium iodide (PI) for 30 min under darkness. The cell cycle was detected on a flow cytometer (BD Accuri C6, Ann Arbor, MI, USA) by red fluorescence set to a wavelength of 480 nm and analyzed by FlowJo software. We repeated this for three times.
Statistical analysis
Data analyses were performed using SPSS 22.0 software (SPSS Inc., Chicago, IL, USA). Results are expressed as mean ± SD or SEM as indicated. When comparing the expression level of FRAT2 in BLBC tissue and adjacent non-cancerous tissues in TCGA database, the statistical analyses were performed using the Student’s t-test or analysis of variance. The Spearman’s rank analysis was performed to identify the correlation between gene expression level and copy number variation. P values <0.05 were considered significant.
Results
Target gene FRAT2 selection via DEG overlap and pathway analysis
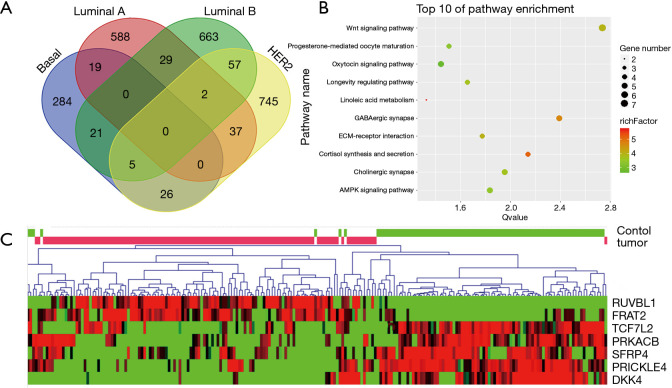
A total of 652 cases of breast cancer (BLBC, n=124; luminal A breast cancer, n=299; luminal B breast cancer, n=166; HER2 positive breast cancer, n=63) and 92 cases of normal control were downloaded from cBioPortal. Meanwhile, the transcriptome data of 20 normal breast samples were downloaded from the GTEx. After integrated analyzing the collected data, we obtained the transcriptome data of 112 breast control groups to compare the expression differences with breast cancer data (P<0.01). The comparison results revealed that there were 588, 663, 745 and 284 DGEs in Luminal A, Luminal B, HER2 and BLBC subtypes of breast cancer, respectively (Figure 1A). Through comparative analysis, we detected fewer genes were shared among the subtypes. There were only 31 DEGs in the overlapping regions, indicating that each subtype had different molecular mechanisms.
Figure 1.
The process of target gene FRAT2 selection. (A) The diagram shows DEGs of noncancerous tissues and cancerous tissues that overlap within the 4 subtypes of breast cancers (basal-like, luminal A, luminal B and HER2 positive breast cancer). We detected the 284 specific DEGs in BLBC (P<0.05). (B) The results showed the top 10 enriched pathways, which included the WNT signaling pathway, progesterone-mediated oocyte maturation, oxytocin signaling pathway, and longevity regulating pathway. Thereinto, the WNT signaling pathway had the lowest p-value, which represents the strongest statistical significance (ratio =3.9789, P=0.002). (C) The differential expression conditions of 7 WNT pathway related genes in basal-like breast cancer. The heatmap shows that, RUVBL1, FRAT2, TCF7L2, PRKACB, SFRP4, PRICKLE4 and DKK4 were involved in the WNT pathway among these 284 DEGs. FRAT2, frequently rearranged in advanced T-cell lymphomas 2; DEGs, differential expression genes; BLBC, Basal-like breast cancer.
After searching for overlapping DEGs from these 4 subtypes of breast cancer, we obtained 284 genes that were uniquely and differentially expressed in BLBC with statistical significance. We performed pathway enrichment analysis to these 284 DEGs to discover the underlying molecular mechanism of BLBC. In total, DEGs were enriched in 10 signaling pathways (P<0.05, Figure 1B). The WNT signaling pathway showed the highest statistical significance (ratio =3.9789, P=0.0018). And this pathway contained seven DEGs, which were specifically differential expressed in BLBC (FRAT2, PRICKLE4, PRKACB, RUVBL1, SFRP4, TCF7L2). To further explore the expression pattern of these 7 genes in BLBC tissues, a visual heatmap was plotted (Figure 1C). It was observed that FRAT2 and RUVBL1 were highly expressed in BLBC tissues but poorly expressed in normal breast tissues. RUVBL1 has been reported as a known oncogene of breast cancer (15). Based on these, the focus of our study was the mechanism of FRAT2 in BLBC.
High FRAT2 expression level in BLBC in 30 paired BLBC and normal tissues
For further investigation of FRAT2 expression, we collected 30 paired BLBC tumor tissues and adjacent normal tissues to measure protein expression level using Western blotting assay. To illustrate the matching pairs situation, we made 30 linear graphs to show the results. Each line had the same tendency, which demonstrated that higher expression in BLBC tissue (Figure 2A). We selected the results of four paired groups as representation. Compared with the paired adjacent normal tissues, the protein levels of FRAT2 were significantly upregulated in BLBC tissues (Figure 2B). After comparing the expression level of FRAT2 in BLBC tissue and adjacent non-cancerous tissues in TCGA database, the results revealed that FRAT2 was significantly overexpressed in the BLBC tissues (P=9.16×10⁻¹⁹, Figure 2C).
Figure 2.
Analysis of FTAT2 expression levels based on clinical samples. (A) We compared the Western blotting results of 30 pairs of BLBC tissues and adjacent normal tissues. The 30 linear graphs had same tendency. In each pair, the expression level of BLBC was higher than normal tissues. (B) The Western blotting results of four paired tissues revealed that the expression level of BLBC was significantly higher in that in adjacent normal tissues. (C) The expression of FRAT2 was significantly higher in tumor tissue (t-test =9.726, P=9.16×10⁻¹⁹). FRAT2, frequently rearranged in advanced T-cell lymphomas 2; BLBC, Basal-like breast cancer.
FRAT2 overexpression in BLBC is related to prognosis and copy number variation
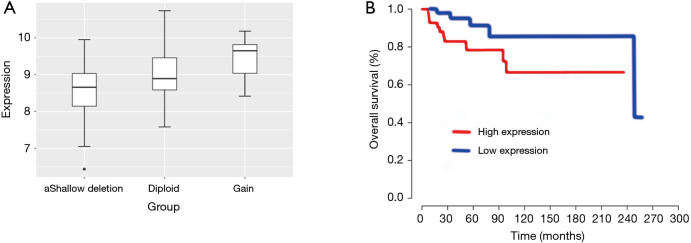
In order to investigate the reason of FRAT2 overexpression in BLBC, we downloaded the DNA copy number variation data of FRAT2 in tumor from the TCGA database and compared it with the gene expression data of corresponding patients. We detected an association between the copy number variation and the expression of FRAT2 in BLBC patients (Figure 3A). In combination with Spearman’s rank correlation coefficient on gene expression data, the FRAT2 expression level was positively correlated with copy number variation (P=9.126×10⁻²³).
Figure 3.
The FRAT2 expression results of the clinical data analysis from TCGA. (A) The expression levels and copy number variation were positively correlated (P=9.126×10⁻²³). (B) FRAT2 overexpression resulted in a shorter overall survival time and poor prognosis (P=0.049). FRAT2, frequently rearranged in advanced T-cell lymphomas 2; TCGA, the Cancer Genome Atlas.
Furthermore, we downloaded the expression profile and clinical information of 124 cases of BLBC from TCGA website to explore the relationship between FRAT2 overexpression and prognosis via survival analysis. The Kaplan-Meier survival plot demonstrated that FRAT2 overexpression correlated with poor prognosis (P=0.049, Figure 3B). These all indicated FRAT2 was essential in clinical analysis of BLBC. Generally, the above two results both suggested that FRAT2 might be a predictor of poor prognosis of BLBC. And, FRAT2 may be a potential therapeutic target for it.
The effects of FRAT2 knockdown on BLBC cell lines
To investigate the mechanism of the FRAT2 effects on cell phenotype, we selected 5 breast cancer cell lines (MCF7, T47D, SKBR3, BT549 and MDA-MB-231) and conducted cell experiments on them. FRAT2 mRNA expression levels were further detected by real-time fluorescence quantitative PCR following total RNA extraction. The T47D cell line exhibited high FRAT2 expression levels, while the MDA-MB-231 cell line exhibited low expression levels (Figure 4A).
Figure 4.
The cell proliferation rate of different cell lines compared to the control and shFRAT2 groups. (A) Five breast cancer cell lines were used to detect the expression level of FRAT2. Among these 5 cell lines, the T47D cells had the highest expression levels, while MDA-MB-231 cells had the lowest expression levels. These two cell lines are also BLBC cell lines. Subsequently, shMONK, shFRAT2 and shRNA targeted against FOXM1 were transfected into T47D and MDA-MB-231 cells, and these transfected cells were named the shCtrl, shFRAT2 and shPC group, respectively. The shCtrl group cells were transfected with MONK, which has no effect on cell proliferation; therefore, the T47D and MDA-MB-231 cells could divide normally. (B) We constructed 4 plasmids, including a control and 3 shFRAT2 plasmids. shFRAT2-1 showed the most significantly silencing effect. (C) Three constructed shRNAs were also detected by Western blotting assay. FRAT2 silencing effects were all significant in these three plasmids. shFRAT2-1 was the most significant. FRAT2, frequently rearranged in advanced T-cell lymphomas 2.
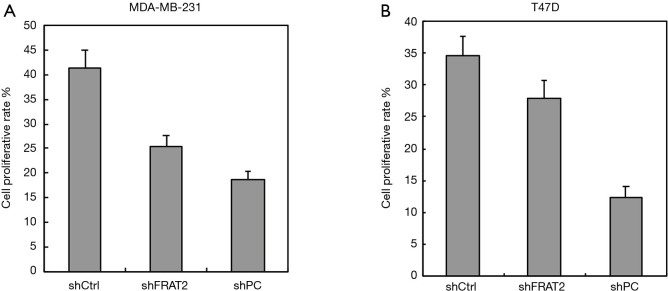
Furthermore, 3 shRNAs were constructed to silence FRAT2 expression, the silencing effect of each shRNA was evaluated using highly expressed T47D cell lines by qRT-PCR. FRAT2-shRNA-1 down-regulated FRAT2 with a 13% drop (Figure 4B). Moreover, we performed western blotting assay for FRAT2 and GAPDH levels in three constructed shRNAs (shFRAT2-1, shFRAT2-2, shFRAT2-3). The quantification of WB was also analyzed (Figure S1). The knocking down effect of shFRAT2-1 was the most obvious one (Figure 4C). So, we selected shFRAT2-1 to knock down the FRAT2 expression and evaluated the effect of FRAT2 expression on the proliferation of BLBC cells by Edu experiment. In the MDA-MB-231 cell model, the cell proliferation rate after transfection with shFRAT2 was significantly lower than that with blank plasmid (P=0.024, Figure 5A). Similarly, FRAT2 knockdown significantly suppressed T47D cell proliferation in the shFRAT2 group (P=0.002, Figure 5B). The accurate alteration rate was 34% in the shCtrl group, 27% in the shFART2 group, and 12% in the shPC group. The results of the two cell lines were consistent.
Figure S1.
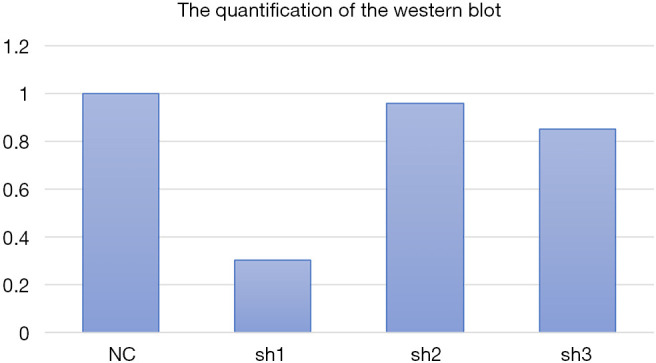
The quantification of Western Blotting. We analyzed the gray values of the WB results. We set NC as a standard, the relative values of three constructed shRNA were shown in the figure. The shRNA-1 had the most significant effect on knocking down, which was consistent to the results of mRNA expression. WB, western blotting.
Figure 5.
FRAT2 silencing effects of MDA-MB-231 and T47D cell lines. (A) The three constructed plasmids were introduced into MAD-MB-231 cell lines. The expression level of shFRAT2 was significantly reduced compared with that of the control group (P=0.024). (B) Three of the same plasmids were introduced into T47D cell lines. The expression level of FRAT2 was also reduced (P=0.002). FRAT2, frequently rearranged in advanced T-cell lymphomas 2.
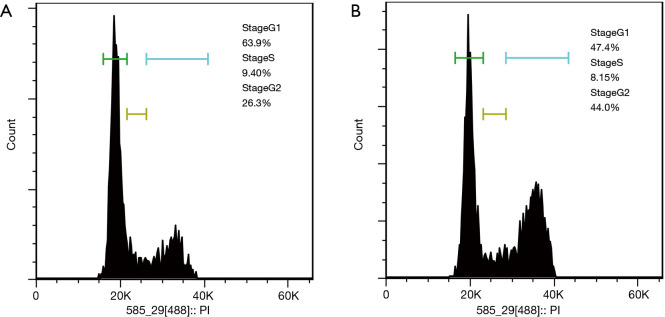
Cell cycle experiments were carried out to verify the effect of FRAT2 on the cell cycle of BLBC. The flow cytometry results showed the percentage alteration of T47D cells in different stages at 48 hours after shFRAT2-1 transfection comparing to the control cells. In T47D control cells, G1 phase cells occupies 63.9%, S phase was 9.4% and G2 phase was 26.3% of all cells. The cell cycle of transfected T47D cells showed that G1 stage was 47.4%, S stage was 8.15%, and G2 stage was 44.0% (Figure 6A,B). The results revealed that more cells in arrest during the G2/M phase. These results validated that FRAT2 accelerated the BLBC cell cycle to promote oncogenesis.
Figure 6.
The effect of shFRAT2 on cell cycle progression. (A) The percentage of T47D control cells at different stages of the cell cycle. Cells in stage G1 made up 63.9% of all the cells in the cell cycle analysis, 9.4% of the cells were in stage S, and 26.3% were in stage G2. (B) The cell cycle of transfected T47D cells indicates that 47.4% were in stage G1, 8.15% were in stage S, and 44.0% were in stage G2. FRAT2, frequently rearranged in advanced T-cell lymphomas 2.
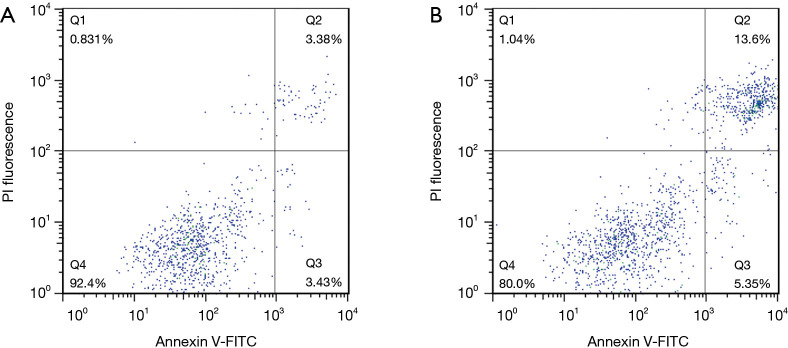
In addition, FRAT2 exerted inhibitory effects on BLBC cell apoptosis to promote tumor development, as determined by the significantly higher early apoptosis and late apoptosis rates for the T47D cells in the shFRAT2-1 group (Figure 7). Among T47D control cells, Q2 accounted for 3.38% and Q3 accounted for 3.34%. The total number of cells in Q2 and Q3 is 6.81%. In shFRAT2-1 transfected T47D cells, Q2 accounted for 13.6% and Q3 accounted for 5.35%. The total number of cells in Q2 and Q3 is 18.95%. Taken together, the aforementioned findings demonstrated that FRAT2 functioned as a predictor of poor prognosis in BLBC patients and played an important role in the development and progression of BLBC as a potential therapeutic strategy.
Figure 7.
Differences in apoptosis levels between the control and shFRAT2-1 groups of T47D cells. (A) The percentage of T47D control group cells in Q2 was 3.38%, and in Q3, it was 3.34%. The sum of the cells in Q2 and Q3 was 6.81%. (B) Of the shFRAT2-1 transfected T47D cells, 13.6% were in Q2, while 5.35% were in Q3. The sum of the cells in Q2 and Q3 was 18.95%. FITC, fluorescein isothiocyanate; FRAT2, frequently rearranged in advanced T-cell lymphomas 2.
Discussion
The WNT signaling pathway is a key pathway for tissue development and homeostasis because it mediates stem cells. Therefore, the abnormal WNT signaling pathway has been described as a critical player in the initiation, maintenance and development of multiple cancers due to its involvement in mediation of tumor stem cell behaviours. The development of new therapeutic compounds targeting the WNT signaling pathway promises new hope to eliminate cancer stem cells and eradicate cancer (16). Given the aforementioned literature review, the current study was designed to explore the function of the WNT signaling pathway in the development and progression of BLBC.
After obtaining 284 DEGs that are differentially expressed only in BLBC, we found through the pathway enrichment analysis that the WNT signaling pathway was abnormally and specifically activated in BLBC. β-catenin is degraded through interaction with Axin, adenomatous polyposis coli (APC), and protein kinase glycogen synthase kinase-3B (GSK-3B) (16). The WNT signaling proteins bind to the Frizzled/low density lipoprotein receptor-related protein (LRP) receptor complex on the surface of cells. Upon signaling, receptors transduce a signal to Dishevelled and Axin to inhibit the degradation of β-catenin (17). Thus, β-catenin accumulates in the cytoplasm and nucleus and then interacts with TCF to regulate transcription.
FRAT2 is a WNT signaling pathway regulator that is on human chromosome 10q24.1 and is capable of encoding 233 amino-acid proteins that share 77.3% total amino-acid identity with FRAT1 (18). FRAT2 is overexpressed in cancer tissues such as lung cancer. The overexpression of FRAT2 was due to the increased expression of tumor cells themselves, rather than the tumor-infiltrating immune cells (19). And the FRAT2 upregulation is closely related to the activation of the WNT signaling pathway (15). It has been reported that the FRAT2 mRNA of 2.4 kb is relatively highly expressed in MKN45 (gastric cancer), HeLa S3 (cervical cancer), and K-562 (chronic myelogenous leukaemia) (15). This FRAT2 upregulation may be related to the activation of the WNT signaling pathway (20). The GSK-3B binding protein involving FRAT2 promotes the abnormal β-catenin accumulation that activates the WNT signaling pathway and inhibits GSK-3B (21), by which carcinogenesis is promoted.
In the present study, using Bayesian analysis, Cox survival analysis and pathway analysis (KEGG), we found that the WNT signaling pathway was aberrantly activated in BLBC and that FRAT2 was highly expressed. The FRAT2 expression level was positively associated with copy number variation, which means that more copies were associated with higher FRAT2 expression levels. One of the possible reasons why the BLBC cell lines showed a high level of FRAT2 expression was that BLBC cells have many mutations that affect copy number. In addition, natural selection might induce the high copy numbers of FRAT2 observed in BLBC. Therefore, FRAT2 overexpression has been determined as a stable phenotype of BLBC cell lines.
In addition, patients with high levels of FRAT2 expression have significantly shorter survival times. Two representative BLBC cell lines were selected and treated with shFRAT2, which exhibited relatively strong interfering effects on FRAT2 expression, followed by cell proliferation, apoptosis and cycle distribution detection. The results showed that silencing FRAT2 exerted inhibitory effects on tumor cell proliferation and the cell cycle while promoting cell apoptosis. Based on the abovementioned experiments and analysis, it was inferred that FRAT2 might be a potential target for use in BLBC treatments.
Our research brings several inspirations to the clinical aspect. Based on our analysis, FRAT2 can be used as a target for the treatment of BLBC and drug discovery. Meanwhile, the copy number variation of FRAT2 can be used as a biomarker for drug selection of BLBC, such as the inhibitor of the WNT signalling pathway. Although our research suggested that FRAT2 had great potential in the treatment of BLBC. However, we were unable to confirm that available drugs could be screened based on FRAT2 as a target in clinical aspect. Meanwhile, we did not determine whether inhibitors of the WNT signalling pathway were more effective in treating BLBC patients with high FRAT2 expression. None of this has been verified. Therefore, we need further researches on the molecular mechanism.
Conclusions
Through performing pathway analysis of 284 specific DEGs of BLBC and detecting gene expression level, we found that FRAT2 was highly expressed in tumors and can aberrantly activated WNT pathway. At the clinical level, FRAT2 expression was negatively correlated with the prognosis of patients. Meanwhile, FRAT2 can block G2/M phase and promote apoptosis in cell. Knockdown of FRAT2 can also suppress cell proliferation. Based on clinical data analysis and cell experiments, we can assume FRAT2 is a potential target for BLBC treatment in clinical aspect.
Supplementary
The article’s supplementary files as
Acknowledgments
Funding: None.
Ethical Statement: The authors are accountable for all aspects of the work in ensuring that questions related to the accuracy or integrity of any part of the work are appropriately investigated and resolved. The Ethics Committee of the Third Hospital of Nanchang approved the protocol (approval number: 20194010), and all patients provided consent for the utilization of their tissue samples in this study. The study conformed to the provisions of the Declaration of Helsinki (as revised in 2013),
Footnotes
Data Sharing Statement: Available at http://dx.doi.org/10.21037/jtd-20-1557A
Conflicts of Interest: All authors have completed the ICMJE uniform disclosure form (available at http://dx.doi.org/10.21037/jtd-20-1557A). The authors have no conflicts of interest to declare.
References
- 1.Harbeck N, Gnant M. Breast cancer. Lancet 2017;389:1134-50. 10.1016/S0140-6736(16)31891-8 [DOI] [PubMed] [Google Scholar]
- 2.Hunter A. Mammographic density: The risk and detection of breast caner. J Biolaw Bus 2007;356:227-36. [DOI] [PubMed] [Google Scholar]
- 3.Gadi VK, Davidson NE. Practical Approach to Triple-Negative Breast Cancer. J Oncol Pract 2017;13:293-300. 10.1200/JOP.2017.022632 [DOI] [PubMed] [Google Scholar]
- 4.Nedeljković M, Damjanović A. Mechanisms of Chemotherapy Resistance in Triple-Negative Breast Cancer-How We Can Rise to the Challenge. Cells 2019;8:957. 10.3390/cells8090957 [DOI] [PMC free article] [PubMed] [Google Scholar]
- 5.Boyle P. Triple-negative breast cancer: epidemiological considerations and recommendations. Ann Oncol 2012;23 Suppl 6:vi7-vi12. 10.1093/annonc/mds187 [DOI] [PubMed] [Google Scholar]
- 6.Bianchini G, Balko JM, Mayer IA, et al. Triple-negative breast cancer: challenges and opportunities of a heterogeneous disease. Nat Rev Clin Oncol 2016;13:674-90. 10.1038/nrclinonc.2016.66 [DOI] [PMC free article] [PubMed] [Google Scholar]
- 7.Jhan JR, Andrechek ER. Triple-negative breast cancer and the potential for targeted therapy. Pharmacogenomics 2017;18:1595-609. 10.2217/pgs-2017-0117 [DOI] [PMC free article] [PubMed] [Google Scholar]
- 8.Vanhaesebroeck B, Guillermet-Guibert J, Graupera M, et al. The emerging mechanisms of isoform-specific PI3K signalling. Nat Rev Mol Cell Biol 2010;11:329-41. 10.1038/nrm2882 [DOI] [PubMed] [Google Scholar]
- 9.Guruharsha KG, Kankel MW, Artavanis-Tsakonas S. The Notch signalling system: recent insights into the complexity of a conserved pathway. Nat Rev Genet 2012;13:654-66. 10.1038/nrg3272 [DOI] [PMC free article] [PubMed] [Google Scholar]
- 10.Pak E, Segal RA. Hedgehog Signal Transduction: Key Players, Oncogenic Drivers, and Cancer Therapy. Dev Cell 2016;38:333-44. 10.1016/j.devcel.2016.07.026 [DOI] [PMC free article] [PubMed] [Google Scholar]
- 11.Sims-Mourtada J, Opdenaker LM, Davis J, et al. Taxane-induced hedgehog signaling is linked to expansion of breast cancer stem-like populations after chemotherapy. Mol Carcinog 2015;54:1480-93. 10.1002/mc.22225 [DOI] [PubMed] [Google Scholar]
- 12.Fan W, Xie J, Xia J, et al. RUVBL1-ITFG1 interaction is required for collective invasion in breast cancer. Biochim Biophys Acta Gen Subj 2017;1861:1788-800. 10.1016/j.bbagen.2017.03.016 [DOI] [PubMed] [Google Scholar]
- 13.Tai D, Wells K, Arcaroli J, et al. Targeting the WNT Signaling Pathway in Cancer Therapeutics. Oncologist 2015;20:1189-98. 10.1634/theoncologist.2015-0057 [DOI] [PMC free article] [PubMed] [Google Scholar]
- 14.Raisch J, Côté-Biron A, Rivard N. A Role for the WNT Co-Receptor LRP6 in Pathogenesis and Therapy of Epithelial Cancers. Cancers (Basel) 2019;11:1162. 10.3390/cancers11081162 [DOI] [PMC free article] [PubMed] [Google Scholar]
- 15.Saitoh T, Moriwaki J, Koike J, et al. Molecular cloning and characterization of FRAT2, encoding a positive regulator of the WNT signaling pathway. Biochem Biophys Res Commun 2001;281:815-20. 10.1006/bbrc.2001.4421 [DOI] [PubMed] [Google Scholar]
- 16.Duchartre Y, Kim YM, Kahn M. The Wnt signaling pathway in cancer. Crit Rev Oncol Hematol 2016;99:141-9. 10.1016/j.critrevonc.2015.12.005 [DOI] [PMC free article] [PubMed] [Google Scholar]
- 17.Lee E, Salic A, Krüger R, et al. The roles of APC and Axin derived from experimental and theoretical analysis of the Wnt pathway. PLoS Biol 2003;1:E10. 10.1371/journal.pbio.0000010 [DOI] [PMC free article] [PubMed] [Google Scholar]
- 18.Karim R, Tse G, Putti T, et al. The significance of the Wnt pathway in the pathology of human cancers. Pathology 2004;36:120-8. 10.1080/00313020410001671957 [DOI] [PubMed] [Google Scholar]
- 19.van Amerongen R, Nawijn M, Franca-Koh J, et al. Frat is dispensable for canonical Wnt signaling in mammals. Genes Dev 2005;19:425-30. 10.1101/gad.326705 [DOI] [PMC free article] [PubMed] [Google Scholar]
- 20.Logan CY, Nusse R. The Wnt signaling pathway in development and disease. Annu Rev Cell Dev Biol 2004;20:781-810. 10.1146/annurev.cellbio.20.010403.113126 [DOI] [PubMed] [Google Scholar]
- 21.Stoothoff WH, Cho JH, McDonald RP, et al. FRAT-2 preferentially increases glycogen synthase kinase 3 beta-mediated phosphorylation of primed sites, which results in enhanced tau phosphorylation. J Biol Chem 2005;280:270-6. 10.1074/jbc.M410061200 [DOI] [PubMed] [Google Scholar]
Associated Data
This section collects any data citations, data availability statements, or supplementary materials included in this article.
Supplementary Materials
The article’s supplementary files as


