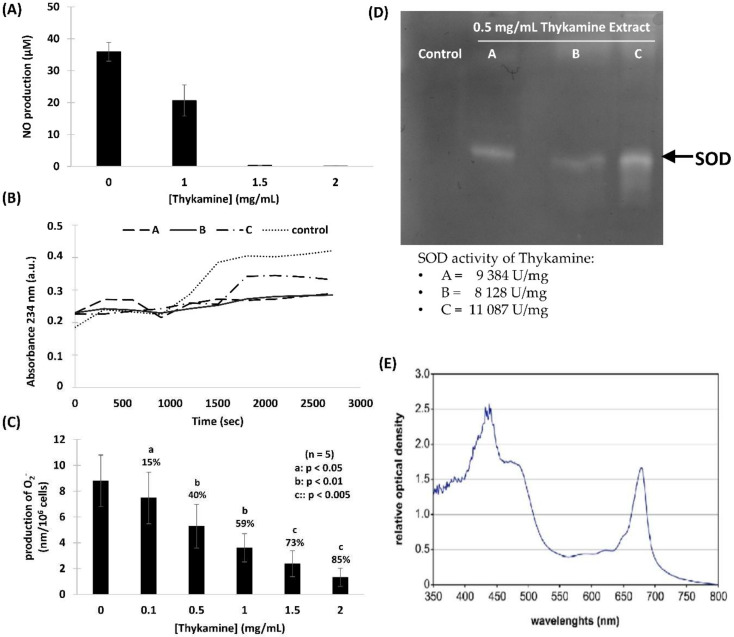
Figure 2.
In vivo effects of Thykamine on oxidative stress and protective antioxidant components of Thykamine. (A) Protection of Thykamine against NO generated by stimulated J774A.1 cells. J774A.1 cells were pretreated with Thykamine extracts. After removing of Thykamine, LPS 100 ng/mL was added to produce NO for a period of 24 h. NO production was measured in the supernatants using the Griess reagent method and kit (promega #G2930). Results are expressed as mean +/− SEM (n = 5). (B) Protection Thykamine against lipid peroxidation. Thykamine at 0.5 mg/mL were incubated for 45 min with linoleic acid 0.15 mM at 37 °C in microplates. The reaction was started with AAPH 0.7 mM. Each curve represents either control or different 0.5 mg/mL Thykamine extracts (A–C). Fresh controls were prepared to test each Thykamine extracts and were combined togheter to present as control on the figure. (C) Protection of Thykamine against the production of O2− by normal human blood neutrophils stimulated by fMLP. Neutrophils pretreated 30 min with graded concentrations of Thykamine (or HBSS as negative control) were incubated 5 min at 37 °C in the presence of 0.1 µM fMLP. Superoxide anions were evaluated by the reduction of cytochrome c. The optical density of the supernatants was read at 540 and 550 nm. Results are expressed in mean ± SEM of nM O2−/106 neutrophils (n = 5). Statistics were performed using Student’s unpaired t test (comparison between Thykamine-treated neutrophils versus control neutrophils in HBSS). Abbreviations are a is p < 0.05; b is p < 0.01 and c is p < 0.005. (D) SDS-PAGE gel electrophoresis of three 0.5 mg/mL Thykamine extracts (A–C) and zymography to show corresponding SOD activity. (E) Spectroscopic characterization of antioxidant pigments of Thykamine. Light spectroscopy was performed on active Thykamine that showed two major peaks. The first one recorded between 430 and 440 nm was chlorophylls with a shoulder between 460 and 490 nm corresponding to carotenoids. The second peak at 680 nm was chlorophylls (a more than b). This profile is representative of four different extract of Thykamine.

