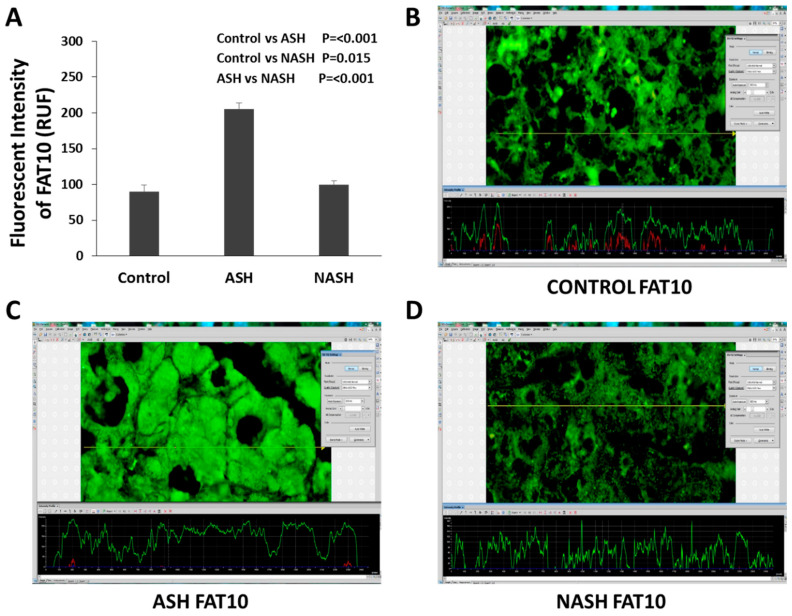
Figure 2.
Different changes of FAT10 in ASH and NASH specimens. (A) Level of expression of FAT10 protein up-regulated in ASH, compared with NASH or normal controls. Expression is measured as fluorescence intensity and displayed as mean +/− standard deviation. Representative images of fluorescence intensity to measure FAT10 expression in normal control (B), ASH (C), and NASH (D) liver specimens. A line is drawn through the image to yield a fluorescence intensity graph; the intensity of the ten highest peaks are measured. Three areas per slide are measured in this manner including Figure 2 and Figure 3. FAT10 is sequestered within MDBs in AH, suggesting that the excess expression of FAT10 in AH is leading to the stabilization of the protein due to loss of protein quality control. In fluorescent assays, fluorescence intensity is not an absolute measurement and is usually quantified in relative fluorescence units (RFU) [41].

