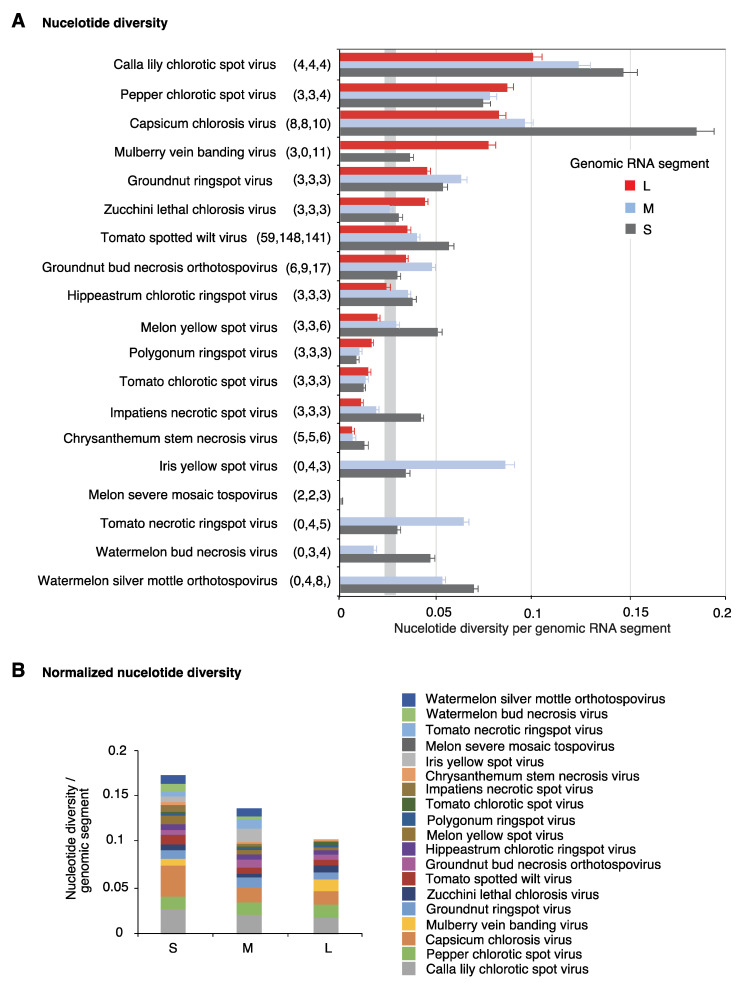
Figure 3.
Nucleotide diversity (Pi) in orthotospoviruses. (A) Pi was measured separately for each genomic RNA segment (L, M and S). Bars represent the proportion of variable positions with respect to the length of the genomic segment normalized to the number of accessions. For each species, the number of nucleotide accessions is indicated in parenthesis. A confidence interval (p-value < 0.01) is plotted as a vertical gray line. (B) Cumulative nucleotide diversity normalized to the length of the genomic RNA segment.

