

Abstract
Although melanoma is considered one of the most immunogenic malignancies, spontaneous T‐cell responses to melanoma antigens are ineffective due to tumor cell‐intrinsic or microenvironment‐driven immune evasion mechanisms. For example, oncogenic BRAF V600E mutation in melanoma cells fosters tumor immune escape by modulating cell immunogenicity and microenvironment composition. BRAF inhibition has been shown to increase melanoma cell immunogenicity, but these effects are transient and long‐term responses are uncommon. For these reasons, we aimed to further characterize the role of BRAF‐V600E mutation in the modulation of PD‐L1, a known immunoregulatory molecule, and galectin‐1 (Gal‐1), a potent immunoregulatory lectin involved in melanoma immune privilege. We report herein that vemurafenib downregulates IFN‐γ‐induced PD‐L1 expression by interfering with STAT1 activity and by decreasing PD‐L1 protein translation. Surprisingly, melanoma cells exposed to vemurafenib expressed higher levels of Gal‐1. In coculture experiments, A375 melanoma cells pretreated with vemurafenib induced apoptosis of interacting Jurkat T cells, whereas genetic inhibition of Gal‐1 in these cells restored the viability of cocultured T lymphocytes, indicating that Gal‐1 contributes to tumor immune escape. Importantly, Gal‐1 plasma concentration increased in patients progressing on BRAF/MEK inhibitor treatment, but remained stable in responding patients. Taken together, these results suggest a two‐faceted nature of BRAF inhibition‐associated immunomodulatory effects: an early immunostimulatory activity, mediated at least in part by decreased PD‐L1 expression, and a delayed immunosuppressive effect associated with Gal‐1 induction. Importantly, our observations suggest that Gal‐1 might be utilized as a potential biomarker and a putative therapeutic target in melanoma patients.
Keywords: BRAF mutations, Galectin‐1, immune escape, melanoma, PD‐L1
Melanoma is one of the most immunogenic malignancies, amenable for immunotherapeutic interventions. BRAF inhibition has been shown to increase melanoma cell immunogenicity, but these effects are transient and rapidly exhaustible. We demonstrate herein two facets of BRAF inhibition in melanoma cells: immunostimulatory activity due to decreased PD‐L1 transcription and translation, and immunosuppressive effect associated with Gal‐1 induction.
Abbreviations
- CTCEA
common terminology criteria for adverse events
- ELISA
Enzyme‐linked immunosorbent assay
- ERK
extracellular signal‐regulated kinase
- Gal‐1
galectin‐1
- IFN‐γ
interferon γ
- MAPKs
mitogen‐activated protein kinases
- PD‐L1
programmed death‐ligand 1
- PIM
proviral integration site for moloney murine leukemia virus kinase
- RECIST
response evaluation criteria in solid tumors
- STAT1
Signal transducer and activator of transcription 1
1. Introduction
Melanoma is a highly aggressive tumor of the skin, mucous membranes or uvea arising from pigment‐producing cells, melanocytes. Ultraviolet (UV) light exposure is a well‐established, major melanoma risk factor. Accordingly, melanoma cells exhibit a high prevalence of mutations caused by UV exposure, such as C>T mutations, pyrimidine dimers and other lesions repaired by transcription‐coupled nucleotide‐excision repair (Alexandrov et al., 2013). As nonsynonymous somatic mutations can create neoantigens—novel tumor‐specific protein epitopes that can be presented by MHC molecules and recognized by T cells as nonself, melanomas are considered highly immunogenic tumors. Nonetheless, spontaneous T‐cell responses to melanoma antigens are ineffective, due to melanoma‐intrinsic immune evasion mechanisms, such as the expression of PD‐L1/2 immune checkpoints (Keir et al., 2008; Pardoll, 2012). Clinically, immune checkpoint inhibitor (ICI)‐based therapies targeting PD‐1 and boosting neoantigen‐specific T‐cell responses have been shown to significantly alleviate melanoma’s immune escape mechanisms and improve patient survival (Curran et al., 2010; Dummer et al., 2015; Robert et al., 2015; Weber et al., 2015). In addition to PD‐1 checkpoint ligands, melanoma cells express galectin‐1, (LGALS‐1, Gal‐1), a potent immunomodulatory lectin that favors immune escape in multiple tumors (Cedeno‐Laurent et al., 2012; Juszczynski et al., 2007; Rubinstein et al., 2004; Tang et al., 2012). Gal‐1 inhibits T‐cell effector functions, blunts Th1 and Th17 responses, and skews the immune response toward a Th2‐type cytokine profile (Giordano et al., 2013; Juszczynski et al., 2007; Rabinovich and Toscano, 2009). In addition, this lectin instructs dendritic cells to become tolerogenic, induces alternatively activated ‘M2‐type’ macrophages, and favors the expansion of FoxP3 + regulatory T cells (Treg) and FoxP3‐, IL10 + type 1 regulatory (Tr1) cells (Cedeno‐Laurent et al., 2012; Ilarregui et al., 2009; Toscano et al., 2007), further limiting the magnitude of an effective immune response. Gal‐1 genetic inhibition with antisense oligonucleotides in a B16 murine melanoma model led to immune‐mediated rejection of the tumor (Rubinstein et al., 2004), suggesting that its expression in melanoma cells is an important mediator of tumor immune privilege.
The most common genetic abnormalities in melanoma are mutations of the MAPK (RAS‐BRAF/RAF‐MEK‐ERK) signal transduction pathway. BRAF mutations occur in 40–50% of melanoma patients, whereas NRAS mutations are identified in additional 15–20% (Chin, 2003; Chin et al., 2006; Eigentler et al, 2016; Flaherty et al., 2012; Gonzalez et al., 2013; Tsao et al., 2012). BRAF point mutations cluster in a specific region and usually result in a single phosphomimetic substitution in the kinase‐activation domain (V600E) that confers constitutive activation of BRAF and leads to uncontrolled, constitutive activity of downstream signaling pathways that stimulate cellular proliferation and increase tumor cell invasion, metastatic potential, and resistance to apoptosis (Chin, 2003; Pritchard and Hayward, 2013). In addition to tumor cell‐intrinsic consequences of oncogenic BRAF V600E mutation, it has been also implicated in fostering tumor’s immune escape, either by modulating cell immunogenicity or by modulating the microenvironment. For example, BRAF mutations impair antigen presentation in tumor cells (Bradley et al., 2015; Frederick et al., 2013), modulate expression of PD‐L1 immune checkpoint molecule (Zeng et al., 2016), and increase production of cytokines that reprogram tumor‐associated fibroblasts, macrophages, and dendritic cells to exhibit immunosuppressive properties (Khalili et al., 2012). In preclinical models and in retrospective analyses of patients undergoing BRAF inhibitor therapy, blockade of this pathway was linked to a more favorable microenvironment function, with an increased number of activated tumor‐infiltrating lymphocytes (Frederick et al., 2013). These findings appear particularly interesting in light of more recent studies, demonstrating that the number of tumor‐infiltrating lymphocytes (TILs) in the tumor tissue predicts better immunotherapy outcomes (Wong et al., 2019).
However, the increased infiltration of IFN‐γ‐producing activated T cells in the tumor tissue is associated with induction of PD‐L1 in the tumor cells. This effect, known as ‘adaptive immune resistance’, can limit the efficacy of immunotherapy (Ribas, 2015). Thus, understanding the mechanisms regulating PD‐L1 expression (and other potential immunoregulatory molecules) in melanoma patients is important to rationally manage the risk of clinical trial design and therapy failures. For these reasons, we aimed to characterize the role of BRAF‐V600E mutation in modulation of PD‐L1 and Gal‐1 expression and to further investigate potential immunoregulatory properties of BRAF inhibitors in melanoma. We report herein that vemurafenib downregulates IFN‐γ‐induced PD‐L1 expression in melanoma cells by interfering with the STAT1 activity and by decreasing PD‐L1 protein translation. Surprisingly, vemurafenib induced Gal‐1 expression in melanoma cells, leading to increased apoptosis of interacting T cells and potentially contributing to tumor immune privilege. Moreover, we have found that Gal‐1 plasma concentration increases in patients progressing on BRAF/MEK inhibitor treatment. Our results suggest that Gal‐1 might play an important role in tumor progression and could be a novel progression biomarker in melanoma patients.
2. Materials and methods
2.1. Cell lines and chemicals
Human melanoma cell lines A375, SK‐MEL5, and SK‐MEL28 were obtained from ATCC (Manassas, VA, USA) and maintained in DMEM (Lonza, Basel, Switzerland) supplemented with 10% (A375, SK‐MEL5) or 15% (SK‐MEL28) heat‐inactivated fetal bovine serum (Biovest, Riverside, MO, USA), 2 mm L‐glutamine, 10 mm HEPES, and 100 U·mL−1 of penicillin/streptomycin (Lonza). The Jurkat cell line was obtained from ATCC (Manassas, VA, USA) and maintained in RPMI 1640 medium (Lonza) supplemented with 10% heat‐inactivated fetal bovine serum (Biovest), 2 mm L‐glutamine, 10 mm HEPES, and 100 U·mL−1 of penicillin/streptomycin (Lonza). Cells were grown in a humidified atmosphere at 37 °C with 5% CO2. The 293T cell line was purchased from ATCC (Manassas, VA, USA) and maintained in DMEM supplemented with 10% FBS. Vemurafenib, cobimetinib, trametinib, and SGI‐1776 were purchased from Selleckchem (Houston, TX, USA) and dissolved in sterile dimethyl sulfoxide (DMSO). Interferon‐γ (IFN‐γ) was obtained from Thermo Fisher Scientific (Waltham, MA, USA).
2.2. Vectors and retroviral infection
The cDNA encoding PDL1‐Flag was generated in a two‐step PCR. At first, protein‐coding region without STOP codon of PD‐L1 was amplified using cDNA transcribed from A375 cell mRNA as a template and F1_PDL1_FLAG, R1_PDL1_FLAG primers (sequences provided in Table S1). Next, EcoRI and NgoMIV restriction sites, FLAG sequence (DYKDDDDK), and STOP codon were added in second PCR (primers: F2_PDL1_FLAG, R2_PDL1_FLAG). The gel‐purified PDL1‐FLAG fragment and pBabe‐puro were digested using EcoRI and NgoMIV (New England Biolabs, Ipswich, MA, USA) restriction enzymes and ligated to yield the pBabe‐PDL1_FLAG construct. The sequence was confirmed to be correct by Sanger sequencing. Previously described pSIREN‐RetroQ vector encoding Gal‐1‐specific shRNA (Gal1 shRNA) or scrambled control shRNA (Juszczynski et al., 2007) and pBabe‐MEK‐Q56P or pBabe‐MEK‐wt (Polak et al., 2016) were used.
The generation of retroviruses and infection was performed as described previously (Abramson et al., 2009; Gorniak and Juszczynski, 2018). Briefly, HEK‐293T cells were transfected with pKAT, VSV‐g, and a given retroviral plasmid using Lipofectamine 2000 reagent (Invitrogen, Carlsbad, CA, USA). Following 24‐h incubation at 37°C, the retroviral supernatant was collected, mixed with hexadimethrine bromide (8 μm final concentration; Sigma‐Aldrich, Saint Louis, MO, USA), and used to infect A375 cells when 60–80% confluency was reached. After infection, cells were subjected to antibiotic selection with 1 µg·mL−1 puromycin.
2.3. Luciferase assays
Previously described pGL3 luciferase vector (Promega, Madison, WI, USA) containing CD274 (PD‐L1) promoter sequence (Green et al., 2010) and pGL3 containing GAS sequence or ISRE sequence upstream of Firefly luciferase gene were used. For luciferase assay, the A375 cell line was grown to approximately 60–80% confluence on 6‐well plate and cotransfected with 1.0 μg/well of pGL3 luciferase construct and 0.5 μg/well pRL‐TK (Promega) using Lipofectamine 2000 reagent (Invitrogen). pRL‐TK vector encoding Renilla luciferase gene was used as a control reporter to allow for transfection efficiency normalization across different experimental conditions. After 24 h of incubation, cells were treated with 2.5μm vemurafenib, 0.1 μm trametinib, 0.1 μm cobimetinib, or the equivalent volume of dimethyl sulfoxide, and after next 2 h, IFN‐γ was added. After an additional 24 h of incubation, cells were lysed, and luciferase activities were determined by chemiluminescence assay with the use of the Dual‐Luciferase Assay Kit (Promega) and Tristar LB941 Berthold Luminometer as previously described (Sewastianik et al., 2016).
2.4. Immunoblotting and FACS
Cells were washed in PBS and lysed in RIPA buffer supplemented with protease and phosphatase inhibitor cocktail (Complete Protease Inhibitor Cocktail Tablets, PhosSTOP Phosphatase Inhibitor Cocktail Tablets, Roche, Basel, Switzerland) as described previously (Juszczynski et al., 2009). Proteins were size‐fractionated by sodium dodecyl sulfate (SDS)/PAGE and transferred to Immobilon PVDF membranes (Millipore, Burlington, MA, USA). Blots were incubated in blocking buffer (5% BSA, 0.1% Tween/Tris‐buffered saline TBS) at room temperature for 1 h and subsequently incubated with primary antibodies (listed in Table S2) diluted 1: 1000 in 5% BSA/TBST overnight at 4°C with rotation. After washing in TBST, blots were incubated with appropriate horseradish peroxidase (HRP)‐conjugated secondary antibodies at room temperature for 1 h, developed by ECL (PerkinElmer, Waltham, MA, USA), and visualized with G:Box image acquisition system (Syngene, Cambridge, UK). To reprobe with another antibody, blots were incubated in a stripping buffer at 50 °C for 30 min and analyzed as described above. Densitometric quantifications of band intensities were performed using imagej software (www.imagej.net).
The PD‐L1 and CD7 surface expressions were evaluated by flow cytometry as previously described (Green et al., 2010) with antibodies listed in Table S2. Cells were analyzed using FACSCanto flow cytometer (BD Biosciences, San Jose, CA, USA) and flowjo v.10 software (BD Bioscience).
2.5. Real‐time PCR
RNA was extracted using GeneMATRIX Universal RNA Purification Kit (EURx, Gdansk, Poland) and reverse‐transcribed with Transcriptor Universal cDNA Master (Roche). Gene expression levels were measured on CFX96 Real‐Time System (Bio‐Rad, Hercules, CA, USA) with the gene‐specific primers (sequences provided in Table S1) and SYBR Green PCR Master Mix (Life Technologies, Carlsbad, CA, USA). Obtained CT values for PD‐L1, Gal‐1, PD‐L1_FLAG target genes, and a housekeeping control (glyceraldehyde 3‐phosphate dehydrogenase [GAPDH]) were used to calculate relative transcript abundance using ΔΔCT method.
2.6. Metabolic protein labeling (Click‐iT) assay
To evaluate protein synthesis de novo, Click‐iT AHA (L‐azidohomoalanine) assays were used according to the manufacturer’s protocol. Briefly, A375 cells (60–80% confluent) were coincubated for 4 h with 50 µm Click‐iT AHA reagent and vemurafenib with/without IFN‐γ in a methionine‐free medium. Next, the cells were washed twice with PBS. For Alexa Fluor 488 staining of newly synthesized proteins, cells were fixed with 3.7% paraformaldehyde, blocked with 3% bovine serum albumin, and permeabilized with 0.5% Triton X‐100. In the next step, cells were labeled with Click‐iT reaction cocktail containing Alexa Fluor 488 alkyne and analyzed by flow cytometry. To assess the influence of vemurafenib on PD‐L1 protein synthesis, the cells were lysed with 1% sodium dodecyl sulfate and proteins labeled with AHA were conjugated with biotin alkyne. The lysates were precipitated twice, using chloroform and methanol protein precipitation method (Wessel and Flügge, 1984), to eliminate unbound biotin particles. Then, biotin‐labeled proteins were immunoprecipitated using Neutravidin Agarose Resin (Thermo Fisher Scientific) and separated by sodium dodecyl sulfate/polyacrylamide gel electrophoresis. PD‐L1 expression was subsequently assessed in biotinylated fraction by western blotting. GAPDH level in input samples served as a loading control.
2.7. Gal‐1‐induced T‐cell apoptosis assay
A375 control and A375_GAL1sh cells plated on 24‐well plate were treated with DMSO alone or vemurafenib (2.5 µm) for 24 h. Jurkat T cells were stimulated for 24 h using human T‐activator CD3/CD28 Dynabeads (Thermo Fisher Scientific), and 1 × 10⁵ of activated cells were mixed with pretreated A375 and A375_GAL1sh cells. After 24 h, apoptosis of Jurkat T cells was assessed in cocultures by flow cytometry. Cells were stained with APC‐CD7 antibody to discriminate T cells from A375 cells (T cells: CD7‐positive; A375 cells: CD7‐negative) and subsequently with Annexin V–fluorescein isothiocyanate (FITC) to evaluate apoptosis. Annexin V‐FITC staining was performed according to the manufacturer’s instructions (Annexin V‐FITC Apoptosis Detection Kit I, BD Biosciences). Apoptotic cells were evaluated in the CD7‐positive population using BD FACSCanto flow cytometer (BD Biosciences) and analyzed by flowjo v.10 software (BD Bioscience).
2.8. Patients, plasma samples, and ELISA
Before patient enrollment, the Bioethical Committee issued a positive decision about this pilot study, and the signed informed consent from all patients was obtained. Nine enrolled patients had been diagnosed with metastatic melanoma with BRAF mutation. All patients received a combination of BRAF + MEK inhibitors, no grade 3–5 toxicity acc. CTCEA were observed during treatment. The patients’ sera were collected before the first administration of BRAF + MEK inhibitors and every 1–6 months from initiation of treatment at the time of radiological and clinical assessment. Radiological assessment was done according to RECIST 1.1. Patients’ characteristics and therapy response status are presented in Table S3. Soluble Gal‐1 in patients’ plasma was quantified using a commercial ELISA kit (Human Galectin‐1 Quantikine ELISA Kit; R&D systems, Minneapolis, MN, USA), according to the manufacturer’s protocol. Serum was diluted ten times, and all samples were analyzed in duplicates.
2.9. Statistical analyses
Differences between variables were performed with Student’s t‐test or one‐way ANOVA, with the Tukey HSD test that corrects for family‐wise error‐rate in multiple comparisons. P values < 0.05 were considered statistically significant: **** for p < 0.0001; *** for p < 0.001; ** for p < 0.01; and * for p < 0.05. All calculations were performed using graphpad prism 6 software (San Diego, CA, USA).
3. Results
3.1. Vemurafenib downregulates interferon‐γ‐induced PD‐L1 expression in melanoma cells by interfering with the STAT1 activity
We first analyzed the baseline expression of PD‐L1 and the influence of vemurafenib on the expression of this molecule in three BRAF‐mutated human melanoma cell lines, A375, MEL5, and MEL28 using flow cytometry. In all three cell lines, the baseline level of PD‐L1 was low and was not markedly changed by vemurafenib (Fig. 1A). In immunogenic tumors, such as melanoma, the interferons released by tumor‐infiltrating T cells trigger the inducible expression of PD‐L1 by cancer cells, thereby inhibiting the antitumor immune response in a process known as ‘adaptive immune resistance’ (Ribas, 2015). Thus, we examined PD‐L1 surface expression in melanoma cell lines after IFN‐γ stimulation and its changes caused by vemurafenib. IFN‐γ massively induced PD‐L1 transcript levels and surface expression in a dose‐dependent manner in A375 and MEL28 cell lines, but not in MEL5 cells (Fig. 1B). Vemurafenib markedly decreased IFN‐γ‐induced PD‐L1 transcript and protein levels in these two cell lines (Fig. 1C,D). In addition, two MEK inhibitors, cobimetinib and trametinib, exhibited similar effects, indicating that BRAF‐MEK pathway blockade specifically dampens IFN‐γ signaling (Fig. S1). To further confirm these observations, we generated a reporter A375 cell line with luciferase gene downstream of the PD‐L1 promoter, the IFN‐γ‐responsive GAS (gamma‐activated site) or IFN‐α‐inducible ISRE (IFN‐α‐stimulated response element) synthetic promoters. IFN‐γ increased relative luciferase activity in cells transfected with PD‐L1 promoter‐ or GAS promoter‐containing constructs. In line with previous observations, vemurafenib significantly decreased IFN‐γ‐induced luciferase activity (Fig. 2A). Taken together, these results indicate that transcriptional PD‐L1 induction in melanoma cells is driven by IFN‐γ and can be specifically decreased in BRAF‐mutated cells by inhibition of this kinase.
Fig. 1.
Vemurafenib curtails IFN‐γ‐induced PD‐L1 expression in melanoma cells. (A) PD‐L1 expression in A375, MEL5, and MEL28 melanoma cells at baseline and after 24 h incubation with vemurafenib. PD‐L1 expression was assessed by flow cytometry. (B) IFN‐γ‐inducible expression of PD‐L1 in melanoma cell lines. Cells were stimulated with IFN‐γ for 24 h, and PD‐L1 expression was assessed as in panel A. (C) Vemurafenib decreases IFN‐γ‐inducible PD‐L1 surface expression in melanoma cells. Cells were pretreated with vemurafenib for 2h and then incubated with IFN‐γ for 24h. PD‐L1 expression was assessed as in panel A. (D) Vemurafenib decreases IFN‐γ‐inducible CD274 (PD‐L1) transcript levels in melanoma cells. Cells were pretreated with the inhibitor for 2h and then incubated with IFN‐γ for additional 24h. Thereafter, relative CD274 (PD‐L1) mRNA expression was assessed by real‐time PCR. GAPDH was used as a reference gene. The data from two independent experiments are presented. Differences in expression were assessed by the t‐test; asterisks indicate p values: ** for p < 0.01; * for p < 0.05. Error bars represent the standard deviations (SDs).
Fig. 2.
Vemurafenib reduces IFN‐γ‐induced, STAT1‐mediated CD274 (PD‐L1) gene transactivation. (A) Vemurafenib reduces transcription from IFN‐γ‐inducible promoters. A375 cells were transfected with CD274 (PD‐L1) promoter‐, GAS (gamma‐activated site) promoter‐, or ISRE (IFN‐α‐stimulated response element) promoter‐containing luciferase constructs. Luciferase activities were determined after 24 h incubation with IFN‐γ alone or in combination with vemurafenib, cobimetinib, or trametinib. The data from three independent experiments are presented. Differences in expression were assessed using one‐way ANOVA and Tukey HSD test; ** indicates p < 0.01; * for p < 0.05. Error bars represent the SD. (B) Vemurafenib reduces phospho‐ERK (T202/Y204) and STAT1‐activating phosphorylations. Pospho‐STAT1 (Y701 and S727) and phospho‐ERK levels were assessed after 24 h incubation with IFN‐γ alone and in combination with vemurafenib. GAPDH served as a loading control. Band intensities were quantitated by densitometry and are provided in Table S4a. (C) Vemurafenib does not modulate STAT1‐activating phosphorylations in cells with constitutive MEK activity. A375 cells were transduced with constitutively active MEK mutant (MEK_Q56P) or MEK wild‐type (MEK_wt) and treated with IFN‐γ alone or in combination with vemurafenib for 24h. Phospho‐ERK (T202/Y204) and phospho‐STAT1 (Y701 and S727) levels were assessed by immunoblotting. GAPDH served as a loading control. Band intensities were quantitated by densitometry and are provided in Table S4b. (D) Vemurafenib does not change PD‐L1 transcript levels in cells with constitutive MEK (MEK_Q56P) activity. MEK_Q56P and MEK_wt‐transduced cells were pretreated with the inhibitor for 2 h and then incubated with IFN‐γ for 24 h. Thereafter, relative PD‐L1 mRNA levels were assessed by real‐time PCR. GAPDH was used as a reference gene. The data from two independent experiments are presented. Differences in expression were assessed by t‐test; asterisks indicate P values: ** for p < 0.01; * for p < 0.05. Error bars represent the SD.
Since immediate IFN‐γ downstream signaling effectors are STAT1 homodimers, we determined the changes in the phosphorylation status of STAT1 Y701 and S727, the two residues phosphorylated upon IFN‐γ receptor engagement. Tyrosine 701 is phosphorylated by JAK1/2 and is required for STAT1 dimerization, whereas S727 can be phosphorylated by several different kinases, including ERK1, and is critical to convey full transactivation potential to this transcription factor (Li et al., 2010). As ERK1 operates downstream of BRAF and MEK, we first confirmed that ERK1 activity decreases following incubation with vemurafenib (Fig. 2B, Fig. S2). Next, we assessed STAT1 phosphorylation at Y701 and S727 after incubation with IFN‐γ alone or in combination with vemurafenib in A375 and MEL28 cells. IFN‐γ led to increased STAT1 phosphorylation at Y701 and S727 in analyzed cell lines. As predicted, vemurafenib markedly decreased STAT S727 phosphorylation, and modestly decreased Y701 phospho‐levels (Fig. 2B). These results suggest that the constitutive activity of BRAF V600E fosters IFN‐γ signaling and PD‐L1 transcriptional activation by augmenting STAT1 S727 phosphorylation.
To confirm the role of the BRAF/MEK/ERK pathway in the modulation of the IFN‐γ pathway, we overexpressed the constitutively active form of MEK1 kinase (MEK‐Q56P) in A375 cells. MEK‐Q56P mutation, identified in melanoma patients, is located in the proximity of regulatory helix A and leads to constitutive kinase activity (Emery et al., 2009). As MEK is situated downstream of BRAF, we expected that MEK‐Q56P would substitute the signal terminated by vemurafenib. Indeed, comparing with MEK wild‐type, cells transduced with this MEK1 mutant did not exhibit changes in p‐ERK, p‐STAT(S727), and p‐STAT(Y701) after vemurafenib treatment (Fig. 2C). Consistent with these observations, vemurafenib did not decrease IFN‐γ‐induced PD‐L1 transcript abundance in MEK‐Q56P‐transduced cells (Fig. 2D).
3.2. Vemurafenib inhibits PD‐L1 protein synthesis
Thereafter, we sought for additional vemurafenib‐modulated mechanisms that might be responsible for PD‐L1 protein expression. To this end, we studied vemurafenib’s effect on protein translation by assessing activity of proteins involved in translation regulation: translation repressor protein 4E‐BP1 (Pause et al., 1994), S6 ribosomal protein (Peterson and Schreiber, 1998), and ribosomal S6 kinases (p90RSK) that are activated via coordinated phosphorylation by MAPKs (Gwin et al., 2011; Romeo et al., 2013). Exposure to increasing vemurafenib concentrations led to a dramatic decrease in phosphorylation of all analyzed proteins (Fig. 3A). Similar effect of vemurafenib was observed in the presence of IFN‐γ (Fig. 3B). To show the direct impact of vemurafenib on protein translation, we utilized azide‐alkyne cycloaddition (‘Click‐iT’) chemistry to label newly synthesized proteins. This analysis revealed that vemurafenib markedly dampened global protein synthesis (Fig. 3C). To specifically assess the vemurafenib’s effect on PD‐L1 translation, we biotinylated newly synthesized proteins using Click‐iT reaction, pulled down biotin‐labeled proteins using avidin‐coated beads and immunoblotted obtained protein concentrate with an anti‐PD‐L1 antibody. This experiment indicated that vemurafenib decreased PD‐L1 translation (Fig. 3D).
Fig. 3.
Vemurafenib inhibits protein translation. (A) Changes in phosphorylation of proteins regulating protein translation after 24 h incubation with vemurafenib in A375 and MEL28 melanoma cell lines, analyzed by western blot. GAPDH served as a loading control. Band intensities were quantitated by densitometry and are provided in Table S4c. (B) Changes in phosphorylation of proteins regulating protein translation after 24 h incubation with IFN‐γ alone and in combination with vemurafenib. A375 and MEL28 melanoma cells were pretreated with the inhibitor for 2 h and then incubated with IFN‐γ for 24h. GAPDH served as a loading control. Band intensities were quantitated by densitometry and are provided in Table S4d. (C) Global de novo protein synthesis after 24 h incubation with IFN‐γ alone and in combination with vemurafenib. A375 and MEL28 cells were pretreated with inhibitor for 2 h and then incubated with IFN‐γ for 24 h. Newly synthesized proteins were labeled with methionine analogue L‐azidohomoalanine, conjugated with Alexa Fluor 488‐alkyne, and analyzed by flow cytometry. (D) D e novo PD‐L1 protein synthesis in melanoma cells stimulated with IFN‐γ alone or pretreated with vemurafenib. Proteins labeled with L‐azidohomoalanine were conjugated with biotin–alkyne, precipitated using avidin‐conjugated beads, and immunoblotted with α‐PD‐L1 antibody. (E) Vemurafenib decreases abundance of FLAG‐PD‐L1 protein expressed from IFN‐unresponsive (LTR) promoter. A375 cells were transfected with pBabe‐PD‐L1_Flag vector and treated with vemurafenib for 24 h, and FLAG‐tagged PD‐L1 protein abundance was assessed by western blot and quantified using band densitometry; GAPDH served as a loading control. (F) Relative PD‐L1_FLAG transcript levels in A375 cells were transduced with pBabe‐PD‐L1_Flag and treated with vemurafenib as in panel E. Transcript abundance was measured by real‐time PCR. GAPDH was used as a reference gene. The data from two independent experiments are presented. Error bars represent the SD.
To rule out the possibility that decreased translation of PD‐L1 results from the decreased expression of its transcript, we transduced A375 cells with a retroviral vector construct containing the FLAG‐tagged PD‐L1 gene, in which transcription is independent of the physiological regulatory region and driven only by the LTR promoter. Western blot analysis performed on this model showed that vemurafenib treatment caused massive decrease (81–87%) in PD‐L1_FLAG protein abundance (Fig. 3E), whereas PD‐L1_FLAG transcript levels decreased only by 30%‐35% (Fig. 3F). Taken together, these results confirm that vemurafenib decreases PD‐L1 translation.
3.3. Vemurafenib increases expression of immunoregulatory protein galectin‐1
Having demonstrated the downregulation of surface PD‐L1 expression by BRAF inhibition, we hypothesized that vemurafenib should trigger increased activation of T cells interacting with vemurafenib‐pretreated melanoma cells. Surprisingly, the expression of T‐cell activation markers (CD25 and CD69) on Jurkat T cells cocultured with IFN‐γ or IFN‐γ + vemurafenib‐pretreated melanoma cells remained unchanged (Fig. S3), indicating that either the magnitude of PD‐L1 downregulation is insufficient to alleviate T‐cell exhaustion or the decreased expression of PDL1 on melanoma cells treated with vemurafenib is compensated by an increased level of a different checkpoint/immunoregulatory molecule. Unlike other checkpoints that induce T‐cell exhaustion and cooperate with PD‐L1, Gal‐1 exhibits different mechanisms of activity, inducing cell death specifically in activated T cells (Juszczynski et al., 2007; Long et al., 2018; Rubinstein et al., 2004; Sakuishi et al., 2010). To determine the influence of vemurafenib on Gal‐1 expression, A375 and MEL28 cells were incubated with vemurafenib alone or in combination with IFN‐γ and Gal‐1 transcript and protein abundance were assessed. Consistent with the hypothesis, vemurafenib treatment markedly increased Gal‐1 expression in A375 and MEL28 melanoma cells (Fig. S4, Fig. 4A,B).
Fig. 4.
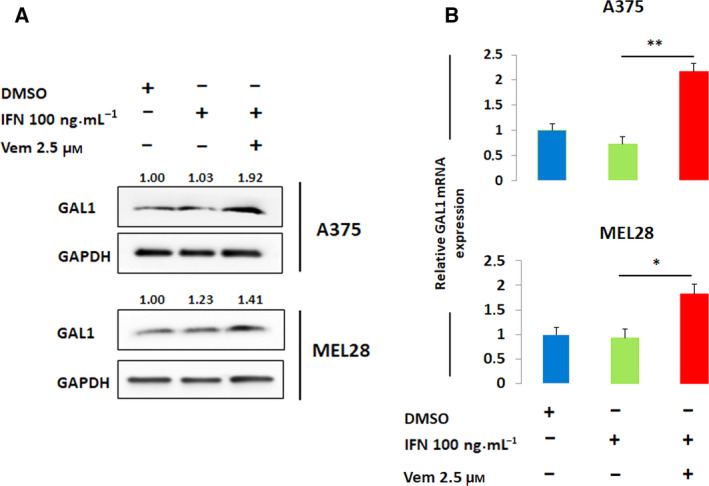
Vemurafenib increases expression of an immunoregulatory protein, galectin‐1. (A) Gal‐1 protein expression after 24 h incubation with IFN‐γ alone and in combination with vemurafenib. A375 and MEL28 cells were pretreated with inhibitor for 2 h and then incubated with IFN‐γ for 24 h. Gal‐1 abundance was assessed by western blot and quantified using band densitometry. GAPDH served as a loading control. (B) Relative Gal‐1 transcript level in A375 and MEL28 after 24 h incubation with IFN‐γ alone and in combination with vemurafenib. mRNA levels were determined using real‐time PCR. GAPDH was used as a reference gene. The data from two independent experiments are presented. Differences in expression were assessed by t‐test; asterisks indicate P values: ** for p < 0.01; * for p < 0.05. Error bars represent the SD.
3.4. Vemurafenib‐induced galectin‐1 in melanoma cells increases apoptosis in interacting T cells
Given the upregulation of Gal‐1 following BRAF inhibition in melanoma cell lines, we hypothesized that increased expression/secretion of Gal‐1 would facilitate the deletion of tumor‐interacting T cells. To test this hypothesis, we first generated stable A375 transfectants expressing Gal‐1‐specific short hairpin RNA (Gal‐1_sh) or a scrambled control shRNA (Fig. 5A). Thereafter, Gal‐1_shRNA or control A375 monolayers were pretreated with vemurafenib (2.5 μm) or DMSO for 24h to induce Gal‐1 expression. Importantly, A375 cells remained viable under these conditions and thus could be further utilized in subsequent experiments. After DMSO/vemurafenib preincubation, A375 cells were overlaid with CD3/CD28‐activated Jurkat T cells and cocultured for additional 24h. Consistent with the proapoptotic function of Gal‐1, the percentage of apoptotic T cells coincubated with control (Gal‐1‐expressing) DMSO‐treated A375 cells was higher than after coincubation with Gal‐1‐depleted cells (13% vs 5%, respectively; Fig. 5B left upper and lower panels and Fig. 5C). The percentage of apoptotic T cells markedly increased (from 13% to 24%) after coculture with vemurafenib‐pretreated, Gal‐1‐sufficient, control A375 cells, whereas apoptosis of T cells cocultured with vemurafenib‐pretreated, Gal‐1‐depleted A375 cells remained low (6,5% of Annexin V‐positive cells; Fig. 5B right upper and lower panels and Fig. 5C). These studies directly demonstrate that the endogenous and vemurafenib‐induced Gal‐1 decreases the viability of activated T cells. More importantly, blocking melanoma‐specific expression of Gal‐1 restores viability of these T cells.
Fig. 5.
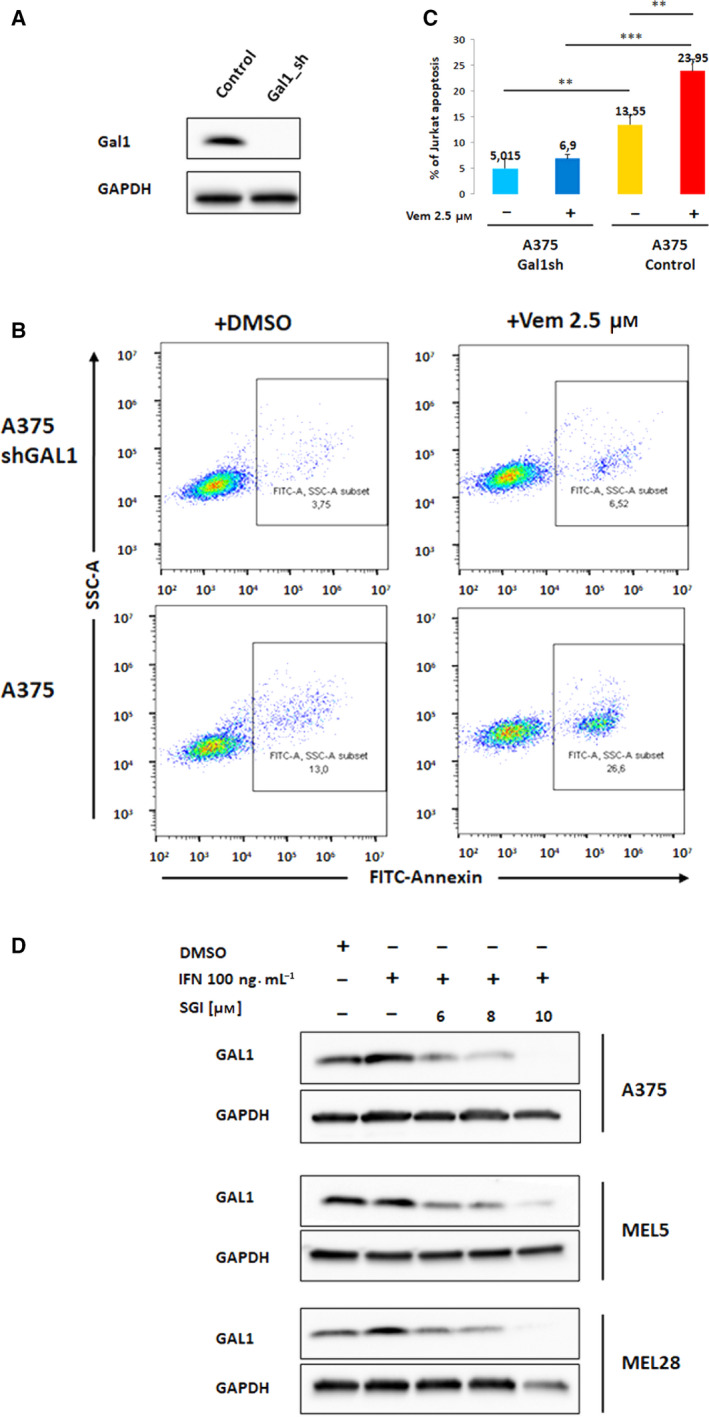
Vemurafenib‐induced Gal‐1 in melanoma cells increases apoptosis of interacting T cells. (A) Decreased Gal‐1 protein expression in A375 cells transduced with Gal‐1‐specific short hairpin RNA (Gal1_sh) or a scrambled control shRNA. (B and C) Viability of Jurkat T cells cocultured with Gal1 shRNA or a scrambled control shRNA A375 cells in the presence or absence of vemurafenib (24 h incubation), analyzed by Annexin V staining. Graphs in panel C represent averaged data from 2 independent experiments. Differences in apoptosis between the samples were assessed by the t‐test; asterisks indicate p values: *** for p < 0.001; ** for p < 0.01. Error bars represent the SD. (D) PIM kinase inhibition decreases Gal‐1 protein expression. A375, MEL5, and MEL28 cells were treated with SGI‐1776 pan‐PIM inhibitor for 2 h and with IFN‐γ for additional 24 h. Gal‐1 abundance was assessed by western blot. GAPDH served as a loading control.
We have recently demonstrated that PIM kinase inhibition decreases Gal‐1 expression in classical Hodgkin lymphoma (Szydłowski et al., 2017). Since PIM kinases are expressed by human melanoma tissue (Shannan et al., 2016), we investigated whether a pan‐PIM kinase inhibitor, SGI‐1776, decreases Gal‐1 protein expression in melanoma cell lines. Incubation of melanoma cells with SGI‐1776 markedly and in a dose‐dependent manner reduced Gal‐1 protein abundance (Fig. 5D), indicating that PIM inhibition is a potential immunomodulatory strategy in this disease.
3.5. Galectin‐1 plasma concentration increases in patients progressing on BRAF/MEK inhibitor treatment
Given the upregulation of Gal‐1 following BRAF inhibition in melanoma cell lines and T‐cell apoptosis‐inducing activity of this protein, we hypothesized that increased expression/secretion of Gal‐1 in BRAF inhibitor‐treated patients would facilitate deletion of tumor‐infiltrating T cells and might represent a mechanism of disease immune escape and progression. To test this hypothesis, we longitudinally evaluated Gal‐1 plasma concentrations at subsequent time points during the course of BRAF/MEK inhibitor therapy (first measurement before drug administration) in 9 metastatic melanoma patients (Table S3). Since Gal‐1 is a soluble protein, its concentrations were determined using ELISA. Gal‐1 markedly increased (>2‐fold change) only in a patient progressing on treatment (patient #934668). In the remaining patients achieving at least SD, Gal‐1 plasma concentrations remained stable over the course of follow‐up (Fig. 6). These results suggest that Gal‐1 might play an important role in tumor progression and could be a novel progression biomarker in melanoma patients.
Fig. 6.
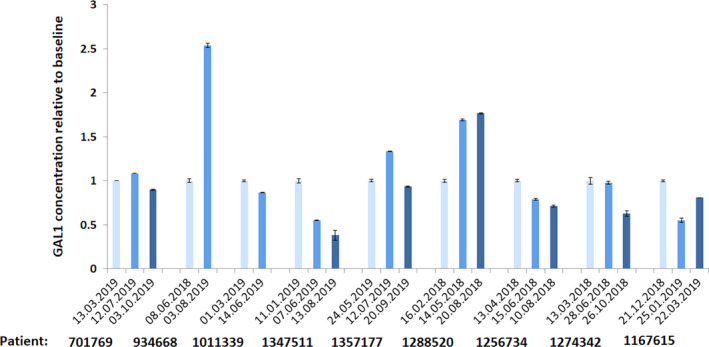
Gal‐1 plasma concentration in patients treated with BRAF + MEK inhibitors, determined using ELISA kit. Patient’s radiological responses are detailed in Table S3. Marked increase in Gal‐1 plasma levels was noted only in a progressing patient (#934668), who eventually deceased. In a patient #1288520, in the first measurement, Gal‐1 plasma concentration moderately increased, but stabilized thereafter. In the corresponding clinical assessment, patient had stable disease. In remaining responding patients, Gal‐1 plasma levels remained stable. The data from two technical replicates are presented. Error bars represent the SD.
4. Discussion
Due to high mutational load and neoantigen formation, melanoma is considered one of the most immunogenic malignancies (Erdag et al., 2012; Oble et al., 2009). However, most tumors develop a strong arsenal of immunomodulatory mechanisms that dampen the host immune response. BRAF mutations have been shown to contribute to this effect due to distinct tumor‐intrinsic and microenvironment‐specific mechanisms. Consistent with this, BRAF inhibitor treatment increases antigen presentation and favors cytotoxic T‐cell infiltration. However, in patients treated with BRAF inhibitors, increasing T‐cell infiltration is paralleled by the rising expression of PD‐L1. Mechanistically, this effect is mediated by JAK/STAT signaling pathway triggered by IFN‐γ produced by activated T cells. This mechanism, known as ‘adaptive immune resistance’, might mitigate the long‐term benefits of targeted therapy with BRAF inhibitors (Flaherty et al., 2012; Chin et al., 2006).
In this study, we demonstrate that in melanoma cells, BRAF inhibition curtails IFN‐γ‐induced PD‐L1 expression through two complementary mechanisms: decreased STAT1 activity and attenuation of protein translation. These results are consistent with other studies, indicating that MAPK inhibition in melanoma cells decreases PD‐L1 expression via modulation of c‐JUN/AP1 activity (Jiang et al., 2013). In addition, IFN‐γ‐dependent PD‐L1 expression can be modulated by NF‐κB; thus, inhibition of IKK downstream of BRAF prevents degradation of IκB subunits, retains NF‐κB in the cytoplasm, and blocks PD‐L1 expression (Gowrishankar et al., 2015; Hartman et al., 2017). Together, these mechanisms limit the magnitude of PD‐L1 induction caused by IFN‐γ produced by T cells infiltrating the tumor. In our observations, the surface PD‐L1 abundance induced by IFN‐γ was by an order of magnitude lower when the cells were incubated in the presence of vemurafenib. From the immunotherapy standpoint, curtailed PD‐L1 expression appears to be a beneficial effect and speaks for simultaneous, rather than sequential, use of targeted pathway inhibitors and anti‐PD‐1 antibodies.
Nonetheless, in patients treated with BRAF inhibitors alone, the duration of clinical responses to therapy is relatively short due to evolving resistance. Upon progression, BRAF inhibitor‐related, positive immunoregulatory effects are cleared, suggesting that BRAF inhibitor resistance is associated with an immunosuppressed tumor microenvironment, potentially contributing to a lack of response to subsequent anti‐PD‐1 therapy (Frederick et al., 2013). For example, some recent studies indicate that in progressing melanoma patients, prior BRAF inhibitor therapy reduced the efficacy of subsequent ICI therapy with nivolumab, suggesting that extended BRAF inhibitor treatment either impairs immune‐competent cells in the microenvironment or selects tumor cells capable of escaping the attack (Johnson et al., 2017; Simeone et al., 2017). In addition, increased tumor T‐cell infiltration in BRAF inhibitor‐treated patients disappears in biopsies collected after 15 days from treatment initiation, suggesting that tumor cells develop a ‘counter‐strike’ strategy to delete T cells (Deken et al., 2016). Taken together, the immunoregulatory effects of BRAF inhibitor appear to be transient, exhaustible, or compensated by other mechanisms. Consistent with these clinical observations, we noted that BRAF inhibitor‐exposed cells increase the expression of Gal‐1, a potent immunoregulatory lectin capable of reprogramming the microenvironment and deleting activated T cells. Increased expression of this lectin was also observed in the plasma of BRAF/MEK inhibitor‐treated, progressing melanoma patients. Vemurafenib‐induced Gal‐1 in melanoma cells was sufficient to initiate apoptotic cell death in interacting Jurkat T cells. Importantly, genetic inhibition of Gal‐1 by RNA interference almost completely blocked apoptosis of T cells in cocultures with vemurafenib‐pretreated tumor cells, confirming that this effect is specifically mediated by Gal‐1. Given broad and pleiotropic Gal‐1 functions, the expression of this protein might be a likely explanation to several additional effects observed in the tumor microenvironment following BRAF inhibition. In a BRAF V600E mutant syngeneic SM1 melanoma model, BRAF inhibition was associated with increased regulatory T cells (Treg), macrophage, and myeloid‐derived suppressor cell (MDSC) infiltrates (Hu‐Lieskovan et al., 2015). Since Gal‐1 favors the expansion of these cell populations (Juszczynski et al., 2007; Rubinstein et al., 2004), increased infiltrates of these cells in BRAF inhibitor‐treated melanomas might be driven, at least partially, by Gal‐1 overexpression.
However, the molecular mechanism leading to Gal‐1 induction in vemurafenib‐responding melanoma patients remains unclear. Given increased plasma Gal‐1 concentration in a progressing patient, it is more likely to be an indirect/compensatory effect, rather than a direct consequence of BRAF‐MEK‐ERK pathway inhibition. Importantly, Gal‐1 is regulated by multiple pathways (e.g., NFκB and AP‐1 transcription factors, hypoxia, redox balance), which are deregulated in progressing treatment‐refractory patients (Juszczynski et al., 2007; Toscano et al., 2011; Xu‐Yun et al., 2010). Moreover, apoptosing tumor cells in patients responding to BRAF inhibitor will not be able to produce Gal‐1, whereas in progressing patients, increasing tumor volume/mass will likely produce more lectin. Regardless of the underlying molecular mechanism, induction of Gal‐1 in BRAF inhibitor‐treated, progressing melanoma patients is an important observation from the translational standpoint. First, Gal‐1 expression has been shown to be a valuable diagnostic and prognostic biomarker in multiple malignancies (Kamper et al., 2011; Juszczynski et al., 2010; Ouyang et al., 2013; Rodig et al., 2008). Given the simplicity of Gal‐1 plasma concentration measurements, this approach can be implemented in diagnostic laboratories as a biomarker identifying progressing patients. Prospective studies that will address this hypothesis are currently ongoing. Second, as Gal‐1 is a potentially targetable protein (Ouyang et al., 2011; Rubinstein et al., 2004), its inhibition might alleviate the detrimental effects in the tumor microenvironment and impede tumor immune escape. However, since direct Gal‐1 inhibitors are not available for clinical use, other indirect approaches might be an attractive alternative. We have recently shown that PIM kinase inhibitors decrease the Hodgkin lymphoma‐specific expression of Gal‐1 (Szydłowski et al., 2017). Herein, we recapitulate this result in melanoma cells, demonstrating that a pan‐PIM inhibitor SGI‐1776 decreases Gal‐1 abundance. Given the ongoing clinical development of pan‐PIM inhibitors, this observation is particularly interesting. It is tempting to hypothesize that PIM inhibitors might prevent the adverse microenvironmental effects of BRAF inhibitors and favor the host’s immune tumor control.
5. Conclusions
Taken together, studies presented herein suggest two‐faceted nature of BRAF inhibition‐associated immunomodulatory effects: early immunostimulatory activity, mediated at least in part by decreased PD‐L1 expression, and a delayed immunosuppressive effect associated with Gal‐1 induction. Importantly, our observations suggest that Gal‐1 might be utilized as a potential biomarker and a putative therapeutic target, using either direct Gal‐1 inhibitors or small molecule PIM kinase inhibitors. Further studies directly testing these hypotheses are being developed.
Conflict of interest
PR has received advisory board membership and lecture honoraria from Roche, BMS, and Pierre Fabre. PJ and IL have received research funding from Roche.
Author contributions
PG designed the research, performed the research, analyzed the data, and wrote the manuscript. MW‐J designed the research, acquired funding, performed the research, analyzed the data, and wrote the manuscript. IL collected clinical information and analyzed the data. PR collected clinical information and analyzed the data. AP provided critical reagents. MS analyzed the data. PJ designed the research, analyzed the data, and wrote the manuscript.
Supporting information
Methods S1. Phospho‐specific flow cytometry; Jurkat T cell activation assay.
Table S1. Primers used in gene expression analysis and plasmid generation.
Table S2. Antibodies used in WB and Flow cytometry.
Table S3. Melanoma patients enrolled in the study and their follow up. Corresponding Gal‐1 concentrations are indicated in Figure 6.
Table S4. (a‐d) Densitometric quantification of band intensities.
Fig. S1. PD‐L1 expression after 24 h incubation with cobimetinib or trametinib alone and in combination with IFN‐γ.
Fig. S2. ERK phosphorylation after 24 h incubation with vemurafenib in A375, MEL5 and MEL28 melanoma cell lines, analyzed by flow cytometry.
Fig. S3. Expression of CD25 and CD69 activation markers in Jurkat T cells after 24h coculture with A375 cells, pretreated with IFN‐γ alone or IFN‐γ in combination with vemurafenib for 24h.
Fig. S4. Relative Gal‐1 mRNA (A) and protein (B) expression in A375 and MEL28 melanoma cell lines after 24h incubation with vemurafenib.
Acknowledgements
The study was supported by the Polish National Science Center Grant ‘UMO‐2014/15/N/NZ5/03662’.
References
- Abramson JS, Chen W, Juszczynski P, Takahashi H, Neuberg D, Kutok JL et al ( 2009) The heat shock protein 90 inhibitor IPI‐504 induces apoptosis of AKT‐dependent diffuse large B‐cell lymphomas. Br J Haematol 144, 358–366. [DOI] [PMC free article] [PubMed] [Google Scholar]
- Alexandrov LB, Nik‐Zainal S, Wedge DC, Aparicio SAJR, Behjati S, Biankin AV et al ( 2013) Signatures of mutational processes in human cancer. Nature 500, 415–421. [DOI] [PMC free article] [PubMed] [Google Scholar]
- Bradley SD, Chen Z, Melendez B, Talukder A, Khalili JS, Rodriguez‐Cruz T et al ( 2015) BRAFV600E co‐opts a conserved MHC class I internalization pathway to diminish antigen presentation and CD8+ T‐cell recognition of melanoma. Cancer Immunol Res 3, 602–609. [DOI] [PMC free article] [PubMed] [Google Scholar]
- Cedeno‐Laurent F, Watanabe R, Teague JE, Kupper TS, Clark RA and Dimitroff CJ ( 2012) Galectin‐1 inhibits the viability, proliferation, and Th1 cytokine production of nonmalignant T cells in patients with leukemic cutaneous T‐cell lymphoma. Blood 119, 3534–3538. [DOI] [PMC free article] [PubMed] [Google Scholar]
- Chin L ( 2003) The genetics of malignant melanoma: Lessons from mouse and man. Nat Rev Cancer 3, 559–570. [DOI] [PubMed] [Google Scholar]
- Chin L, Garraway LA and Fisher DE ( 2006) Malignant melanoma: genetics and therapeutics in the genomic era. Genes Dev 20, 2149–2182. [DOI] [PubMed] [Google Scholar]
- Curran MA, Montalvo W, Yagita H and Allison JP ( 2010) PD‐1 and CTLA‐4 combination blockade expands infiltrating T cells and reduces regulatory T and myeloid cells within B16 melanoma tumors. Proc Natl Acad Sci U S A 107, 4275–4280. [DOI] [PMC free article] [PubMed] [Google Scholar]
- Deken MA, Gadiot J, Jordanova ES, Lacroix R, van Gool M, Kroon P et al ( 2016) Targeting the MAPK and PI3K pathways in combination with PD1 blockade in melanoma. Oncoimmunology 5, e1238557. [DOI] [PMC free article] [PubMed] [Google Scholar]
- Dummer R, Daud A, Puzanov I, Hamid O, Schadendorf D, Robert C et al ( 2015) A randomized controlled comparison of pembrolizumab and chemotherapy in patients with ipilimumab‐refractory melanoma. J Transl Med 384, 1109–1117. [Google Scholar]
- Eigentler T, Assi Z, Hassel JC, Heinzerling L, Starz H, Berneburg M et al ( 2016) Which melanoma patient carries a BRAF – mutation? A comparison of predictive models. Oncotarget 7, 36130–36137. [DOI] [PMC free article] [PubMed] [Google Scholar]
- Emery CM, Vijayendran KG, Zipser MC, Sawyer AM, Niu L, Kim JJ et al ( 2009) MEK1 mutations confer resistance to MEK and B‐RAF inhibition. Proc Natl Acad Sci USA 106, 20411–20416. [DOI] [PMC free article] [PubMed] [Google Scholar]
- Erdag G, Schaefer JT, Smolkin ME, Deacon DH, Shea SM, Dengel LT et al ( 2012) Immunotype and immunohistologic characteristics of tumor‐infiltrating immune cells are associated with clinical outcome in metastatic melanoma. Cancer Res 72, 1070–1080. [DOI] [PMC free article] [PubMed] [Google Scholar]
- Flaherty KT, Hodi FS and Fisher DE ( 2012) From genes to drugs: targeted strategies for melanoma. Nat Rev Cancer 12, 349–361. [DOI] [PubMed] [Google Scholar]
- Frederick DT, Piris A, Cogdill AP, Cooper ZA, Lezcano C, Ferrone CR et al ( 2013) BRAF inhibition is associated with enhanced melanoma antigen expression and a more favorable tumor microenvironment in patients with metastatic melanoma. Clin Cancer Res 19, 1225–1231. [DOI] [PMC free article] [PubMed] [Google Scholar]
- Giordano M, Croci DO and Rabinovich GA ( 2013) Galectins in hematological malignancies. Curr Opin Hematol. 20, 327–335. [DOI] [PubMed] [Google Scholar]
- Gonzalez D, Fearfield L, Nathan P, Taniere P, Wallace A, Brown E et al ( 2013) BRAF mutation testing algorithm for Vemurafenib treatment in melanoma: recommendation from an expert panel. Br J Dermatol 168, 700–707. [DOI] [PubMed] [Google Scholar]
- Gorniak P and Juszczynski P ( 2018) An immunogenetic cell separation system based on retroviral vector containing a chimeric, recombinant human‐murine CD4 gene. Centr Eur J Immunol 43, 353–357. [Google Scholar]
- Gowrishankar K, Gunatilake D, Gallagher SJ, Tiffen J, Rizos H, Hersey P et al ( 2015) Inducible but not constitutive expression of PD‐L1 in human melanoma cells is dependent on activation of NF‐κB. PLoS ONE 10, e0123410. [DOI] [PMC free article] [PubMed] [Google Scholar]
- Green MR, Monti S, Rodig SJ, Juszczynski P, Currie T, O’Donnell E et al ( 2010) Integrative analysis reveals selective 9p24.1 amplification, increased PD‐1 ligand expression, and further induction via JAK2 in nodular sclerosing Hodgkin lymphoma and primary mediastinal large B‐cell lymphoma. Blood 116, 3268–3277. [DOI] [PMC free article] [PubMed] [Google Scholar]
- Gwin J, Drews N, Ali S, Stamschror J, Sorenson M and Rajah TT ( 2011) Effect of genistein on p90RSK phosphorylation and cell proliferation in T47D breast cancer cells. Anticancer Res 31, 209–214. [PubMed] [Google Scholar]
- Hartman ML, Rozanski M, Osrodek M, Zalesna I and Czyz M ( 2017) Vemurafenib and trametinib reduce expression of CTGF and IL‐8 in V600EBRAF melanoma cells. Lab Investig 97, 217–227. [DOI] [PubMed] [Google Scholar]
- Hu‐Lieskovan S, Mok S, Homet Moreno B, Tsoi J, Robert L, Goedert L et al ( 2015) Improved antitumor activity of immunotherapy with BRAF and MEK inhibitors in BRAFV600E melanoma. Sci Transl Med 7, 279ra41. [DOI] [PMC free article] [PubMed] [Google Scholar]
- Ilarregui JM, Croci DO, Bianco GA, Toscano MA, Salatino M, Vermeulen ME et al ( 2009) Tolerogenic signals delivered by dendritic cells to T cells through a galectin‐1‐driven immunoregulatory circuit involving interleukin 27 and interleukin 10. Nat Immunol 10, 981–991. [DOI] [PubMed] [Google Scholar]
- Jiang X, Zhou J, Giobbie‐Hurder A, Wargo J and Hodi FS ( 2013) The activation of MAPK in melanoma cells resistant to BRAF inhibition promotes PD‐L1 expression that is reversible by MEK and PI3K inhibition. Clin Cancer Res 19, 598–609. [DOI] [PubMed] [Google Scholar]
- Johnson DB, Pectasides E, Feld E, Ye F, Zhao S, Johnpulle R et al ( 2017) Sequencing treatment in BRAFV600 mutant melanoma: anti‐PD‐1 before and after BRAF Inhibition. J Immunother 40, 31–35. [DOI] [PMC free article] [PubMed] [Google Scholar]
- Juszczynski P, Ouyang J, Monti S, Rodig SJ, Takeyama K, Abramson J et al ( 2007) The AP1‐dependent secretion of galectin‐1 by reed sternberg cells fosters immune privilege in classical Hodgkin lymphoma. Proc Natl Acad Sci USA 104, 13134–13139. [DOI] [PMC free article] [PubMed] [Google Scholar]
- Juszczynski P, Chen L, O’Donnell E, Polo JM, Ranuncolo SM, Dalla‐Favera R et al ( 2009) BCL6 modulates tonic BCR signaling in diffuse large B‐cell lymphomas by repressing the SYK phosphatase, PTPROt. Blood 114, 5315–5321. [DOI] [PMC free article] [PubMed] [Google Scholar]
- Juszczynski P, Rodig SJ, Ouyang J, O'Donnell E, Takeyama K et al ( 2010) MLL‐rearranged B lymphoblastic leukemias selectively express the immunoregulatory carbohydrate‐binding protein galectin‐1. Clin Cancer Res 16, 2122–2130. [DOI] [PMC free article] [PubMed] [Google Scholar]
- Kamper P, Ludvigsen M, Bendix K, Hamilton‐Dutoit S, Rabinovich GA, Møller MB et al ( 2011) Proteomic analysis identifies galectin‐1 as a predictive biomarker for relapsed/refractory disease in classical Hodgkin lymphoma. Blood 117, 6638–6649. [DOI] [PubMed] [Google Scholar]
- Keir ME, Butte MJ, Freeman GJ and Sharpe AH ( 2008) PD‐1 and its ligands in tolerance and immunity. Annu Rev Immunol 26, 677–704. [DOI] [PMC free article] [PubMed] [Google Scholar]
- Khalili JS, Liu S, Rodríguez‐Cruz TG, Whittington M, Wardell S, Liu C et al ( 2012) Oncogenic BRAF(V600E) promotes stromal cell‐mediated immunosuppression via induction of interleukin‐1 in melanoma. Clin Cancer Res 18, 5329–5340. [DOI] [PMC free article] [PubMed] [Google Scholar]
- Li N, McLaren JE, Michael DR, Clement M, Fielding CA and Ramji DP ( 2010) ERK Is integral to the IFN‐mediated activation of STAT1, the expression of key genes implicated in atherosclerosis, and the uptake of modified lipoproteins by human macrophages. J Immunol 185, 30413–30418. [DOI] [PubMed] [Google Scholar]
- Long L, Zhang X, Chen F, Pan Q, Phiphatwatchara P, Zeng Y and Chen H ( 2018) The promising immune checkpoint LAG‐3: from tumor microenvironment to cancer immunotherapy. Genes Cancer 9, 176–189. [DOI] [PMC free article] [PubMed] [Google Scholar]
- Oble DA, Loewe R, Yu P and Mihm MC ( 2009) Focus on TILs: Prognostic significance of tumor infiltrating lymphocytes in human melanoma. Cancer Immun 9, 3. [PMC free article] [PubMed] [Google Scholar]
- Ouyang J, Juszczynski P, Rodig SJ, Green MR, O’Donnell E, Currie T et al ( 2011) Viral induction and targeted inhibition of galectin‐1 in EBV + posttransplant lymphoproliferative disorders. Blood 117, 4315–4322. [DOI] [PubMed] [Google Scholar]
- Ouyang J, Plütschow A, Von Strandmann EP, Reiners KS, Ponader S, Rabinovich GA et al ( 2013) Galectin‐1 serum levels reflect tumor burden and adverse clinical features in classical Hodgkin lymphoma. Blood 121, 3431–3433. [DOI] [PubMed] [Google Scholar]
- Pardoll DM ( 2012) The blockade of immune checkpoints in cancer immunotherapy. Nat Rev Cancer 12, 252–264. [DOI] [PMC free article] [PubMed] [Google Scholar]
- Pause A, Belsham GJ, Gingras AC, Donzé O, Lin TA, Lawrence JC and Sonenberg N ( 1994) Insulin‐dependent stimulation of protein synthesis by phosphorylation of a regulator of 5′‐cap function. Nature 371, 762–767. [DOI] [PubMed] [Google Scholar]
- Peterson RT and Schreiber SL ( 1998) Translation control: connecting mitogens and the ribosome. Curr Biol. 8, R248–250. [DOI] [PubMed] [Google Scholar]
- Polak A, Kiliszek P, Sewastianik T, Szydłowski M, Jabłońska E, Białopiotrowicz E et al ( 2016) MEK inhibition sensitizes precursor B‐cell acute lymphoblastic leukemia (B‐ALL) cells to dexamethasone through modulation of mTOR activity and stimulation of autophagy. PLoS ONE 11, e0155893. [DOI] [PMC free article] [PubMed] [Google Scholar]
- Pritchard AL and Hayward NK ( 2013) Molecular pathways: Mitogen‐activated protein kinase pathway mutations and drug resistance. Clin Cancer Res 19, 2301–2309. [DOI] [PubMed] [Google Scholar]
- Rabinovich GA and Toscano MA ( 2009) Turning “sweet” on immunity: Galectin‐glycan interactions in immune tolerance and inflammation. Nat Rev Immunol 9, 338–352. [DOI] [PubMed] [Google Scholar]
- Ribas A ( 2015) Adaptive immune resistance: How cancer protects from immune attack. Cancer Discov 5, 915–919. [DOI] [PMC free article] [PubMed] [Google Scholar]
- Robert C, Long GV, Brady B, Dutriaux C, Maio M, Mortier L et al ( 2015) Nivolumab in previously untreated melanoma without BRAF mutation. N Engl J Med 372, 320–330. [DOI] [PubMed] [Google Scholar]
- Rodig SJ, Ouyang J, Juszczynski P, Currie T, Law K, Neuberg DS et al ( 2008) AP1‐dependent galectin‐1 expression delineates classical hodgkin and anaplastic large cell lymphomas from other lymphoid malignancies with shared molecular features. Clin Cancer Res 14, 3338–33344. [DOI] [PubMed] [Google Scholar]
- Romeo Y, Moreau J, Zindy PJ, Saba‐El‐Leil M, Lavoie G, Dandachi F et al ( 2013) RSK regulates activated BRAF signalling to mTORC1 and promotes melanoma growth. Oncogene 32, 2917–2926. [DOI] [PMC free article] [PubMed] [Google Scholar]
- Rubinstein N, Alvarez M, Zwirner NW, Toscano MA, Ilarregui JM, Bravo A et al ( 2004) Targeted inhibition of galectin‐1 gene expression in tumor cells results in heightened T cell‐mediated rejection: a potential mechanism of tumor‐immune privilege. Cancer Cell 5, 241–251. [DOI] [PubMed] [Google Scholar]
- Sakuishi K, Apetoh L, Sullivan JM, Blazar BR, Kuchroo VK and Anderson AC ( 2010) Targeting Tim‐3 and PD‐1 pathways to reverse T cell exhaustion and restore anti‐tumor immunity. J Exp Med 27, 2187–2194. [DOI] [PMC free article] [PubMed] [Google Scholar]
- Sewastianik T, Szydlowski M, Jablonska E, Bialopiotrowicz E, Kiliszek P, Gorniak P et al ( 2016) FOXO1 is a TXN‐and p300‐dependent sensor and effector of oxidative stress in diffuse large B‐cell lymphomas characterized by increased oxidative metabolism. Oncogene 35, 5989–6000. [DOI] [PubMed] [Google Scholar]
- Shannan B, Watters A, Chen Q, Mollin S, Dörr M, Meggers E et al ( 2016) PIM kinases as therapeutic targets against advanced melanoma. Oncotarget 7, 54897–54912. [DOI] [PMC free article] [PubMed] [Google Scholar]
- Simeone E, Grimaldi AM, Festino L, Giannarelli D, Vanella V, Palla M et al ( 2017) Correlation between previous treatment with BRAF inhibitors and clinical response to pembrolizumab in patients with advanced melanoma. Oncoimmunology 6, e1283462. [DOI] [PMC free article] [PubMed] [Google Scholar]
- Szydłowski M, Prochorec‐Sobieszek M, Szumera‐Ciećkiewicz A, Derezińska E, Hoser G, Wasilewska D et al ( 2017) Expression of PIM kinases in Reed‐Sternberg cells fosters immune privilege and tumor cell survival in Hodgkin lymphoma. Blood 130, 1418–1429. [DOI] [PubMed] [Google Scholar]
- Tang D, Yuan Z, Xue X, Lu Z, Zhang Y, Wang H et al ( 2012) High expression of Galectin‐1 in pancreatic stellate cells plays a role in the development and maintenance of an immunosuppressive microenvironment in pancreatic cancer. Int J Cancer 130, 2337–2348. [DOI] [PubMed] [Google Scholar]
- Toscano MA, Bianco GA, Ilarregui JM, Croci DO, Correale J, Hernandez JD et al ( 2007) Differential glycosylation of TH1, TH2 and TH‐17 effector cells selectively regulates susceptibility to cell death. Nat Immunol 8, 825–834. [DOI] [PubMed] [Google Scholar]
- Toscano MA, Campagna L, Molinero LL, Cerliani JP, Croci DO, Ilarregui JM et al ( 2011) Nuclear factor (NF) – kB controls expression of the Immunoregulatory glycan‐binding protein galectin‐1. Mol Immunol 48, 1940–1949. [DOI] [PubMed] [Google Scholar]
- Tsao H, Chin L, Garraway LA and Fisher DE ( 2012) Melanoma: from mutations to medicine. Genes Dev 26, 1131–1155. [DOI] [PMC free article] [PubMed] [Google Scholar]
- Weber JS, D’Angelo SP, Minor D, Hodi FS, Gutzmer R, Neyns B et al ( 2015) Nivolumab versus chemotherapy in patients with advanced melanoma who progressed after anti‐CTLA‐4 treatment (CheckMate 037): a randomised, controlled, open‐label, phase 3 trial. Lancet Oncol 16, 375–384. [DOI] [PubMed] [Google Scholar]
- Wessel D and Flügge UI ( 1984) A method for the quantitative recovery of protein in dilute solution in the presence of detergents and lipids. Anal Biochem 138, 141–143. [DOI] [PubMed] [Google Scholar]
- Wong PF, Wei W, Smithy JW, Acs B, Toki MI, Blenman KRM et al ( 2019) Multiplex quantitative analysis of tumor‐infiltrating lymphocytes and immunotherapy outcome in metastatic melanoma. Clin Cancer Res 25, 2442–2449. [DOI] [PMC free article] [PubMed] [Google Scholar]
- Zeng K, Wang Z, Ohshima K, Liu Y, Zhang W, Wang L et al ( 2016) BRAF V600E mutation correlates with suppressive tumor immune microenvironment and reduced disease‐free survival in Langerhans cell histiocytosis. Oncoimmunology. 5, e1185582. [DOI] [PMC free article] [PubMed] [Google Scholar]
- Xu‐Yun Z, Ting‐Ting C, Li X, Meng G, Ying X et al ( 2010) Hypoxia inducible factor‐1 mediates expression of galectin‐1: the potential role in migration/invasion of colorectal cancer cells. Carcinogenesis 31, 1367–1375. [DOI] [PubMed] [Google Scholar]
Associated Data
This section collects any data citations, data availability statements, or supplementary materials included in this article.
Supplementary Materials
Methods S1. Phospho‐specific flow cytometry; Jurkat T cell activation assay.
Table S1. Primers used in gene expression analysis and plasmid generation.
Table S2. Antibodies used in WB and Flow cytometry.
Table S3. Melanoma patients enrolled in the study and their follow up. Corresponding Gal‐1 concentrations are indicated in Figure 6.
Table S4. (a‐d) Densitometric quantification of band intensities.
Fig. S1. PD‐L1 expression after 24 h incubation with cobimetinib or trametinib alone and in combination with IFN‐γ.
Fig. S2. ERK phosphorylation after 24 h incubation with vemurafenib in A375, MEL5 and MEL28 melanoma cell lines, analyzed by flow cytometry.
Fig. S3. Expression of CD25 and CD69 activation markers in Jurkat T cells after 24h coculture with A375 cells, pretreated with IFN‐γ alone or IFN‐γ in combination with vemurafenib for 24h.
Fig. S4. Relative Gal‐1 mRNA (A) and protein (B) expression in A375 and MEL28 melanoma cell lines after 24h incubation with vemurafenib.