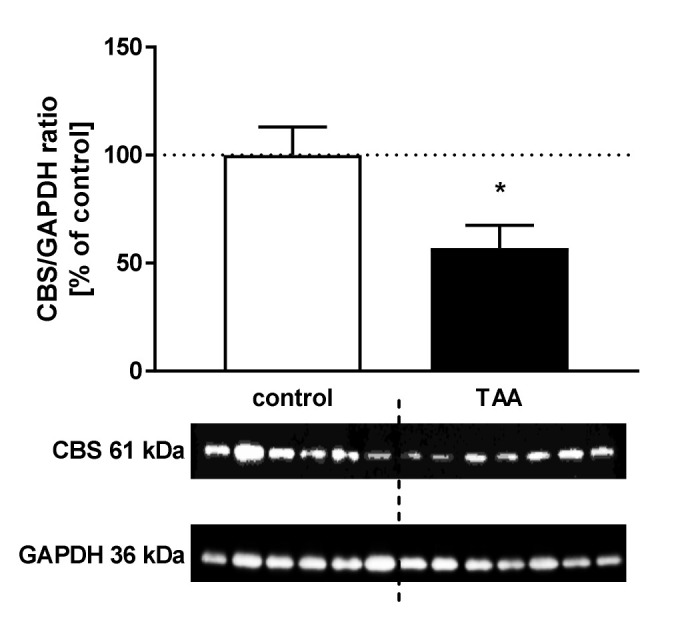
Figure 4.

The relative protein level and representative immunoblot of cystathionine β-synthase (CBS) (61 kDa) in the cerebral cortex of control and TAA rats. The graph represents data normalized to GAPDH (36 kDa) and expressed as a percentage of control. Data are reported as mean ± SEM, n = 3–6. * p < 0.05 compared with control.
