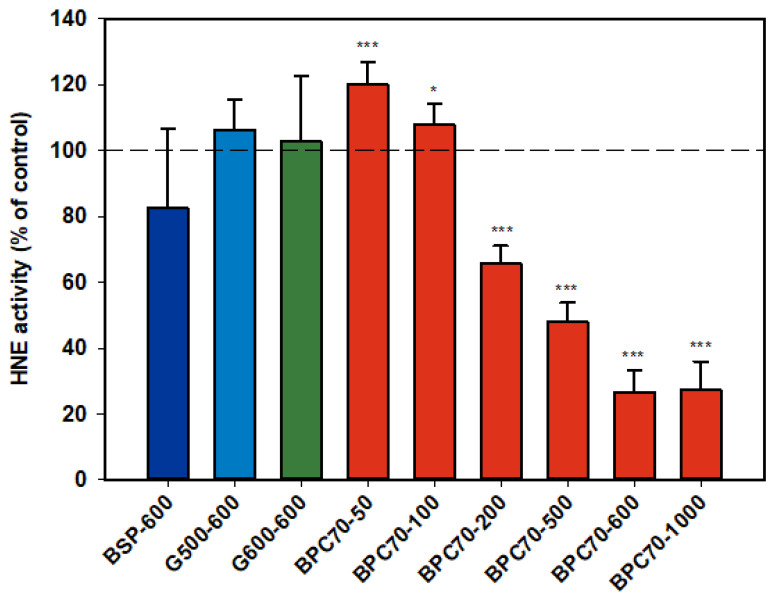
Figure 6.
Human neutrophil elastase responses relative to the control. Values are means and SD (represented by error bars). Different bar colours refer to different ingredients as indicated on the bottom axis (as described in Methods section and Table 1), with the last set of digits on each label indicating the ingredient dose (µg/mL). Values represent either the means from one experiment with triplicate measurement, or the pooled means from 2 independent experiments with triplicate measurement. Significance relative to control, * p < 0.05; *** p ≤ 0.001.

