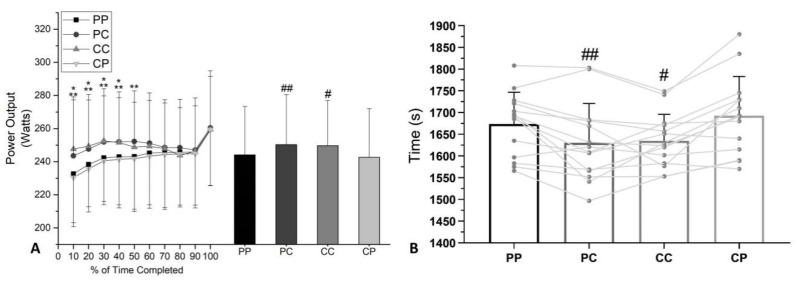
Figure 3.
Mean (±SD). Curve values and the average of performance parameters during TT performance: (A) Power output and (B) time of simulated cycling TT performance. * Significant difference to CC from CP (p < 0.05). ** Significant difference to PC from PP (p < 0.05). # Significant difference from CP (p < 0.05). ## Significant difference from PP (p < 0.05).

