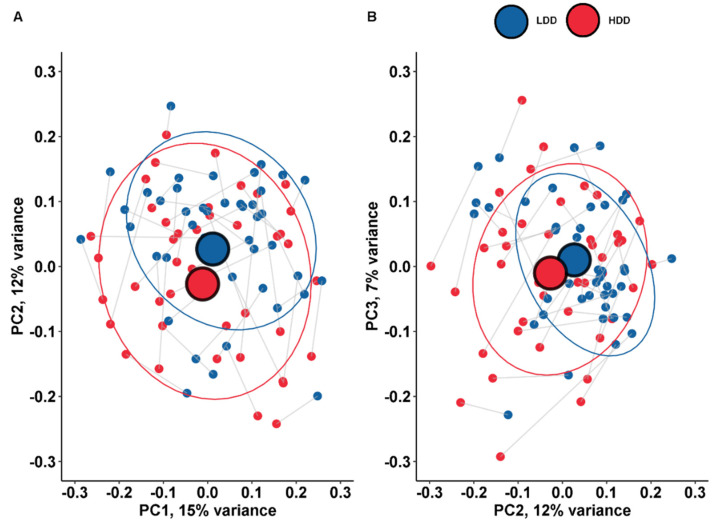
Figure 1.
Principle coordinate analysis on the species level. The lines represent the intra-individual link of participants. This graph represents the difference between the low-dairy diet (LDD) and the high-dairy-diet (HDD) on the species level (n = 46). (A) PC1 and PC2 were not significantly different during the HDD and the LDD (p = 0.49 and p = 0.06). PC1 explained 15% of the total variance and PC2 explained 12% of variance. (B) PC2 and PC3 were not significantly different during the HDD and the LDD (p = 0.06 and p = 0.40). PC3 explained 7% of variance.

